Article

How Does the Control of Grain Purchase Price Affect the Sustainability of the National Grain Industry? One Empirical Study from China

1
School of Economics and Management, Shanghai University of Political Science and Law, Shanghai 201701, China
2
College of Engineering Science and Technology, Shanghai Ocean University, Shanghai 201306, China
3
Business School, University of Shanghai for Science and Technology, Shanghai 200093, China
4
School of Finance, Shanghai University of Finance and Economics, Shanghai 200433, China
5
Guizhou Key Laboratory of Big Data Statistics Analysis, Guizhou University of Finance and Economics, Guiyang 550025, China
6
School of Information Management and Engineering, Fintech Research Institute, Shanghai University of Finance and Economics, Shanghai 200433, China
*
Authors to whom correspondence should be addressed.
All the authors contributed equally to this work.
Sustainability 2020, 12(5), 2102; https://doi.org/10.3390/su12052102
Submission received: 13 January 2020 / Revised: 28 February 2020 / Accepted: 6 March 2020 / Published: 9 March 2020

Abstract

:
As one of the most important grain protection policies in China, the minimum purchase price policy prevents the fluctuation of grain output and protects the interests of farmers by regulating the prices of major grain varieties. For developing countries with a shortage of agricultural resources, represented by China, an in-depth study on the implementation effect and public satisfaction of this policy is of great significance for promoting the sustainable development of the grain industry. Based on the interest demands of the government, farmers, grain enterprises and consumers, this paper constructs a policy satisfaction evaluation model based on the Analytic Hierarchy Process and Fuzzy Comprehensive Evaluation. The research shows that the implementation effect of this policy has promoted the sustainable development of China’s grain in four aspects: improving farmers’ enthusiasm for planting, optimizing the structure of supply and demand, reducing the adverse impact of disasters, and ensuring the steady increase of output. However, due to the differences in natural resources and folk customs, the implementation effect of this policy varies in different regions.

1. Introduction

Grain is the basis for the survival and development of human society, and its irreplaceable characteristic determines that grain is not only a strategic supply to maintain social harmony and stability, but also an important factor to promote national economic prosperity. Although the total global grain output has maintained a steady growth at present, due to differences in the level of productivity, the distribution of natural resources and the growth rate of the population in various countries, problems of periodic and regional grain shortages in the world are still prominent [1]. The Food and Agriculture Organization of the United Nations (FAO) and other international organizations jointly wrote the report “The state of food security and nutrition in the world 2019”. The report shows that, in the face of volatile regional conflicts, severe weather events and the global financial crisis, the world’s hungry population has increased for the third consecutive year, with an estimated 820 million people worldwide without enough food in 2018 [2]. A study on the development of the grain industry in 140 countries shows that global grain security is still at great risk of uncertainty [3].
The phenomenon of grain shortage is likely to cause grain price fluctuation, which will lead to an economic downturn and will even endanger social stability [4]. Therefore, only on the basis of sustainable grain growth can countries promote overall economic and social development in the context of limited agricultural resources and sudden natural disasters [5]. In order to promote the continuous equilibrium of grain supply and demand, many countries and regions give priority to supporting grain prices [6]. For example, America has the fixed direct payment policy and the counter-cyclical payment policy. The fixed direct payment policy refers to the determination of specific subsidy amounts based on the criteria stipulated by government legislation. The counter-cyclical payment policy belongs to the grain protection policy, and its subsidy amounts are related to the current year’s grain prices [7]. The grain price policy system of the European Union is quite different from that of the United States. Grain price policies of the European Union focus more on how to deal with the relationship between the market price and intervention price. Typical policies include intervention price policy and target price policy [8]. Japanese grain subsidy policies mainly include the price support policy, the direct subsidy policy and the grain insurance policy [9]. Due to the different scope of formulation and implementation, the Japanese government has carried out a reasonable combination among various policies. Although the grain price policies of various countries have been formed in different periods, it is undeniable that every policy has played an important role in promoting the healthy development of the domestic grain industry.
In addition to governments, many scholars have also made outstanding research contributions in the field of grain policies. Anderson et al. [10] thought that a reasonable policy intervention was conducive to slowing down the volatility of domestic agricultural product prices relative to the international market. Hansen [11] compared the welfare surplus of the two policies of protection price and target price, and found that the policy of protection price promoted the increase of producer surplus and the decrease of consumer surplus, and that both producer surplus and consumer surplus would increase under the target price system. Marina et al. [12] proved that financial support from the agricultural sector could guarantee the healthy development of the grain industry in Sub-Saharan Africa. Duangbootsee et al. [13] studied the price support policy and deficiency payment policy of rice in Thailand, and found that the deficiency payment policy was more conducive to increasing producer surplus and reducing the net loss of total welfare. Liang et al. [14] thought that providing subsidies based on market prices was conducive to avoiding market risks and increasing grain output. Ali et al. [15] found that the minimum support price policy for rice in India promoted rice output and improved production efficiency, but the policy effect in different planting regions varied greatly. Rashid et al. [16] compared the agricultural subsidy policies of some African and Asian countries, and they found that the transfer payment policy was conducive to the improvement of agricultural production efficiency.
The main directions of research on grain prices include not only policy assessments but also price fluctuation factors and financial support projects. For example, by using trigonometric and sawtooth models, Gilbert et al. [17] systematically analyzed the seasonal price difference in 193 markets of 13 grains in seven African countries. This study demonstrated that, among the major African crops, the seasonal price difference of maize was the highest (33% on average) and that of the rice was the lowest (16% on average). Benfica et al. [18] assessed the relationship between agricultural productivity and market participation following market prices in Mozambique. Their results showed that the market participation rate and intensity promoted the increase of the grain price and that the price increase further led to the rise of grain production. Morea et al. [19] proposed a public–private partnership business model for the sustainable development of modern agricultural projects in Sub-Saharan Africa. By means of financial and technical cooperation among the project authority, the commercial farmers and the processing industrialists, the effective balance between grain output and investment income could be realized. Reeves et al. [20] took data from 21 European Union countries as examples to prove that food price inflation and wage stagnation would lead to food scarcity, especially in poor areas. They also proved that food scarcity can be alleviated through generous welfare projects. Although the above studies analyzed the grain industry in various regions of the world from different perspectives, without exception they emphasized the far-reaching significance of the long-term healthy development of grain for national economic prosperity and social stability.
When we look back at the development of China’s grain industry around the 20th century, we can find a common phenomenon: the increase and decrease of grain output alternated for several years. In addition to external factors such as changes in natural conditions, the main reason for this phenomenon is the inverse relation between grain output and grain price [18]. Years of bumper harvests are likely to cause a drop in grain prices, which will hurt farmers’ profits and reduce their enthusiasm to grow grain, leading to the next year of production cuts. Over time, the alternation of good harvest years and bad harvest years was formed [21]. In order to prevent the fluctuation of grain output and protect the interests of farmers, China implements the minimum purchase price policy (hereinafter referred to as MPP policy) in major grain-producing areas, and announces the minimum purchase price for key grain varieties in advance every year. During the MPP policy implementation period (grain harvest period, generally within 2–5 months), when the actual purchase price of grain in the market is lower than the minimum purchase price determined by the state, the state entrusts grain enterprises that meet certain qualifications to purchase grain at the policy price [22], so as to protect farmers’ planting income and promote farmers’ planting enthusiasm.
Because the effective supply of grain is based on the premise of keeping farmers’ planting enthusiasm, the long-term healthy development of the grain industry can be realized only when the grain supply keeps increasing steadily. Therefore, the MPP policy is an important method to ensure the sustainable development of grain in China. China began to implement the MPP policy plan in 2004, and it has been officially implemented since 2005. During this period, China’s grain industry mainly faced four severe challenges [23,24]. First, the distribution of water resources in China is very uneven, and per capita water resources are very small, leading to water shortage in some grain-producing areas. Second, China’s cultivated land resources are scarce, and there are problems of high-quality cultivated land scarcity and cultivated resources shortage. Third, the excessive use of fertilizers and pesticides has led to environmental pollution in the cultivated areas. Fourth, because young and middle-aged people from rural areas flood into cities in search of higher incomes, the rural population is dominated by the elderly who cannot afford to plant grain. China has adjusted the minimum purchase price several times to promote the development of the grain industry, so it is necessary to further consider whether the implementation effect of the MPP policy can optimize the industrial structure and promote resource conservation.
Studies about the MPP policy mainly focus on the implementation effect [25,26]. Zhang et al. [27] established a grain farmers’ supply response model based on the theory of farmers’ supply behavior and price expectation. Its empirical analysis reflected that the MPP policy had a significant positive impact on the grain supply of farmers in major grain-producing areas. In another study, impacts of the MPP policy on the cultivated areas were analyzed based on a mixed linear model, and its results proved that this policy significantly stimulated the increase of rice-cultivated areas in Hubei Province, China [28]. Based on the influence of the minimum purchase price for performance assessment, legal questions and market pricing, Yan et al. [29] established an evaluation model to analyze the MPP policy implementation mechanism. Gale [30] studied the evolution process of China’s agricultural price policies and evaluated the impact of the MPP policy on agricultural production. He pointed out that the rise of non-agricultural wages weakened the motivation of agricultural production.
Through the analysis of existing studies on the MPP policy, it is found that comparing the change of grain-cultivated areas before and after the policy implementation is the most commonly used standard to measure the implementation effect of the MPP policy, because the cultivated area is the key factor determining the grain output [31]. However, there are many natural and human factors affecting the area of grain cultivation [32], so it is unfair to evaluate the MPP policy effect from this standard only. At the same time, most studies on MPP policy only consider the government and farmers. In practice, the implementation effect of the MPP policy is not only related to the macro-control of the government [33] and the response degree of farmers [34], but also closely related to the operation measures of grain enterprises [35] and the purchase demand of consumers [36]. The MPP policy can be understood as adjusting the grain purchase price to change the interest relationship between different groups behind the price, so as to balance the supply side and the demand side in the new benefit distribution pattern. Therefore, in order to objectively and accurately evaluate the implementation effect of the MPP policy and its impact on the sustainable development of Chinese grain, it is necessary to comprehensively consider the demands of the government, farmers, grain enterprises and consumers. At the same time, it is also necessary to combine important standards such as the grain acquisition cost and urban-rural income gap with the grain-cultivated area.
The rest of this paper is organized as follows: In Chapter 2, the relevant data sources of this paper are firstly introduced, then the MPP policy satisfaction evaluation model composed of the Fuzzy Comprehensive Evaluation (FCE) and Analytic Hierarchy Process (AHP) is constructed, and finally the concepts of the FCE and the AHP are introduced. In Chapter 3, on the basis of determining the membership function and weight of each evaluation index, the implementation effect of the MPP policy and its impact on grain sustainable development are comprehensively analyzed from three aspects: a comparison before and after policy implementation, a satisfaction trend analysis and the disaster response. In Chapter 4, the main conclusions of this paper are summarized, the corresponding policy suggestions are put forward and future research is prospected.

2. Materials and Methods

2.1. Data Sources

The data sources of this paper are from four of China’s official websites: State Administration of Grain, National Bureau of Statistics, National Food and Strategic Reserves Administration, and National Development and Reform Commission. Table 1 shows the minimum purchase price of major grains in China from 2004 to 2019. Compared with the first implementation of the minimum purchase prices, the minimum purchase prices of the four grain varieties announced by the National Development and Reform Commission increased by more than 55% in 2019.
Data source: notices of the minimum purchase price of wheat and rice issued by National Development and Reform Commission over the years. Wheat, middle and late indica rice, early indica rice and japonica rice are all third grade.
According to the grain minimum purchase prices over the years, the key grain varieties in China are wheat and rice [37] (early indica rice, middle and late indica rice, japonica rice). The main wheat planting regions are six provinces: Hebei, Jiangsu, Anhui, Shandong, Henan and Hubei [38]. The main rice-planting regions are 11 provinces: Anhui, Jiangxi, Hubei, Hunan, Guangxi, Liaoning, Jilin, Heilongjiang, Jiangsu, Sichuan and Henan [39]. Therefore, this paper selects 13 major grain-growing provinces as research objects, including Hebei, Jiangsu, Anhui, Shandong, Henan, Hubei, Jiangxi, Hunan, Guangxi, Liaoning, Jilin, Heilongjiang and Sichuan.
The data collected in this paper are listed as follows:
  • The minimum purchase prices of early indica rice (third class), middle and late indica rice (third class), japonica rice and wheat in China from 2004 to 2019.
  • The average market purchase prices of wheat and rice in China’s 13 major grain-growing provinces from 1995 to 2018.
  • The per unit yield of wheat and rice in China’s 13 major grain-growing provinces from 2002 to 2018.
  • The cultivated area of wheat and rice in China’s 13 major grain-growing provinces from 1995 to 2018.
  • China’s grain imports and exports from 2002 to 2018.
  • The number of agricultural workers in China’s 13 major grain-growing provinces from 2002 to 2018.
  • The urban–rural income gap in China’s 13 major grain-growing provinces from 2002 to 2018.
  • The average schooling year of the rural household labor force in China’s 13 major grain-growing provinces from 2002 to 2018.

2.2. Methods

2.2.1. Model Design

This paper combines the AHP and the FCE to establish the MPP policy satisfaction evaluation model. The overall modeling architecture is shown in Figure 1, in which the AHP is used to determine the index weight of the factor set, and the overall idea of policy satisfaction evaluation follows the FCE. The reason for combining the two methods is firstly because both of them can realize the combination of qualitative and quantitative factors well [40,41], and the AHP can decompose the complex system on the basis of less quantitative data [42]. Second, the FCE can consider the hierarchy of evaluation objects, so the fuzzification of evaluation indexes and influencing factors can be reflected [43]. Third, the FCE needs to determine the weight vector of evaluation indexes, but not all evaluation indexes have corresponding sample values [44], so the AHP is selected to determine the index weight.
There are four reasons to measure the effect of the MPP policy on grain sustainable development by constructing a satisfaction model. First, the government’s satisfaction directly reflects whether the government has made a reasonable financial expenditure to promote the healthy development of the grain industry. Second, farmers’ satisfaction directly determines their enthusiasm for planting, and only a higher enthusiasm for planting can ensure the sustainable supply of grain. Third, enterprises are the main buyers of grain, so the satisfaction of enterprises directly determines the feasibility of long-term cooperation and the persistence of the MPP policy. Fourth, consumers’ satisfaction directly reflects the rationality of the relationship between grain supply and demand, and only a reasonable relationship between supply and demand can ensure the sustainability of the grain industry. Table 2 shows the satisfaction evaluation indexes of the four groups.

2.2.2. Fuzzy Comprehensive Evaluation

The concept of fuzzy set theory was first proposed by professor Zadeh, an American expert on automatic control, in 1965 to express the uncertainty of things [45]. The Fuzzy Comprehensive Evaluation (FCE) is a method based on fuzzy mathematics, which has good economic and social benefits. This method applies the principle of fuzzy relation synthesis and comprehensively evaluates the subordinate status of the things from multiple factors [46]. The steps of the FCE are shown below [47]:
  • The factor set
The performance of evaluation objects needs to be comprehensively analyzed from multiple factors, all of which constitute the set of the evaluation index system, namely, factor set U, denoted in Equation (1):
U = { u 1 , u 2 , , u m }
2.
The comment set
Due to the diverse evaluation values of each index, different grades are often formed. The set composed of various decision sets is called comment set V, denoted in Equation (2):
V = { v 1 , v 2 , , v m }
3.
The fuzzy weight set
In the actual situation, each factor in the factor set plays a different role in the comprehensive evaluation. The comprehensive evaluation results are not only related to the evaluation of each factor, but also depend on the role of each factor in the comprehensive evaluation. Thus, it is important to determine the weight distribution among factors to obtain the fuzzy weight set A, which is a fuzzy vector on U and is found as in Equation (3):
A = { a 1 , a 2 , , a n }
a i represents the weight of the ith factor and satisfies i = 1 n a i = 1 . There are many methods to determine the weight, such as the Delphi method, weighted average method, expert evaluation method and so on.
4.
The fuzzy comprehensive judgment matrix
The membership degree of the index u i to each comment is a fuzzy subset of V. The evaluation of index u i is computed as shown in Equation (4):
R I = { r i 1 , r i 2 , , r i m }
The fuzzy comprehensive judgment matrix of each index can be obtained via Equation (5), which is a fuzzy relation matrix from U to V:
R = [ r 11 r 12 r 1 m r 21 r 22 r 2 m r n 1 r n 2 r n m ]
5.
Comprehensive evaluation
A fuzzy transformation can be obtained by using the fuzzy comprehensive judgment matrix R, as shown in Equation (6):
T R : F ( U ) F ( V )
From this transformation, the comprehensive evaluation result B = A R can be obtained. The evaluation after synthesis can be regarded as the fuzzy vector of V, denoted as B = [ b 1 , b 2 , , b m ] .

2.2.3. Analytic Hierarchy Process

American operations research scientist Saaty put forward the famous Analytic Hierarchy Process (AHP) in the early 1970s [48]. The AHP decomposes the elements related to decision-making into target layer, criterion layer and scheme layer. Then, a qualitative and quantitative analysis is carried out [49]. This method has advantages of flexibility and conciseness. The specific steps of the methodology applied in this paper are as follows [50]:
1.
Constructing the pairwise comparison matrix
From the second layer of the hierarchical model to the lowest layer, pairwise comparisons were made for each factor in the same layer based on the preference scale. For example, to compare the influences of n factors c 1 , c 2 , , c n at a certain layer on one factor at the upper layer, two factors c i and c j are taken at a time, and a i j is used to represent the influence ratio of c i and c j on the target layer. All comparison results can be constructed into the pairwise comparison matrix A, which is shown in Equation (7):
A = ( a i j ) n × n , a i j > 0 , a i j = 1 a j i
the relative scale a i j can be determined according to the preference scale, as shown in Table 3.
2.
Sorting single hierarchy and consistency check
Because the pairwise comparison matrix is usually not a uniform matrix, it is necessary to check its consistency. In this paper, the numerical value of λ n is used to measure the inconsistency degree of the pairwise comparison matrix A, where λ is the maximum characteristic root of the paired comparison matrix. CI is the general consistency index and is computed as shown in Equation (8):
C I = λ n n 1
In order to determine the tolerance range of the inconsistency degree of the pairwise comparison matrix A, a random consistency index RI can be introduced, whose values are shown in Table 4.
For the established hierarchical model, it is necessary to calculate the ratio of its consistency index CI and the random consistency index RI of the same hierarchy, namely the consistency ratio, as shown in Equation (9):
C R = C I R I
When CR < 0.1, the eigenvector of the pairwise comparison matrix obtained by the characteristic root method can be used as the weight vector.
3.
Sorting total hierarchy and consistency check
The composite weight of each layer of factors to the overall target is calculated. According to the weight vector of the pairwise comparison matrix, the final weight vector can be obtained by using Equation (10). At the same time, the consistency check is carried out for the total ordering of the hierarchy.
W = W B i W A ( i ) i = 1 n W B i W A ( i )

3. Results

3.1. Membership Function

In this section, while determining the membership function of each index in the MPP policy satisfaction evaluation model, the selection reasons of each index and the calculation methods of related variables are explained. Because of the uneven distribution of natural resources in China, not all provinces rely on grain as the main plant. This paper selects 13 major grain growing provinces in China to represent the grain situation of the whole country, including Hebei, Jiangsu, Anhui, Shandong, Henan, Hubei, Jiangxi, Hunan, Guangxi, Liaoning, Jilin, Heilongjiang and Sichuan. In addition, wheat and rice are the main grain varieties in China, so these two crops are selected to represent the grain varieties in the country.

3.1.1. The Government

1.
Satisfaction of cultivated area
The increase of grain-cultivated areas reflects the improvement of farmers’ planting enthusiasm, and the increase of planting income can promote the improvement of farmers’ planting enthusiasm. Therefore, this index can be used to measure the effect of the MPP policy in protecting farmers’ income. Suppose the change rate of the cultivated area is x L D , the grain-cultivated area of the previous year is x L r and the grain-cultivated area of the current year is x L a . The change rate of the cultivated area x L D is constructed as shown in Equation (11):
x L D = x L a x L r x L a
In Equation (11), The grain-cultivated area refers to the total area of wheat and rice planted in 13 provinces.
The change rate of the cultivated area x L D is converted into the satisfaction of the cultivated area x S L D by the subsection function in Equation (12):
x S L D = { 0 x L D 0 0.2 0 < x L D 0.01 0.5 0.01 < x L D 0.02 0.8 0.02 < x L D 0.05 1 0.05 < x L D
2.
Satisfaction of grain reserves
Because grain reserves can reflect the grain output, this index can be used to measure the effect of the MPP policy in protecting the grain supply. Let the satisfaction of grain reserves be x Y C , and the grain reserves of each province be x C L i . The calculation formula of x Y C is shown in Equation (13):
x Y C = i = 1 13 f ( x C L i ) 13 f ( x C L i ) = { 0         x C L i > x C L m a x x C L m a x x C L i x C L i     x C L m i d . i < x C L i x C L m a x x C L i x C L m i n x C L m i n     x C L m i n < x C L i x C L m i d . i 0         x C L i < x C L m i n
In Equation (13), i = 1 , 2 , , 13 , the grain reserves refer to reserves of rice and wheat. Grain reserves need to be maintained in a reasonable state, too many or too few reserves are not conducive to the sustainable development of the grain industry [51]. Set the most reasonable grain reserve of each province as x C L m i d . i , set x C L m i n as the threshold of 0 for the satisfaction of grain reserves when grain reserves are small, and set x C L m a x as the threshold of 0 for the satisfaction of grain reserves when the grain inventory is large.
Take calculating the satisfaction of grain reserves x Y C in 2004 as an example. x C L m i d . i of each province refers to the grain reserve threshold set by the government for that province in 2004, x C L m i n is the minimum grain reserve threshold in 13 provinces in 2004, x C L m a x is the maximum grain reserve threshold in 13 provinces in 2004 and x C L i of each province is the actual grain reserves of that province in 2004. According to Equation (13), the average grain reserves satisfaction of the 13 provinces is x Y C in 2004.
3.
Satisfaction of acquisition cost
Because the acquisition cost of grain is the most important expenditure of policy implementation, this index can be used to measure the reasonable degree of the MPP policy in terms of financial distribution. Let the grain acquisition cost of each province be x K P i and the satisfaction of the acquisition cost be x S K P . The calculation formula of x S K P is shown in Equation (14):
x S K P = i = 1 13 f ( x K P i ) 13 f ( x k P i ) = { 0   x K P i > x K P m a x x K P m a x x k p i x K P m a x     x K P m i n < x K P i x K P m a x 1   x K P i x K P m i n
In Equation (14), i = 1 , 2 , , 13 , the grain acquisition cost refers to the acquisition cost of rice and wheat. Set x K P m i n as the threshold of 1 for the satisfaction of the acquisition cost when the acquisition cost is small, and set x K P m a x as the threshold of 0 for the satisfaction of the acquisition cost when the acquisition cost is large.
Take calculating the satisfaction of the acquisition cost x S K P in 2004 as an example. x K P i of each province is the actual acquisition cost of that province in 2004, x K P m i n is the minimum actual acquisition cost of 13 provinces in 2004 and x K P m a x is the maximum actual acquisition cost of 13 provinces in 2004. According to Equation (14), the average acquisition cost satisfaction of the 13 provinces is x S K P in 2004.

3.1.2. Farmers

1.
Satisfaction of planting income
Because the planting income directly determines the enthusiasm of farmers to continue to grow grain and indirectly determines the grain output the next year, this index can be used to measure the support degree of farmers for the MPP policy. Set the average planting income of each province as x p i and the satisfaction of the planting income as x S P . The calculation formula of x S P is shown in Equation (15):
x S P = i = 1 13 f ( x P i ) 13 f ( x P i ) = { 1         x P i > x P w . i x P i x P m i n x P i     x P m i n < x P i x P w . i 0         x P i x P m i n
In Equation (15), i = 1 , 2 , , 13 , the average planting income refers to the average income from the cultivation of rice and wheat. x p w . i is the average income of villagers in each province from working in cities, and x p m i n is the minimum income that villagers can accept.
Take calculating the satisfaction of the planting income x S P in 2004 as an example. x p w . i is the average income of villagers in each province from working in cities in 2004. x p i is the average income of farmers in each province from planting grain in 2004. x p m i n is the minimum value in the dataset composed of all x p w . i and all x p i in 2004. According to Equation (15), the average planting income satisfaction of the 13 provinces is x S P in 2004.
2.
Satisfaction of educational level
The higher the education level of farmers, the more their understanding of policies and the higher the utilization rate of high-tech farming equipment. Therefore, this index can not only reflect the popularity rate of the MPP policy among farmers, but it can also reflect farmers’ planting efficiency. Let the improvement of farmers’ education level be x F D . Let the farmers’ average schooling year of the previous year in the 13 provinces be x F r , and the farmers’ average schooling year of the current year in the 13 provinces be x F a . The calculation formula of x F D is shown in Equation (16):
x F D = x F a x F r x F a
In Equation (16), the average schooling year = illiterate (semiliterate) ratio × 1 + ratio of primary school level × 6 + ratio of middle school level × 9 + ratio of high school level × 12 + ratio of technical secondary school level × 12 + ratio of junior college level and above × 15.5.
The improvement of farmers’ education level x F D is converted into the satisfaction of the educational level x S F D by the subsection function in Equation (17):
x S F D = { 0 x F D 0 0.2 0 < x F D 0.02 0.5 0.02 < x F D 0.05 0.8 0.05 < x F D 0.1 1 0.1 < x F D
3.
Satisfaction of urban–rural income gap
Because the reduction of the urban–rural income gap will reduce the amount of rural labor transferring to cities, it will ensure that there are enough farmers to plant grain. Meanwhile, the reduction of the income gap means the increase of farmers’ planting income. Therefore, this index can reflect the number and income of farmers under the implementation of the MPP policy. Let the reduction degree of the urban–rural income gap be x S D , let the urban–rural income gap in the previous year be x S r and let the urban–rural income gap in the current year be x S a . The calculation formula of x S D is shown in Equation (18):
x S D = x S r x S a x S r
In Equation (18), the rural–urban income gap refers to the average rural–urban income gap in 13 provinces, and income refers to per capita disposable income.
The reduction degree of the urban–rural income gap x S D is converted into the satisfaction of the urban–rural income gap x S S D by the subsection function in Equation (19):
x S S D = { 0 x S D 0 0.2 0 < x S D 0.02 0.5 0.02 < x S D 0.05 0.8 0.05 < x S D 0.1 1 0.1 < x S D

3.1.3. Grain Enterprises

1.
Satisfaction of acquisition income
One of the preconditions for the implementation of the MPP policy is to balance the interests of both supply and demand. Therefore, this index can reflect the impact of the MPP policy on the interests of grain enterprises. Set the acquisition income in each province as x Y P i and the satisfaction of the acquisition income as x S Y P . The calculation formula of x S Y P is shown in Equation (20):
x S Y P = i = 1 13 f ( x Y P i ) 13 f ( x Y P i ) = { 1         x Y P i x Y P m a x x Y P m a x x Y P i x Y P m a x     x Y P m i n < x Y P i < x Y P m a x 0         x Y P i x Y P m i n
In Equation (20), i = 1 , 2 , , 13 , the acquisition income refers to the acquisition income of wheat and rice. Set x Y P m a x as a threshold of 1 for the acquisition income satisfaction when the acquisition income is large, and set x Y P m i n as a threshold of 0 for the acquisition income satisfaction when the acquisition income is small.
Take calculating the satisfaction of the acquisition income x S Y P in 2004 as an example. x Y P i of each province is the average income of grain enterprises in that province in 2004, x Y P m a x is the maximum of the average income of grain enterprises in 13 provinces in 2004 and x Y P m i n is the minimum of the average income of grain enterprises in 13 provinces in 2004. According to Equation (20), the average acquisition income satisfaction of the 13 provinces is x S Y P in 2004.
2.
Satisfaction of business risk
Because the implementation of the MPP policy is based on the willingness of grain enterprises to carry out long-term cooperation, it is necessary to ensure that the business risk of grain enterprises can be controlled within a reasonable range. Therefore, this index can reflect the persistence of MPP policy implementation. Let the change rate of the enterprise business risk be x Q D . Let the enterprise business risk in the previous year be x Q r and the enterprise business risk in the current year be x Q a . The calculation formula of x Q D is shown in Equation (21):
x Q D = x Q r x Q a x Q r
In Equation (21), the enterprise business risk refers to the average business risk of grain enterprises in 13 provinces.
The business risk of grain enterprises in one province = (total grain acquisition earnings of enterprises in the province – total variable cost of enterprises in the province) / (total grain acquisition earnings of enterprises in the province – total variable cost of enterprises in the province – total fixed cost of enterprises in the province).
The rate of change of the business risk x Q D is converted into the satisfaction of the business risk x S Q D by the subsection function in Equation (22):
x S Q D = { 0 x Q D 0 0.2 0 < x Q D 0.02 0.5 0.02 < x Q D 0.05 0.8 0.05 < x Q D 0.1 1 0.1 < x Q D

3.1.4. Consumers

1.
Satisfaction of grain price
Because the grain price not only directly determines the purchase quantity of consumers but also indirectly reflects the grain supply quantity, this index can reflect the grain supply and demand situation under the implementation of the MPP policy. Let the average grain price of each province be x P R i and the satisfaction of the grain price be x P D . The calculation formula of x P D is shown in Equation (23):
x P D = i = 1 13 f ( x P R i ) 13 f ( x P R i ) = { 0         x P R i x P R m a x x P R m a x x P R i x P R m a x     x P R m i n < x P R i < x P R m a x 1         x P R i x P R m i n
In Equation (23), i = 1 , 2 , , 13 , the average grain price refers to the total average price of rice and wheat. Set x P R m a x as a threshold of 0 for the price satisfaction when the actual price of grain is large, and set x P R m i n as a threshold of 1 for the price satisfaction when the actual price of grain is small.
Take calculating the satisfaction of the grain price x P D in 2004 as an example. x P R i for each province is the average grain price in that province in 2004, x P R m a x is the maximum of the average grain price in 13 provinces in 2004 and x P R m i n is the minimum of the average grain price in 13 provinces in 2004. According to Equation (23), the average grain price satisfaction of the 13 provinces is x P D in 2004.
2.
Satisfaction of grain supply
Grain supply refers to the amount of grain that can be bought by consumers. If the supply is small, consumers will worry. If the supply is large, grain prices will fall. Therefore, this index can be used to measure the rationality of the grain supply under the implementation of the MPP policy. Let the change rate of the grain supply be x W D . Let the grain supply in the previous year be x W r and the grain supply in the current year be x W a . The calculation formula of x W D is shown in Equation (24):
x W D = x W a x W r x W a
In Equation (24), the grain supply refers to the total supply of wheat and rice for retail use in 13 provinces.
The change rate of the grain supply x W D is converted into the satisfaction of the grain supply x S W D by the subsection function in Equation (25):
x S W D = { 0 x W D 0.01 0.2 0.01 < x W D 0.03 0.5 0.03 < x W D 0.05 0.8 0.05 < x W D 0.1 1 0.1 < x W D
In conclusion, the results of the MPP policy satisfaction evaluation model can be calculated according to the evaluation indexes of the four groups. The calculations for all the above indexes are based on data from the China Statistical Yearbook and documents on China’s four official websites mentioned in Section 2.1.

3.2. Index Weight

To determine the weight of each evaluation index through the AHP, the evaluation index hierarchy of the MPP policy should be established, as shown in Table 5.
According to the construction principle of the paired comparison matrix, the matrices of the criterion layer and scheme layer are constructed as follows:
A = [ 1 1 / 3 1 / 5 1 / 7     3 1 1 / 3 1 / 5     5 3 1 1 / 3     7 5 3 1 ]
B 1 = [ 1 3 5 1 / 3 1 3 1 / 5 1 / 3 1 ] B 2 = [ 1 5 7 1 / 5 1 3 1 / 7 1 / 3 1 ] B 3 = [ 1 3 1 / 3 1 ] B 4 = [ 1 5 1 / 5 1 ]
The consistency test result of each paired comparison matrix is shown in Table 6.
When CR < 0.1, the eigenvector of the paired comparison matrix obtained by the characteristic root method can be used as the weight vector. Because the above paired comparison matrices pass the consistency test, the final weight of each evaluation index can be obtained, as shown in Table 7. The evaluation value of each group can be obtained by multiplying the index results and the corresponding weights.

3.3. Comprehensive Evaluation

3.3.1. Comparison before and after Policy Implementation

In order to comprehensively analyze the implementation effect of the MPP policy and its effect on China’s sustainable grain development, this paper focuses on the satisfaction of four groups in 13 provinces in 2003 and 2018 for a comparative analysis before and after the MPP policy implementation, as shown in Table 8.
As can be seen from Table 8, before the implementation of the MPP policy, the government, farmers, grain enterprises and consumers were all less satisfied with the grain industry, which did not exceed 81%. In particular, the satisfaction of farmers in each province is at the lowest level among the four groups. The lower satisfaction will lead farmers to seek other jobs for a higher income, which will further increase the instability of grain production. After the implementation of the MPP policy, the satisfaction of the four groups has been significantly improved, and the improvement degree of farmers’ satisfaction is the highest. Therefore, this highlights the role of the MPP policy in ensuring farmers’ income and planting enthusiasm, so as to promote the healthy development of the grain industry from the perspective of planting.
From the average satisfaction of each province, it can be seen that both before and after the implementation of the MPP policy, the satisfaction of grain enterprises is at a low level among the four groups. This is partly because the interests of farmers and grain enterprises conflict: one wants to sell grain at a high price, the other wants to buy grain at a low price. Therefore, when revising the MPP policy in the future, the government should focus on how to improve the satisfaction of grain enterprises while protecting the interests of farmers.
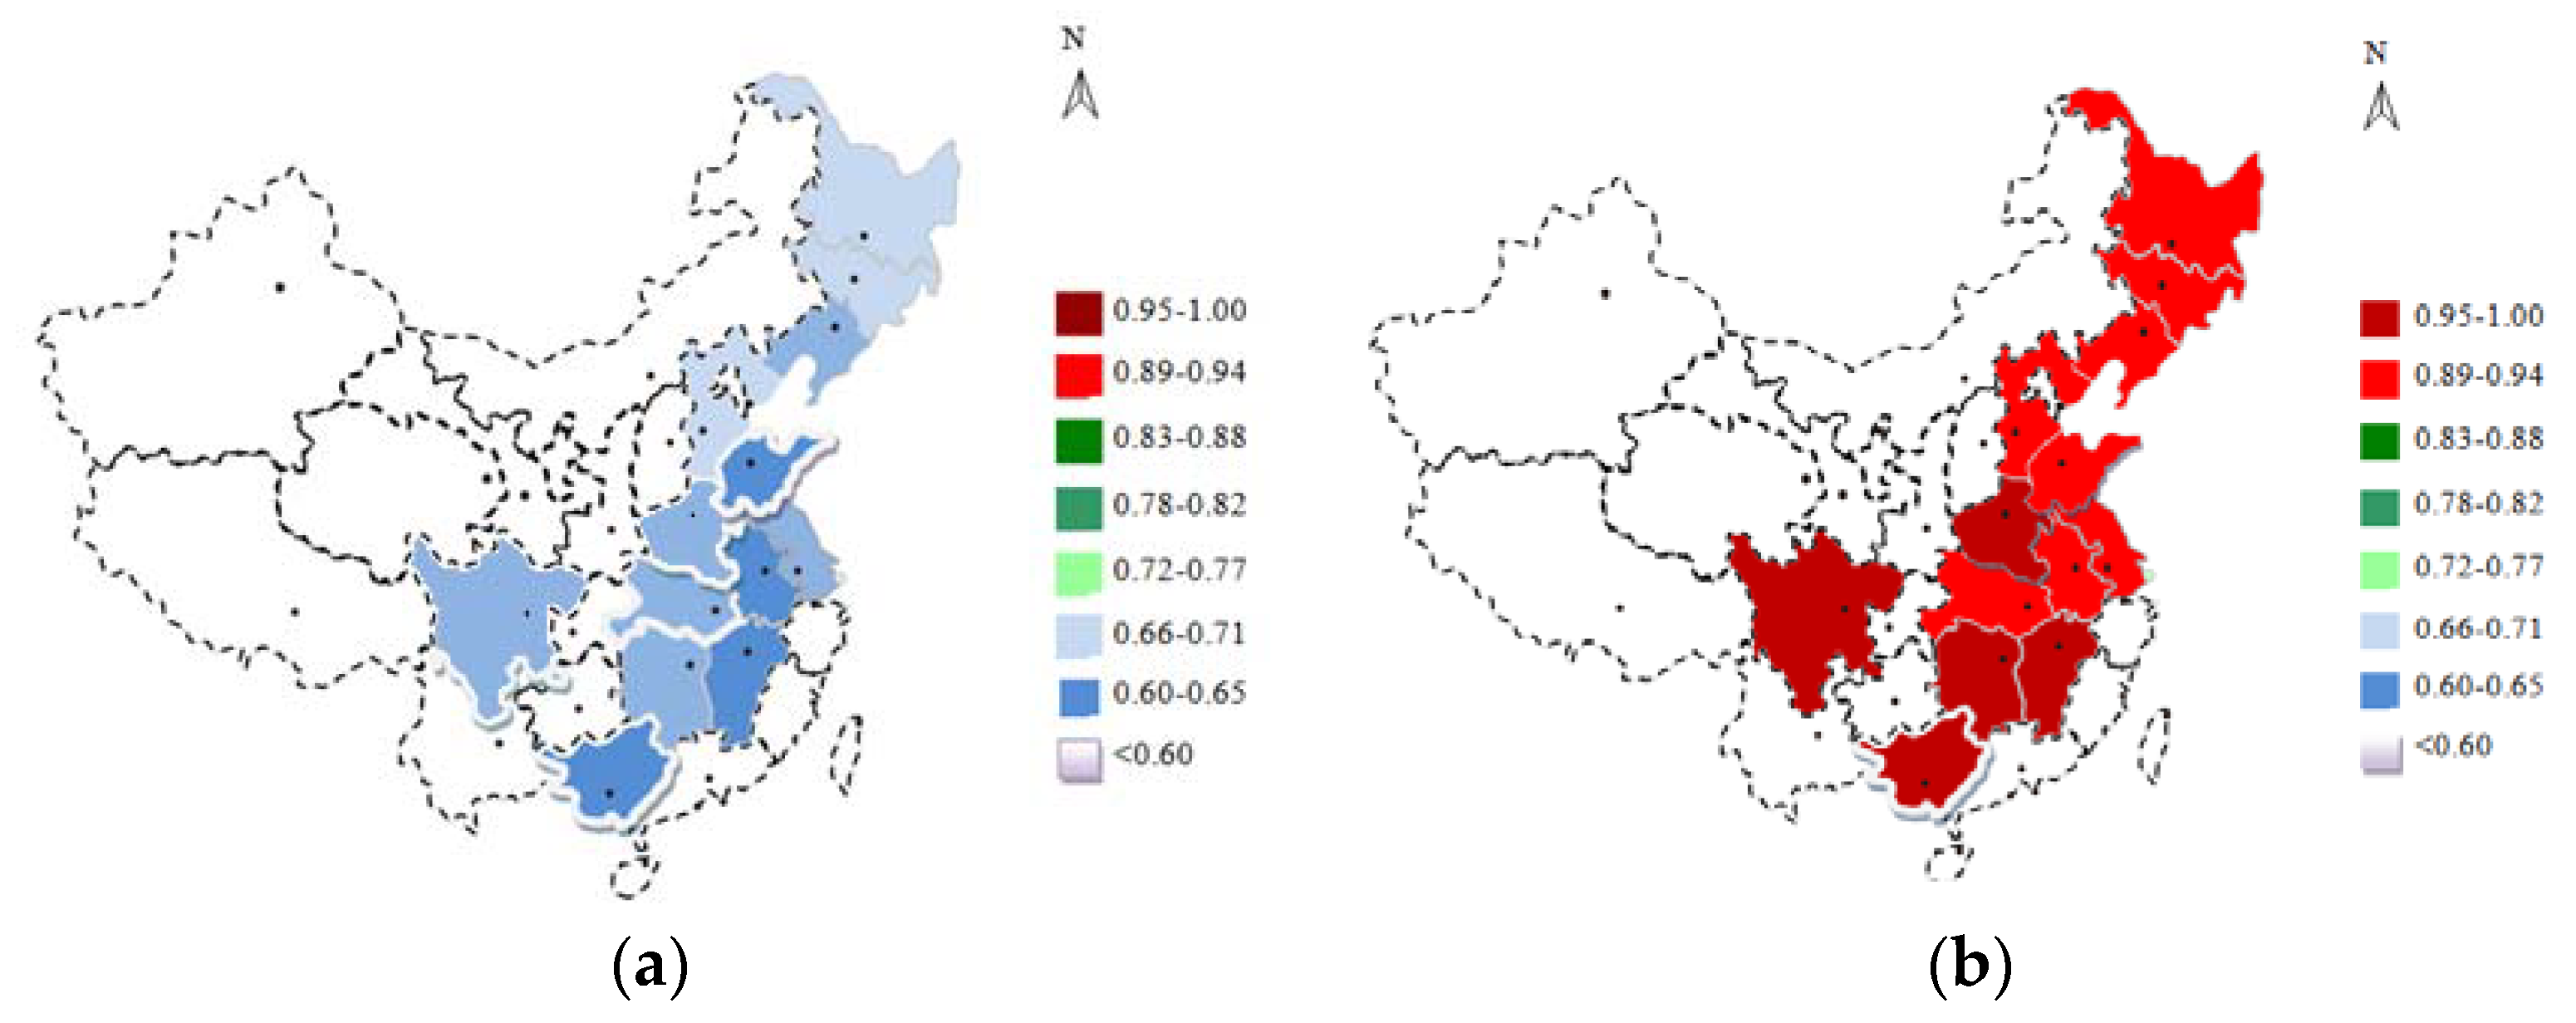
In order to facilitate an intuitive analysis, this paper further gives graphs of farmers’ satisfaction degree in major grain-growing provinces in 2003 and 2018, as shown in Figure 2. As can be seen from the comparison of the two figures, farmers in Henan, Jiangxi, Hunan, Guangxi and Sichuan have the highest satisfaction after the implementation of the MPP policy, which are all above 95%. However, before the implementation of the MPP policy, farmers’ satisfaction in these five provinces were relatively low, especially in Guangxi and Jiangxi provinces, where farmers’ satisfaction levels were below 65% The increase of farmers’ satisfaction in 13 provinces varied, indicating that the implementation effect of the MPP policy has regional differences.
In the future, before the revision of the MPP policy, it will be necessary to analyze the causes of low farmers’ satisfaction in some provinces and summarize the successful cases of provinces with high farmers’ satisfaction. In addition, it can be seen from figures that the main grain planting provinces in China are concentrated in the east, and that the provinces in the northwest have scarce grain resources. Therefore, only through the effective use of limited grain resources to achieve a sustainable development of the grain industry can one meet the grain needs of Chinese people.

3.3.2. Satisfaction Trend Analysis

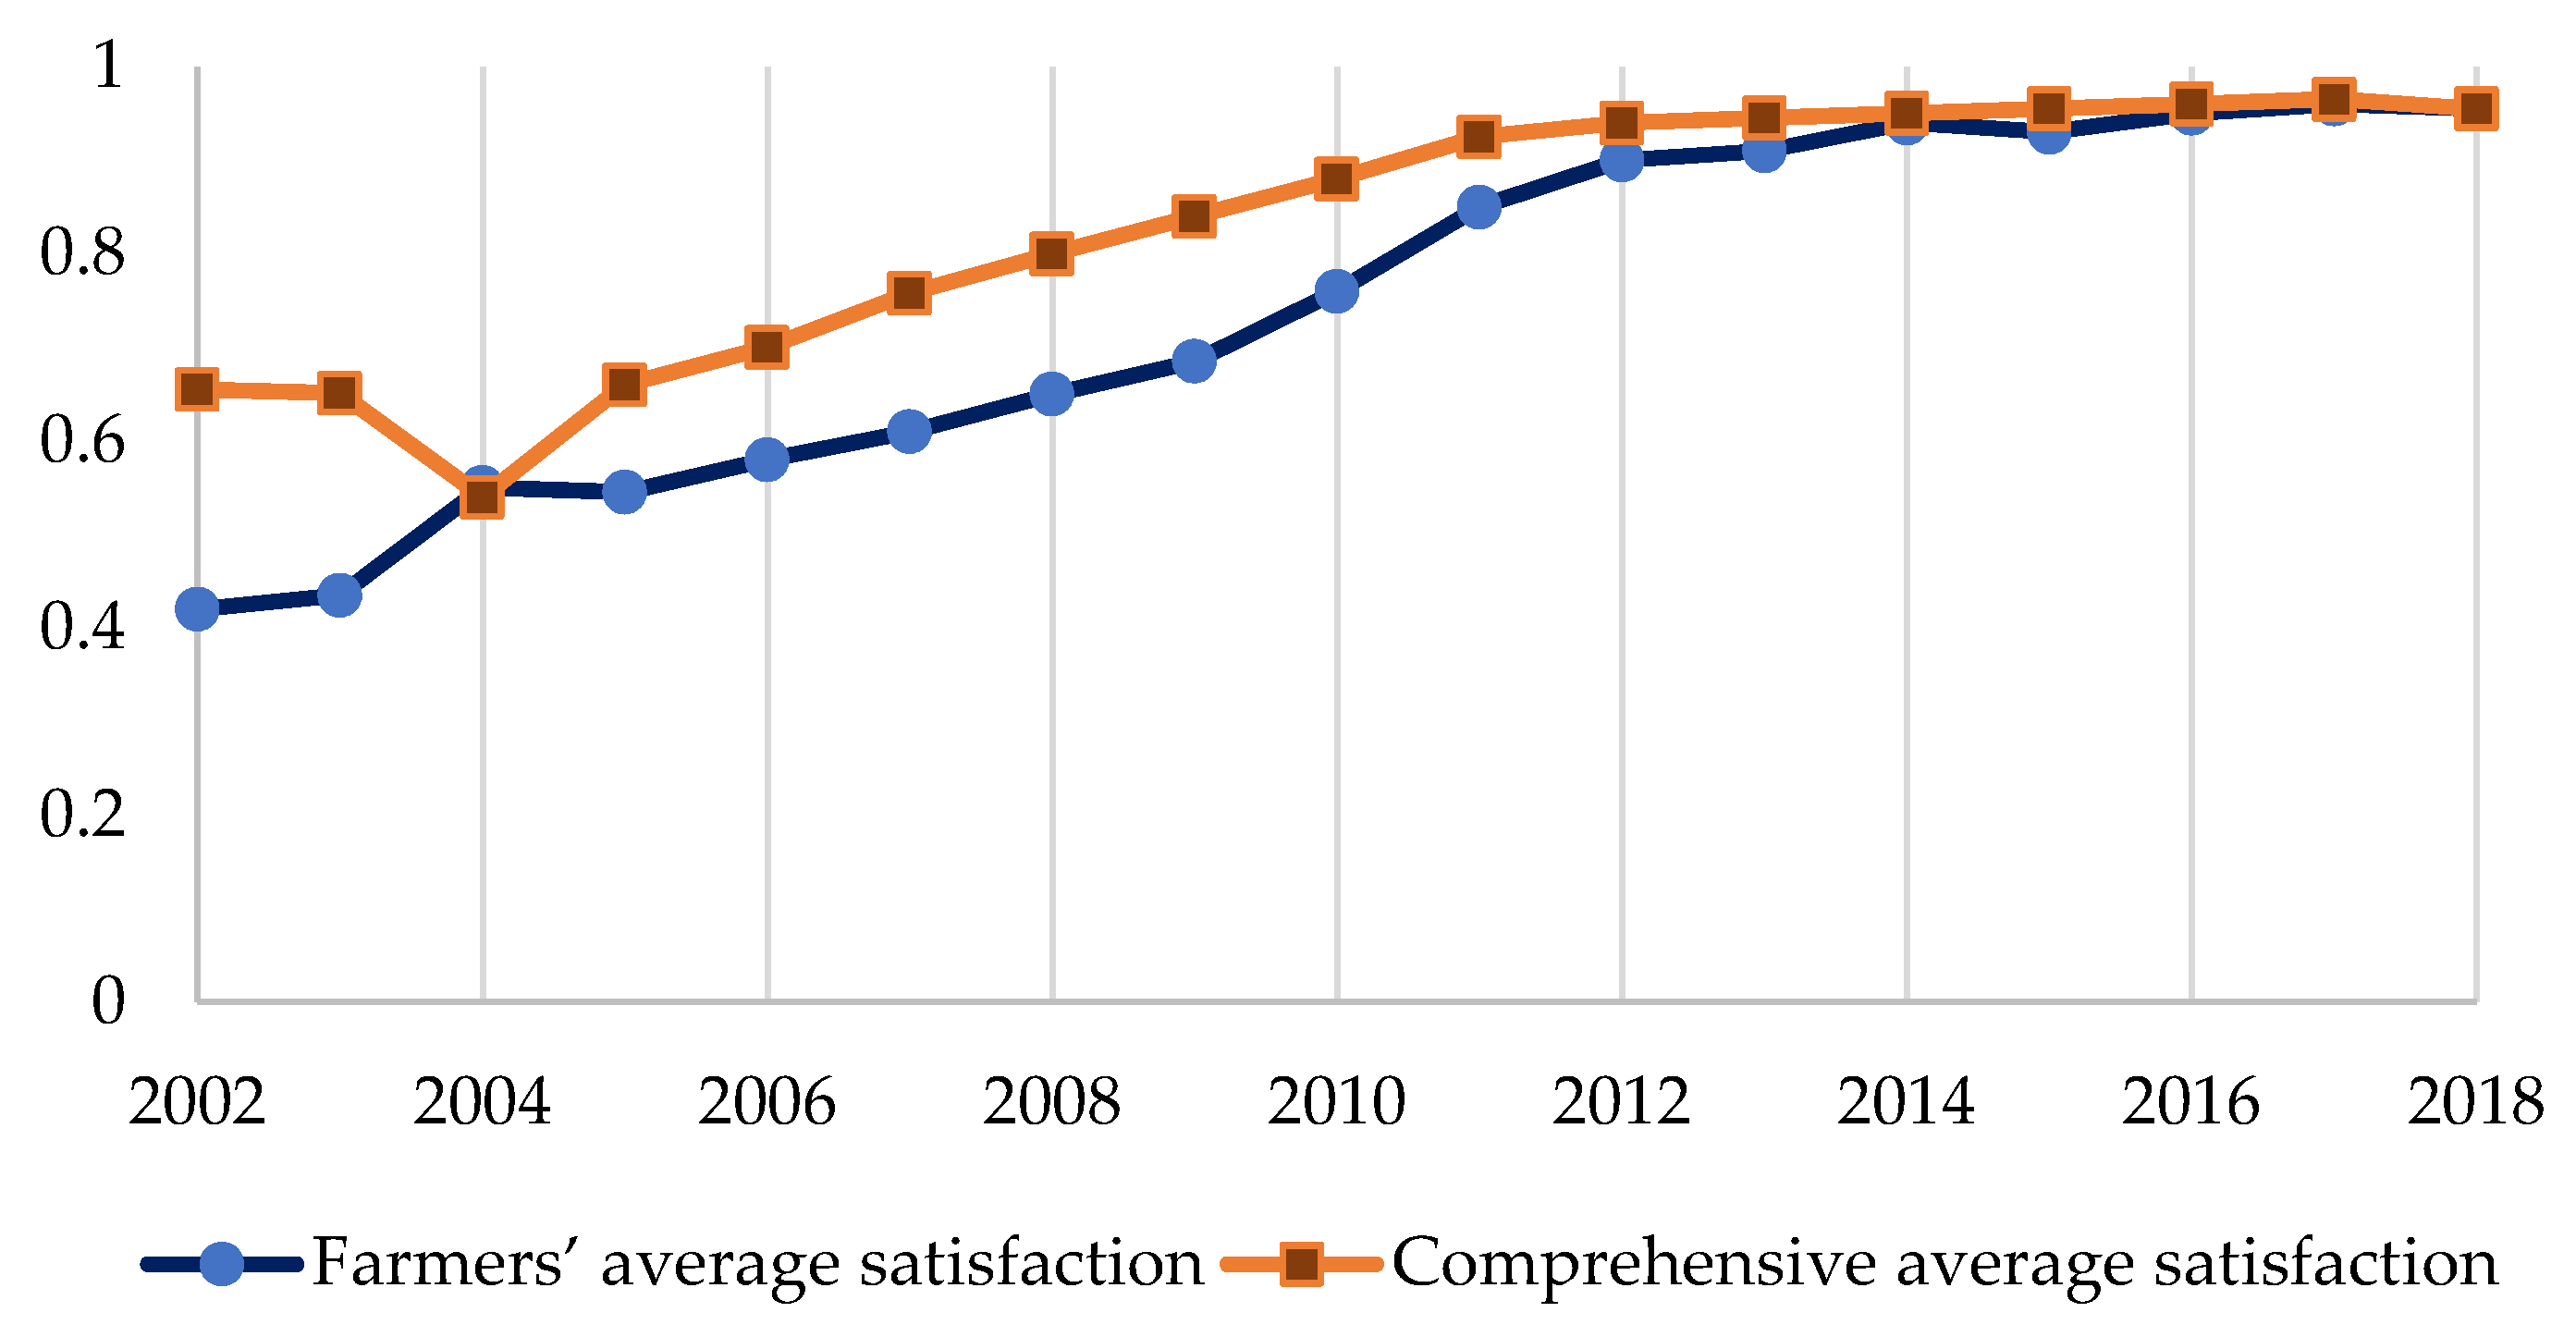
China’s grain minimum purchase price policy has been implemented since 2004, and the relevant data were recorded until 2018. Therefore, this paper evaluates the implementation effect of the MPP policy from 2004 to 2018, and selects relevant data from 2002 and 2003 for a comparative analysis. The farmers’ average satisfaction and the comprehensive average satisfaction are shown in Figure 3. The farmers’ average satisfaction refers to the average satisfaction of farmers in 13 provinces. The comprehensive average satisfaction is calculated by the government’s average satisfaction, the farmers’ average satisfaction, the enterprises’ average satisfaction and the consumers’ average satisfaction in 13 provinces according to the weights of the criterion layer.
As can be seen from Figure 3, since the implementation of the MPP policy in 2004, the farmers’ average satisfaction and the comprehensive average satisfaction have been steadily increasing. Compared with before the implementation of the MPP policy, the farmers’ average satisfaction increased greatly after the implementation of the MPP policy. Because the evaluation index of farmers’ satisfaction includes the planting income and urban–rural income gap, it indicates that the MPP policy effectively improves farmers’ economic income and planting enthusiasm, ensuring a sufficient planting labor force to maintain the stable growth of grain output.
There are two main reasons for the decline in comprehensive average satisfaction in 2004. On the one hand, the MPP policy made it impossible for grain enterprises to purchase grain at a lower price according to their own will, thus reducing their satisfaction with the acquisition income. On the other hand, some consumers were concerned that the introduction of the MPP policy would distort market behaviors and lead to higher grain prices, thus resulting in a lower consumer satisfaction. After 2004, the comprehensive average satisfaction began to increase and stabilized around 2014, indicating that the satisfaction of grain enterprises and consumers was gradually increasing during this period. This phenomenon reflects that the MPP policy is gradually promoting the interests balance of various groups and the healthy development of the grain industry.

3.3.3. Natural Disasters Response

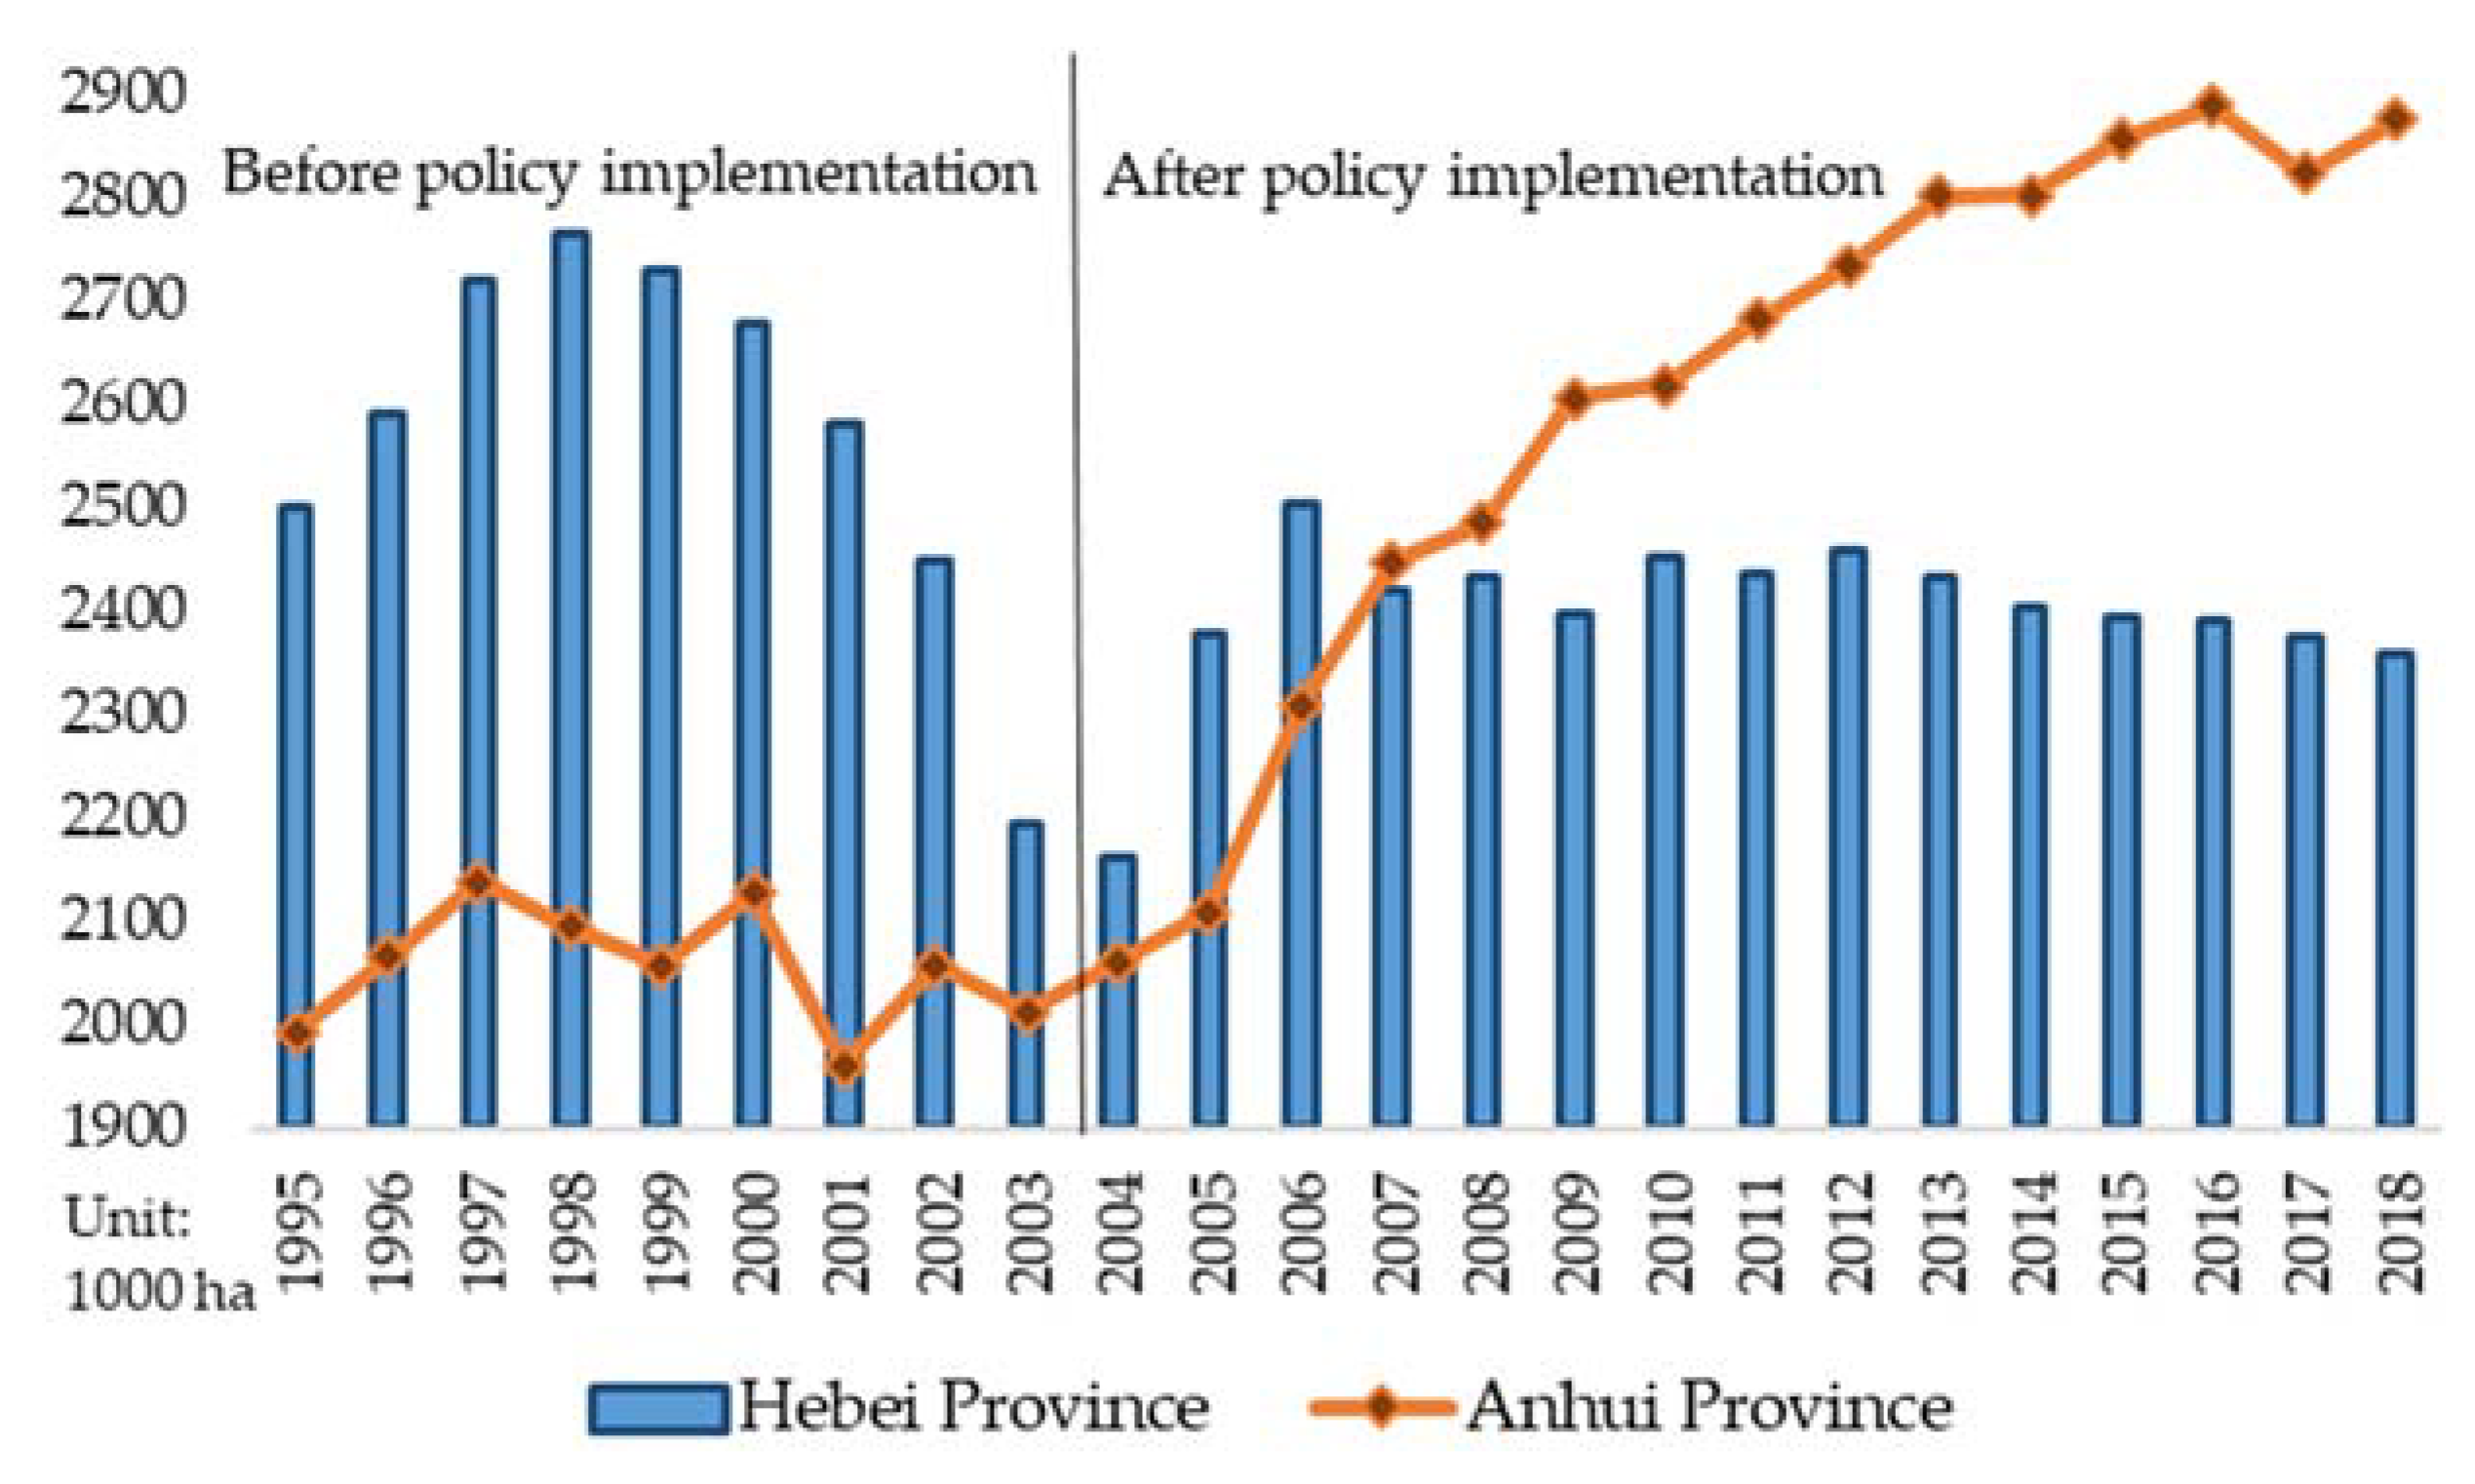
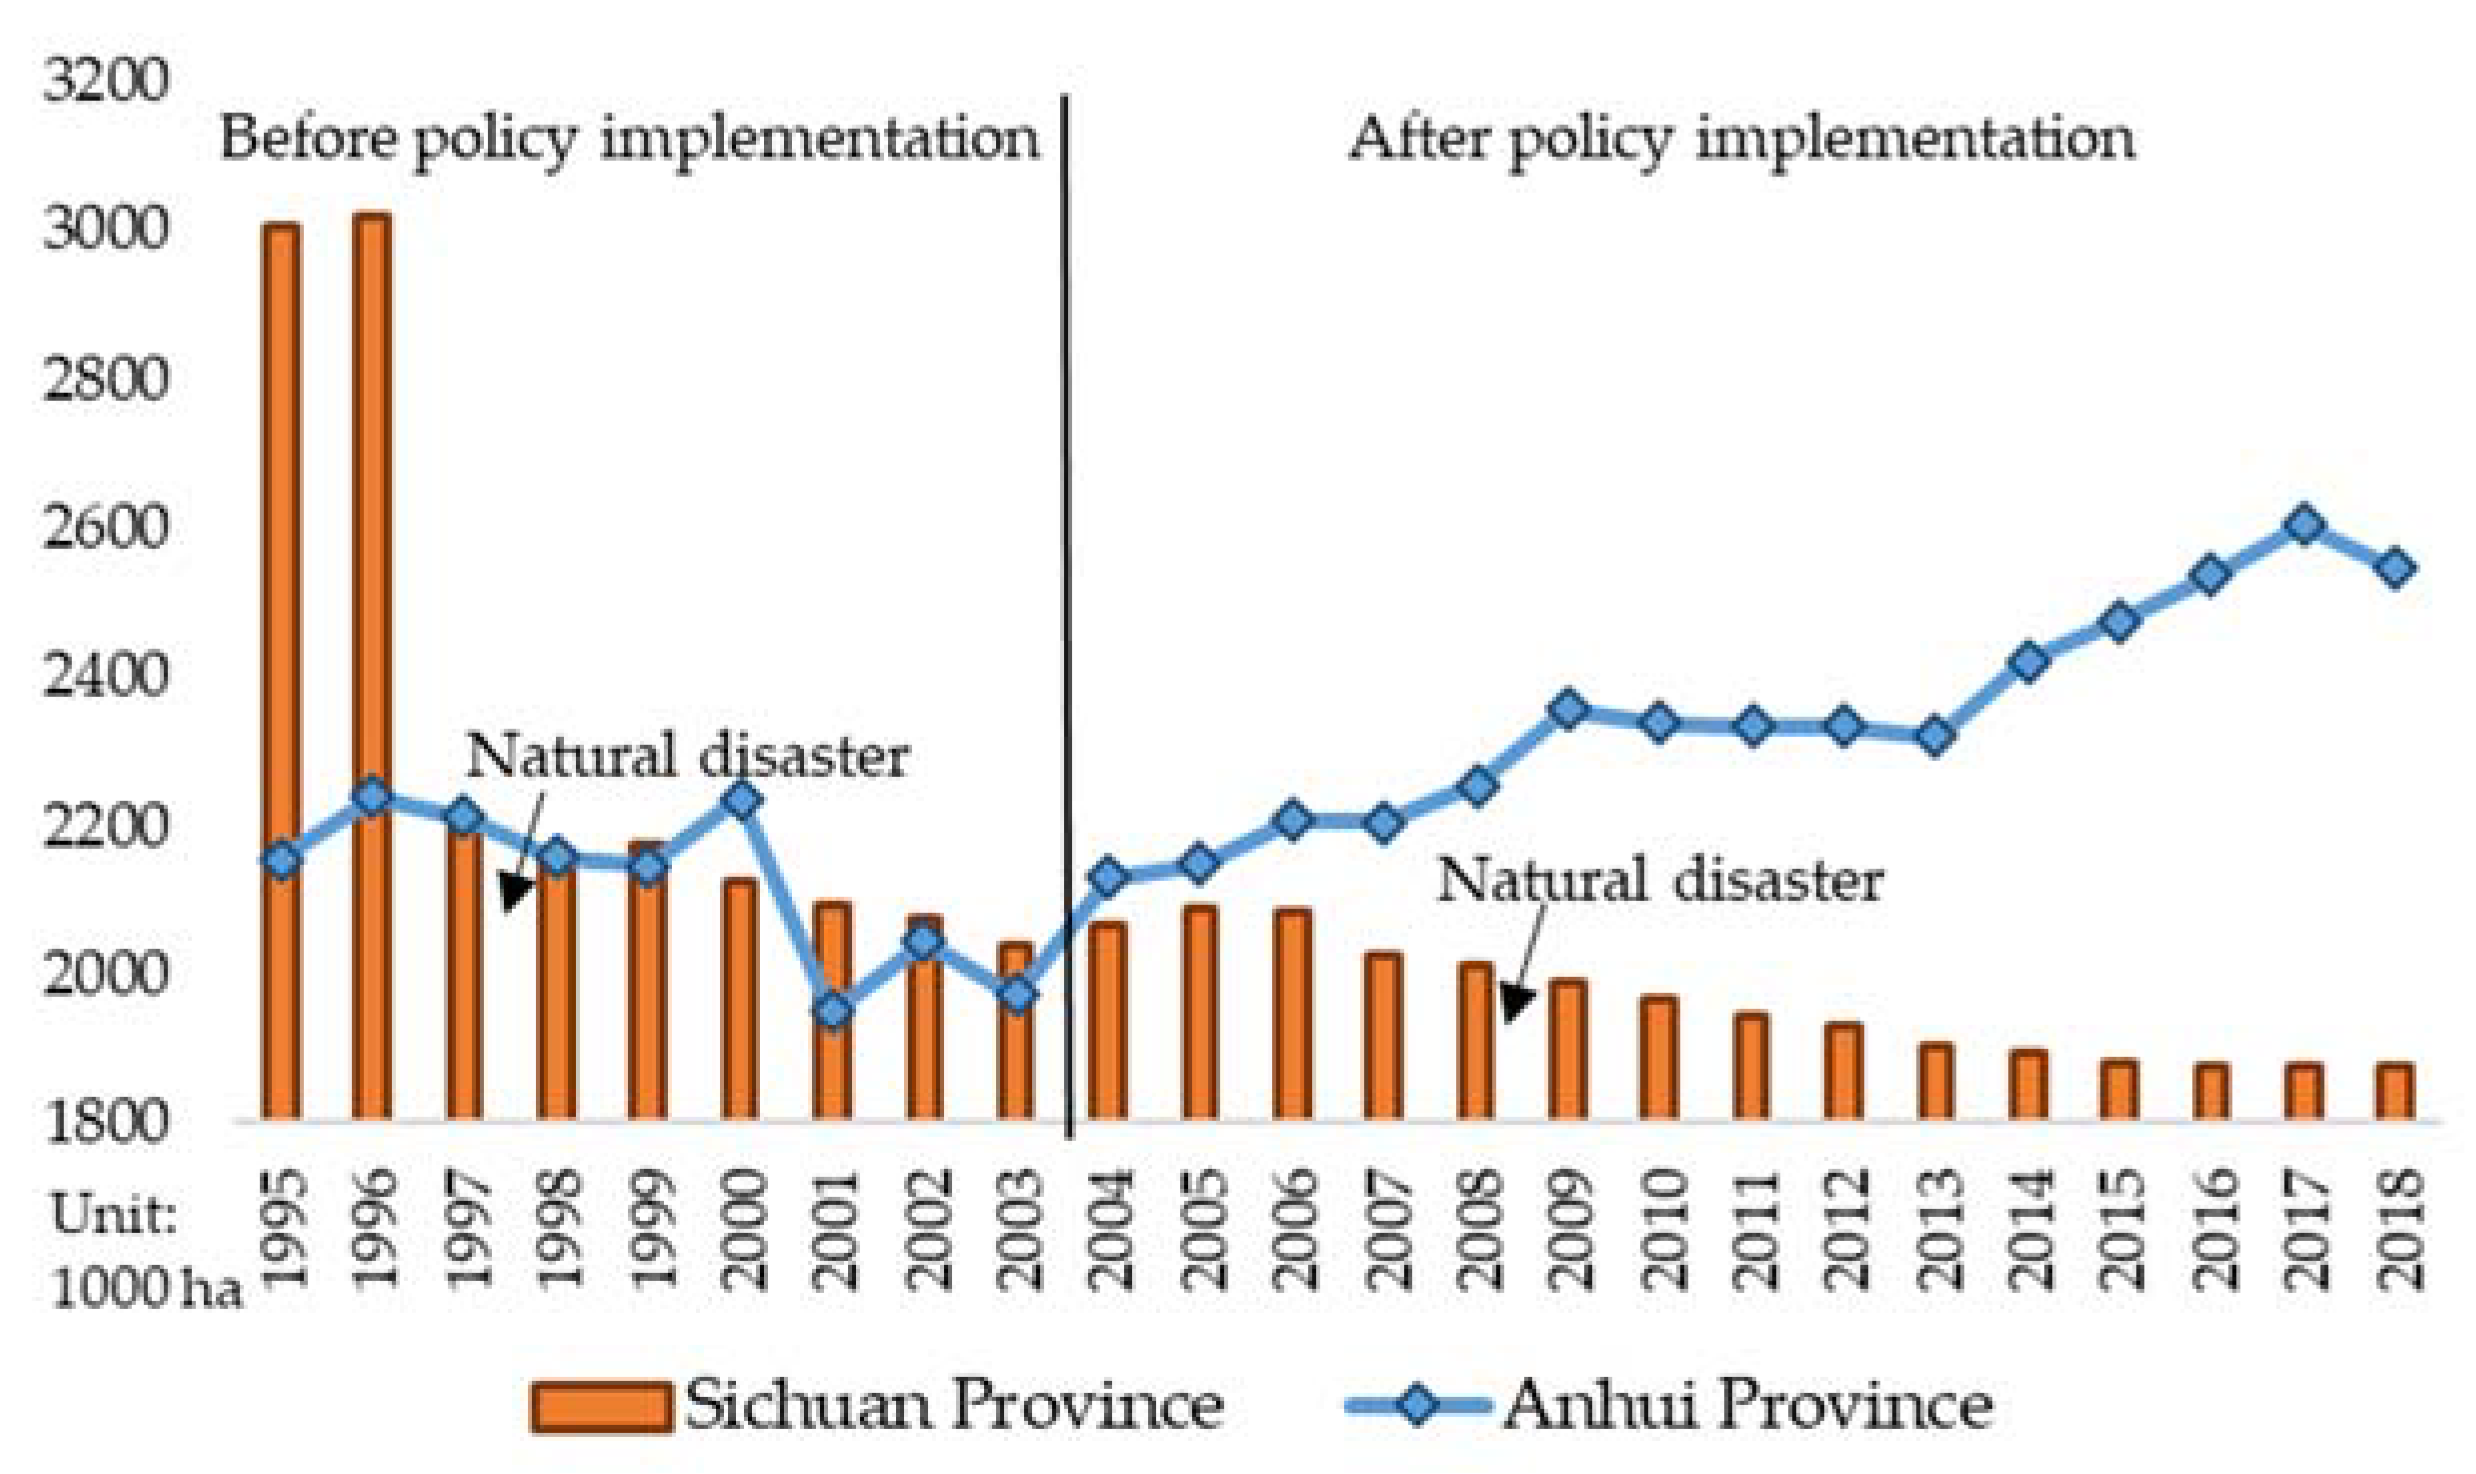
Cultivated areas of wheat in Hebei and Anhui, and cultivated areas of rice in Anhui and Sichuan in the years before and after the implementation of the MPP policy (i.e., from 1995 to 2018) were collected for a graphic analysis. By comparing Figure 4 and Figure 5, it can be seen that before the implementation of the MPP policy in 2004, cultivated areas in Hebei, Anhui and Sichuan fluctuated greatly. In Anhui province, in particular, the phenomenon of alternation between the increase and decrease of grain output mentioned in the introduction of this paper appeared. Wheat-cultivated areas in Hebei province began to decline in 1998 and did not ease until 2004, when the MPP policy plan was implemented. Since the official implementation of the MPP policy, wheat- and rice-cultivated areas in Anhui province have steadily increased, and wheat-cultivated areas in Hebei province have stabilized at about 2,400,000 hectares after several years of improvement.
The cultivated areas of rice in Sichuan province decreased rapidly around 1997, which was due to the severe flood disaster that began in 1997. 168 counties (cities and districts) in the province suffered losses [52], and they were in the post-disaster recovery and reconstruction period for the next five years. Although the implementation of the MPP policy prompted rice-cultivated areas in Sichuan province to slowly increase, an 8.0 Richter scale earthquake occurred in Wenchuan county, Sichuan province in 2008, causing a direct economic loss of 845.215 billion yuan (about $120.274 billion) [53]. Comparing the major natural disasters in Sichuan province in 1997 and 2008, it can be found that there was only a small decline in rice-cultivated areas after the earthquake, and the recovery period was shortened. In recent years, the rice-cultivated areas in Sichuan have stabilized at about 1,900,000 hectares.
Major natural disasters not only directly lead to the rapid decline of grain output, but also lead to the huge fluctuation of grain output during the long post-disaster recovery and reconstruction period. Therefore, natural disaster is the key factor hindering the grain sustainable development. Through the analysis of grain-cultivated areas before and after the occurrence of natural disasters, it has been shown that although the MPP policy cannot prevent the occurrence of natural disasters, it can effectively reduce the damage of natural disasters. By enhancing the confidence of farmers and helping the disaster-affected areas recover their planting capacity, the MPP policy minimizes the adverse impact of uncertainties on the sustainable development of the grain industry and stabilizes the cultivated area within a reasonable range.

4. Discussion

Grain sustainable development is the premise of national social stability and economic development, and its core goals include achieving a steady increase in output and ensuring a balance between supply and demand. These goals cannot be achieved without the cooperation and support of the government, farmers, grain enterprises and consumers. The MPP policy is one of the most important grain protection policies in China. By constructing a satisfaction evaluation model composed of four groups, the impact of the MPP policy on grain sustainable development could be comprehensively analyzed. At the same time, effectively measuring the implementation effect of the MPP policy is of great significance for the rational adjustment of the purchase price level and grain industry structure. From the perspective of stakeholders in the grain industry, this paper constructs a satisfaction evaluation model of the MPP policy based on the AHP and the FCE. By applying grain-related data of 13 Chinese provinces from 1995 to 2018, this paper studied the implementation effect of the MPP policy and its effect on grain sustainable development from three aspects: a comparison before and after MPP policy implementation, a satisfaction trend analysis and the natural disasters response.
1.
Research Conclusions
According to the core goals of grain sustainable development and the calculation results of the evaluation model, the main conclusions of this paper are summarized under the following three aspects.
(1) The MPP policy is conducive to achieving the goal of a steady increase in output. After the implementation of the MPP policy, the satisfaction degree of farmers among the four groups increased the most, indicating that the MPP policy can effectively improve farmers’ planting income and planting enthusiasm. At the same time, the alternation between the increase and decrease of grain output also weakened after the implementation of the MPP policy, and the cultivated area of rice and wheat reached a stable state after a reasonable increase. Therefore, the MPP policy can guarantee the improvement of planting enthusiasm and the increase of planting areas, thus promoting the steady growth of grain output.
(2) The MPP policy is conducive to achieving the goal of a balance between supply and demand. After the implementation of the MPP policy, the satisfaction of the government, grain enterprises and consumers increased significantly. Thus, grain suppliers and buyers can have a long-term and good cooperation, so that the grain retail market can be an orderly operation. By comparing natural disasters around 2004, the grain damage after the implementation of the MPP policy was relatively small, and the recovery time was relatively short, indicating that the MPP policy can effectively reduce the adverse impact of uncertain factors on grain supply and demand.
(3) The implementation effect of the MPP policy in different regions varies, and the satisfaction of different groups varies. The main reasons for regional differences are the influence of natural factors such as topography, distribution of water resources and sudden disasters. The relatively low satisfaction of grain enterprises and consumers is due to the impact of the MPP policy on the market economy. On the one hand, it may aggravate the monopolistic acquisition behavior of state-owned units and thus harm the interests of private enterprises. On the other hand, the grain retail price may violate market rules, leading to the increase of consumers’ daily expenses while protecting farmers’ interests.
2.
Policy Suggestions
According to the research conclusions of this paper, the following four policy suggestions are put forward.
(1) Implement targeted combinations of grain policies for different regions. In order to improve policy effectiveness and public satisfaction, the government should adopt different combinations of grain regulation policies according to the actual situation of different provinces, so as to meet the planting habits of local farmers, utilize geographical conditions and protect natural resources.
(2) Optimize grain varieties and improve the acquisition process. The government should promote new varieties with a higher survival rate and stimulate the growth potential of the yield per unit area through technical and financial support. At the same time, through mobile internet technology, an online platform of grain acquisition should be built to track the acquisition process in real time and strictly supervise the approval process, so as to prevent a situation involving illegal profit and monopoly acquisition.
(3) Increase the construction of farmland water conservancy facilities and study water-saving irrigation technology. Because there are many hills and mountains in the countryside of China, it is difficult to grow grain. The development of three-dimensional agriculture through the design of water-saving terraces can not only help increase the yield per unit area, but also improve the utilization rate of natural resources.
(4) Increase the proportion of rural education investment to improve the cultural quality of farmers. The improvement of farmers’ cultural quality can increase their acceptance and understanding of policies. Meanwhile, high-quality farmers also have more access to agricultural learning technologies and production information, so that they can master more scientific planting skills and reduce planting costs.
3.
Future Research Directions
Although the satisfaction evaluation model proposed in this paper could comprehensively analyze the implementation effect of the current MPP policy, with the development of modern agriculture and the reform of the production structure in China, the MPP policy will be continuously optimized. As a result, the evaluation indexes and methods designed in this model are insufficient to analyze the implementation scope and statistical data of the future MPP policy. In the future, we will follow up the revision of the MPP policy in real time and constantly improve the indexes and methods of the satisfaction evaluation model, so as to ensure the sustainability of grain industry research.
At the same time, because grain security is one of the important factors in ensuring the sustainable development of the national grain industry, we will also focus on the design of a grain security early warning mechanism in the future. An effective early warning mechanism can play a predictive role for possible grain problems, so that the government and the public can be fully prepared to deal with risks.

Author Contributions

Conceptualization, Z.L.; data curation, H.L., D.P., F.X. and Q.Z.; formal analysis, Z.L., D.P., E.Z. and Q.Z.; funding acquisition, Z.L. and E.Z.; investigation, F.X. and Q.Z.; methodology, Z.L., H.L., D.P. and F.X.; project administration, F.X. and Q.Z.; resources, Z.L., H.L., E.Z. and Q.Z.; software, H.L., D.P. and E.Z.; writing—original draft, D.P.; writing—review & editing, F.X. and Q.Z. All authors have read and agreed to the published version of the manuscript.

Funding

This research was funded by Guizhou Key Laboratory of Big Data Statistics Analysis, grant number BDSA20190103.

Conflicts of Interest

The authors declare no conflict of interest.

References

  1. Ming, Z.; Fang, D.; Mao, Z. Empirical study on the sustainability of china’s grain quality improvement: The role of transportation, labor, and agricultural machinery. Int. J. Environ. Res. Public Health 2018, 15, 271–279. [Google Scholar]
  2. FAO IFAD; WHO WFP; UNICEF. The State of Food Security and Nutrition in the World 2019: Safeguarding Against Economic Slowdowns and Downturns; FAO IFAD; WHO WFP: Rome, Italy; UNICEF: New York, NY, USA, 2019. [Google Scholar]
  3. Suweis, S.; Carr, J.A.; Maritan, A.; Rinaldo, A.; D’Odorico, P. Resilience and reactivity of global food security. Proc. Natl. Acad. Sci. USA 2015, 112, 6902–6907. [Google Scholar] [CrossRef] [PubMed] [Green Version]
  4. Brummer, B.; Glauben, T.; Lu, W. Policy Reform and Productivity Change in Chinese Agriculture: A Distance Function Approach. J. Dev. Econ. 2006, 81, 61–79. [Google Scholar] [CrossRef] [Green Version]
  5. Tilman, D.; Cassman, K.G.; Matson, P.A.; Naylor, R.; Polasky, S. Agricultural sustainability and intensive production practices. Nature 2002, 418, 671–677. [Google Scholar] [CrossRef]
  6. Roningen, V.; Dixit, P.M. Economic Implications of Agricultural Policy Reforms in Industrial Market Staff In Report, No. AGES; Economics.US Department of Agriculture: Washington, DC, USA, 1989; pp. 29–36.
  7. Breggin, L.; Myers, D.B. Subsidies with Responsibilities: Placing Stewardship and Disclosure Conditions on Government Payments to Large-scale Commodity Crop Operations. Harv. Environ. Law Rev. 2013, 37, 487–538. [Google Scholar]
  8. Rizov, M.; Pokrivcak, J.; Ciaian, P. CAP Subsidies and Productivity of the EU Farms. J. Agric. Econ. 2013, 64, 537–557. [Google Scholar] [CrossRef]
  9. Fell, J.; Maclaren, D. The Welfare Cost of Japanese Rice Policy with Home-good Preference and an Endogenous Import Price. Aust. J. Agric. Resour. Econ. 2013, 57, 601–619. [Google Scholar] [CrossRef] [Green Version]
  10. Anderson, K.; Martin, W. Export Restrictions and Price Insulation during Commodity Price Booms. Am. J. Agric. Econ. 2011, 94, 422–427. [Google Scholar]
  11. Hansen, H.O. Encyclopedia of Dairy Sciences, 2nd ed.; Academic Press: Salt Lake City, UT, USA, 2011. [Google Scholar]
  12. Morea, D.; Balzarini, M. Bankability of a public private partnership in agricultural sector: A project in Sub Saharan Africa. Agric. Econ. Czech 2019, 65, 212–222. [Google Scholar] [CrossRef] [Green Version]
  13. Duangbootsee, U.; Myers, R.A. Comparison of the Welfare Impacts of Thai Rice Price Support and Deficiency Payment Program. In Proceedings of the 2015 International Association of Agricultural Economists, Milan, Italy, 9–14 August 2015. [Google Scholar]
  14. Liang, Y.; Miller, J.C.; Harri, A.; Coble, K.H. Crop Supply Response under Risk: Impacts of Emerging Issues on Southeastern U.S. Agriculture. J. Agric. Appl. Econ. 2011, 43, 181–194. [Google Scholar] [CrossRef] [Green Version]
  15. Ali, S.Z.; Sidhu, R.S.; Vatta, K. Effectiveness of Minimum Support Price Policy for Paddy in India with a Case Study of Punja. Agric. Econ. Res. Rev. 2012, 25, 231–242. [Google Scholar]
  16. Rashid, S.; Dorosh, P.A.; Malek, M.; Lemma, S. Modern input promotion in sub-Saharan Africa: Insights from Asian green revolution. Agric. Econ. 2013, 44, 705–721. [Google Scholar] [CrossRef]
  17. Gilbert, C.L.; Christiaensen, L.; Kaminski, J. Food price seasonality in Africa: Measurement and extent. Food Policy 2017, 67, 119–132. [Google Scholar] [CrossRef] [PubMed] [Green Version]
  18. Benfica, R.; Boughton, D.; Uaiene, R.; Mouzinho, B. Food crop marketing and agricultural productivity in a high price environment: Evidence and implications for Mozambique. Food Secur. 2017, 9, 1405–1418. [Google Scholar] [CrossRef] [Green Version]
  19. Morea, D.; Balzarini, M. Financial sustainability of a public-private partnership for an agricultural development project in Sub-Saharan Africa. Agric. Econ. Czech 2018, 64, 389–398. [Google Scholar]
  20. Reeves, A.; Loopstra, R.; Stuckler, D. The growing disconnect between food prices and wages in Europe: Cross-national analysis of food deprivation and welfare regimes in twenty-one EU countries, 2004–2012. Public Health Nutr. 2017, 20, 1414–1422. [Google Scholar] [CrossRef] [Green Version]
  21. Wang, J.; Zhang, Z.; Liu, Y. Spatial shifts in grain production increases in China and implications for food security. Land Use Policy 2018, 74, 204–213. [Google Scholar] [CrossRef]
  22. Yang, L.; Qin, Z.; Tu, L. Responses of rice yields in different rice-cropping systems to climate variables in the middle and lower reaches of the Yangtze River, China. Food Secur. 2015, 7, 951–963. [Google Scholar] [CrossRef]
  23. Liu, L.T.; Liu, X.J.; Lun, F.; Wu, L.; Lu, C.X.; Guo, J.H.; Cheng, S.K. Research on China’s food security under global climate change background. J. Nat. Resour. 2018, 33, 927–939. [Google Scholar]
  24. Mukhopadhyay, K.; Thomassin, P.J.; Zhang, J. Food security in China at 2050: A global CGE exercise. J. Econ. Struct. 2018, 7, 1. [Google Scholar] [CrossRef]
  25. Lu-ping, L.A.N. Effect and problems of china’s grain minimum purchase price policy and suggestions for improvement. Res. Agric. Mod. 2013, 5, 97–103. [Google Scholar]
  26. Yi, F.D.; Sun, Y.Z. Grain subsidy, liquidity constraints and food security-Impact of the grain subsidy program on the grain-sown areas in China. Food Policy 2015, 50, 114–124. [Google Scholar] [CrossRef]
  27. Zhang, S. Establishment of Grain Farmers’ Supply Response Model and Empirical Analysis under Minimum Grain Purchase Price Policy. Asian Agric. Res. 2012, 4, 11–15. [Google Scholar]
  28. Xiaoyin, W.A.N.G.; Jun, W.A.N.G. Impacts of the Minimum Purchase Price Policy for Grain on the Planting Area of Rice in Hubei Province Based on a Mixed Linear Model. Asian Agric. Res. 2016, 8, 12–17. [Google Scholar]
  29. Yu, X.L.; Wang, R.Z.; Yuan, Z.H. A Study on the Policy of Minimum Grain Purchase Price. Math. Pract. Theory 2017, 2017, 10. [Google Scholar]
  30. Gale, H.F. Growth and evolution in China’s agricultural support policies. In USDA-ERS Economic Research Report; US Department of Agriculture: Washington, DC, USA, 2013. [Google Scholar]
  31. Li, X.; Wu, L.; Geng, X.; Xia, X.; Wang, X.; Xu, Z.; Xu, Q. Deciphering the Environmental Impacts on Rice Quality for Different Rice Cultivated Areas. Rice 2018, 11, 71–77. [Google Scholar] [CrossRef] [Green Version]
  32. King, L.A.; Adusei, B.; Stehman, S.V.; Potapov, P.V.; Song, X.P.; Krylov, A. A multi-resolution approach to national-scale cultivated area estimation of soybean. Remote Sens. Environ. 2017, 195, 13–29. [Google Scholar] [CrossRef]
  33. Zong, P.; Lowe, P.; Marsden, T.; Whatmore, S. From state control to a managed or liberalized market: Dilemmas in the reform of the grain price system in china. Regul. Agric. 1994, 10, 24–31. [Google Scholar]
  34. Li, T.; Long, H.; Zhang, Y.; Tu, S.; Ge, D.; Li, Y. Analysis of the spatial mismatch of grain production and farmland resources in china based on the potential crop rotation system. Land Use Policy 2017, 60, 26–36. [Google Scholar] [CrossRef]
  35. Ma, S.; Fan, D.; Gu, H. Notice of Retraction The key factors of China grain enterprise outbound investment: Based on food security background. In Proceedings of the 2011 International Conference on E-Business and E-Government, Shanghai, China, 6–8 May 2011. [Google Scholar]
  36. Zhu, H.; Jackson, P.; Wang, W. Consumer anxieties about food grain safety in china. Food Control 2017, 73, 1256–1264. [Google Scholar] [CrossRef]
  37. Feng, F.; Li, Y.; Qin, X.; Liao, Y.; Siddique, K.H. Changes in Rice Grain Quality of Indica and Japonica Type Varieties Released in China from 2000 to 2014. Front. Plant Sci. 2017, 8, 1066–1072. [Google Scholar] [CrossRef] [Green Version]
  38. Hui, L.; Wang, Z.H.; Li, F.; Li, K.; Ning, Y.; Yang, Y. Grain iron and zinc concentrations of wheat and their relationships to yield in major wheat production areas in china. Field Crop Res. 2014, 156, 151–160. [Google Scholar]
  39. Yao, F.; Xu, Y.; Lin, E.; Yokozawa, M.; Zhang, J. Assessing the impacts of climate change on rice yields in the main rice areas of china. Clim. Chang. 2007, 80, 395–409. [Google Scholar] [CrossRef]
  40. Gu, Y.J.; Chen, K.L.; Yang, K. Fuzzy Comprehensive Evaluation Method Based on Analytic Hierarchy Process for Falt Risk Analysis of Power Plant Equipment. In Proceedings of the 2008 Fifth International Conference on Fuzzy Systems and Knowledge Discovery, Shandong, China, 8–20 October 2008. [Google Scholar]
  41. Hu, J.; Jie, C.; Zheng, C.; Cao, J.; Wang, Q.; Zhao, L. Risk assessment of seismic hazards in hydraulic fracturing areas based on fuzzy comprehensive evaluation and AHP method (FAHP): A case analysis of Shangluo area in Yibin City, Sichuan Province, China. J. Pet. Sci. Eng. 2018, 170, 797–812. [Google Scholar] [CrossRef]
  42. Saaty, T.L. Analytic hierarchy process. Encycl. Oper. Res. Manag. Sci. 2001. [Google Scholar] [CrossRef]
  43. Ml, Z.; Wp, Y. Fuzzy comprehensive evaluation method applied in the real estate investment risks research. Phys. Procedia 2012, 24, 1815–1821. [Google Scholar]
  44. Cao, L.J.; Qin, J.Q.; Wu, C.G.; Wang, X.G. A new fault forecast algorithm based on dynamic fuzzy comprehensive evaluation method. Fuzzy Syst. Math. 2005, 3, 151–156. [Google Scholar]
  45. Ma, S.; He, J.; Shuai, X. Application of fuzzy comprehensive evaluation method in trust quantification. Int. J. Comput. Intell. Syst. 2011, 4, 768–776. [Google Scholar] [CrossRef] [Green Version]
  46. Liu, Y.; Huang, X.; Jin, D.; Zhang, H. The assessment of traffic accident risk based on grey relational analysis and fuzzy comprehensive evaluation method. Nat. Hazards 2017, 88, 1409–1422. [Google Scholar] [CrossRef]
  47. Zeng, D.; He, Q.; Yu, Z.; Jia, W.; Shuang, Z.; Liu, Q. Risk assessment of sustained casing pressure in gas wells based on the fuzzy comprehensive evaluation method. J. Nat. Gas Sci. Eng. 2017, 46, 756–763. [Google Scholar] [CrossRef]
  48. Saaty, T.L. Axiomatic foundation of the analytic hierarchy process. Manag. Sci. 1986, 32, 841–855. [Google Scholar] [CrossRef]
  49. Saaty, T.L. How to make a decision: The analytic hierarchy process. Eur. J. Oper. Res. 1994, 24, 19–43. [Google Scholar] [CrossRef]
  50. Saaty, T.L. Decision making with the analytic hierarchy process. Int. J. Serv. Sci. 2008, 1, 83–98. [Google Scholar] [CrossRef] [Green Version]
  51. Otto, C.; Schewe, J.; Puma, M.J.; Frieler, K. Beneficial impacts of an international grain reserve on global food security. In AGU Fall Meeting Abstracts; American Geophysical Union: New Orleans, LA, USA, 2017. [Google Scholar]
  52. Ye, Q.; Glantz, M.H. The 1998 Yangtze Floods: The Use of Short-Term Forecasts in the Context of Seasonal to Interannual Water Resource Management. Mitig. Adapt. Strateg. Glob. Chang. 2005, 10, 159–182. [Google Scholar] [CrossRef]
  53. Dai, F.C.; Xu, C.; Yao, X.; Xu, L.; Tu, X.B.; Gong, Q.M. Spatial distribution of landslides triggered by the 2008 Ms 8.0 Wenchuan earthquake, China. J. Asian Earth Sci. 2011, 40, 883–895. [Google Scholar] [CrossRef]
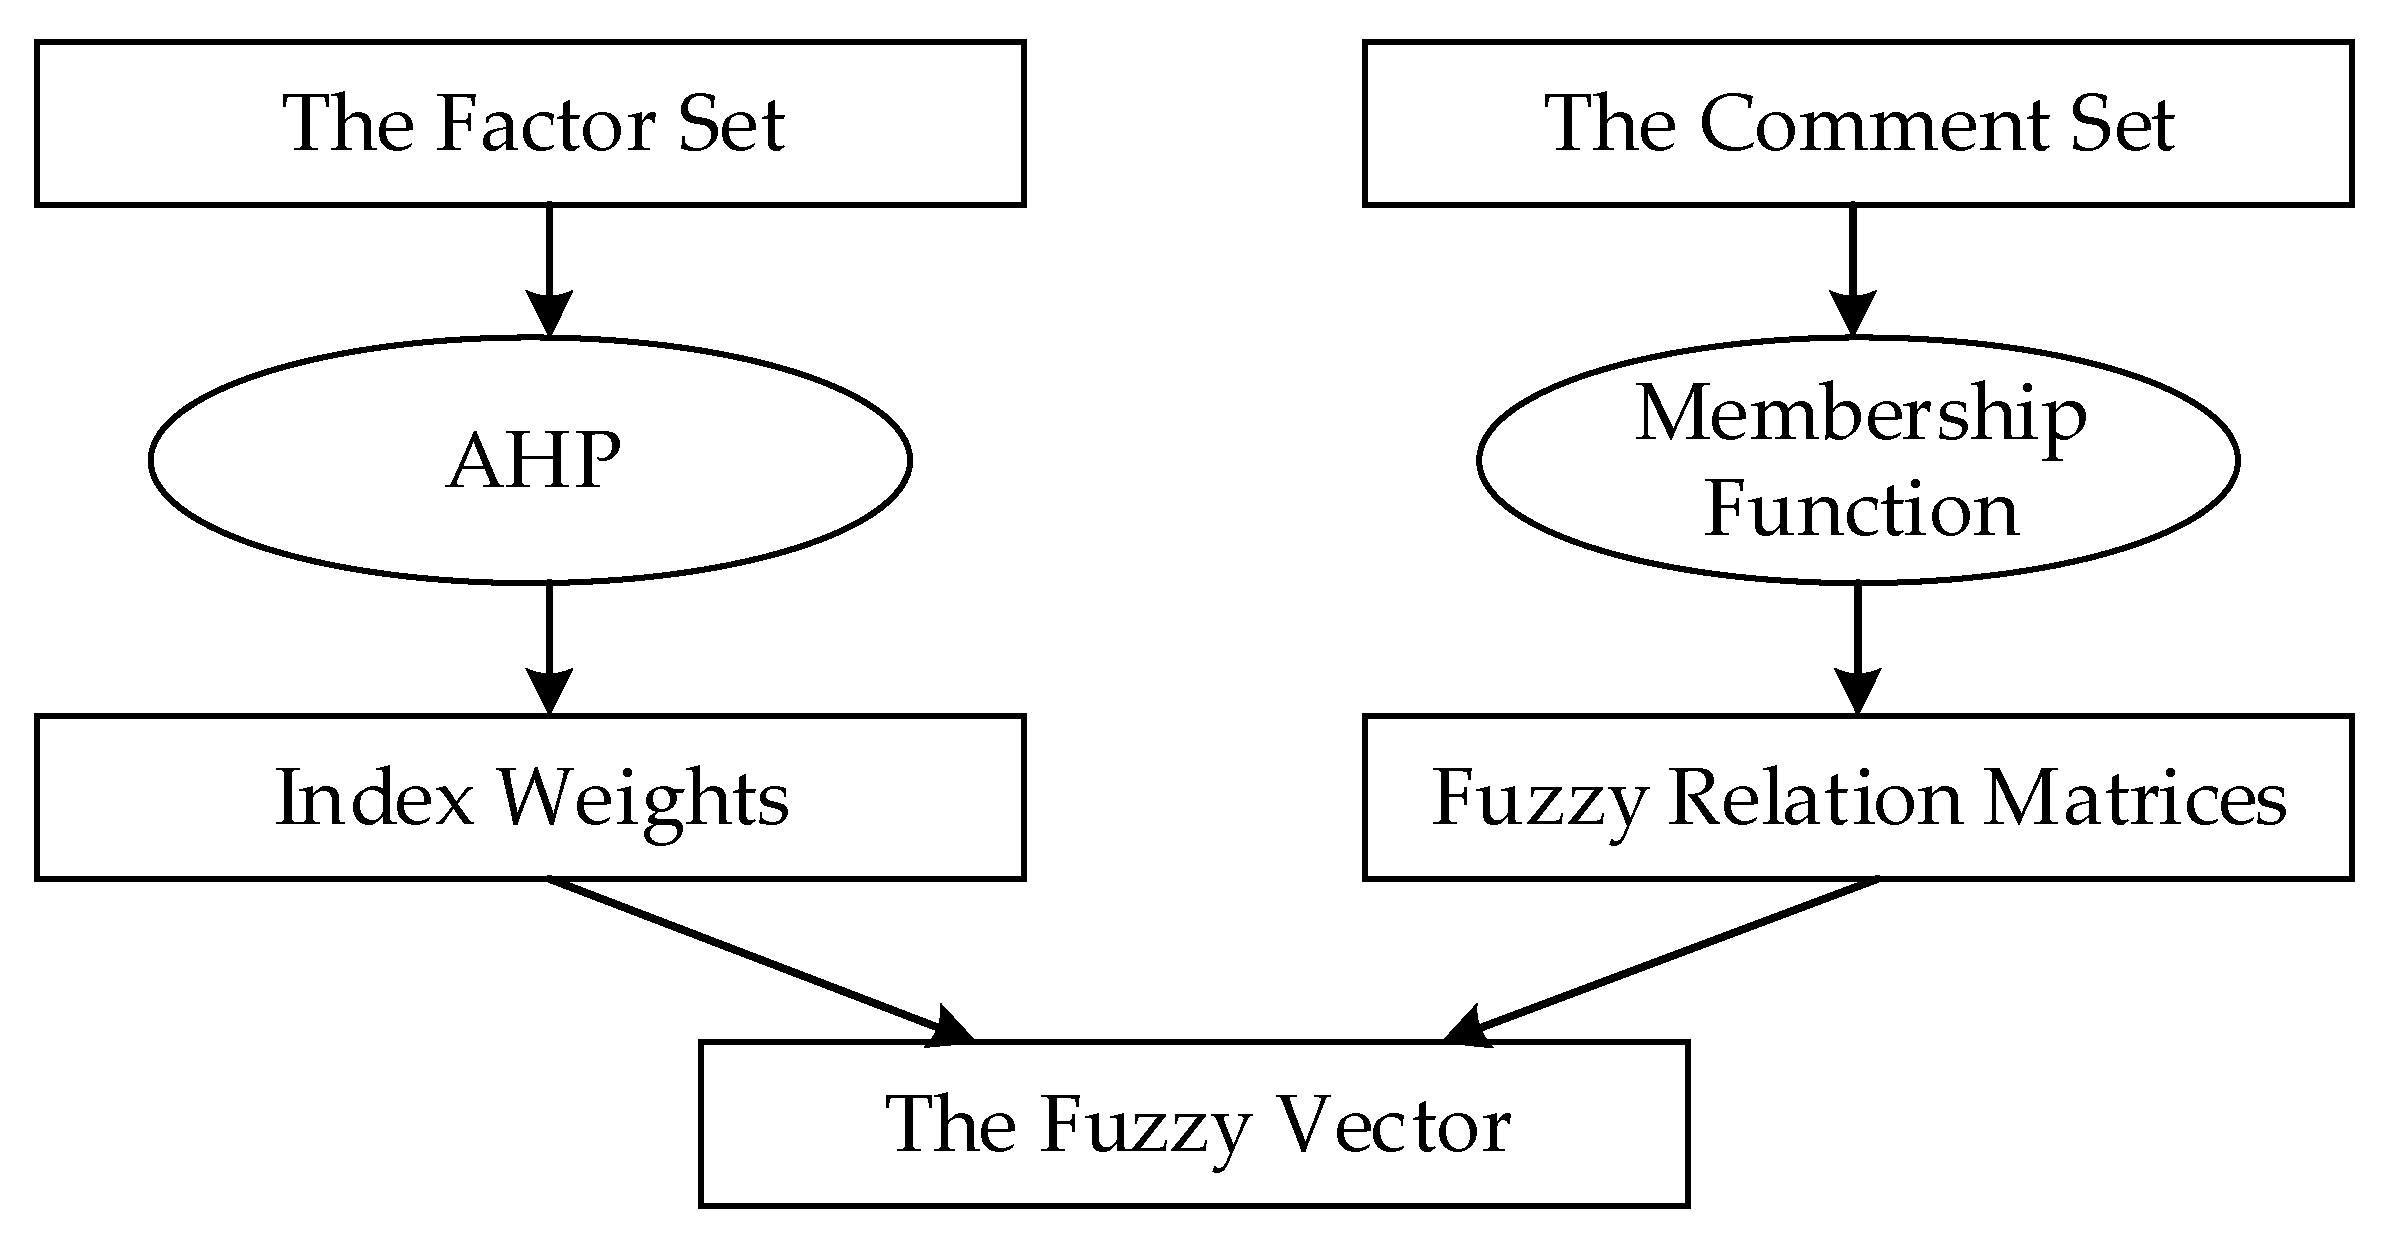
Figure 1. Modeling architecture.
Sustainability 12 02102 g001
Figure 2. Farmers’ satisfaction degree in 13 Chinese provinces: (a) 2003 (b) 2018. Data Source: China Statistical Yearbook, documents on the official website of the National Food and Strategic Reserves Administration of China.
Sustainability 12 02102 g002
Figure 3. The farmers’ average satisfaction and the comprehensive average satisfaction. Data Source: China Statistical Yearbook, documents on China’s four official websites mentioned in Section 2.1.
Sustainability 12 02102 g003
Figure 4. Wheat-cultivated areas. Data Source: China Statistical Yearbook.
Sustainability 12 02102 g004
Figure 5. Rice-cultivated areas. Data Source: China Statistical Yearbook.
Sustainability 12 02102 g005
Table 1. Minimum purchase prices of major grains in China from 2004 to 2019.
Variety20042005200620072008200920102011
Wheat0.720.720.770.870.90.95
Early indica rice0.70.70.70.70.770.90.931.02
Middle and late indica rice0.720.720.720.720.790.920.971.07
Japonica rice0.750.750.750.750.820.951.051.28
Variety20122013201420152016201720182019
Wheat1.021.121.181.181.181.181.151.12
Early indica rice1.21.321.351.351.331.31.21.2
Middle and late indica rice1.251.351.381.381.381.361.261.26
Japonica rice1.41.51.551.551.551.51.31.3
Unit: yuan per 0.5 kg.
Table 2. Evaluation indexes.
GroupEvaluation Index
The Government (B1)Satisfaction of cultivated area (C11)
Satisfaction of grain reserves (C12)
Satisfaction of acquisition cost (C13)
Farmers (B2)Satisfaction of planting income (C21)
Satisfaction of educational level (C22)
Satisfaction of urban-rural income gap (C23)
Grain enterprises (B3)Satisfaction of acquisition income (C31)
Satisfaction of business risk (C32)
Consumers (B4)Satisfaction of grain price (C41)
Satisfaction of grain supply (C42)
Table 3. Preference scale.
Relative   Scale   a i j Definition
1Equal importance between c i and c j
3Moderate importance of c i over c j
5Essential or strong importance of c i over c j
7Demonstrated importance of c i over c j
9Extreme importance of c i over c j
2,4,6,8Intermediate values between two adjacent judgments
Table 4. Values of the random consistency index RI.
n1234567891011
RI000.581.121.241.321.411.451.451.491.51
Table 5. Evaluation index hierarchy.
Target LayerCriterion LayerScheme Layer
Satisfaction of MPP policy (A)The Government (B1)Satisfaction of cultivated area (C11)
Satisfaction of grain reserves (C12)
Satisfaction of acquisition cost (C13)
Farmers (B2)Satisfaction of planting income (C21)
Satisfaction of educational level (C22)
Satisfaction of urban-rural income gap (C23)
Grain enterprises (B3)Satisfaction of acquisition income (C31)
Satisfaction of business risk (C32)
Consumers (B4)Satisfaction of grain price (C41)
Satisfaction of grain supply (C42)
Table 6. The consistency test results of the paired comparison matrices.
MatricesAB1B2B2B4
Consistency ratio0.04330.03320.055900
Table 7. The final weight of each evaluation index.
Criterion LayerB1B2B3B4
Weight0.570.260.110.06
Scheme layerC11C12C13C21C22C23C31C32C41C42
Weight0.360.150.060.190.050.020.080.030.050.01
Table 8. Satisfaction of 13 provinces in 2003 and 2018.
GovernmentFarmersEnterprisesConsumersAverage
Year2003201820032018200320182003201820032018
Hebei0.760.870.660.940.720.890.770.90.7230.9
Jiangsu0.750.80.660.90.790.950.780.990.7450.91
Anhui0.780.890.60.910.720.850.770.870.7180.88
Shandong0.790.90.650.90.720.840.760.880.730.88
Henan0.80.910.670.950.760.860.740.850.7430.893
Hubei0.790.90.70.940.720.880.760.840.7430.89
Jiangxi0.80.910.640.950.730.830.710.850.7380.885
Hunan0.780.930.670.950.710.840.730.840.7230.89
Guangxi0.790.890.640.950.70.870.760.860.7330.892
Liaoning0.770.90.70.940.70.910.770.870.7350.905
Jilin0.760.910.690.930.760.90.70.90.7280.91
Heilongjiang0.750.920.70.940.720.890.750.860.730.903
Sichuan0.780.90.710.960.750.870.740.860.7450.898
Average0.7770.8950.6750.9350.7310.8750.7490.8750.7330.895
Data source: China Statistical Yearbook, documents on China’s four official websites mentioned in Section 2.1.