Article

Time-Dependent Reliability-Based Service Life Assessment of RC Bridges Subjected to Carbonation under a Changing Climate

1
Key Laboratory of Performance Evolution and Control for Engineering Structures, Ministry of Education, Tongji University, 1239 Siping Rd., Shanghai 200092, China
2
Department of Structural Engineering, College of Civil Engineering, Tongji University, 1239 Siping Rd., Shanghai 200092, China
*
Author to whom correspondence should be addressed.
Sustainability 2020, 12(3), 1187; https://doi.org/10.3390/su12031187
Submission received: 23 December 2019 / Revised: 19 January 2020 / Accepted: 21 January 2020 / Published: 6 February 2020
(This article belongs to the Section Sustainable Engineering and Science)

Abstract

:
This paper assessed the service life of RC bridges subjected to carbonation under a changing climate based on time-dependent reliability analysis. First, a simplified carbonation model and the corresponding incremental method were briefly reviewed. Then, the fatigue damage prediction model and climate model were briefly introduced. Afterward, the Monte Carlo simulation-based time-dependent reliability analysis procedure for service life assessments was presented, which integrated the carbonation depth prediction model, fatigue damage prediction model and climate model. Based on the analysis procedure, a comprehensive case study was conducted to estimate the effects of climate change, fatigue damage, concrete cover thickness and concrete grade on the service life under different reliability levels. The case study showed that the service life under a reliability level of 2 is around half of that under the reliability level of 1. Under the reliability level of 1.5, the service life under RCP8.5 (a high emission scenario defined by Intergovernmental Panel on Climate Change) can be 28 years shorter than that under no climate changes. The service life at girder top undergoing compressive fatigue damage can be 49% shorter than that without fatigue damage and 25 years shorter than that at girder bottom undergoing tensile fatigue damage. The service life at girder top with a concrete cover thickness of 45 mm can reach 2.6 times that with a concrete cover thickness of 25 mm. The service life of C50 concrete can reach approximately 2–3 times that of C30 concrete. These findings inform civil engineers that for existing RC bridges, the effects of climate change and fatigue damage should be properly considered when the remaining service life of RC bridges is concerned. Moreover, for planned RC bridges, higher concrete grade and thicker concrete cover are two effective choices to achieve a longer service life.

1. Introduction

Corrosion of steel reinforcements is the key to deterioration of the mechanical performance of reinforced concrete (RC) members and structures [1,2,3,4,5]. Hence, a reliable assessment of the time to corrosion initiation in RC structures is of great importance for engineers and/or stakeholders to schedule timely maintenance and prevent severe corrosion-induced damage. Under a common atmospheric environment, when the carbonation depth reaches steel reinforcements and decreases the alkalinity there, steel reinforcements begin depassivation and corrosion in the presence of oxygen and water. Consequently, as one of main causes of corrosion initiation, the carbonation issue of concrete has drawn significant attention [6,7,8,9,10,11,12,13].
Under a realistic common atmospheric environment, RC bridges not only undergo carbonation but also bear repeated traffic loads. Repeated traffic loads cause fatigue damage in concrete, which means the initiation and propagation of microcracks [14,15], thereby influencing the carbonation process in concrete cover. The authors [16,17] first identified three common fatigue damage patterns, through field survey, and conducted representative experiments to explore the effects of fatigue damage (patterns) on the carbonation process. The experiments showed that both tensile and compressive fatigue damage patterns accelerate the carbonation process. Afterward, based on the experimental findings, the authors [18] developed and verified a unified numerical carbonation model which is able to predict carbonation depth developments in concrete with different fatigue damage patterns under constant exposure conditions. Although the numerical carbonation model predicts carbonation depths in fatigue-damaged concrete with very good accuracy, the huge computational costs required for solving partial differential equations make the numerical carbonation model difficult to handle by civil engineers. To resolve this difficulty, the authors [19] further developed a simplified carbonation model through comprehensive Monte Carlo simulations based on the numerical carbonation model. The carbonation depths predicted by the simplified carbonation model showed acceptable agreement with both the ones reported by experiments and the ones predicted by the numerical carbonation model.
The simplified carbonation model could predict the carbonation depth development in concrete with determined fatigue damage under constant exposure durations. However, Intergovernmental Panel on Climate Change (IPCC) identified in its 2013 report that both temperature and CO2 concentration in the atmosphere will increase gradually year by year [20]. That is, the annual mean values of environmental actions around RC bridges will be time-varying. Moreover, fatigue damage in concrete is also time-dependent as a result of gradual accumulation of traffic load cycles year by year [14,15]. Therefore, based on the simplified carbonation model, the authors [19] further proposed an incremental method which made it possible to predict carbonation depth developments in RC bridges subjected to time-varying fatigue damage and environmental actions.
Because of the time-variant stochastic nature of fatigue damage and environmental actions, uncertainty of concrete property and randomness of concrete cover thickness, the time to corrosion initiation, or the service life, as well as the carbonation depth evolution, in realistic RC bridges is highly scattered. This was substantiated by the field-tested carbonation depths in a 59-year-old highway RC bridge in Brazil [21]. To make a reasonable assessment of the service life of RC bridges, probabilistic analysis and reliability assessment are needed. Thiery et al. [22] conducted probabilistic analysis of carbonation depths and assessed the time to corrosion initiation of steel reinforcements which considered the randomness of environmental actions, concrete properties and concrete cover thickness. However, they ignored the effects of global climate change, i.e., time-varying annual mean values of temperature and CO2 concentration. Peng and Stewart [23] assessed the service life of RC structures under carbonation attack with considerations of climate change effects. Similar work has also been done by Park and Wang [13]. However, caution should be taken when extending these assessments to RC bridges as they did not consider the effects of time-dependent fatigue damage on the carbonation process in concrete. In fact, to conduct a more reliable assessment on the service life of RC bridges, both the time-varying fatigue damage and environmental actions should be considered.
Therefore, in this paper, the authors conducted time-dependent reliability-based service life assessment of RC bridges subjected to carbonation under a changing climate with considerations of time-varying fatigue damage and environmental actions. The assessment will output the time-dependent reliability curves, which will allow civil engineers or practitioners to predict the service life of RC bridges based on the required reliability level and will help them to choose the efficient measures to meet the required service life of RC bridges with the anticipated reliability level under the context of future global climate changes. This paper is organized as follows. First, the simplified carbonation model and the corresponding incremental method were briefly reviewed (Section 2). Then, the fatigue damage prediction model was briefly introduced (Section 3). Moreover, the climate model was briefly discussed (Section 4). Afterwards, the time-dependent reliability analysis procedure for service life assessment was presented (Section 5). In addition, a comprehensive case study was conducted to investigate effects of various factors or parameters on the service life (Section 6). Finally, several conclusions were drawn (Section 7).

2. Carbonation Depth Prediction Model

The carbonation depth evolution in concrete with constant fatigue damage under constant exposure conditions can be expressed as a function of exposure duration, concrete properties, environmental actions and fatigue damage as shown by Equation (1) [19]:
x c = f ( [ CH ] 0 ,   [ CSH ] 0 ,   φ pc Concrete   Properties ;   R H ,   T ,   [ CO 2 ] Environmental   Actions ; ε r Fatigue   Damage ;   t ) = ( k 0 · φ pc k 1 · ( 1 - R H ) k 2 · ( k 3 · T + k 4 ) + θ · | ε r | · ( k 5 · T + k 6 ) ) · 2 [ CO 2 ] [ CH ] 0 + 3 [ CSH ] 0 · t
where [CH]0, [CSH]0 and φpc are molar concentration (mol/m3) of calcium hydroxide (Ca(OH)2 denoted by CH) in concrete, molar concentration (mol/m3) of calcium silicate hydrate (3CaO∙2SiO2∙3H2O denoted by CSH) in concrete and porosity of carbonated cement paste, respectively; RH, T and [CO2] are relative humidity, temperature (°C) and molar concentration (mol/m3) of CO2 in the exposed environment; εr is the residual strain at exposed surface which represents the effect of fatigue damage; t is the exposure duration (sec); k0, k1, k2, k3, k4, k5, k6 and θ are fitting or calibrating coefficients.
It is worth emphasizing that Equation (1) holds only if the fatigue damage of concrete and exposure conditions keep as constants during the exposure duration. However, both fatigue damage and environmental actions are time-variant [11,16]. To consider these time-variant effects, an incremental method can be used [19]. As illustrated by Figure 1, the incremental method uses the carbonation depth at tn to calculate the carbonation depth at next time point tn+1. It is assumed that during a certain time interval between tn and tn+1, the exposure conditions (RH, T, CO2) and fatigue damage (εr) have achieved their respective average values (RHn+1/2, Tn+1/2, [CO2]n+1/2 and [εr]n+1/2) between those values at tn and tn+1. Hence, with RHn+1/2, Tn+1/2, [CO2]n+1/2 and [εr]n+1/2, Equation (1) can be used to describe the carbonation depth evolution between tn and tn+1, as follows:
x c = f ( ; R H n + 1 / 2 , T n + 1 / 2 , [ CO 2 ] n + 1 / 2 ; [ ε r ] n + 1 / 2 ; t )
However, at tn, carbonation depth has reached [xc]n. Consequently, before calculating [xc]n+1, the equivalent time t*n required to reach [xc]n under the constant environmental actions of RHn+1/2, Tn+1/2 and [CO2]n+1/2 and determined fatigue damage [εr]n+1/2 should be calculated inversely by Equation (2) as follows:
t n = f 1 ( ; R H n + 1 / 2 , T n + 1 / 2 , [ CO 2 ] n + 1 / 2 ; [ ε r ] n + 1 / 2 ; [ x c ] n )
Accordingly, the carbonation depth [xc]n+1 at tn+1 can be calculated by Equation (4) as illustrated in Figure 1:
[ x c ] n + 1 = f ( ; R H n + 1 / 2 , T n + 1 / 2 , [ CO 2 ] n + 1 / 2 ; [ ε r ] n + 1 / 2 ; t n + 1 )
in which, t*n+1 = t*n + τ and τ = tn+1tn. In such a way, the carbonation depth predictions in concrete under time-variant environmental actions and fatigue damage are addressed. Moreover, it can be seen from above discussion that time-varying residual strain, relative humidity, temperature and CO2 concentration are prerequisites if one wants to use the simplified carbonation model and the corresponding incremental method to predict carbonation depth developments in RC bridges under changing climate conditions and repeated traffic loads. The fatigue damage prediction model and climate model, which are able to predict time-varying residual strain and environmental actions at the exposed concrete surfaces, will be briefly introduced in Section 3 and Section 4, respectively.

3. Fatigue Damage Prediction Model

As expressed in Equation (1), the effects of traffic loads on the carbonation processes reside in the residual strain at the exposed surface. The authors [15] have proposed a fatigue damage prediction model which could predict the residual strains over a cross section with considerations of stress and strain redistributions during fatigue loading cycles given the (repeated) axial load and moment on the cross section. Figure 2 illustrates a representative cross section with stress and strain distributions during fatigue loading.
As shown by Figure 2b, the strain is composed of two parts: the elastic strain εe(z,t) and the fatigue creep strain εcrp(z,t). Hence, the time-varying strain distribution on the cross section can be calculated by Equation (5).
ε ( z , t ) = ε e ( z , t ) + ε crp ( z , t ) = ε ( 0 , t ) κ ( t ) · z
in which, the original point of coordinate z is set at the centroid of the cross section (see Figure 2a); ε(0,t) and κ(t) denote the strain at the original point and the curvature (1/mm) of the cross section, respectively, at time point t, which can be calculated by Equations (6) and (7), respectively.
ε ( 0 , t ) = 1 A · c b c t ε crp ( z , t ) · b ( z ) · d z P E c A
κ ( t ) = 1 I · c b c t ε crp ( z , t ) · b ( z ) · z · d z + M E c I
where P and M are axial load (N) and moment (N·mm) on a cross section; I and A are the moment of inertia (mm4) and area (mm2) of the cross section; b(z) is the width of the cross section (mm); ct and cb are distances (mm) of the centroid axis to the top and bottom surfaces of the cross section, respectively; Ec is the elastic modulus of concrete (MPa); εcrp(z,t) is the time-varying distributions of fatigue creep strain. Only elastic strains generate stresses on the cross section. Thus, the time-varying stress distributions can be calculated by Equation (8).
σ ( z , t ) = E c · ε e ( z , t ) = E c · ( ε ( z , t ) ε crp ( z , t ) )
As shown by Equations (5) and (8), the time-varying fatigue creep strain distribution is of essence to calculate the time-varying strain and stress distributions on the cross section during fatigue loading. Under constant-amplitude fatigue loads, the fatigue creep strain of concrete evolves following Equation (9) [15].
ε crp = a 0 · σ m · ( N f r ) 1 / 3 + b 0 · σ m · ( Δ σ f c ) 2 · N 1 / 3
In Equation (9), a0 and b0 are calibrating coefficients with test data; N and fr are fatigue load cycles and frequency (cycles/hour), respectively (i.e., N/fr is time in hours); σm and Δσ denote the mean stress and stress range (N/mm2), respectively; fc′ is concrete strength (N/mm2). Because stresses on a cross section redistribute during fatigue loading process, the mean stress and stress range at each height z may be time-varying and should be updated cycle by cycle through an incremental method when Equation (9) is used to calculate the fatigue creep strain distributions. More details about the incremental method can be found in Jiang et al. [15]. Moreover, through setting P and M in Equations (6) and (7) as zero, we could calculate residual stresses and strains over a cross section by Equations (8) and (5), respectively. In such a way, the time-evolving residual strains at the bottom and top points of a cross section during the fatigue loading process can be predicted. In summary, for a cross section in an RC bridge with determined geometric features (I, A, h, cb, ct and b(z)), concrete properties (Ec and fc′) and calibrating coefficients (a0 and b0), through inputting fatigue load information (Pmax, Pmin, Mmax, Mmin and fr), the fatigue damage prediction model outputs time-variant stress and strain distributions (including residual ones) over the cross section.

4. Climate Model

IPCC defined four representative concentration pathway (RCP) scenarios in its 2013 report, i.e., RCP2.6, RCP4.5, RCP6 and RCP8.5, to describe future global climate changes [20]. Under each RCP scenario, the annual mean values of the atmospheric CO2 concentration by the year 2100 are illustrated by Figure 3. Corresponding to each RCP scenario, the annual mean value of atmospheric temperature also changes year by year. Figure 4 illustrates the annual mean values of atmospheric temperatures in Shanghai under RCPs by the year 2100. Theoretically, the amount of moisture in air will increase as global warming accelerates the evaporation of water from the ocean to the atmosphere. However, no significant increase of annul relative humidity has been found in field monitoring data in the past decades [24]. Hence, IPCC did not report the changes of atmospheric relative humidity in its 2013 report. In this paper, we accepted the assumption that the annual mean values of relative humidity are time-invariant and keeps its value at the year 2013. In Figure 3 and Figure 4, the horizontal straight line represents a supposed climate case that the CO2 concentration and temperature in the year 2013 through 2100 will keep the same as their respective annual mean values in 2013. That is, this is a case without climate change.

5. Service Life Assessment Based on Time-Dependent Reliability Analysis

5.1. Summary of Random Variables

The random variables involved to conduct probabilistic analysis are summarized in Table 1. These random variables are categorized into four groups: concrete parameters, environmental actions, fatigue load and model parameters. Among them, environmental actions are considered as stochastic processes with annual mean values taken as those illustrated in Figure 3 and Figure 4 for CO2 concentration and temperature, respectively, under each RCP scenario (take Shanghai as an example). The relative humidity is assumed as a stationary stochastic process with the annual mean value taken as the same as the one in the year 2013. The environmental actions at each year can be assumed to follow normal distributions with empirically chosen coefficients of variations (CVs). Moreover, following the assumption made by Bastidas-Arteaga et al. [2], the moment induced by traffic loads (ML) is considered as a time-invariant random variable, instead of a time-variant stochastic process, for simplicity. With a group of samples of random variables, stochastic processes and other necessary parameters, the time-varying carbonation depths can be predicted by the simplified carbonation model and the incremental method introduced in Section 2.

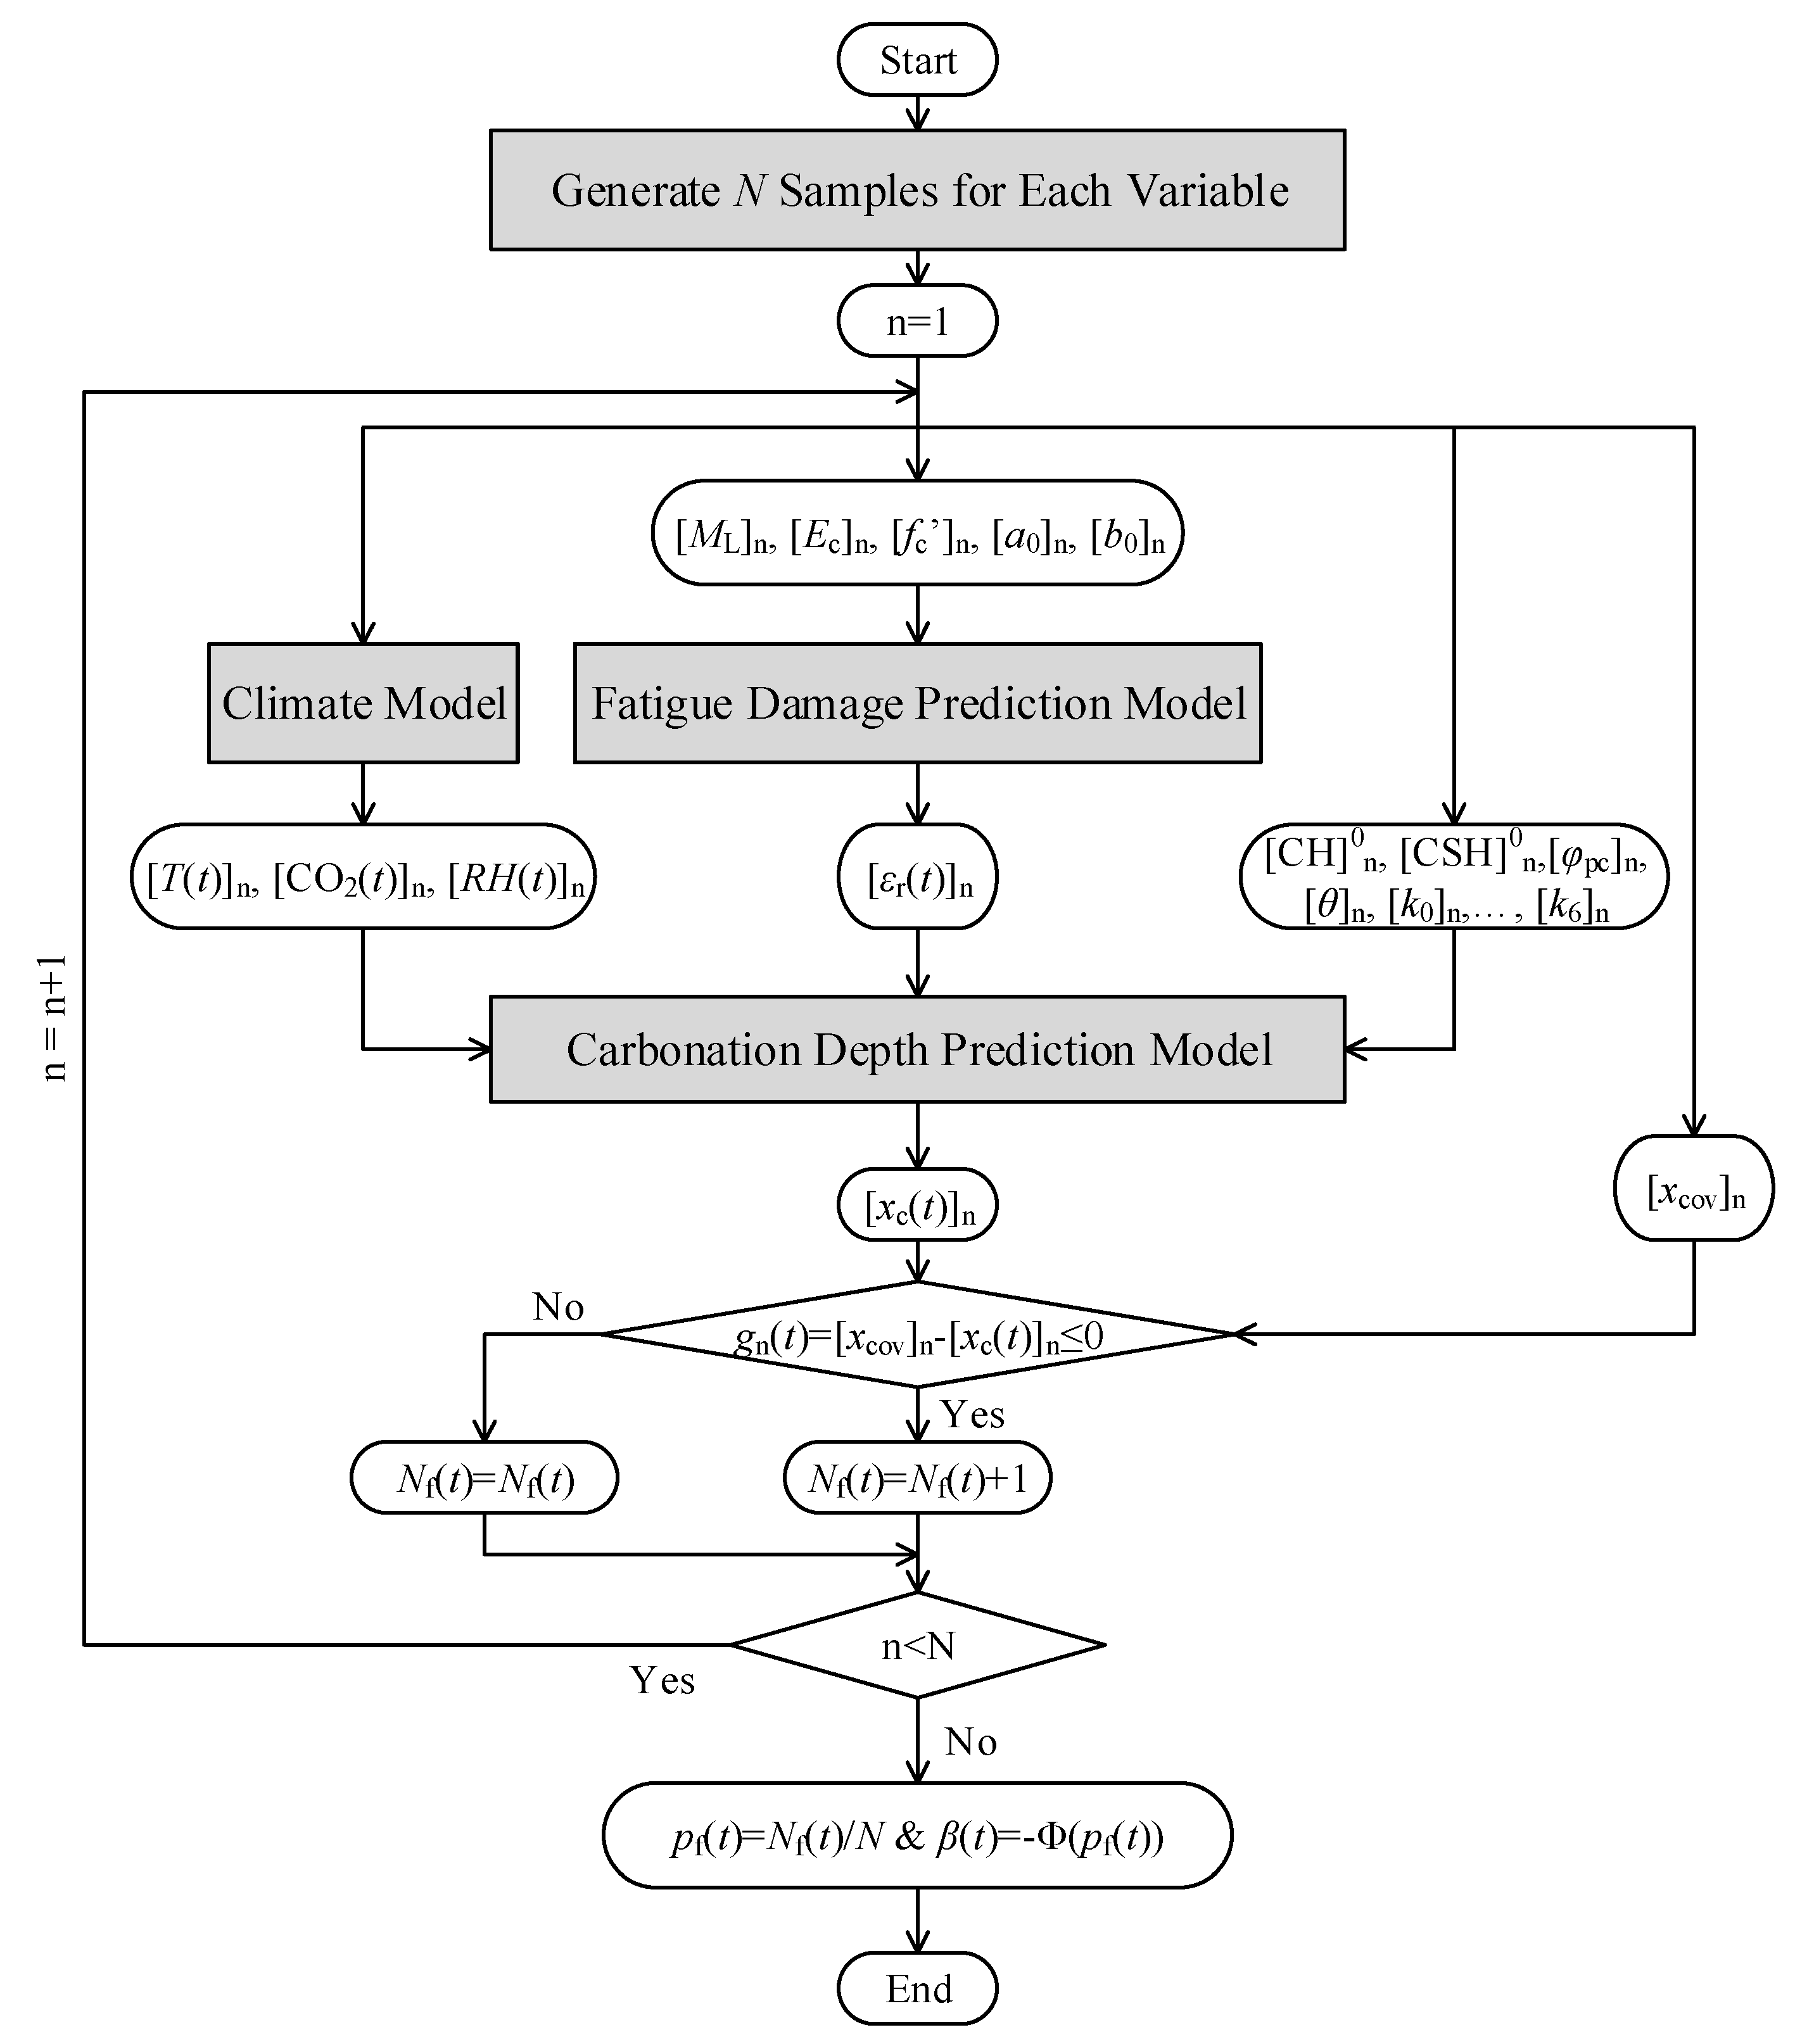
5.2. Time-Dependent Reliability Analysis Procedure

In this paper, the service life of an RC bridge subjected to carbonation is defined as the time to corrosion initiation induced by carbonation of concrete, i.e., the time when carbonation depth gets through the concrete cover and reaches the surface of steel reinforcements. Then, the limit state function can be expressed by Equation (10):
g ( t ) = x cov x c ( t )
where xcov is the concrete cover thickness; xc(t) is the time-varying carbonation depths. Hence, the time-varying failure probabilities and reliability indexes can be calculated by Equations (11) and (12), respectively.
p f ( t ) = Pr ( g ( t ) 0 )
β ( t ) = Φ ( p f ( t ) )
Monte Carlo method was used to calculate the time-dependent failure probability and corresponding reliability index, as illustrated by Figure 5. First, generate N samples for each random variable summarized in Table 1. For each environmental action, i.e., temperature, relative humidity or CO2 concentration, N samples are generated at each time point, which contribute to N time-varying samples for this environmental action ([T(t)]n, [CO2(t)]n or [RH(t)]n). Then, input a certain vector of {[ML]n, [Ec]n, [fc’]n, [a0]n, [b0]n} into the fatigue damage prediction model to obtain a time-varying residual strain sample [εr(t)]n. Afterwards, input the time-varying residual strain sample [εr(t)]n and environmental actions ([T(t)]n, [CO2(t)]n and [RH(t)]n) into the carbonation depth prediction model to output a time-variant carbonation depth sample [xc(t)]n. Subsequently, compare [xc(t)]n with [xcov]n at each time point t and calculate the number of failure cases Nf(t) that gn(t) = [xcov]n − [xc(t)]n ≤ 0 among all N cases. Finally, calculate the failure probability at time t as pf(t) = Nf(t)/N and time-dependent reliability index by Equation (12). In such a way, the time-dependent failure probability and reliability index are addressed.

6. Case Study

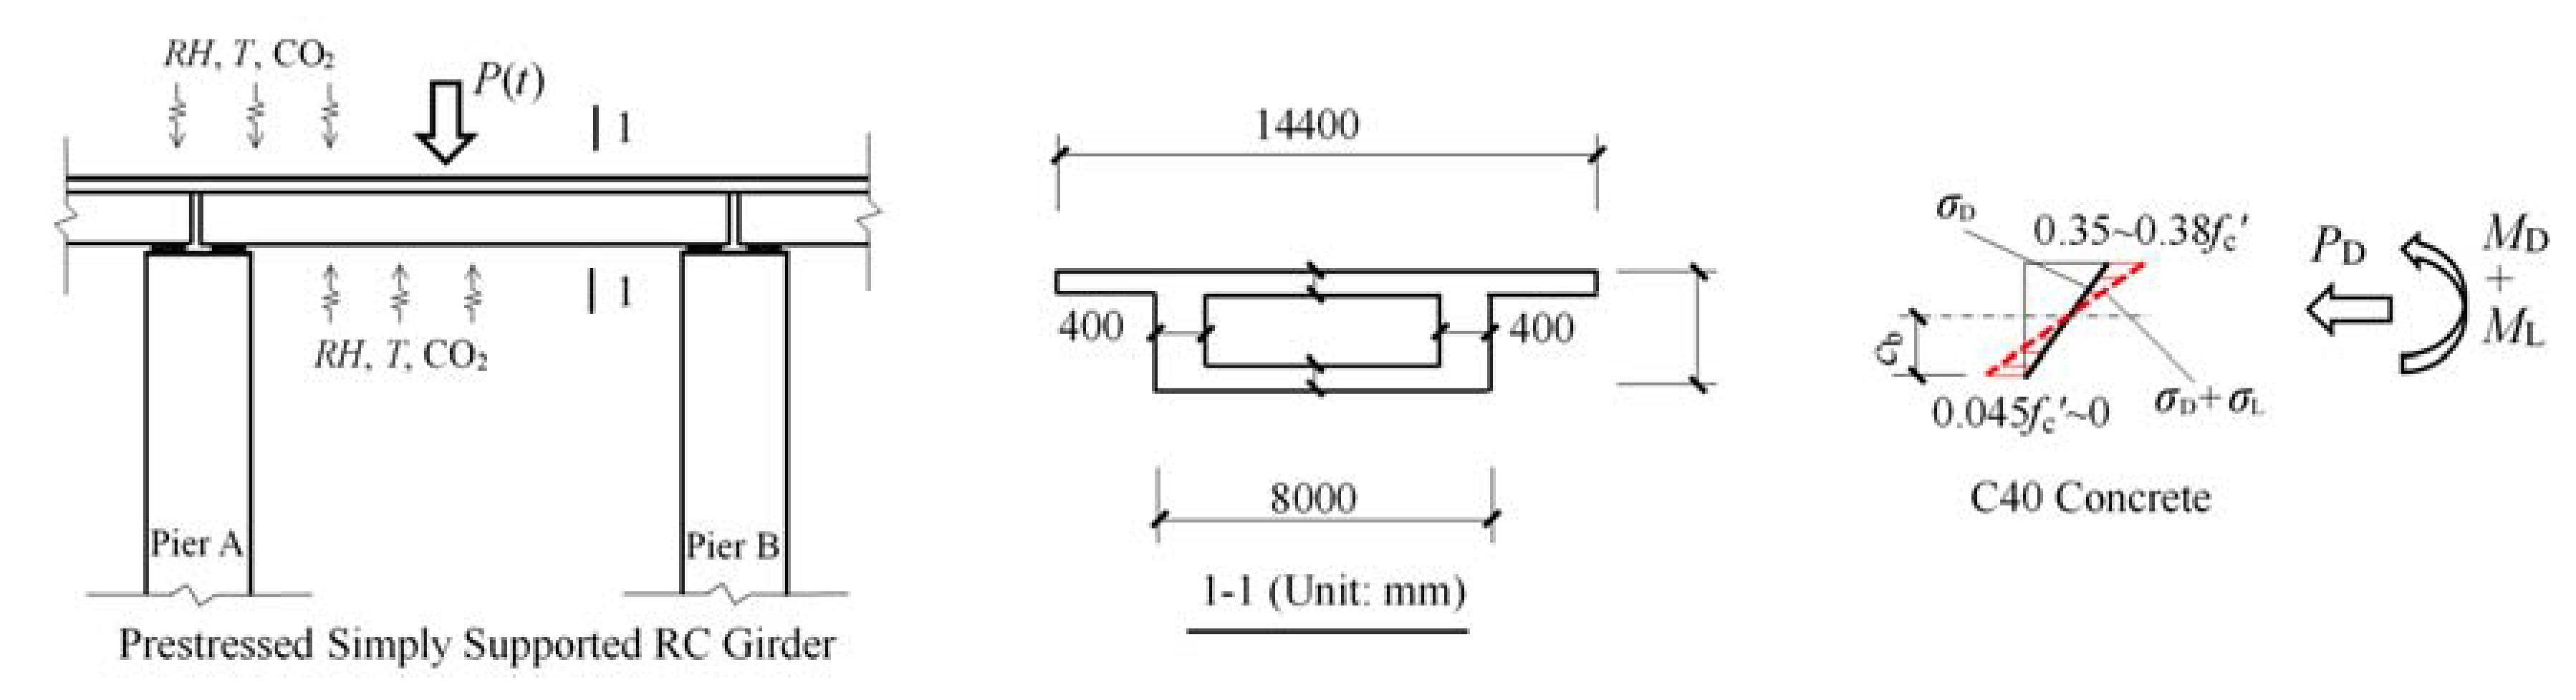
6.1. Problem Description

A representative RC bridge was built in 2013 in Shanghai to support the highway network there, in which the RC girder is prestressed and simply supported on the piers, as illustrated by Figure 6. It is thus of interest to assess the service life of this RC girder under the context of global climate change and repeated traffic loads by the year 2100. The effects of climate change, fatigue damage, concrete cover thickness and concrete grade on the service life of this RC bridge are particularly concerned. The dimensions and representative initial stress distributions of the cross section of the prestressed RC girder are shown in Figure 6. Geometric features and loads of the cross section are summarized in Table 2. PD and MD are axial force and moment resulting from dead loads including gravity effects and prestressing forces. ML is the moment induced by traffic loads. Following Bastidas-Arteaga et al.’s work [2], it is assumed that the fatigue loading frequency does not change over time and takes 20,000 cycles/year. Three different commonly used concrete grades, i.e., C30, C40 and C50, were designed, according to the China Industry Standard [25]. The mix design of these concretes are shown in Table 3. The material and mechanical properties of these concretes are shown in Table 4. Three different climate conditions were considered: (i) 2013, (ii) RCP4.5 and (iii) RCP8.5. The climate condition 2013 means that the annual mean values of environmental actions, including RH, T and CO2 concentration, are taken as the same as those in 2013, i.e., ignoring climate change. The climate conditions RCP4.5 and RCP8.5 refer to those discussed in Section 4. In other words, climate conditions 2013, RCP4.5 and RCP8.5 represent no climate change, moderate climate change and severe climate change cases, respectively.

6.2. Random Variables and Stochastic Processes

Distributions of random variables involved in this case study are summarized in Table 5. Except for ML which is assumed to follow lognormal distributions following Bastidas-Arteaga et al.’s work [2], all other variables are assumed to follow normal distributions. The mean values of material and mechanical properties of designed concretes are shown in Table 4; the CVs of concrete strength and elastic modulus are assumed to be 0.15 and 0.12 following Bastidas-Arteaga et al.’s work [2] and Peng and Stewart’s work [23], respectively; the CVs of [CH]0, [CSH]0 and φpc are taken as the same as those assumed by Thiery et al. [22]. The means and CVs of model parameters k0, …, k6 are taken from Refs. [19] and Thiery et al. [22], respectively. The mean and CV of θ follow the recommendations made by Jiang et al. [19]. The means of a0 and b0 are taken from Jiang et al. [15] and three different CVs are assumed for them and ML to investigate influences of fatigue damage on the time-dependent reliability. The means of [CO2](t) and T(t) under each RCP scenario are illustrated in Figure 3 and Figure 4, respectively. In climate 2013 case, the means of [CO2](t) and T(t) are taken as the same as the annual mean values in the year 2013. In either climate 2013, RCP4.5 or RCP8.5 case, the mean of RH(t) is assumed as a constant, i.e., 71.32%, the annual mean value of RH in Shanghai in 2013, as discussed in Section 4. Three different CVs of environmental actions under each climate condition are adopted to explore the effects of variations of environmental actions on the time-dependent reliability. A reference case is defined to comprise C40 concrete under RCP4.5 with other distribution parameters specified in Table 5. When the effects of climate change, fatigue damage, concrete cover thickness or concrete grade were about to investigated, the investigating factor or parameter was subject to change while all other factors or parameters were taken as the same as those in the reference case (see Table 5). In the calculations, the sample number was set as 1,000,000 for each random variable. The calculations were realized by a desktop with an Intel(R) Core(TM) i7-9700K CPU @ 3.60 GHz and an RAM of 32 GB.
Figure 7, Figure 8 and Figure 9 illustrate representative samples for time-varying stochastic CO2 concentration, temperature and relative humidity, respectively, under RCP4.5 with an identical CV of 0.25. Figure 10 shows the typical time-varying residual strain samples for C40 concrete at the girder top with CVs of ML and a0/b0 taken as 0.2 and 0.25, respectively. Figure 11 delineates the time-varying carbonation depth samples calculated with time-varying samples of environmental actions shown in Figure 7, Figure 8 and Figure 9 and residual strain shown in Figure 10. While calculating the residual strain at the concrete top and bottom by the fatigue damage prediction model shown in Section 3, the depth of the cross section was divided into 1000 strips. With the time-varying samples of carbonation depths and time-invariant samples of concrete cover thickness, the time-varying failure probability and reliability index can be addressed by the Monte Carlo simulation shown by Figure 5.

6.3. Results and Discussion

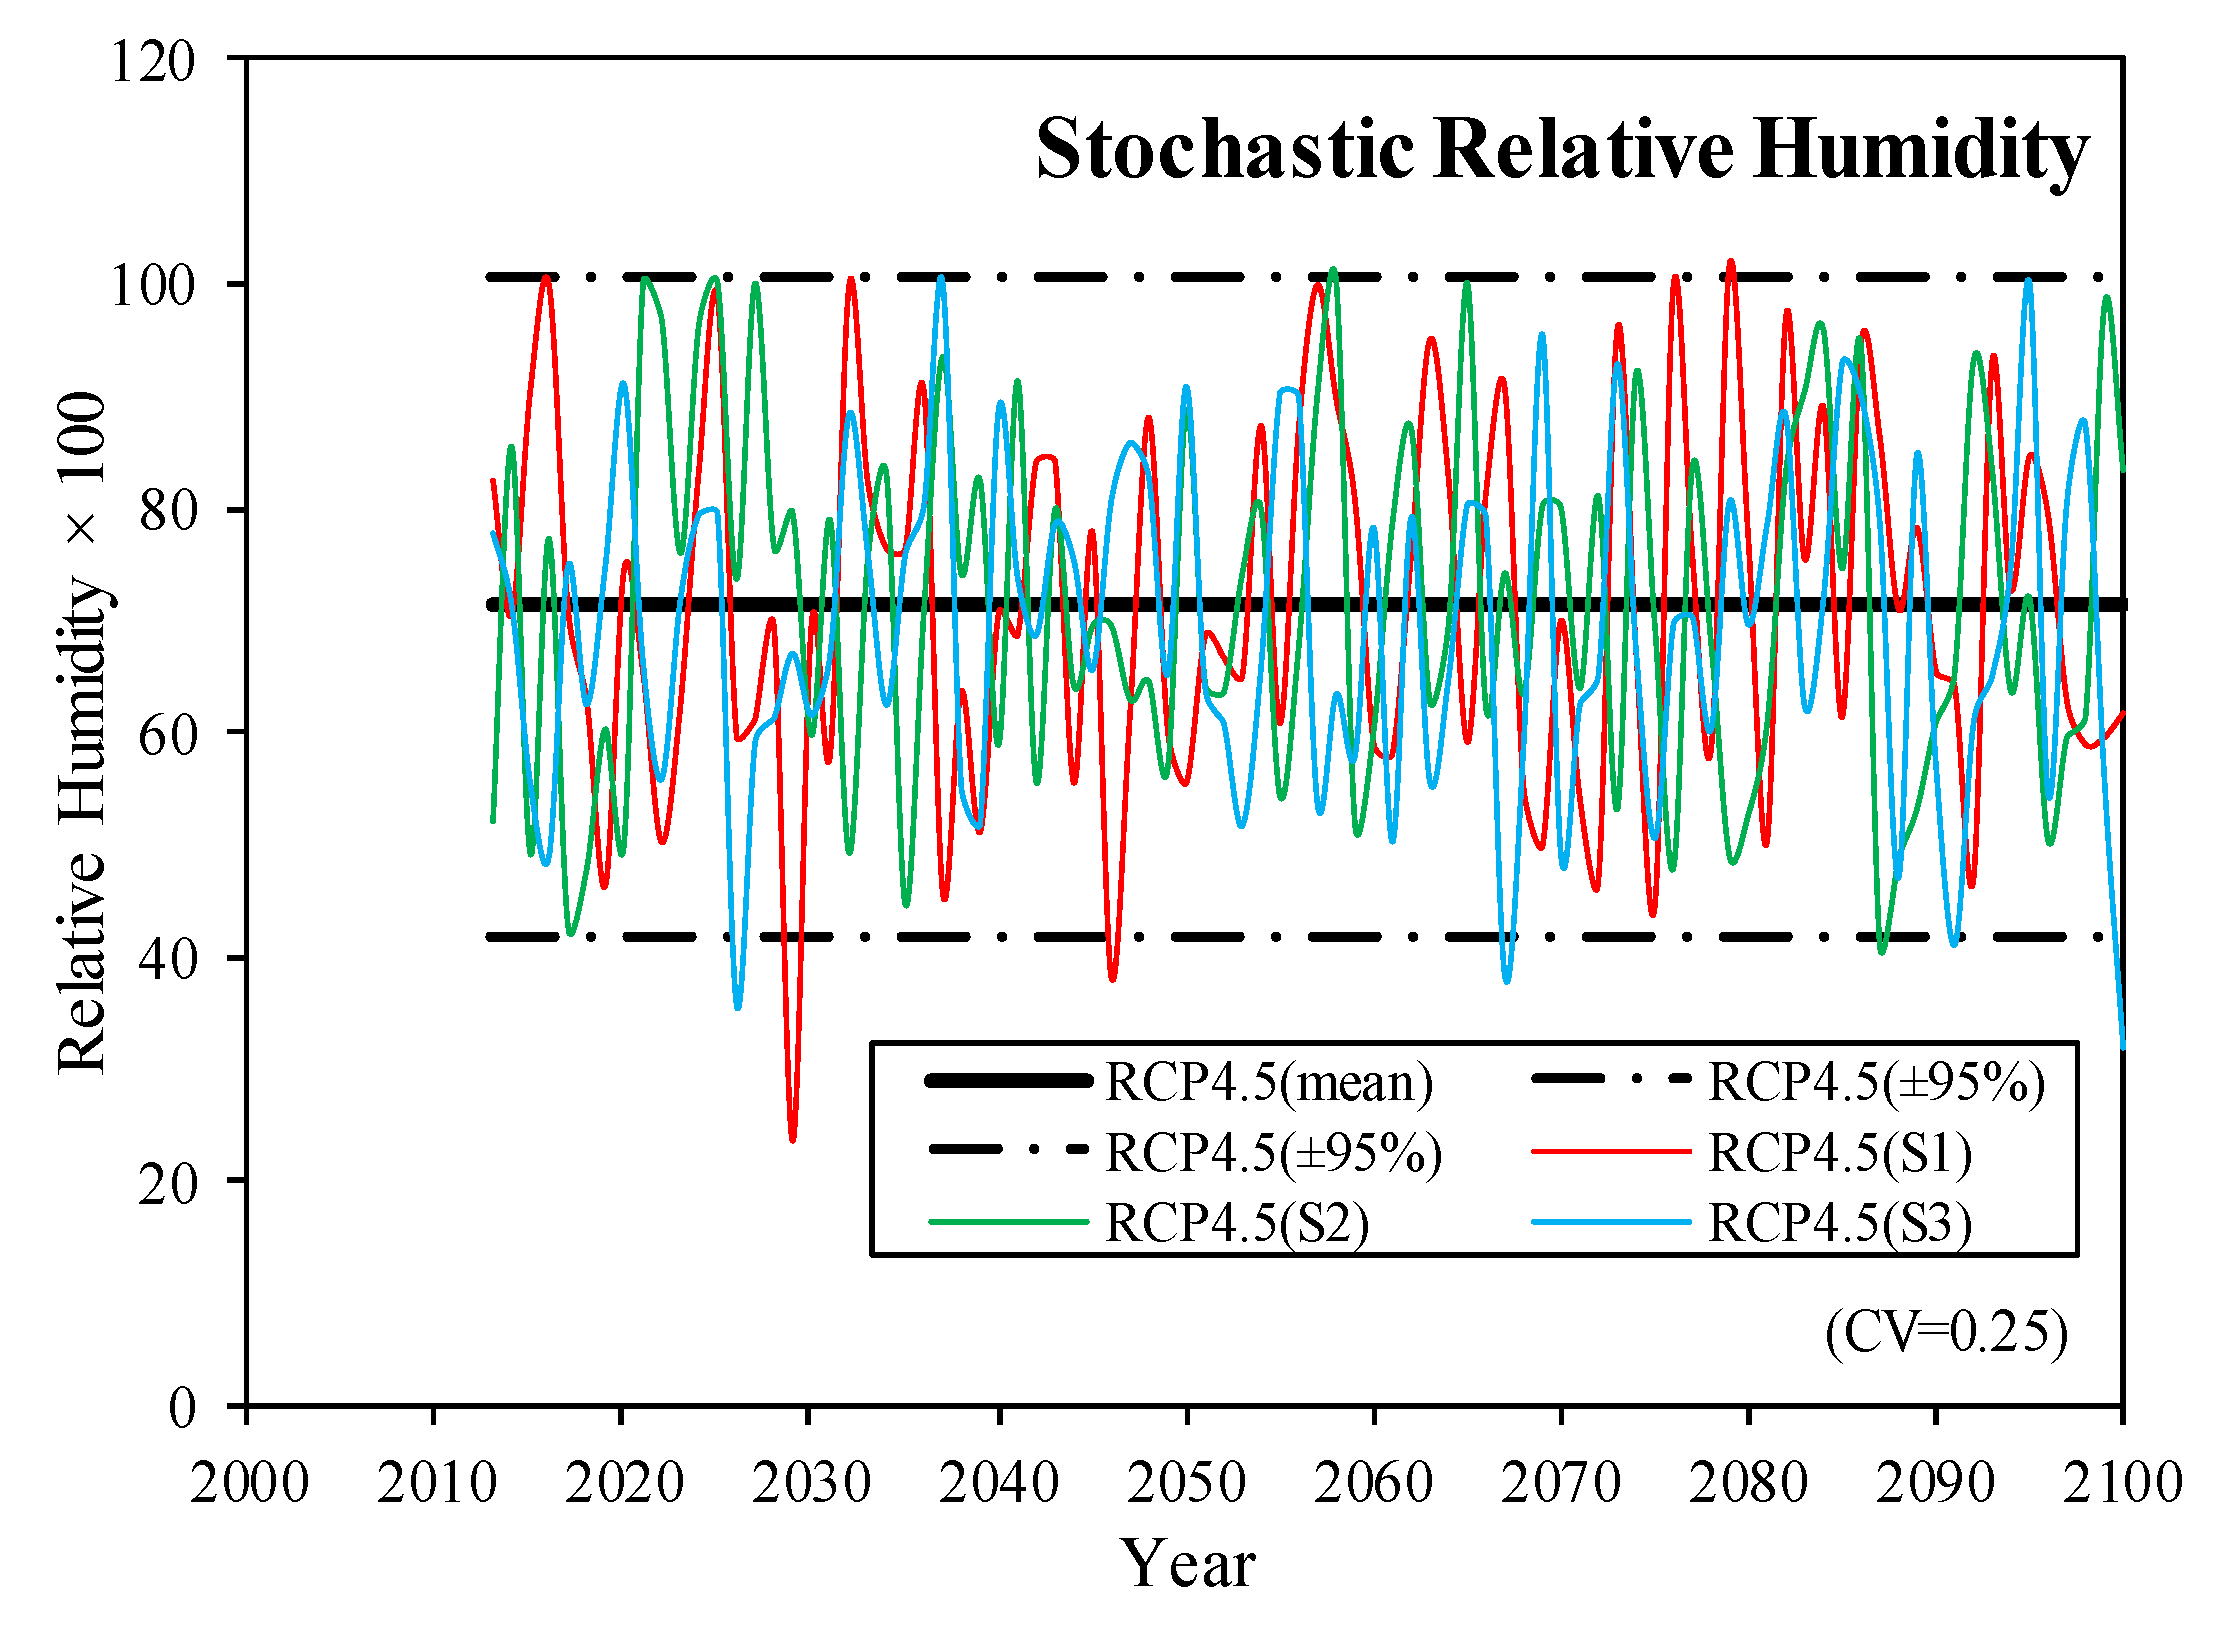
6.3.1. Effects of Climate Change

Figure 12 shows the effects of climate change on the time-dependent reliability indexes predicted at the RC girder bottom and top with tensile and compressive fatigue damage, respectively. Through comparing the cases under 2013 climate conditions, RCP4.5 and RCP8.5 with the same CV, it is found that the more severely the climate changes, the faster the reliability index drops with time. This is caused by the fact that the severer the climate change, the higher the annual mean values of temperature and CO2 concentration, which undoubtedly lead to deeper carbonation depths given the same exposure time. Moreover, under the same climate condition, the variations of the environmental actions have noticeable effects on the time-dependent reliability indexes. As shown by Figure 12, no matter it is at the girder bottom or top, under the same climate condition, either 2013, RCP4.5 or RCP8.5, the higher are the CVs, the faster does the reliability index decline with time.
With time-varying reliability indexes, the service life can be identified at girder top and bottom under different climate conditions. Table 6 shows the service life of the RC girder with reliability indexes of 1, 1.5 and 2, corresponding to low, medium and high reliability levels, respectively. As shown by each column of Table 6, the higher the reliability level, the shorter the service life. The service life under reliability level of 2 is usually around half of that under reliability level of 1. Moreover, under the same climate condition and reliability level, the CVs of environmental actions have obvious influences on the service life. With CVs of environmental actions increasing from 0.15 to 0.35, the service life decreases 4–15 years or so. In addition, the service life under RCP8.5 is usually much shorter than that under climate condition 2013 without climate change with the same reliability level and CV for environmental actions. For example, the service life under RCP8.5 can be 28 years shorter than that under climate condition 2013 with the same CV of 0.25 and the same reliability level of 1.5 at the girder bottom. These findings have undoubtedly confirmed that climate change has remarkable impacts on the service life of RC bridges and thus it should be properly considered if civil engineers intend to make reliable service life assessments or predictions and schedule timely maintenance in the future.

6.3.2. Effects of Fatigue Damage

Figure 13 shows the effects of fatigue damage on the time-dependent reliability indexes. Both the reliability index at girder top considering compressive fatigue damage and that at girder bottom considering tensile fatigue damage decline much faster than the reliability index without considering fatigue damage, showing noticeable influences of fatigue damage on the time-dependent reliability indexes. Moreover, the reliability index at girder top considering compressive fatigue damage drops much faster with time than that at girder bottom considering tensile fatigue damage. This may be caused by the fact that the stresses borne by concrete at top are much larger than those at bottom (as shown by Figure 6), which may lead to a severer fatigue damage at the top as compared to that at bottom. Hence, the carbonation depth may develop much faster in the compressive top than in the tensile bottom, which can be substantiated by certain cases in our previous test results [17]. As a result, the faster carbonation evolution at top certainly causes a faster drop of the reliability there than that at bottom given the same other conditions. In addition, the variations of fatigue creep model parameters a0/b0 and moment induced by traffic loads show very limited influences on the time-dependent reliability indexes, as demonstrated by the nearly overlapped time-dependent reliability index curves with different CVs illustrated in Figure 13.
Table 7 and Table 8 show the effects of fatigue damage on the service life of RC girders under different reliability levels. Corresponding to nearly overlapped time-dependent reliability index curves, the service life is almost the same under the same reliability level among three different cases of CVs of fatigue creep model coefficients and ML. As shown in Table 7 and Table 8, the service life differences among three different CV cases do not exceed 2 years at girder bottom and top. However, the service life at girder top considering compressive fatigue damage can be 49% shorter than that without considering fatigue damage under the reliability level of 1.5. Moreover, under the same reliability level of 1.5, the service life at girder top can be 25 years shorter than that at girder bottom due to the fatigue damage differences. These findings demonstrate the remarkable influences of fatigue damage on the service life predictions for RC bridges.

6.3.3. Effects of Concrete Cover Thickness

Figure 14 depicts the effects of concrete cover thickness on the time-dependent reliability indexes. Obviously, the concrete cover thickness poses noticeable influences on the time-dependent reliability indexes. The thicker the concrete cover, the more slowly the reliability index declines with respect to exposure time at either girder top or bottom. With the time-dependent reliability indexes in cases of different concrete cover thicknesses, the service life under different reliability levels can be predicted as shown in Table 9. Under the same reliability level at either girder top or bottom, a thicker concrete cover leads to a much longer service life. For example, under the reliability level of 1.5, the service life at girder top with concrete cover thickness of 45 mm can reach 2.6 times that with concrete cover thickness of 25 mm. That is, the concrete cover thickness can have very remarkable influences on the service life of RC bridges subjected to carbonation.

6.3.4. Effects of Concrete Grade

Figure 15 delineates the effects of concrete grade on the time-dependent reliability indexes. Obviously, a lower concrete grade contributes to a faster drop of the reliability index with respect to exposure time. Concrete of higher grade usually has a smaller porosity and higher concentrations of carbonatable constituents (see Table 4) which result in a slower development of carbonation depth as shown in Equation (1). Moreover, concrete of higher grade usually has larger elastic modulus and strength (see Table 4), which cause smaller residual strains given the same axial load and moment on the cross section, as indicated by the fatigue damage prediction model presented in Section 5. That is, the fatigue damage develops more slowly in concrete with a higher grade, leading to a slower development of carbonation depths in concrete with a higher grade. All in all, because of these reasons, the reliability index in concrete with a higher grade usually decreases more slowly than that in concrete with a lower grade. Table 10 shows the effects of concrete grade on the service life predictions under different levels of reliability. Under the same reliability level, the higher the concrete grade, the longer the predicted service life. For example, at the girder top, the service life of C50 concrete can reach 2–3 times that of C30 concrete, demonstrating the very remarkable effects of concrete grade on the service life predictions.

7. Conclusions

  • The higher the required reliability level, the shorter the service life. The service life under reliability level of 2 is usually around half of that under the reliability level of 1. Time-dependent reliability curves allow the designers or stakeholders to schedule the maintenance at different service times under different anticipated reliability levels.
  • Climate change has remarkable influences on the service life of RC bridges. The more severely the climate changes, the faster the reliability index drop with respect to exposure time. Under the same reliability level, the service life under RCP8.5 is usually much shorter than that under the climate condition without climate change. For example, the service life under RCP8.5 can be 28 years shorter than that under no climate change condition with the same CV of 0.25 and the same reliability level of 1.5 at the RC girder bottom. This informs civil engineers and practitioners that the effects of climate change should be properly considered when the remaining service life of RC bridges in the future is concerned.
  • Fatigue damage has noticeable effects on the service life of RC bridges. The service life at girder top considering compressive fatigue damage can be 49% shorter than that without considering fatigue damage under the reliability level of 1.5. Moreover, under the same reliability level of 1.5, the service life at girder top can be 25 years shorter than that at girder bottom due to the fatigue damage difference. However, the effects of variations of fatigue creep model parameters and fatigue load on the service life are limited. This finding tells the designers that the service life assessment or prediction for RC bridges should be associated with the mechanical analysis; otherwise, ignoring the effects of fatigue damage induced by repeated loads will greatly overestimate the service life.
  • A thicker concrete cover leads to a slower drop of reliability index with respect to exposure time. Under the reliability level of 1.5, the service life at girder top with concrete cover thickness of 45 mm can reach 2.6 times that with concrete cover thickness of 25 mm. Obviously, a thicker concrete cover thickness should be an effective choice to achieve a longer service life.
  • The higher the concrete grade, the longer the predicted service life. At the girder top, the service life of C50 concrete can reach approximately 2–3 times that of C30 concrete under the same reliability level. Likewise, a higher concrete grade should be another effective measure to achieve a longer service life.

Author Contributions

Conceptualization, C.J. and J.F.; methodology, C.J.; software, C.J.; validation, C.J. and J.F.; formal analysis, C.J.; investigation, C.J.; resources, C.J.; data curation, C.J.; writing—original draft preparation, C.J.; writing—review and editing, C.J.; visualization, C.J.; supervision, C.J.; project administration, C.J.; funding acquisition, C.J. All authors have read and agreed to the published version of the manuscript.

Funding

This research was funded by the National Natural Science Foundation of China, grant number 51908417, and International Postdoctoral Exchange Fellowship Program 2017 issued by the Office of China Postdoctoral Council, approval number 32nd Doc. Of OCPC, 2017.

Acknowledgments

The first author acknowledges the help and support given by graduate students and professors in Department of Civil, Environmental and Architectural Engineering at University of Colorado at Boulder.

Conflicts of Interest

The authors declare no conflict of interest.

References

  1. Stewart, M.G.; Wang, X.; Nguyen, M.N. Climate change impact and risks of concrete infrastructure deterioration. Eng. Struct. 2011, 33, 1326–1337. [Google Scholar] [CrossRef]
  2. Bastidas-arteaga, E.; Bressolette, P.; Chateauneuf, A.; Sánchez-silva, M. Probabilistic lifetime assessment of RC structures under coupled corrosion—fatigue deterioration processes. Struct. Saf. 2009, 31, 84–96. [Google Scholar] [CrossRef] [Green Version]
  3. Stewart, M.G.; Wang, X.; Nguyen, M.N. Climate change adaptation for corrosion control of concrete infrastructure. Struct. Saf. 2012, 35, 29–39. [Google Scholar] [CrossRef]
  4. Val, D.V.; Chernin, L.; Stewart, M.G. Experimental and Numerical Investigation of Corrosion-Induced Cover Cracking in Reinforced Concrete Structures. J. Struct. Eng. 2009, 135, 376–385. [Google Scholar] [CrossRef]
  5. Val, D.V.; Trapper, P.A. Probabilistic evaluation of initiation time of chloride-induced corrosion. Reliab. Eng. Syst. Saf. 2008, 93, 364–372. [Google Scholar] [CrossRef]
  6. Papadakis, V.G.; Vayenas, C.G.; Fardis, M.N. Fundamental modeling and experimental investigation of concrete carbonation. ACI Mater. J. 1991, 88, 363–373. [Google Scholar] [CrossRef]
  7. Saetta, A.V.; Vitaliani, R.V. Experimental investigation and numerical modeling of carbonation process in reinforced concrete structures. Cem. Concr. Res. 2004, 34, 571–579. [Google Scholar] [CrossRef]
  8. Talukdar, S.; Banthia, N.; Grace, J.R. Carbonation in concrete infrastructure in the context of global climate change—Part 1: Experimental results and model development. Cem. Concr. Compos. 2012, 34, 924–930. [Google Scholar] [CrossRef]
  9. Talukdar, S.; Banthia, N.; Grace, J.R.; Cohen, S. Carbonation in concrete infrastructure in the context of global climate change: Part 2—Canadian urban simulations. Cem. Concr. Compos. 2012, 34, 931–935. [Google Scholar] [CrossRef]
  10. Suryavanshi, A.K.; Swamy, R.N.; Cardew, G.E. Estimation of diffusion coefficients for chloride ion penetration into structural concrete. ACI Mater. J. 2002, 99, 441–449. [Google Scholar]
  11. Ghahari, S.A.; Ramezanianpour, A.M.; Ramezanianpour, A.A.; Esmaeili, M. An accelerated test method of simultaneous carbonation and chloride ion ingress: durability of silica fume concrete in severe environments. Adv. Mater. Sci. Eng. 2016, 1650979. [Google Scholar] [CrossRef] [Green Version]
  12. Lee, H.M.; Lee, H.S.; Min, S.; Lim, S.; Singh, J.K. Carbonation-Induced Corrosion Initiation Probability of Rebars in Concrete With/Without Finishing Materials. Sustainability 2018, 10, 3814. [Google Scholar] [CrossRef] [Green Version]
  13. Park, K.B.; Wang, X.Y. Effect of Climate Change on Service Life of High Volume Fly Ash Concrete Subjected to Carbonation—A Korean Case Study. Sustainability 2017, 9, 157. [Google Scholar] [CrossRef] [Green Version]
  14. Bazant, Z.P.; Hubler, M.H. Theory of cyclic creep of concrete based on Paris law for fatigue growth of subcritical microcracks. J. Mech. Phys. Solids 2014, 63, 187–200. [Google Scholar] [CrossRef]
  15. Jiang, C.; Gu, X.; Huang, Q.; Zhang, W. Deformation of concrete under high-cycle fatigue loads in uniaxial and eccentric compression. Constr. Build. Mater. 2017, 141, 379–392. [Google Scholar] [CrossRef]
  16. Jiang, C.; Gu, X.; Zhang, W.; Zou, W. Modeling of carbonation in tensile zone of plain concrete beams damaged by cyclic loading. Constr. Build. Mater. 2015, 77, 479–488. [Google Scholar] [CrossRef]
  17. Jiang, C.; Huang, Q.; Gu, X.; Zhang, W. Experimental investigation on carbonation in fatigue-damaged concrete. Cem. Concr. Res. 2017, 99, 38–52. [Google Scholar] [CrossRef]
  18. Jiang, C.; Huang, Q.; Gu, X.; Zhang, W. Modeling the effects of fatigue damage on concrete carbonation. Constr. Build. Mater. 2018, 191, 942–962. [Google Scholar] [CrossRef]
  19. Jiang, C.; Gu, X.; Huang, Q.; Zhang, W. Carbonation depth predictions in concrete bridges under changing climate conditions and increasing traffic loads. Cem. Concr. Compos. 2018, 93, 140–154. [Google Scholar] [CrossRef]
  20. IPCC (Intergovernmental Panel on Climate Change). Climate Change 2013: The Physical Science Basis. Contribution of Working Group I to the fifth Assessment Report of the Intergovernmental Panel on Climate Change; Cambridge University Press: Cambridge, UK, 2013. [Google Scholar]
  21. Medeiros-Junior, R.A.; Lima, M.G.; Yazigi, R.; Medeiros, M.H.F. Carbonation depth in 57 years old concrete structures. Steel Compos. Struct. 2015, 19, 953–966. [Google Scholar] [CrossRef]
  22. Thiery, M.; Cremona, C.; Baroghel-Bouny, V. Application of the reliability theory to the assessment of carbonation-induced corrosion risk of rebars. Eur. J. Environ. Civ. Eng. 2012, 16, 273–287. [Google Scholar] [CrossRef]
  23. Peng, L.; Stewart, M.G. Climate change and corrosion damage risks for reinforced concrete infrastructure in China. Struct. Infrastruct. Eng. 2016, 12, 499–516. [Google Scholar] [CrossRef]
  24. Talukdar, S.; Banthia, N. Carbonation in concrete infrastructure in the context of global climate change: Model refinement and representative concentration pathway scenario evaluation. J. Mater. Civ. Eng. 2015, 28, 04015178. [Google Scholar] [CrossRef]
  25. China Industry Standard. Specification for Mix Proportion Design of Ordinary Concrete (JGJ55-2011), 2011th ed.; China Architecture & Building Press: Beijing, China, 2011. [Google Scholar]
Figure 1. The incremental method.
Sustainability 12 01187 g001
Figure 2. Stress and strains over a representative cross section.
Sustainability 12 01187 g002
Figure 3. CO2 concentrations (ppm) under representative concentration pathways (RCPs).
Sustainability 12 01187 g003
Figure 4. Temperature under RCPs (Shanghai).
Sustainability 12 01187 g004
Figure 5. Flowchart of Monte Carlo-based time-dependent reliability analysis.
Sustainability 12 01187 g005
Figure 6. Basic information of a prestressed simply supported reinforced concrete (RC) girder.
Sustainability 12 01187 g006
Figure 7. Representative samples of time-varying stochastic CO2 concentrations under RCP4.5.
Sustainability 12 01187 g007
Figure 8. Representative samples of time-varying stochastic temperatures under RCP4.5.
Sustainability 12 01187 g008
Figure 9. Representative samples of time-varying stochastic relative humidities under RCP4.5.
Sustainability 12 01187 g009
Figure 10. Representative samples of time-variant residual strains at girder top.
Sustainability 12 01187 g010
Figure 11. Representative samples of time-variant carbonation depths at girder top.
Sustainability 12 01187 g011
Figure 12. Effects of climate change on the time-dependent reliability indexes.
Sustainability 12 01187 g012
Figure 13. Effects of fatigue damage on the time-dependent reliability indexes.
Sustainability 12 01187 g013
Figure 14. Effects of concrete cover thickness on the time-dependent reliability indexes.
Sustainability 12 01187 g014
Figure 15. Effects of concrete grade on the time-dependent reliability indexes.
Sustainability 12 01187 g015
Table 1. Summary of random variables.
CategoryVariables
Concrete parametersfc′, Ec, [CH]0, [CSH]0, φpc and xcov
Environmental actions[CO2](t), T(t) and RH(t)
Traffic load effectML
Model parametersθ, a0, b0, k0, k1, k2, k3, k4, k5 and k6
Table 2. Geometric features and loads borne by the concrete part of the cross section.
SectionA (mm2)I (mm4)cb (mm)PD (kN)MD (kN∙m)ML (kN∙m)
1-17,408,0007.3871 × 10121501.54759,115.84039,257.9408412.416
Table 3. Mix designs of concretes.
GradesCement TypeMix Proportion (kg/m3)Coarse Aggregates
mwmcmcamsaTypeamax (mm)ρca (kg/m3)
C30# 425 OPC185.0308.31105.2736.8Granite162628
C40# 425 OPC185.0370.01073.8715.9Granite162628
C50# 425 OPC185.0462.51026.6684.4Granite162628
Note: mw, mc, mca and msa are the contents of water, cement, coarse aggregate and fine aggregates, respectively, in a unit volume of concrete; amax and ρca are the maximum particle size and density of coarse aggregates, respectively.
Table 4. Material and mechanical properties of designed concretes.
Concretefc′ (N/mm2)Ec (N/mm2)[CH]0 (mol/m3)[CSH]0 (mol/m3)φpc
C302830,000872.55521.800.333
C403832,5001047.08626.170.252
C504634,5001308.84782.710.149
Table 5. Distributions of random variables.
VariablesDistri. TypeMeanCVRef.VariablesDistri. TypeMeanCVRef.
fcNorm.Table 40.15[2]MLLog. Norm.84120.1/0.2 */0.3[2]
EcNorm.Table 40.12[23]xcovNorm.25/35 */450.25[2]
[CH]0Norm.Table 40.10[22][CO2](t)Norm.Figure 30.15/0.25 */0.35
[CSH]0Norm.Table 40.10[22]T(t)Norm.Figure 40.15/0.25 */0.35
φpcNorm.Table 40.065[22]RH(t)Norm.71.32%0.15/0.25 */0.35
k1Norm.1.80.1[19,22]k5Norm.1.03 × 10−70.1[19,22]
k2Norm.2.20.1[19,22]k6Norm.1.3557 × 10−50.1[19,22]
k3Norm.0.020.1[19,22]k0Norm.1.64 × 10−60.1[19,22]
k4Norm.0.60.1[19,22]a0Norm.1.9075 × 10−60.15/0.25 */0.35[15]
θ (tension)Norm.0.5150.31[19]b0 (σm/fc′ ≤ 0.5)Norm.4.224 × 10−70.15/0.25 */0.35[15]
θ (compression)Norm.0.4680.33[19]b0 (σm/fc′ > 0.5)Norm.2.571 × 10−70.15/0.25 */0.35[15]
* Values assumed in the reference case with C40 concrete under RCP4.5. Distri. is short for distribution. CV denotes the coefficient of variation. Ref. is short for reference.
Table 6. Effects of climate change on the service life predictions.
Reliability LevelGirder Bottom (Tension)
2013RCP4.5RCP8.5
CV = 0.15CV = 0.25CV = 0.35CV = 0.15CV = 0.25CV = 0.35CV = 0.15CV = 0.25CV = 0.35
1>88>88>88>88>8883787468
1.5>888574726659615752
2605447494540454237
Girder Top (compression)
1757166605753535148
1.5525046444239413937
2353229312926292825
Table 7. Effects of fatigue damage on the service life predictions: variations of fatigue creep model coefficients.
Reliability LevelNDGirder Bottom (Tension)Girder Top (Compression)
CVa0/b0 = 0.15CVa0/b0 = 0.25CVa0/b0 = 0.35CVa0/b0 = 0.15CVa0/b0 = 0.25CVa0/b0 = 0.35
1>88>88>88>88585758
1.583676665424242
255444544282929
Note: ND denotes non-damaged case.
Table 8. Effects of fatigue damage on the service life predictions: variations of movement induced by traffic loads (ML).
Reliability LevelNDGirder Bottom (Tension)Girder Top (Compression)
CVML = 0.1CVML = 0.2CVML = 0.3CVML = 0.1CVML = 0.2CVML = 0.3
1>88>88>88>88575758
1.583666667424242
255454545292929
Note: ND denotes non-damaged case.
Table 9. Effects of concrete cover thickness on the service life predictions.
Reliability LevelGirder Bottom (Tension)Girder Top (Compression)
xcov = 25xcov = 35xcov = 45xcov = 25xcov = 35xcov = 45
153>88>88345786
1.53866>88244263
2254569162944
Table 10. Effects of concrete grades on the service life predictions.
Reliability LevelGirder Bottom (Tension)Girder Top (Compression)
C30C40C50C30C40C50
155>88>883857>88
1.53966>88284275
22645>88182953

