Article

Performance Improvement of PV Systems’ Maximum Power Point Tracker Based on a Scanning PSO Particle Strategy

by
Ali M. Eltamaly
1,2,3,*,
M. S. Al-Saud
1,4 and
A. G. Abo-Khalil
5,6
1
Saudi Electricity Company Chair in Power System Reliability and Security, King Saud University, Riyadh 11421, Saudi Arabia
2
Sustainable Energy Technologies Center, King Saud University, Riyadh 11421, Saudi Arabia
3
Electrical Engineering Department, Mansoura University, Mansoura 35516, Egypt
4
Electrical Engineering Department, College of Engineering, King Saud University, Riyadh 11421, Saudi Arabia
5
Electrical Engineering Department, Majmaah University, Almajmaah 11952, Saudi Arabia
6
Electrical Engineering Department, Assiut University, Assiut 71515, Egypt
*
Author to whom correspondence should be addressed.
Sustainability 2020, 12(3), 1185; https://doi.org/10.3390/su12031185
Submission received: 13 January 2020 / Revised: 1 February 2020 / Accepted: 2 February 2020 / Published: 6 February 2020
(This article belongs to the Section Energy Sustainability)

Abstract

:
Partial shading of PV systems generates many peaks in the P–V curve. These peaks have one global peak (GP), the remaining being local peaks (LPs). Metaheuristic techniques such as PSO have proven superiority in capturing the GP and avoiding entrapment in an LP in comparison to conventional techniques. In case of partial shading conditions (PSC), the GP may change its position and value in the P–V curve and the PSO is unable to capture the GP unless they reinitialize. Reinitialization of PSO particles spends a long time for convergence; and it may cause premature convergence. This paper proposes a novel strategy for scanning the new position of the GP in case of PSC changes without a need for reinitialization. The proposed strategy sends a particle to the anticipated places of peaks to search for any peak with power greater than the current GP and when it locates this new GP it will move the PSO particles directly to the new GP. This strategy reduced the reinitialization time by 650% as compared to the time required for the random reinitialization of the conventional PSO technique. Moreover; this proposed strategy completely avoids the premature convergence associated with conventional PSO techniques.

1. Introduction

Photovoltaic (PV) energy systems are an attractive option for generating electricity for electric utility applications, in particular for autonomous applications. PV systems face many challenges in the reduction of the cost of the generated energy. Two main improvements are sought: the first is to introduce new materials for PV cells that give higher efficiency; the second is to improve the operation of the PV system by utilizing new techniques to extract the maximum power available from the PV array. The maximum power point tracker (MPPT) is a device used to increase the generated energy, which translates into reduction in the cost of generated energy. Some researchers estimate the increase in the generated energy from PV systems when using MPPT to be 30% in comparison to systems without MPPT [1]. The idea of the MPPT is to track the maximum power available in the PV systems by controlling its terminal voltage. The power versus voltage (P–V) characteristic of a uniformly distributed irradiance PV array has only one peak. This peak can be tracked easily using conventional MPPT techniques, such as incremental conductance [2], hill climbing (HC), perturb and observe (P&O), constant voltage, etc. [3]. Meanwhile, these techniques predominantly fall in one of the LPs in case of conditions of partial shading.
Partial shading condition (PSC) is the condition that occurs when the modules connected in series and parallel receive different illuminations due to varied causes such as clouds, trees, buildings, or dust. PSC can result in serious effects, such as hotspot, or even complete damage of the PV array, if there are no bypass diodes connected across the PV modules. PSCs reduce the generated power considerably as the shaded modules, instead of generating electricity, act as a load that draws power from the other modules. In case a bypass diode is used across each PV modules, as is the normal practice, the bypass diodes will prevent the shaded modules from working as a load and also protect the modules from hotspot, but, it will create another problem where the P–V curve will have one global peak (GP) and multiple local peaks (LPs). The conventional MPPT techniques have been proven to fail in tracking the GP, and for this reason it will not be discussed anymore in this research. Metaheuristic techniques have the ability to track the GP in uniformly distributed irradiance as well as in case of PSCs. Many metaheuristic techniques have been used as MPPT, including particle swarm optimization (PSO) [4], bat algorithm (BA) [5], cuckoo search (CS) [6], grey wolf optimization (GWO) [7], crow search algorithm (CSA) [8], ant colony optimization (ACO) [9], colony of flashing fireflies [10], artificial bee colony (ABC) [11], gravitational search algorithm (GSA) [12], Cauchy and Gaussian sine cosine optimization [13], moth–flame optimization (MFO) [14], etc. Some of these techniques have been integrated with one of the conventional techniques to gain the benefits of both of these techniques. A review of the most important metaheuristic techniques is given in [8]. All of the MPPT techniques track the GP by controlling the terminal voltage of the PV array using DC/DC converter. Many converters have been used for this purpose, such as boost converter [15], buck converter [16], buck-boost converter [17], SEPIE [18], etc. A review on the use of different kinds of DC/DC converters as an MPPT of PV systems is given in [19]. The boost converter has been used in this study due to its simple construction and easy control, as shown in Figure 1. The PV system is interconnected with the electric utility using a three-phase pulse width modulation (PWM) inverter controlled by space vector PWM (SVPWM) for keeping the DC-link voltage constant.
The P–V curves showing the relation between the power and voltage for different numbers of peaks are shown in Figure 2. The terminal voltage of the PV array will be controlled using the boost converter as shown in Figure 1 according to Equation (1)).
V D C V P V = 1 1 d
where, VPV is the terminal voltage of PV array, d is the duty ratio of boost converter.
This relation can be used to determine the relation between the power and duty ratio of the boost converter (P–d curve). Figure 3 shows the P–d curves for different numbers of peaks. PSO techniques have been used in many researches for MPPT of PV system in uniform distributed irradiance and PSCs [15,20].
The PSO technique has the advantages of simple logic, easy implementation, fast computation, and fast convergence [4]. The aim of using PSO as an MPPT for PV systems is for the purpose of using the values of the duty ratios of the boost converter as PSO particles. These particles use the PV system to track the maximum power generated as an objective function for the PSO technique. In the case of uniform distributed irradiance and constant PSC, the conventional PSO effectively captures the GP of the P–V curve of PV array. Meanwhile, in case of dynamically variable PSCs, the position and value of the GP may vary which renders the conventional PSO as well as other metaheuristic techniques unable in the capture of the new GP because all particles are concentrated at the previous one. For this reason, many researchers introduced reinitialization techniques to reinitialize the particles [15,20,21]. Eltamaly et al. introduced two reinitialization strategies—one strategy is set to repeatedly reinitialize the particles after a certain period of time; the other strategy is reinitializing the particles based on shading patter (SP) changes [21] where the SP is detected using Equation (2). The ε is set to 5% in [20]. The conventional reinitialization strategy disperses the particles based on the condition shown in Equation (2) to search for the new position of the GP on the P–V curve; however, this practice suffers from two major problems. The first problem is the long convergence time and the second problem is premature convergence. These two shortcomings reduce the generated energy and increase the instability of the control of the PV system especially in fast-changing PSCs. For this reason, this paper is introduced to solve these two shortcomings and fill this research gap. The proposed modification in the conventional PSO is to check the change of power up on condition shown in (2) and consider this to be the indication for PSC change, and consequently send the scanning particle to search for higher generated power than the one of the current GP.
| G P i G P i 1 G P i 1 | > ε
If the scanning particle achieves a power value higher than the current global best of the PSO, it will force the PSO particles to be attracted to the highest peak captured by the scanning particle, otherwise the algorithm logic will proceed to the normal next iteration. A detailed description of the proposed strategy is shown in the following sections.
The above introduction has reviewed the use of PSO as a MPPT, and the need for the reinitialization in case of dynamic PSCs, as well as the problems associated with it, which are the motivation of this paper. The rest of this paper has been organized in the following sequence: Section 2 shows the partial shading performance and its effect on the P–V curve; Section 3 shows the proposed methodology and the modifications introduced over the conventional PSO as a MPPT of the PV system; Section 4 shows the simulation results, discussion, and comparison; Section 5 shows the detailed of experimental setup and results. Section 6 discusses the conclusions from this work.

2. Partial Shading Performance

In PV systems, the partial shading effect occurs when the series and parallel modules are facing different irradiances. The number of peaks of a P–V system depends on the different irradiances exposed to the modules or group modules connected in series. Figure 3 shows the P–d curves having different number of peaks.
The system shown in Figure 1 has four series groups of PV modules having four different irradiances, G1–G4 and for this reason they will have four peaks. Five different shading patterns (SP) shown in Table 1 will be used in the simulation to draw the P–d curves as shown in Figure 4. The shading patterns shown in Table 1 and Figure 4 will be used in order, and these shading patterns will help in understanding the problems inherent in the use of PSO in tracking the maximum power of PV systems.
It is clear from Figure 4 that the peaks are located in four different places, the first peak is located between 0.1 and 0.2 values of the duty ratio, the position of the second peak is between 0.35 and 0.4 duty ratio, the third peak’s positions are between 0.59 to 0.61, while the position of the fourth peak lies between duty ratios 0.8 to 0.81. The anticipated locations of the peaks can be calculated approximately from Equation (3):
d ( k ) = 1 ( n k + 1 ) k V n V O C V D C
where, VDC is the DC-link voltage, Voc is the open circuit voltage, n is the total number of peaks (total number of module groups in series), k is a counter to represent the number of each duty ratio, the constant kV has a value between 0.76 and 0.82 [22].
For example, if it is required to determine the position of the 3rd peak using Equation (3), where n = 4, k = 3, kv = 0.8 [22], and with VOC = 640 V and VDC = 650 V, after applying these values to (3) the duty ratio of the third peak is d(3) = 0.606 which lies between the boundaries of the third peak position as stated above. This, initializing the PSO particles at the anticipated locations of peaks obtained from Equation (3) will reduce the convergence time and avoid premature convergence substantially [15].

3. Proposed Methodology

3.1. Conventional PSO MPPT of PV Systems

The particle swarm optimization (PSO) technique is a metaheuristic technique that mimics animals or fishes in their search for foods, where each particle searches randomly in the search space and the particle that gets the highest amount of food will share its experience with others to initiate changes in movement by the particles towards the best place for feeding. This can be used as an MPPT for PV systems where in the beginning the particles get random values of duty ratios; they collect the corresponding output power and compare their results, and the one with highest power will attract the other particles to move towards its position. Each particle will memorize the best value reached during its journey which is called best private solution. The path or the movement speed of each particle to its new position can be calculated from Equation (4). The new position; di+1 of the particles can be calculated through the addition of the particle’s velocity obtained from (4) to its current position (di) as shown in Equation (5) [23].
v i + 1 k = ω i   v i k + c 1 r 1 ( P b e s t ,   i k d i k ) + c 2 r 2 ( G b e s t , i d i k )
d i + 1 k = d i k + v i + 1 k
where, ω is the inertia weight, c1 and c2 are the acceleration coefficients, Pbest,i is the personal best solution or best private solution of particle i, Gbest,i is the global best of Pbest,i, k is the swarm number, and r1 and r2 are random values in between [0, 1].

3.2. PSO Performance Improvements Strategies

The online MPPT of a PV system using PSO requires very fast and accurate response to improve the stability of PV system and to avoid premature convergence that can reduce the generated energy from PV system considerably, so convergence time and the avoidance of premature convergence are the two crucial factors for the assessment of the strategy used with PSO technique for the MPPT of PV systems. Many strategies have been introduced in literature to improve the performance of the PSO technique in general, and specifically for the MPPT of PV systems; the most important strategies used for this issue are listed in the following points:
  • Linearly decreasing weight function is obtained from (6) [24] where the optimization starts with ω = 0.9 to search for the GP in a wider area and it reduced linearly with iterations to 0.4 to increase the cognitive search of the particles and provide smooth tracking for the GP. This paper did not provide recommended values for the acceleration parameters cg and cl:
    ω i = 0.9 i I t max 0.5 ,   where   i I t max
    where, i is the number of the current iteration, and Itmax is the maximum number of iterations.
  • Another study introduced a nonlinear decrease in the inertia weight based on (7) [24]. The author recommended the value of n to either be 1.2 or be progressively increased iteratively from 0.9 to 1.3 in steps of 0.1 for achieving the best convergence efficiency:
    ω i = ω min + ( I t max i I t max ) n ( ω max ω min )
    where max and min are the maximum and minimum values of inertia weight parameter, respectively, and n is a nonlinear modulation index [24].
  • Another mathematical derivation strategy aims to determine the best values of PSO control parameters, where 0 < cg ≤ 2.05 and 0 < cl ≤ 2.05 are positive constant learning rates, and ω is the constriction factor and is defined by Equation (8) [25]:
    ω = 2 | 2 ( φ ) φ 2 4 φ |
    where   φ = c g + c l ω > 4
  • Clerc [26] concluded that the best value of was 4.1, which showed good results in many research studies. Therefore, from (3), ω = 0.729, and the author assumed equal values for cg and cl, i.e., cg = cl = 1.49445.
  • An empirical formula was also introduced in [27] to examine the performance of the PSO search with varying PSO control parameters. The main finding from this study was that, the balance between the acceleration parameters, cg and cl, does impact the regions of the parameter space that lead to optimal performance. The relation between the acceleration parameters, cg and cl, and the inertia weight, ω, value was defined by the following formula:
    c g + c l > 24 ( ω 2 1 ) 5 ω 7
  • Another study introduced linear decreasing of the control parameters of PSO for MPPT of PV system [28]. This strategy introduced the linear decrease strategy for weight function, which was the one shown in (6), and the control parameters are as shown in the following equations:
    c g ( i ) = c g , max i I t max ( c g , max c g , min )
    c l ( i ) = c l , max i I t max ( c l , max c l , min )
    where, cg,max = 1.2, cg,min = 1, cl,max = 1.6, and cl,min = 1.
All the abovementioned PSO parameter determination strategies have been examined and the linearly decreasing weight function shown in Equation (6) [24] has been used in the simulation with values obtained from Clerc [26] (where cg = cl = 1.49445) because of the best performance of the PSO noticed with this strategy.

3.3. Hybridizing the PSO with Other MPPT Technique

The most important feature of the MPPT is the need to be very fast in the beginning to distinguish the GP and smoothness in search around the GP after that. To validate these requirements, PSO has been used with many other MPPT techniques. PSO has been integrated with fuzzy logic controller (FLC) for this purpose, where the MPPT starts the search with PSO, and when it captures the GP it transfers the control to FLC [29]. Other researchers used the same idea but hybridized the PSO with the P&O technique [30,31,32,33,34]. The PSO has also been hybridized with the gravitational search algorithm (GSA) for the same purpose [35]. In addition, PSO also has been hybridized with incremental conductance [36], continuous genetic algorithm (CGA) [37], hill climbing [38,39], differential evolution (DE) [40], artificial neural networks (ANN) [41], simulated annealing [42], chaos searching technique [43], adaptive neuro-fuzzy inference system (PSO-ANFIS) [44], etc.
The linearly decreasing weight function shown in Equation (6) [24] provides an adequate fast searching mechanism for GP at the beginning, coupled with low oscillation around the global peak when the weight function reduced to 0.4, and the hybridizing PSO is adding unnecessarily complex logic to the control system, which may then increase the calculation burden and impose a limitation on the value of switching frequency used in the experimental circuit of boost converter.

3.4. Reinitialization of PSO

During initialization, the first iteration uses PSO to track the GP. However, reinitialization means that the particles are reinitialized upward on change in the output power within certain limits as shown in Equation (2). The reinitialization of particles is necessary, because if the position of the peak changes the particles will not able to track it as all of them were concentrated at the previous GP. The initialization of particles at the beginning has been done in many research studies by using random numbers between 0 and 1 [6,20]. This may cause two major problems, the first problem is that the use of random values may prolong the convergence time, and secondly, the increase in probability of premature convergence which may happen in case the random values miss the right location of the GP thereby causing the particles to be attracted to one of the LPs. These two problems can be easily solved by initializing the particles at the anticipated places of peaks that can be obtained from (3). This strategy will reduce the convergence time by about 36% and will also avoid the chance for premature convergence. This achievement can be further improved using the new proposed strategy of “scanning particle” which completely avoids premature convergence and reduces the convergence time by about 650% and 450% when compared to the random reinitialization and reinitialization at the anticipated peaks, respectively. Another strategy introduced a mathematical formula for the optimal values of particle initialization [4]. The optimal values of particle initialization in this strategy [4] are a function of the resistive loads connected to the DC/DC converter which can be used only in stand-alone systems.

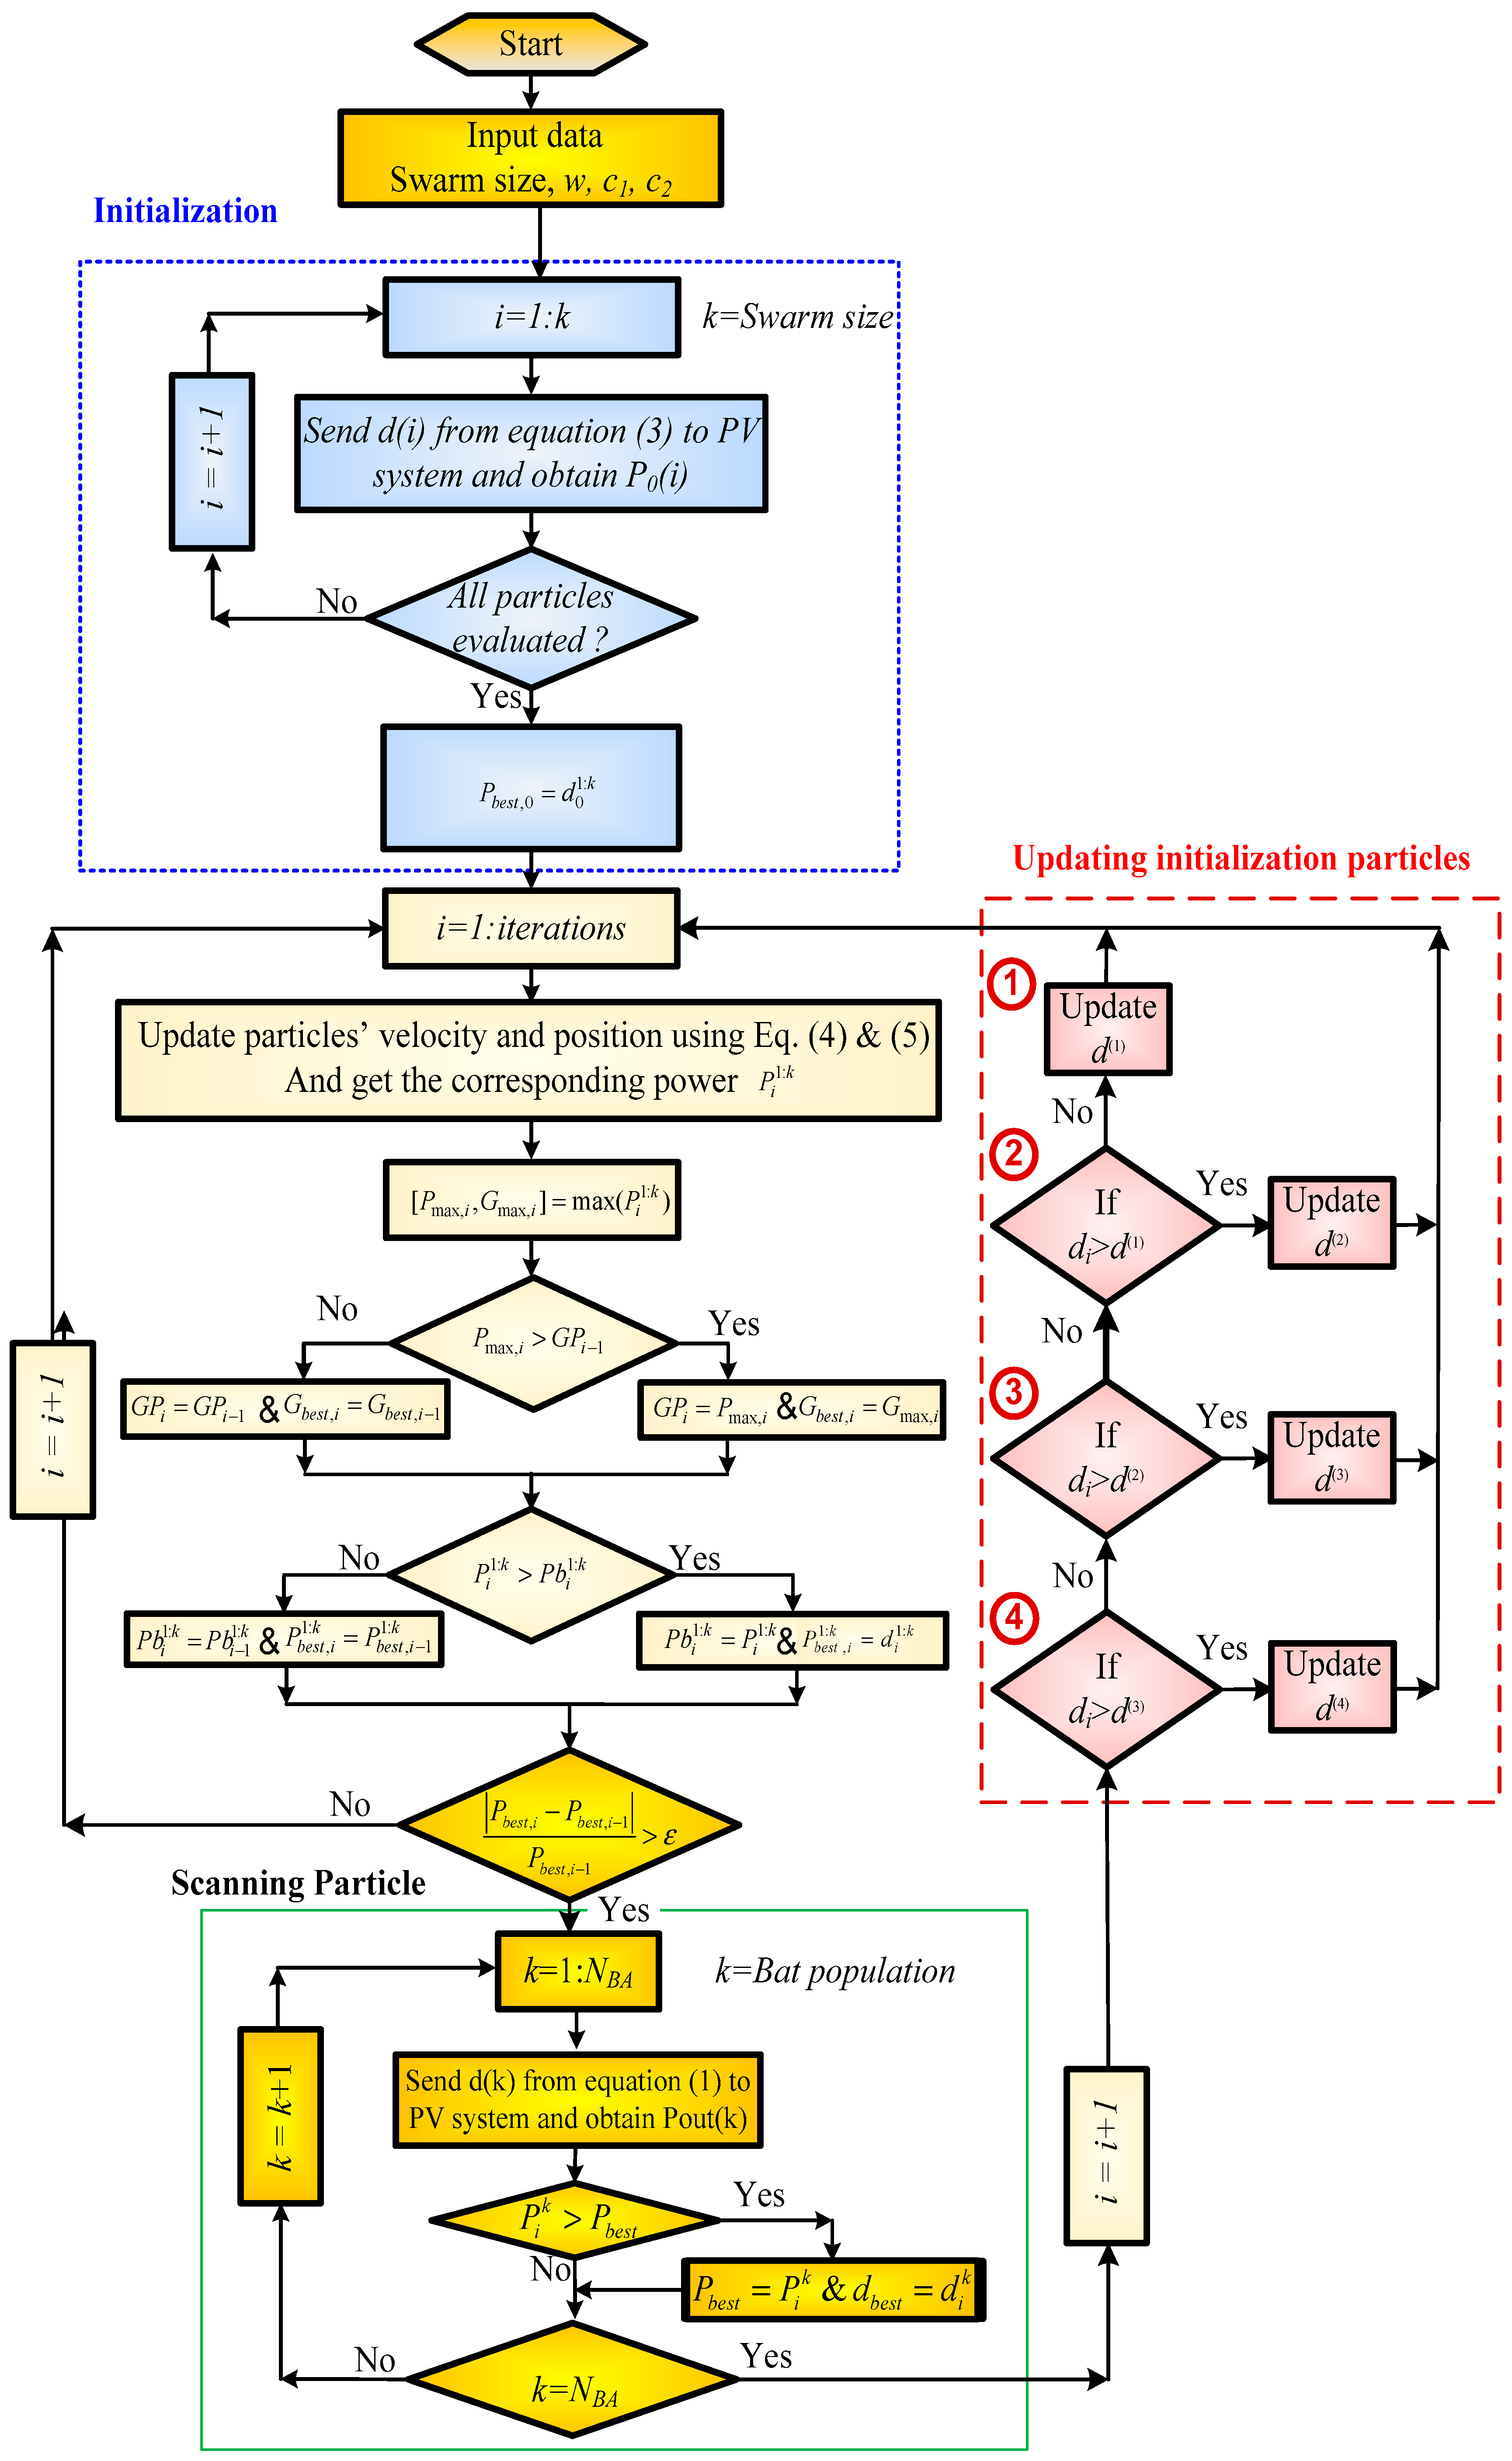
3.5. Novel Scanning Particle Strategy

The scanning particle strategy, given below as the main contribution of this paper, is activated when the power changes within certain limits according the condition shown in Equation (2). The idea of the scanning particle is to send one particle to the PV system with values equal to the duty ratios at each of the anticipated peaks one by one and collect the corresponding power for each, in case the condition shown in Equation (2) is validated. The highest value of power obtained from the scanning particle will be used to attract all the particles of the PSO to this new peak position. This strategy improved the stability of the control system considerably and reduced the reinitializing time by 650% and 450% for random reinitialization and reinitialization at the anticipated peaks respectively; this will be shown in the simulation and experimental sections. The steps explaining the scanning particle strategy with the PSO as a MPPT of the PV system is shown in Figure 5 and stated in the following steps:
  • Step 1: In the beginning, initiate the particles with values obtained from (3).
  • Step 2: Send one particle by one to the PV system and get the corresponding power for each particle.
  • Step 3: Select the highest value of power and its corresponding duty ratio.
  • Step 4: Use the values of GP and private best of each particle to determine the speeds and new positions of particles from (4) and (5), respectively.
  • Step 5: Send the new values of the duty ratios obtained from step 4 to the PV system and collect the corresponding power
  • Step 6: Update the GP values and the private best values.
  • Step 7: Check the condition shown in (2), if it is valid go to step 8 otherwise go to step 4.
  • Step 8: Send the values of scanning particle obtained from (3) one by one to the PV system and collect the highest generated power.
  • Step 9: Equate the global best and the private best with the highest value obtained from step 8.
  • Step 10: Go to step 4.

4. Simulation and Discussion

The simulation has been carried out for the present state-of-the-art strategy [15] and for the newly proposed “scanning particle” strategy for the purpose of comparison. The simulation of the PV system shown in Figure 1 has been carried out using the Matlab/Simulink simulation programs, where the PV arrays, boost converter, and the SVPWM have been modeled in Simulink and the code of the PSO has been carried out in Matlab m-file code for the state-of-the-art strategy [15] and for the proposed “scanning particle” strategy.
The PV array consists of four series PV module groups as shown in Figure 1. Each group consists of 60 parallel branches; each branch consists of five series PV modules, so the total number of modules used in the simulation is 300 × 4 = 1200 modules. The make of these PV modules is SunPerfect Solar CRM185S156P–54 [15]. The electrical characteristics of the selected PV module are given in Table 2.
Five shading patterns (SP) shown in Table 1 and Figure 4 have been used in the simulation where each SP will be simulated for 5 s. Four particles have been used in the simulation plus the scanning particle.

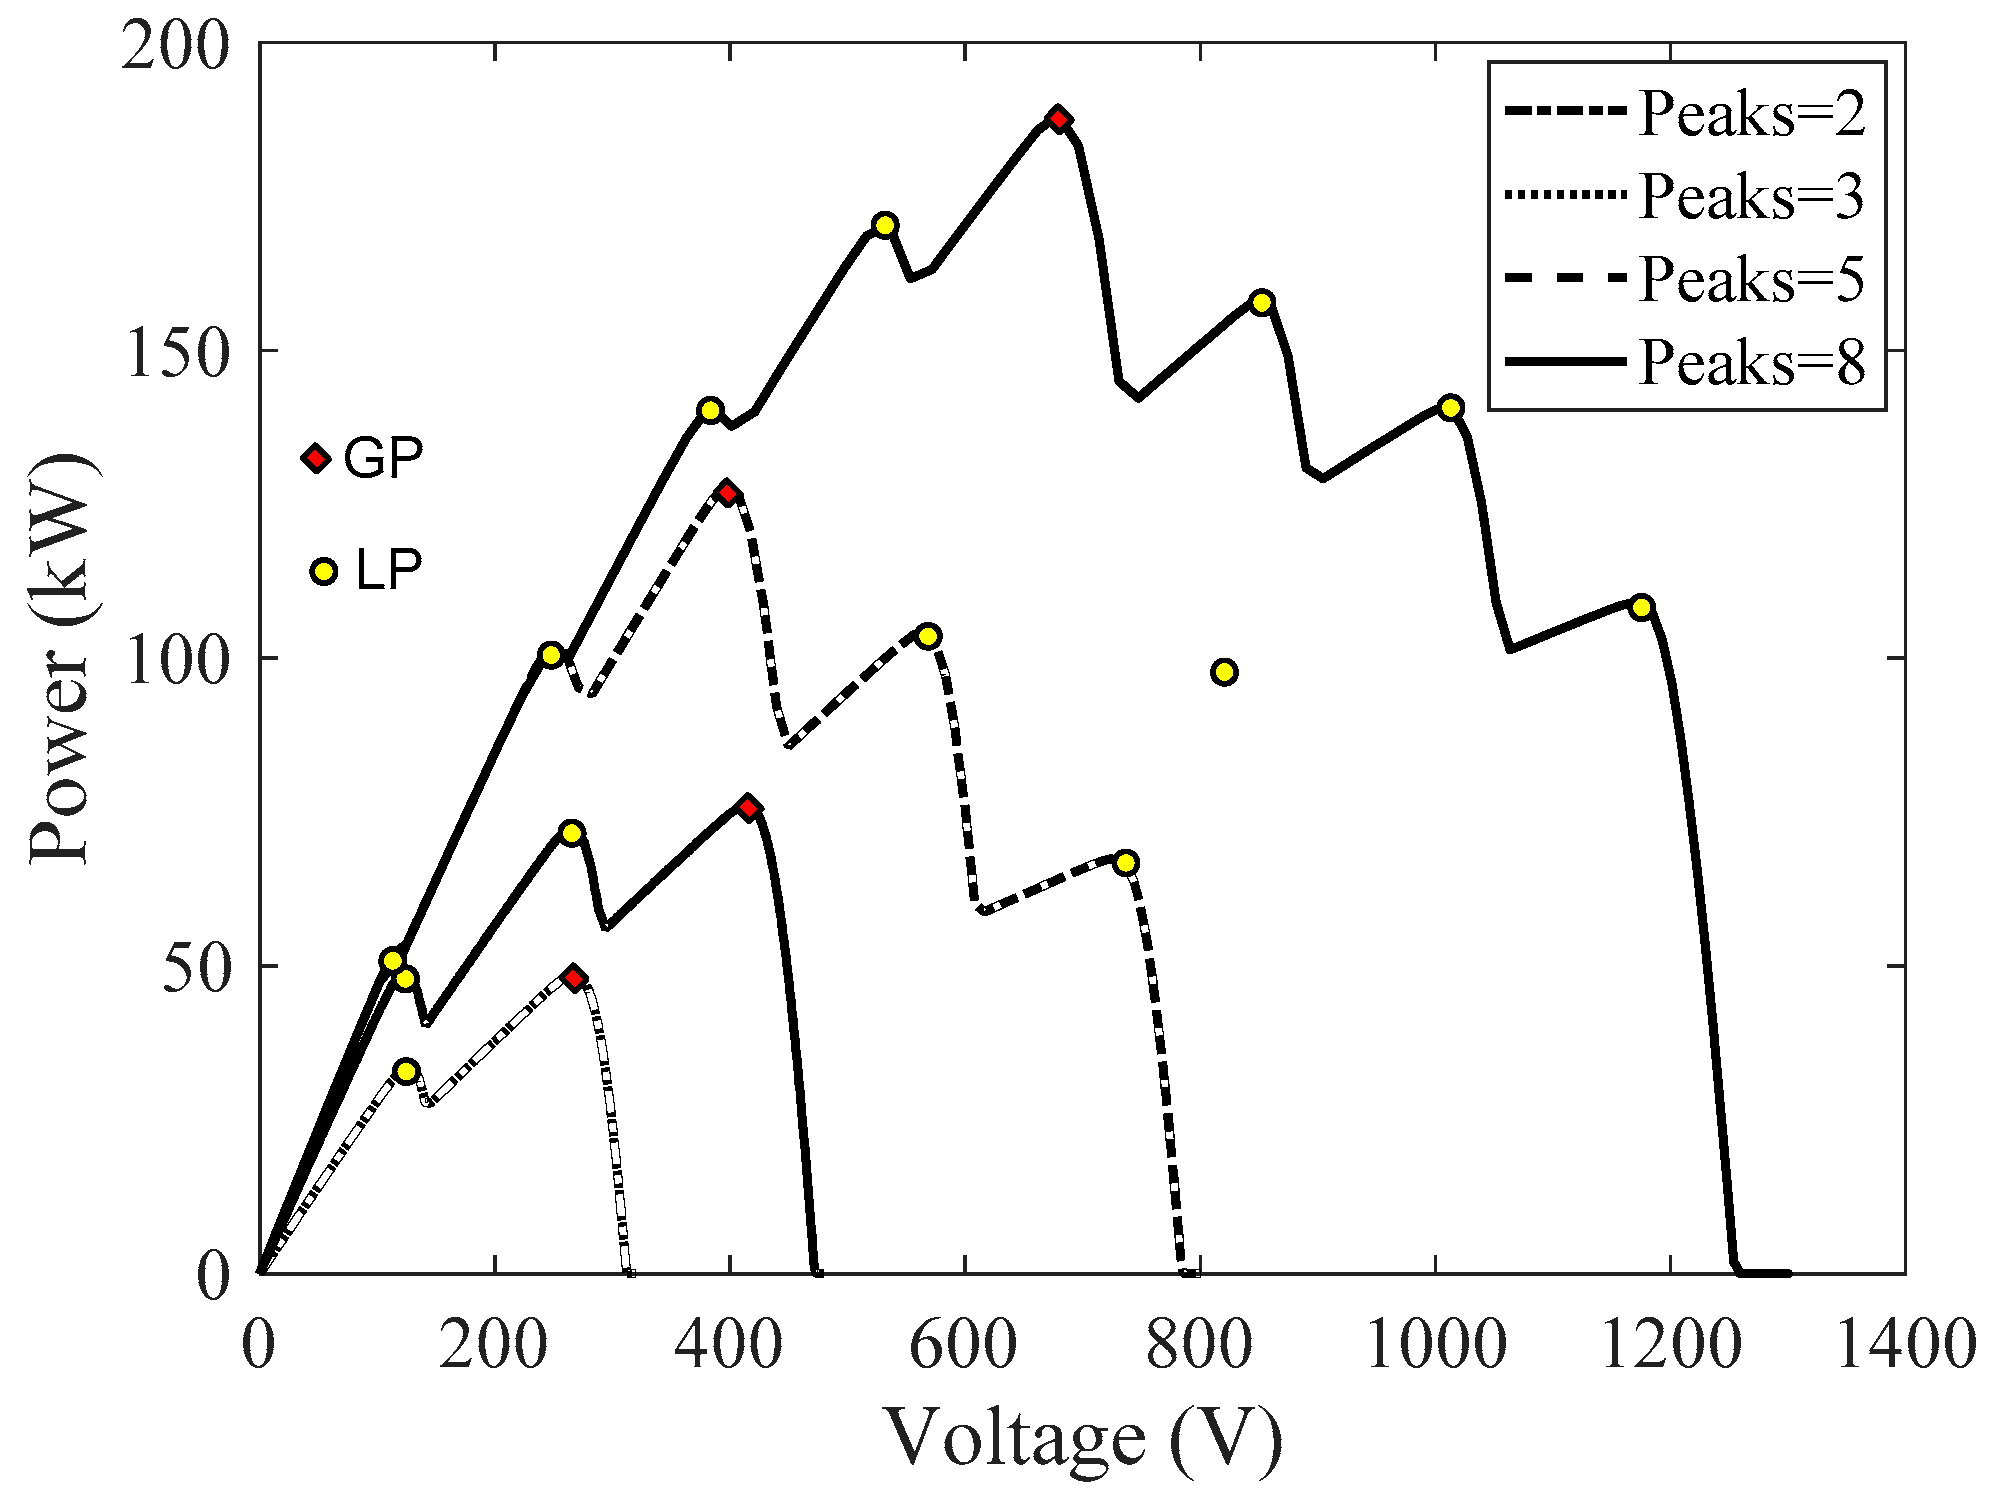
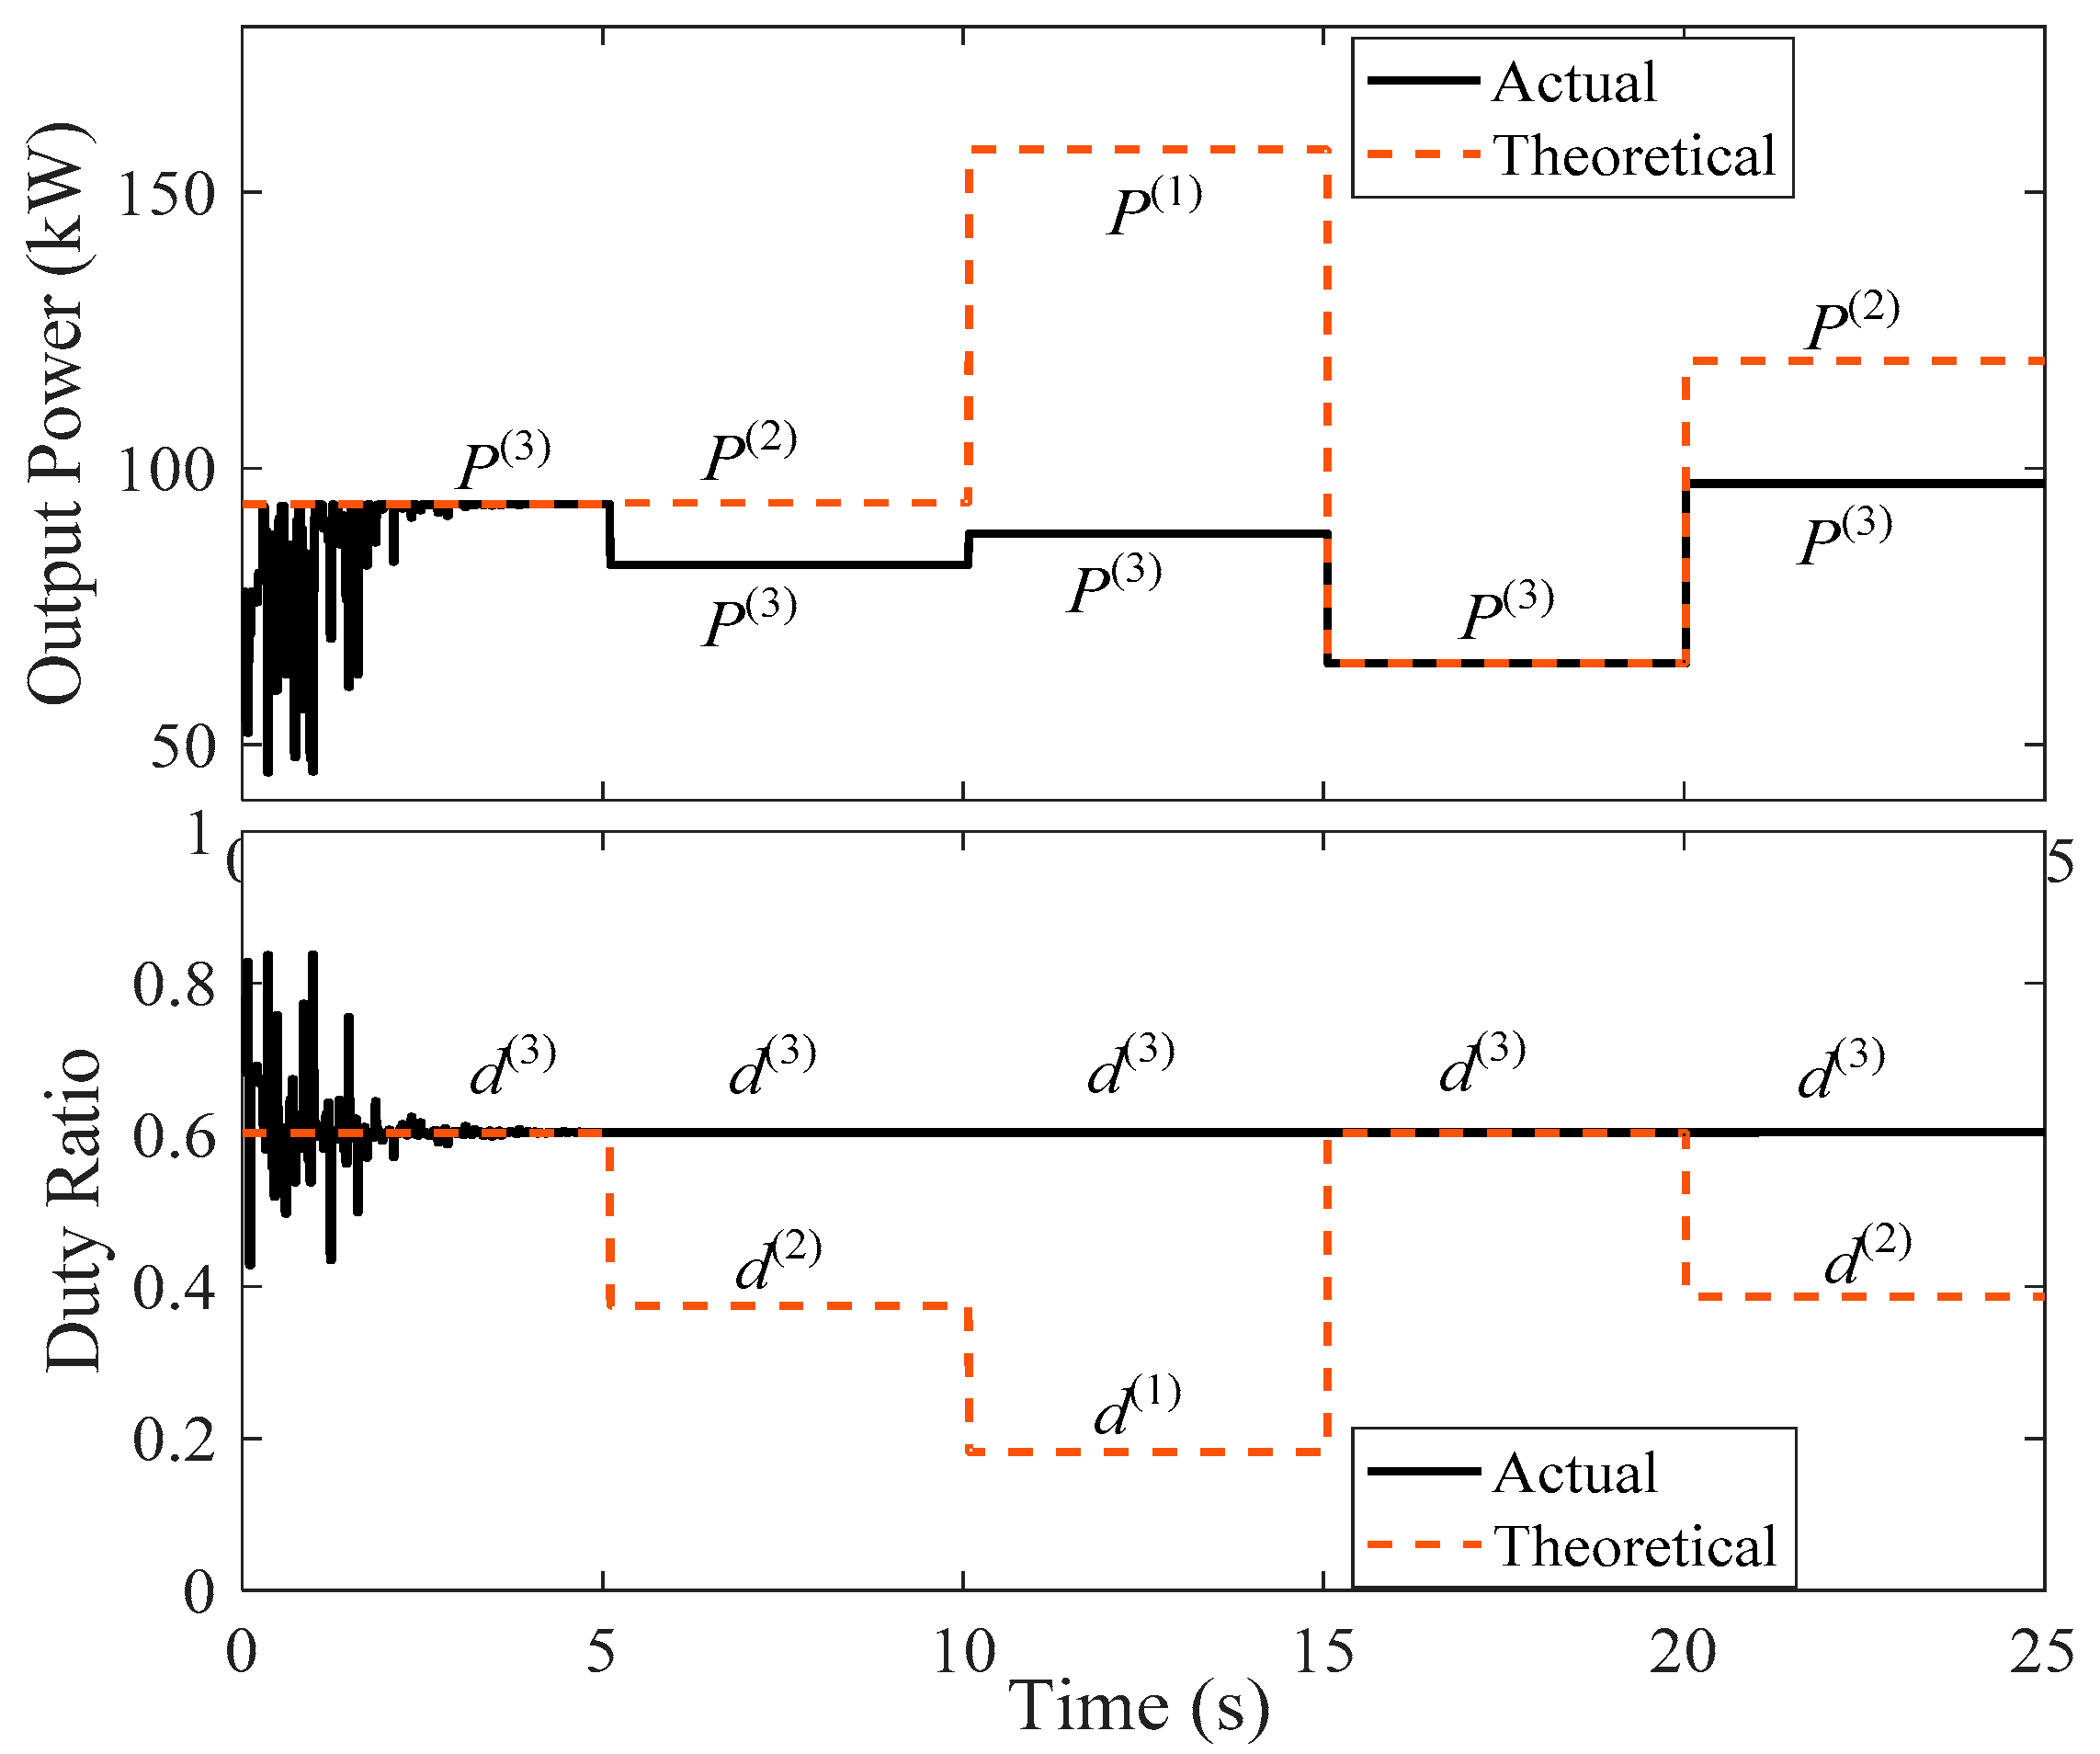
4.1. Simulation Results without Reinitialization

The first simulation study is the state-of-the-art PSO strategy without reinitialization as shown in Figure 6. It is clear from Figure 6 that with random initialization, the PSO spent about 3 s for convergence. After that, when the shading pattern changes from SP1 to SP2, the condition shown in (3) no longer applied, and accordingly the particles stuck at the first GP were captured in the first interval (SP1) and were unable to distinguish the new GP at SP2 or any other shading patterns.

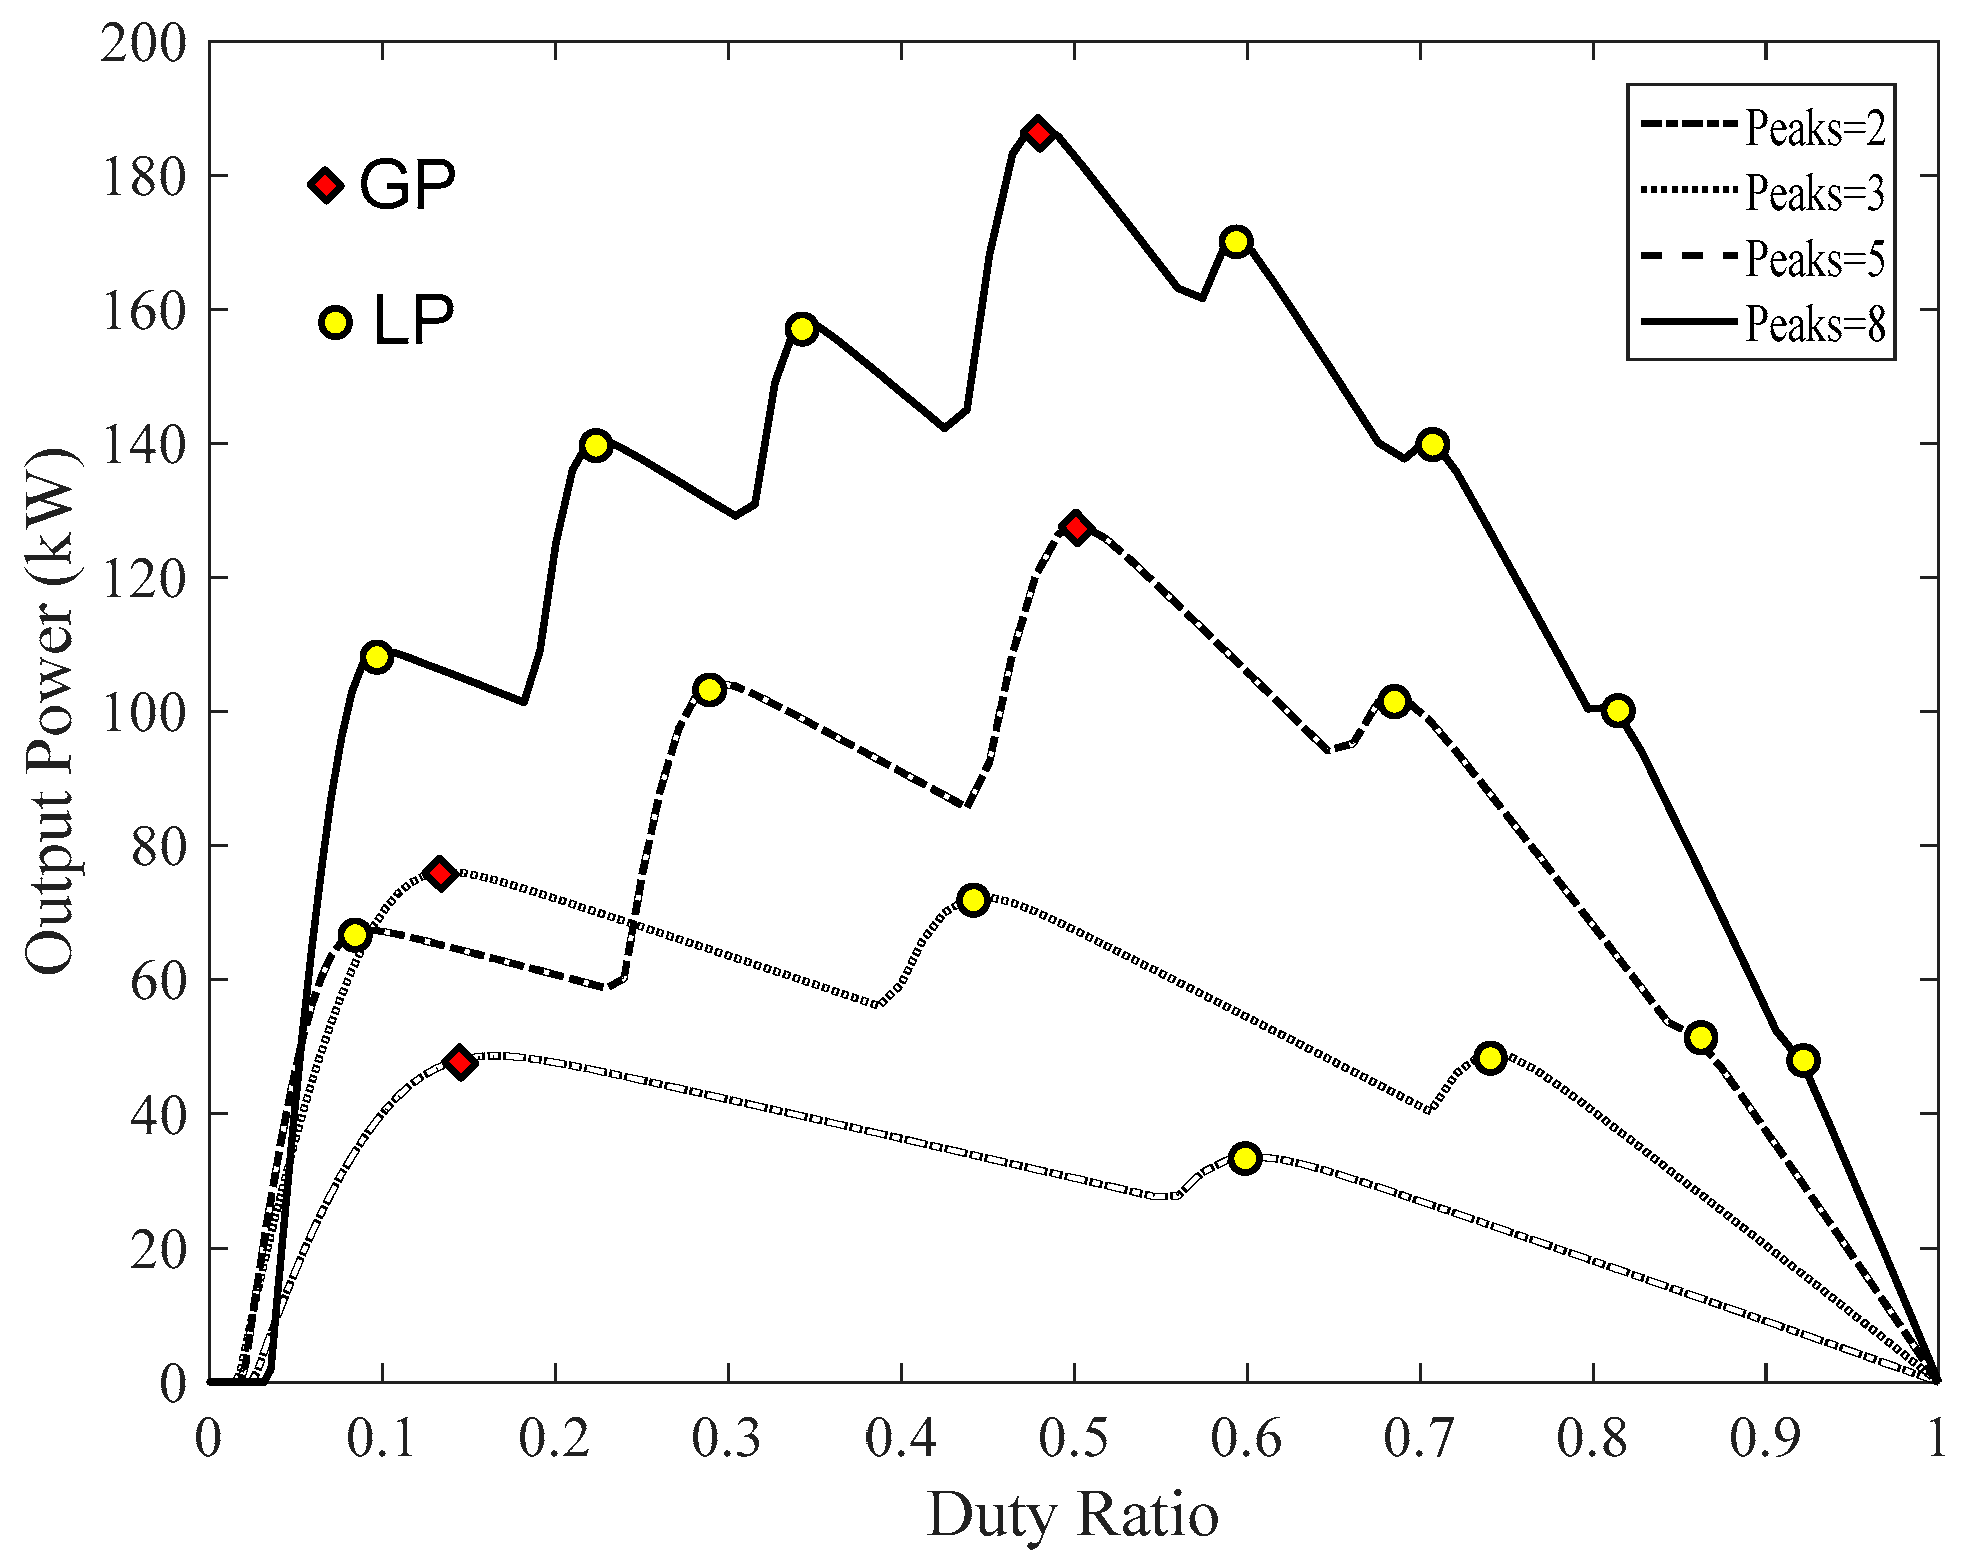
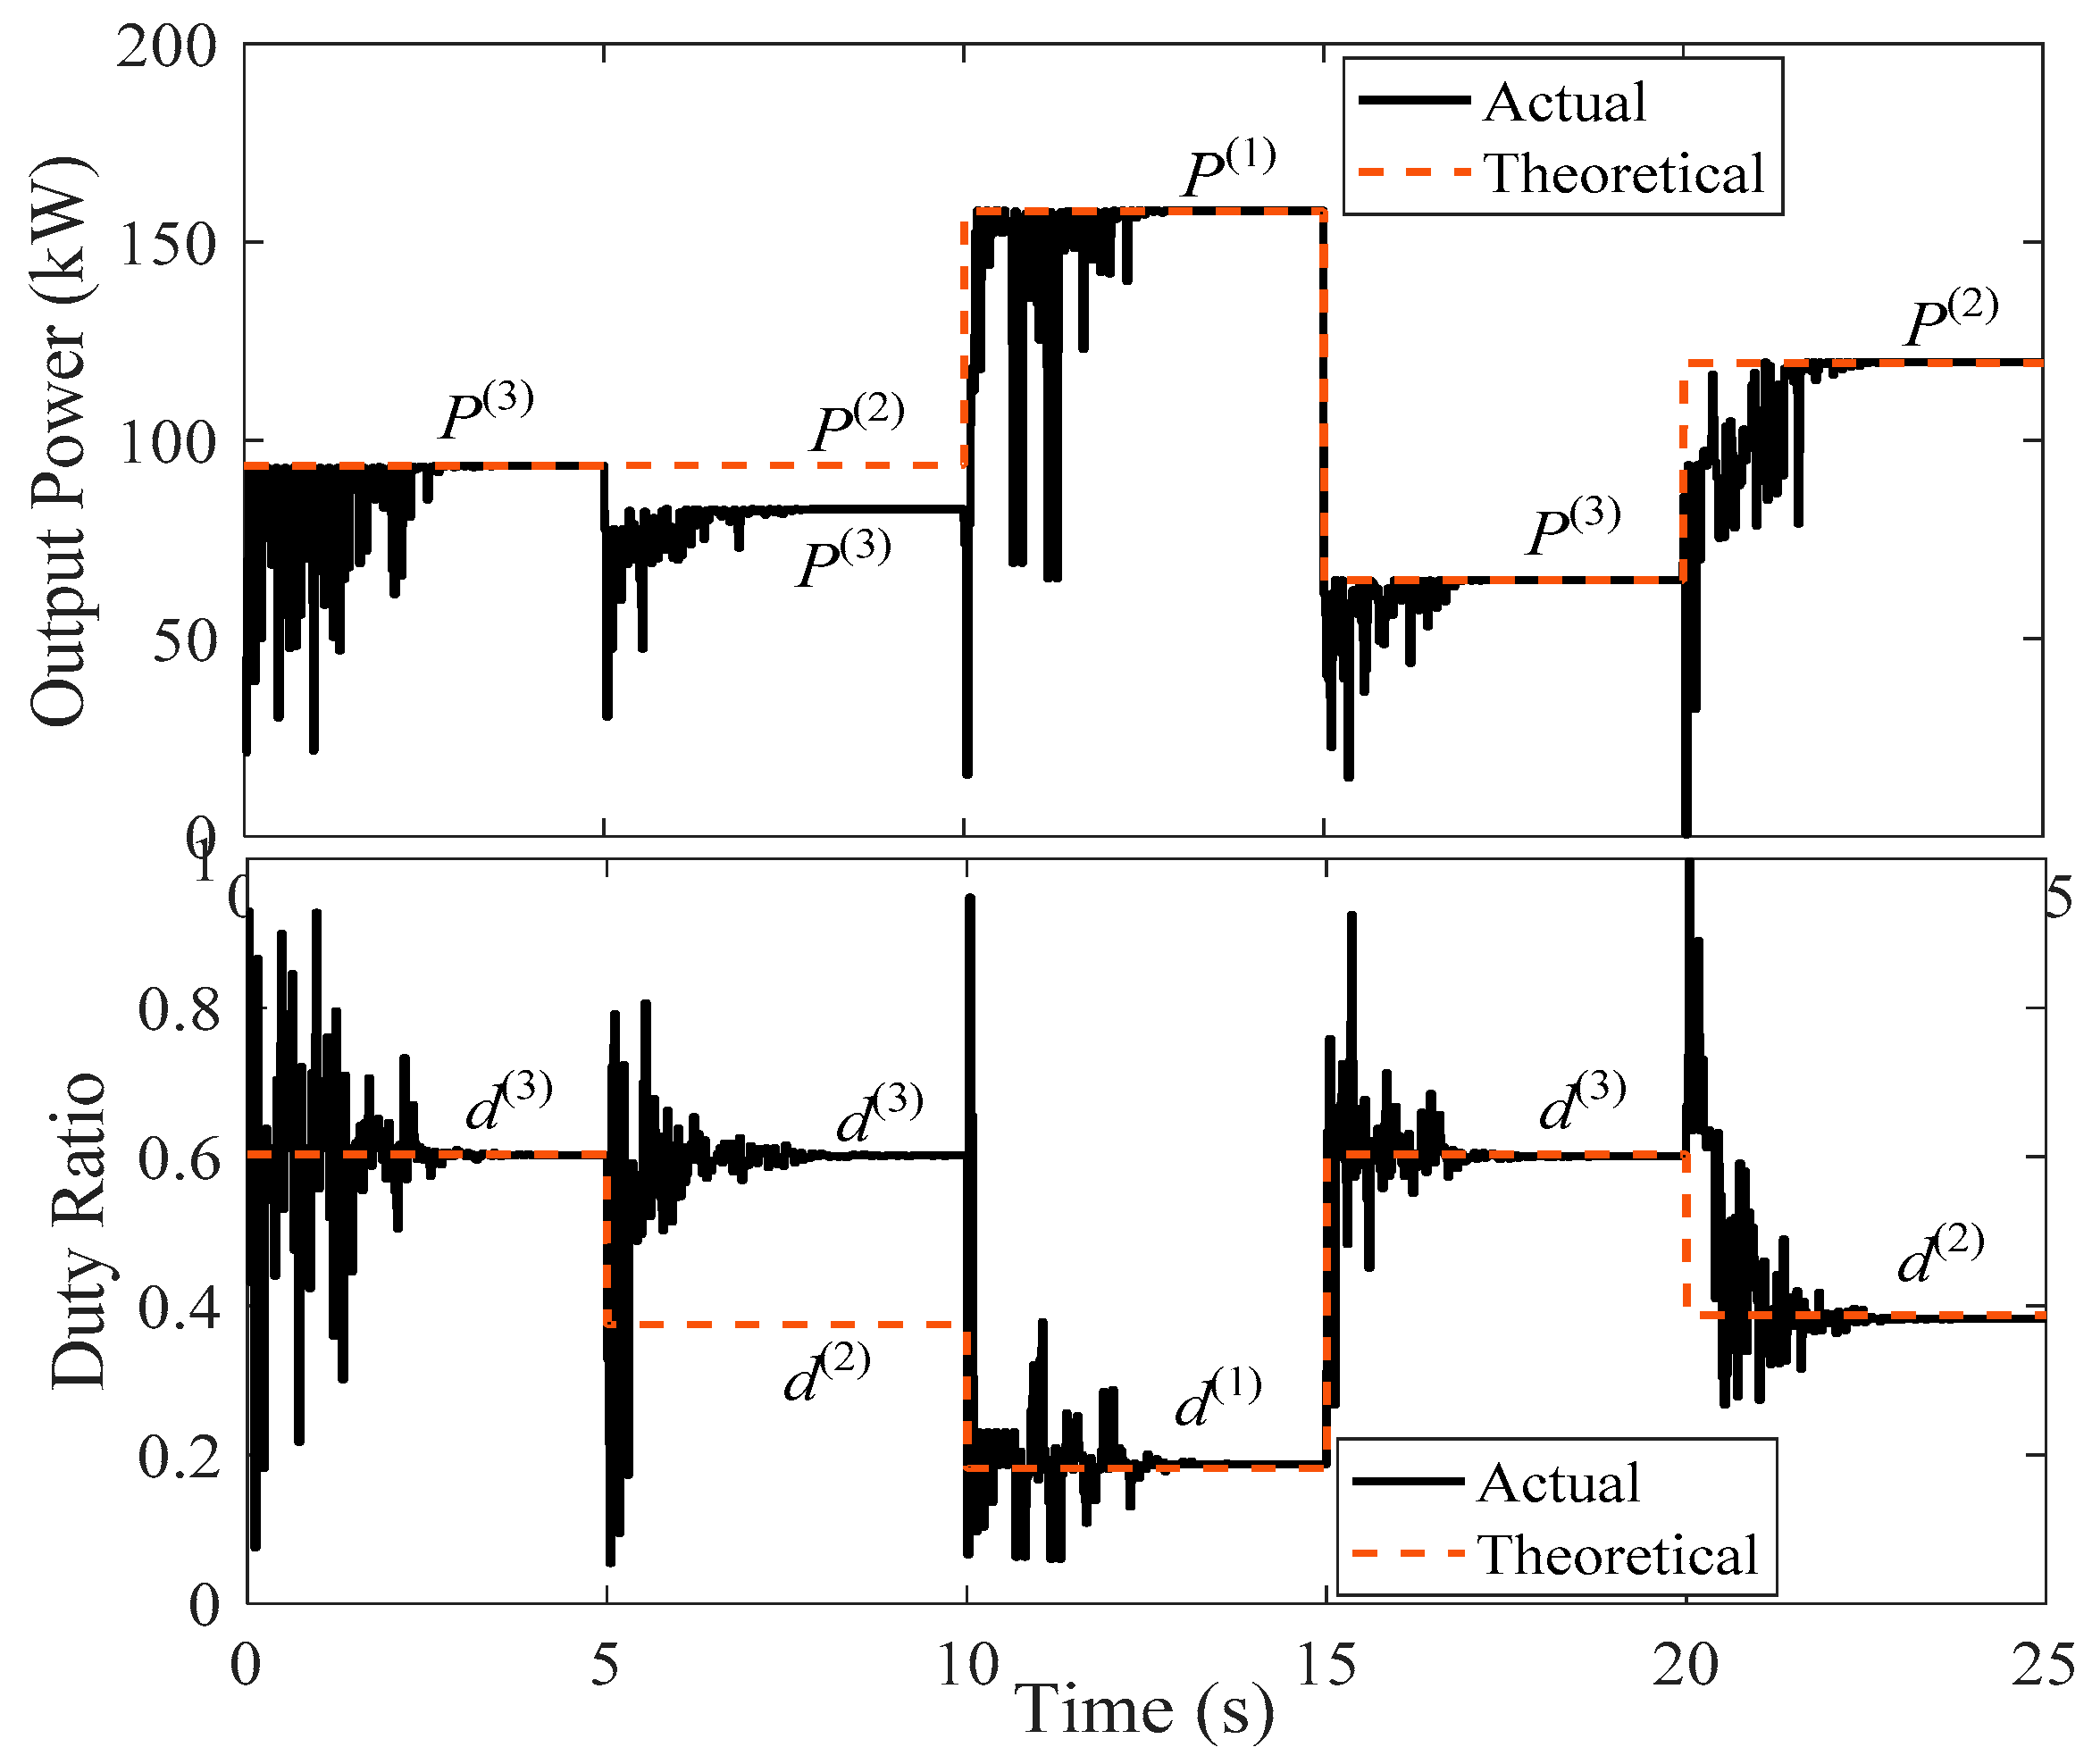
4.2. Simulation Results with Random Reinitialization

The second simulation study is state-of-the-art PSO [4] with random reinitialization as shown in Figure 7. For better understanding, the simulation has been divided into five points as shown in the following:
t = 0→5 s: It is clear from Figure 7 that the state-of-the-art PSO strategy [4] captured the GP effectively within 3 s for the GP at the first SP1 at [0.603, 93.5 kW].
t = 5→10 s: Once the SP changed from SP1 to SP2 at t = 5 s, the new generated power was [0.603, 78.5 kW], which means that the change in power shown in Equation (3) is (93.5−78.5)/78.5 = 19.1% which validates the condition shown in Equation (3) and forces the PSO strategy to reinitialize (random dispersal of the PSO particles), spending about 3 s to get to the steady state. Unfortunately, the random reinitialization caused premature convergence here; instead of capturing the GP at SP2 [0.375, 93.7 kW], the PSO captured an LP at [0.6, 83 kW] which reduces the generated power by (93.7−83)/83 = 12.9%. This reduction in generated power shows the shortcoming of premature convergence inherent in random reinitialization.
t = 10→15 s: Once the SP changed from SP2 to SP3 at t = 10 s, the new generated power will be [0.603, 88 kW] which means the change in power shown in Equation (3) will be (83−88)/88 = 5.7% which validates the condition shown in Equation (3) and forces the PSO strategy to reinitialize (randomly disperse the PSO particles), spending about 3 s to get to the steady state once again. Fortunately, the random reinitialization captured the GP at SP3 at [0.182, 157.8 kW], which increased the power compared to same period without reinitialization (Figure 6) by (157.8−88)/88 = 80%. This increase in the power captured demonstrates the importance of reinitialization.
t = 15→20 s: Once the SP changed from SP3 to SP4 at t = 15 s, the new generated power will be [0.182, 25 kW] which means the change in power shown in Equation (3) is (157.8−25)/25 = 531%, which once again validates the condition shown in Equation (3), and forces the PSO strategy to reinitialize (random dispersal of the PSO particles) spending another 3 s approximately to get to the steady state. Fortunately, the random reinitialization captured the GP of SP4 at [0.6, 65 kW], which has comparable power to the same period in the without reinitialization case (Figure 6).
t = 20→25 s: Once the SP changed from SP4 to SP5 at t = 20 s, the new generated power will be [0.603, 97 kW] which causes change in power as shown in Equation (3), i.e., (97−65)/65 = 49.2%, which validates the condition shown in Equation (3) and forces the PSO strategy to reinitialize (random dispersal of the PSO particles). Particles spent about 3 s to get the steady state yet again. Fortunately, the random reinitialization captured the GP at [0.4, 118 kW], which increased the power compared to same period without reinitialization (Figure 6) by (118−97)/97 = 21.7%. This increase in the power captured again illustrates the importance of reinitialization.
As previously mentioned, random reinitialization has two main problems which are: the long convergence time and the increase in the chance of the premature convergence. These two problems have been solved partially by reinitializing the particles at the anticipated places of peaks that can be obtained from Equation (3) as introduced in [15] where, the convergence time reduces from 3 s to 2.2 s as shown in Figure 7 and the chance for premature convergence is reduced considerably.
Table 3 shows the comparison of simulation results between the state-of-the-art strategy without reinitialization [4] (Figure 6) and the state-of-the-art strategy using random reinitialization (Figure 7) [15]. These results show increase in generated power when random reinitialization is done (Figure 7) compared to the results when reinitialization is not done (Figure 6) hence the necessity of reinitialization.

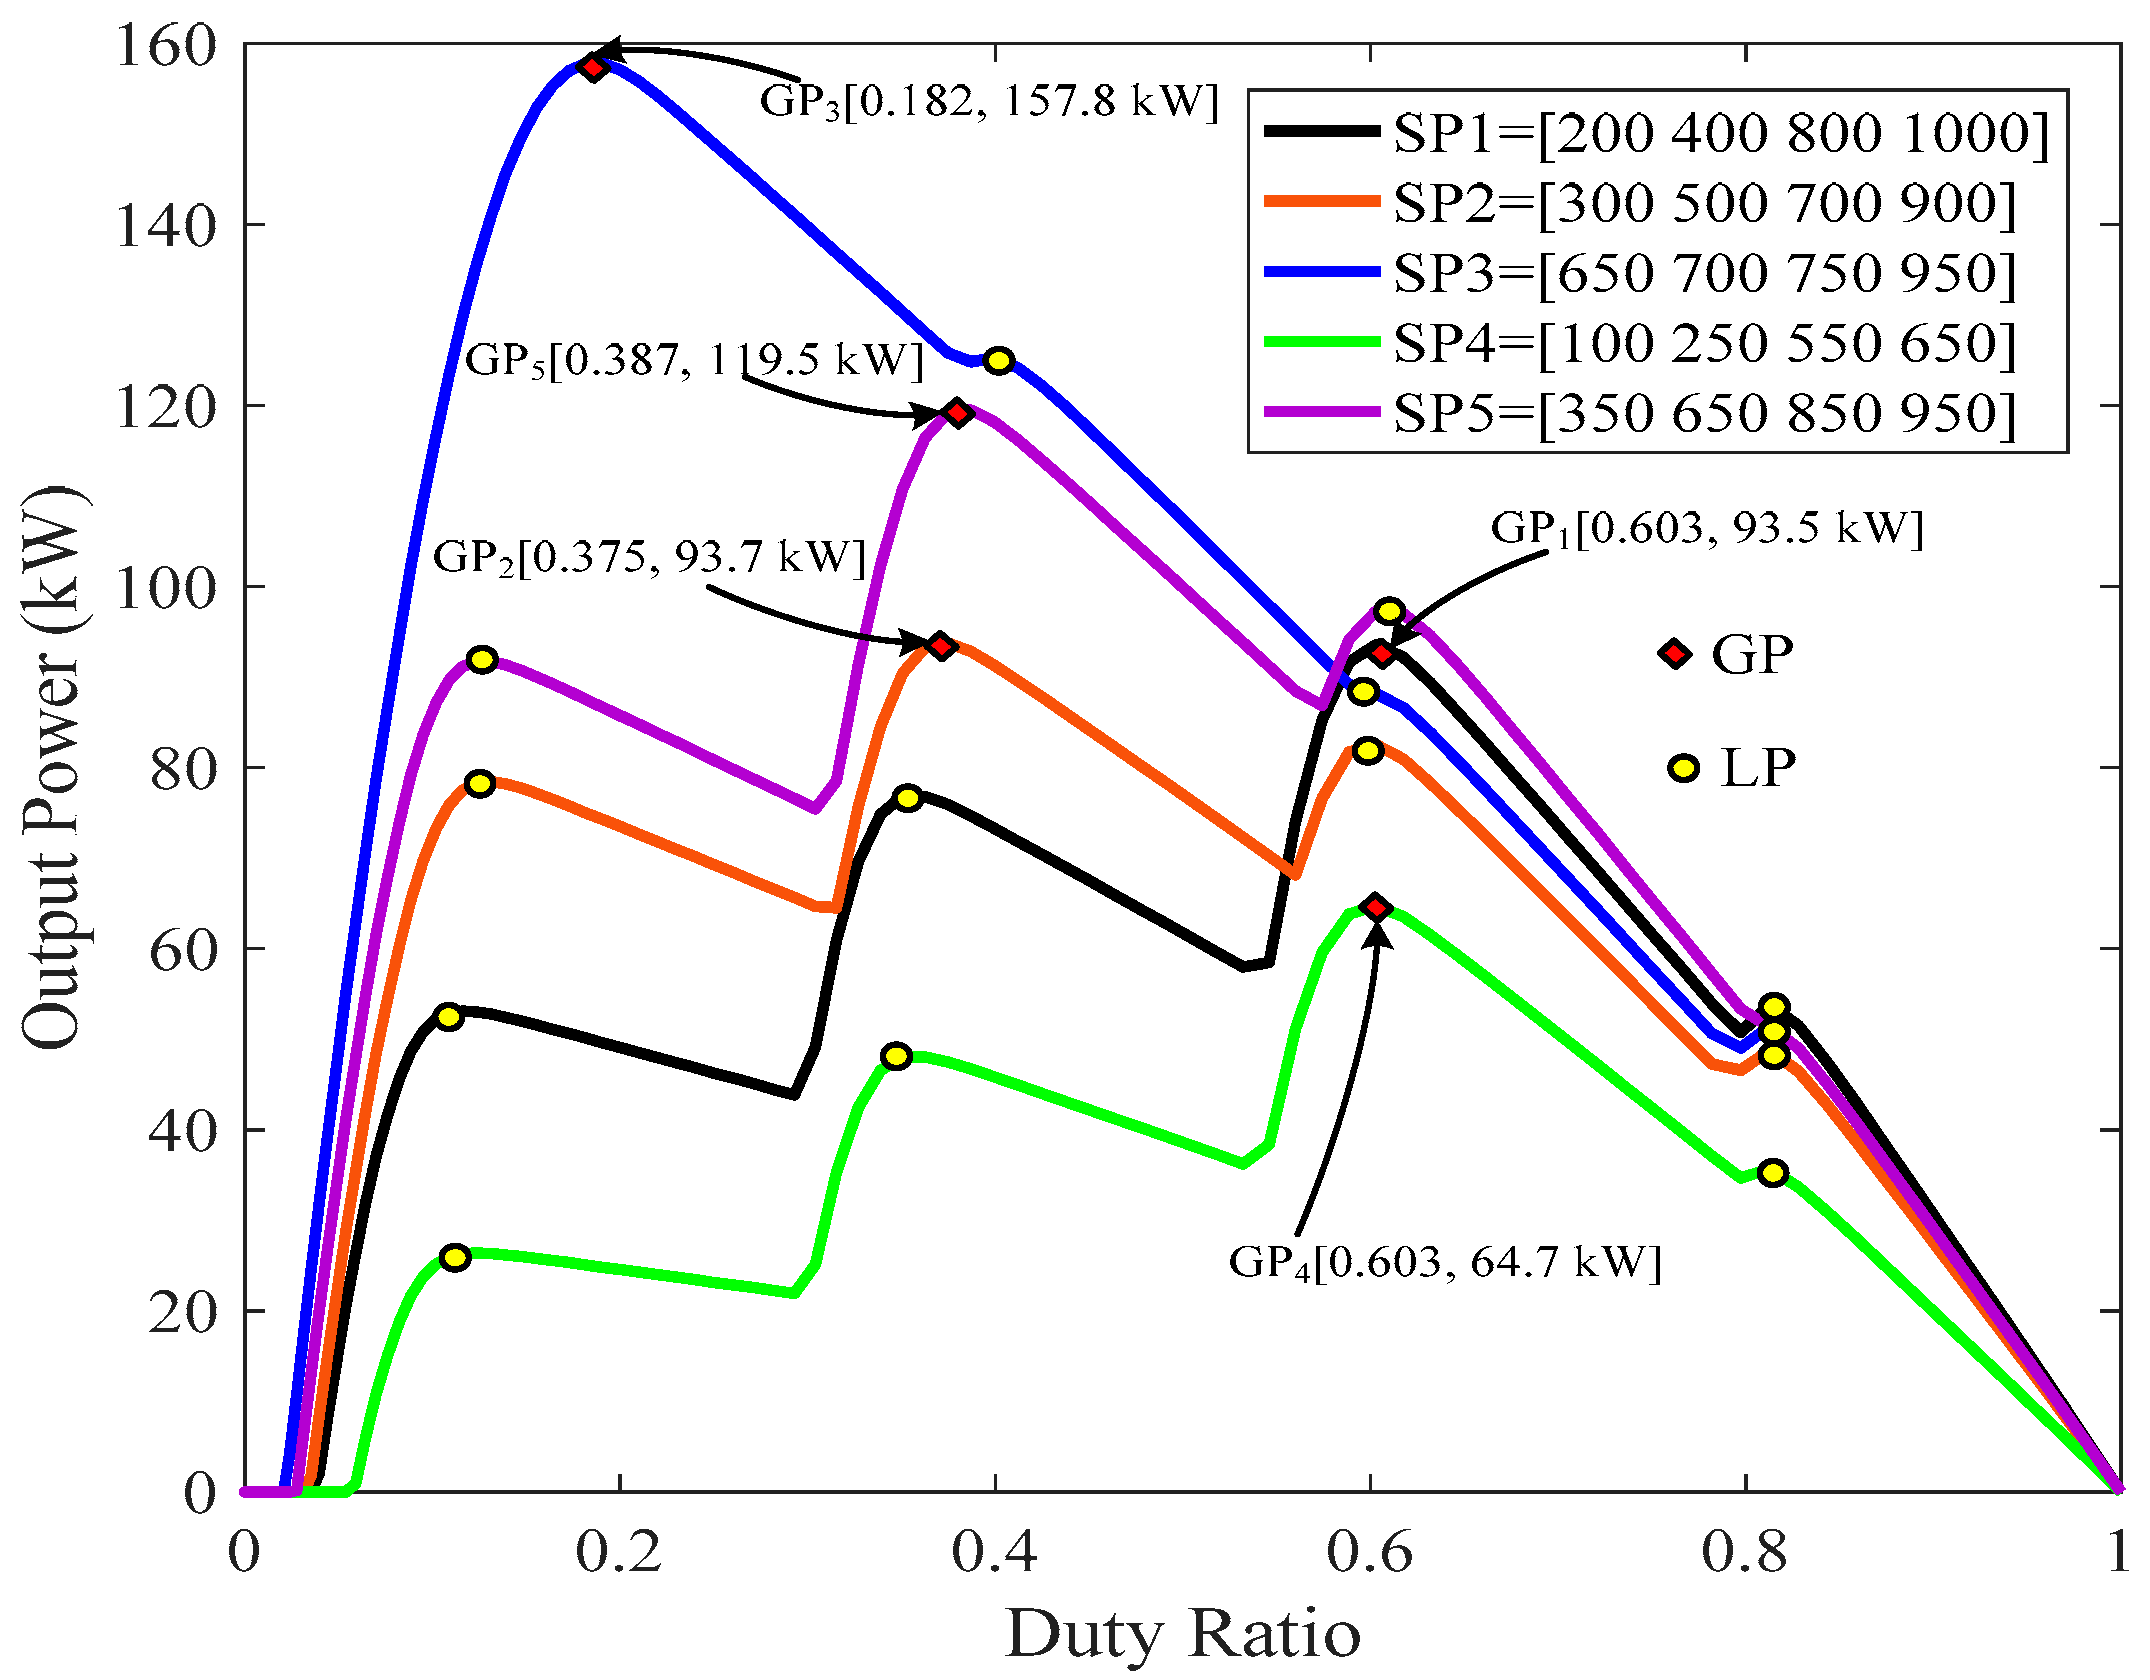
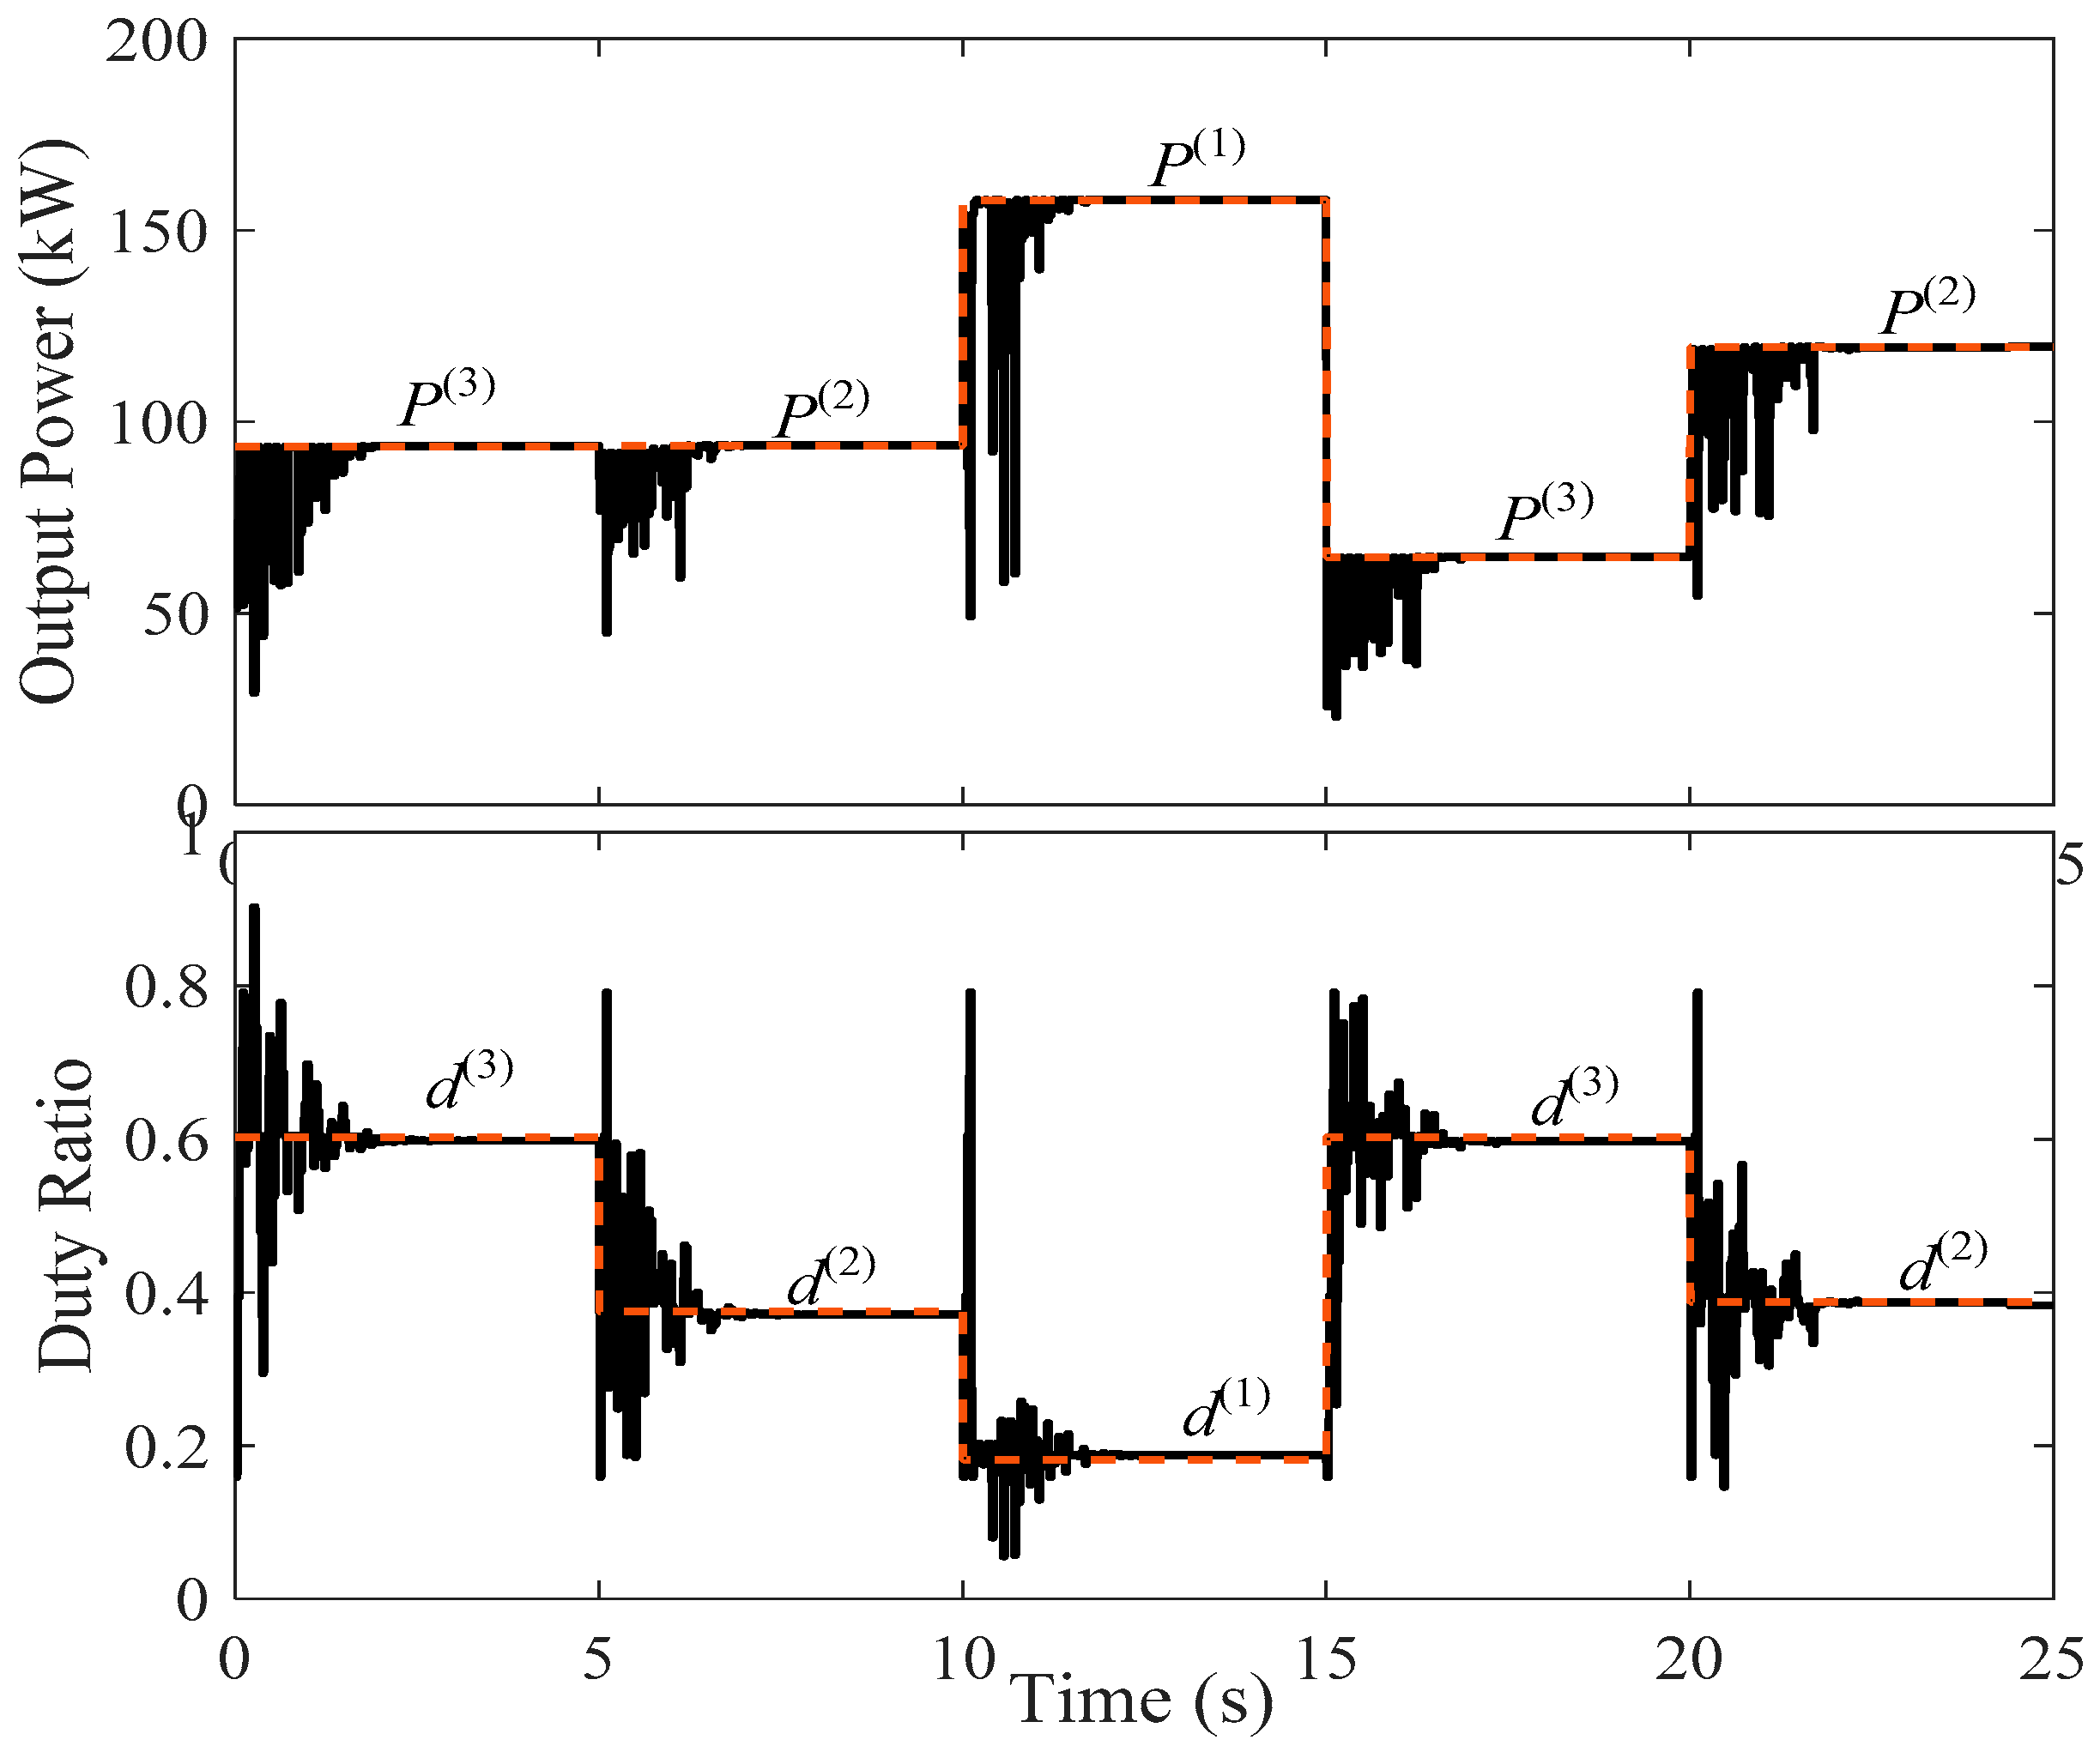
4.3. Simulation Results with Reinitialization at Anticipated Peaks

The third simulation study uses the state-of-the-art strategy [15] with reinitialization at the duty ratios of the anticipated peaks; these values adopted at the start are [0.182, 0.375, 0.603, and 0.8]. These values are updated during the simulation based on the logic shown in Figure 5. The results of this study are shown in Figure 8. These results show better performance than when reinitialization is done with random values as shown in Figure 7 [4]. It is clear that with reinitialization at duty ratios of anticipated peaks [15], the PSO never misses the GP and the convergence time reduced to 2.2 s as compared to the 3 s needed in the case of random reinitialization [4]. This means that the reinitialization at the duty ratio of the anticipated peaks reduced the time by (3−2.2)/2.2 = 36%. These results show the importance of reinitializing the PSO particles at the duty ratios of the anticipated peaks when compared to the random reinitialization.

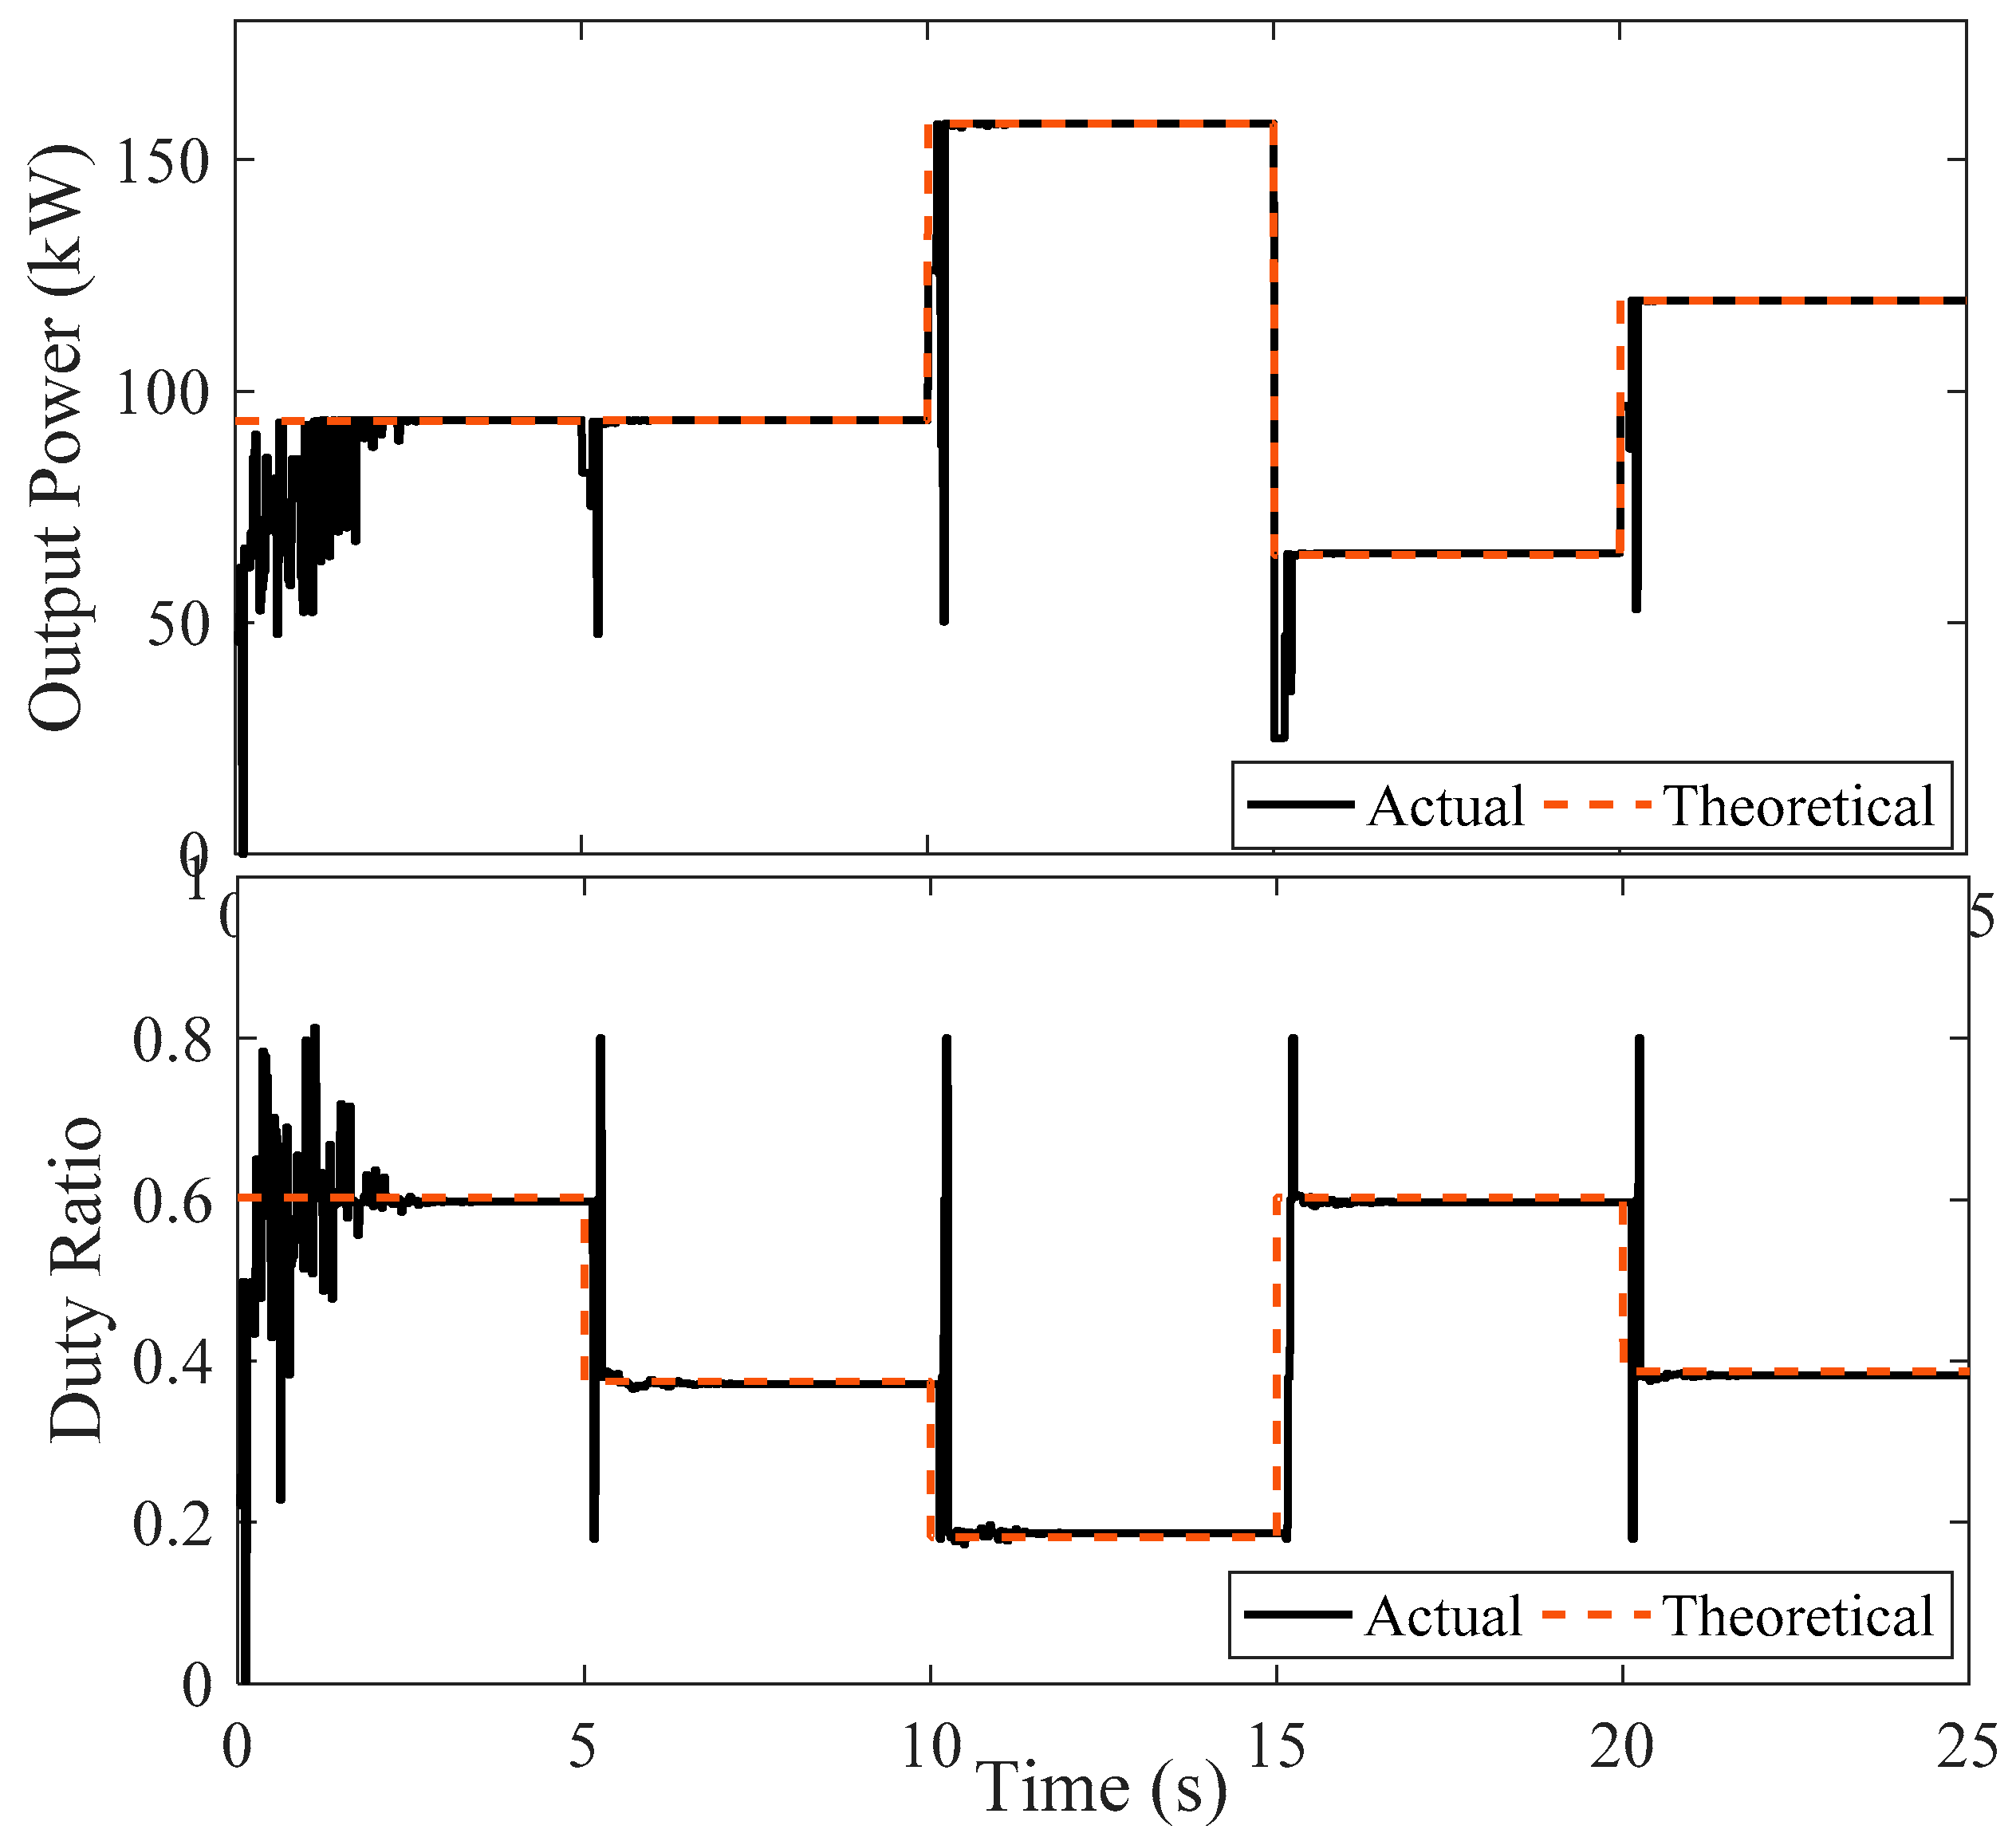
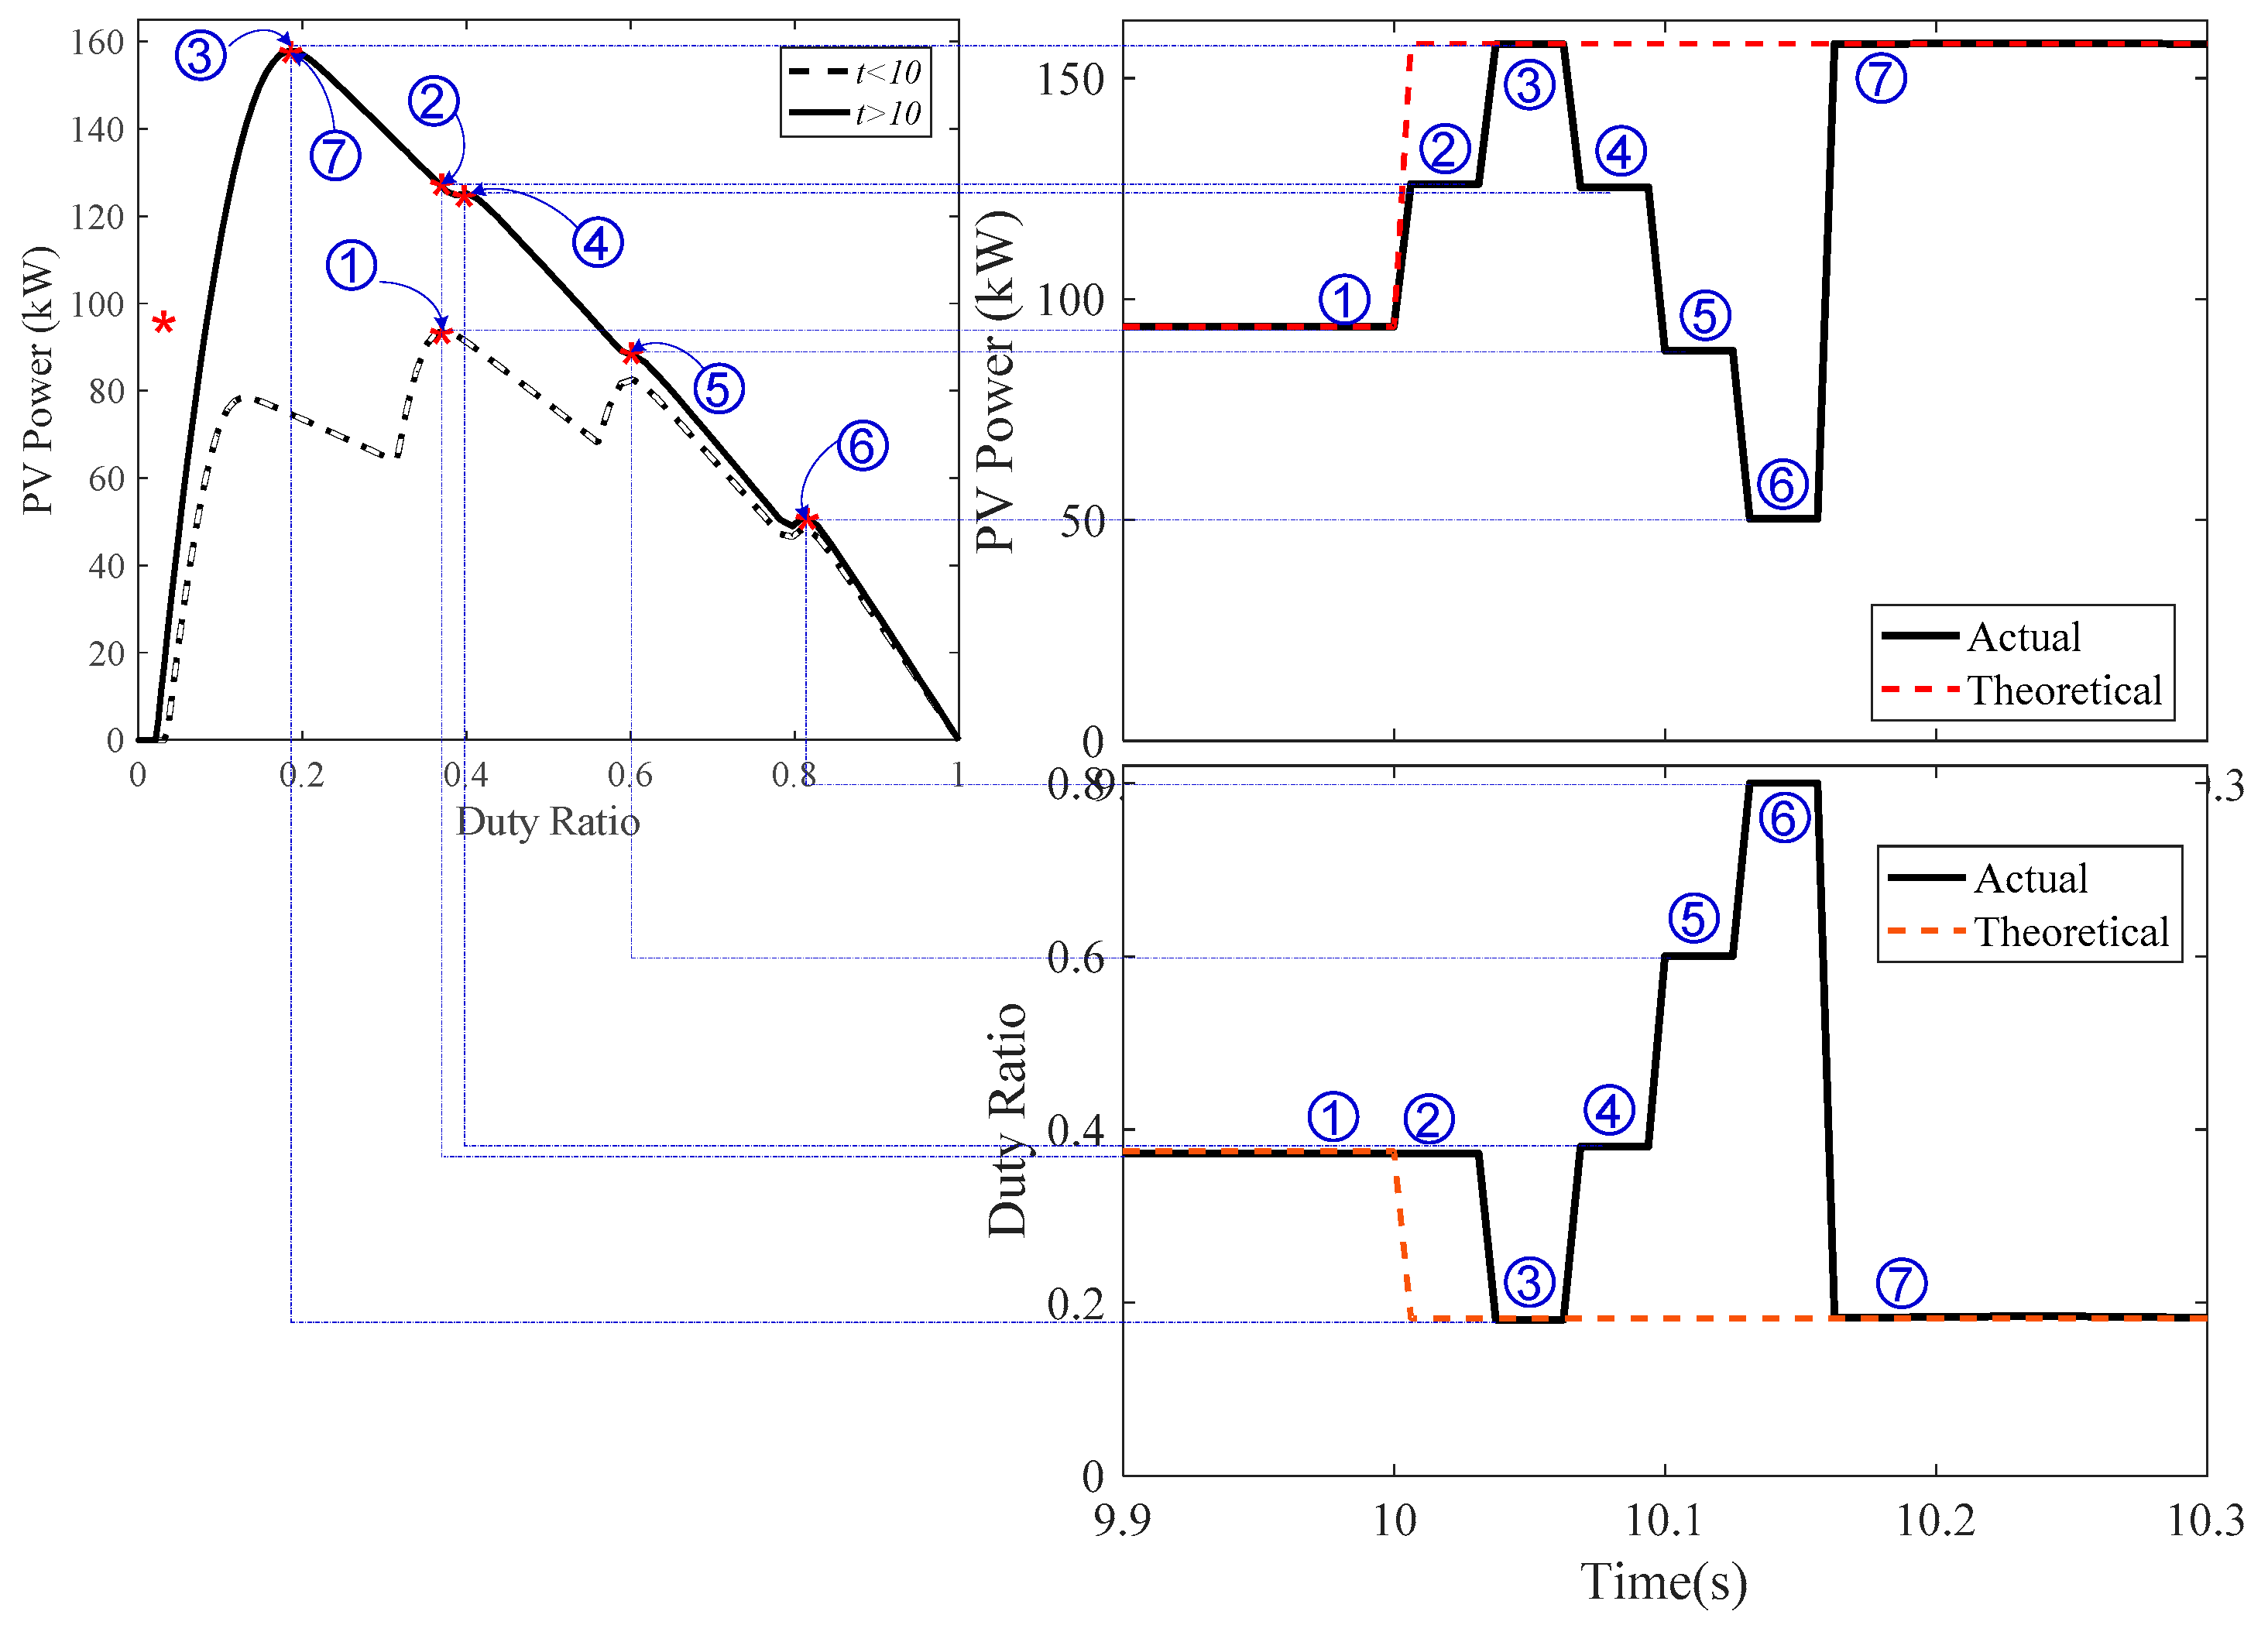
4.4. Simulation Results Using Scanning Particle

The last simulation study was carried out using the new proposed “scanning particle” strategy. It is clear from Figure 9 that, in the initialization (SP1, t = 0 s), the PSO started at the anticipated places of peaks that can be determined from Equation (3) and captured the GP [0.603, 93.5 kW] after 2.2 s and was still working at this value until the starting time for SP2 at time t = 5 s. Once the SP changed from SP1 to SP2, the new generated power will be [0.603, 78.5 kW] which changes the power shown in (2) to 19.1% which validates the condition shown in Equation (2) and initiates the scanning particle. The preset values for the scanning particle are at the duty ratios of the anticipated peaks where it started with these values [0.182, 0.375, 0.603, and 0.8] as shown in Table 4. In the beginning of the journey of the scanning particle it sends the value of d(1) that can be obtained from Equation (3) which is d = 0.182 to the PV system and gets the corresponding power which is 75 kW; it then sends d(2) = 0.375, where the corresponding power will be 93 kW; similarly, d(3) = 0.603 is sent, the corresponding power of which is 83 kW; and finally d(4) = 0.8, the corresponding power for which is 49 kW. It is clear from the previous values of power that, the highest power corresponds to d(2) = 0.375, 92.8 kW, which will be the new value for the global best of the PSO and all particles of the PSO. This transition spent only 0.4 s as shown in Figure 9 instead of the times of 3 s and 2.2 s recorded for random reinitialization and the reinitialization at the anticipated peaks cases, respectively. The same operation will occur when the other shading pattern changes occur; the values of scanning particle are shown in Table 4. The transition from SP to another will activate the scanning particle to search for the new position of GP as shown in Table 4 and forces the PSO particles to work around it. The shaded values show the convergence of the system when using the scanning particles which are the real GP each period.
Figure 10 shows the transient during the scanning bat operation. This figure shows the operation during the time 9.9 < t < 10.3 s. At t < 10, the system was following the maximum power at point ①, 93.73 kW and duty ratio 0.3748. At t = 10, the shading pattern changed and the system will operate at point ② with 126.1 kW and duty ratio 0.3748. The change in power from ① to ② is (126.1−93.73)/93.73 = 34.54% which is greater than the limits shown in (2) which forces the scanning particle to start at point ③, then point ④ at 0.38 duty ratio and 125.3 kW PV power, then point ⑤ at 0.6 duty ratio and 88.38 kV PV power, the point at 0.8 duty ratio and 50.23 kW PV power. At point ⑥, the scanning particle finished its job and the maximum value is corresponding to point ③ with duty ratio 0.1819 and PV power equal 157 kW. So, the scanning bat strategy will force all particles to work at 0.1819 duty ratio and PV power equal 157 kW as shown in point ⑦. It is clear from Figure 10 that the particles are attracted very quickly to the new GP within 2 s which proves the superiority of the scanning particle methodology.
The new proposed strategy shows better performance in terms of reduction in convergence time and completely avoids premature convergence. Where, using the new proposed strategy “scanning particle”, removed the two limitations inherent in the state-of-the-art strategy. The new strategy shows better performance in terms of reduction in convergence time and complete avoidance of premature convergence. Moreover, the convergence time is reduced to 0.4 s which means that it reduced by (3−0.4)/0.4 = 650% when compared to the random reinitialization case [4] and by (2.2−0.4)/0.4 = 450% when compared to the case of reinitialization at the anticipated peaks [15]. The simulation for this strategy has been carried out 100 times to detect any instances of premature convergence; it is noticed that the GP was not missed even once. These positive results prove the superiority of the proposed PSO strategy ‘scanning particle” as an effective MPPT of dynamic variable partial shaded PV systems over other systems.

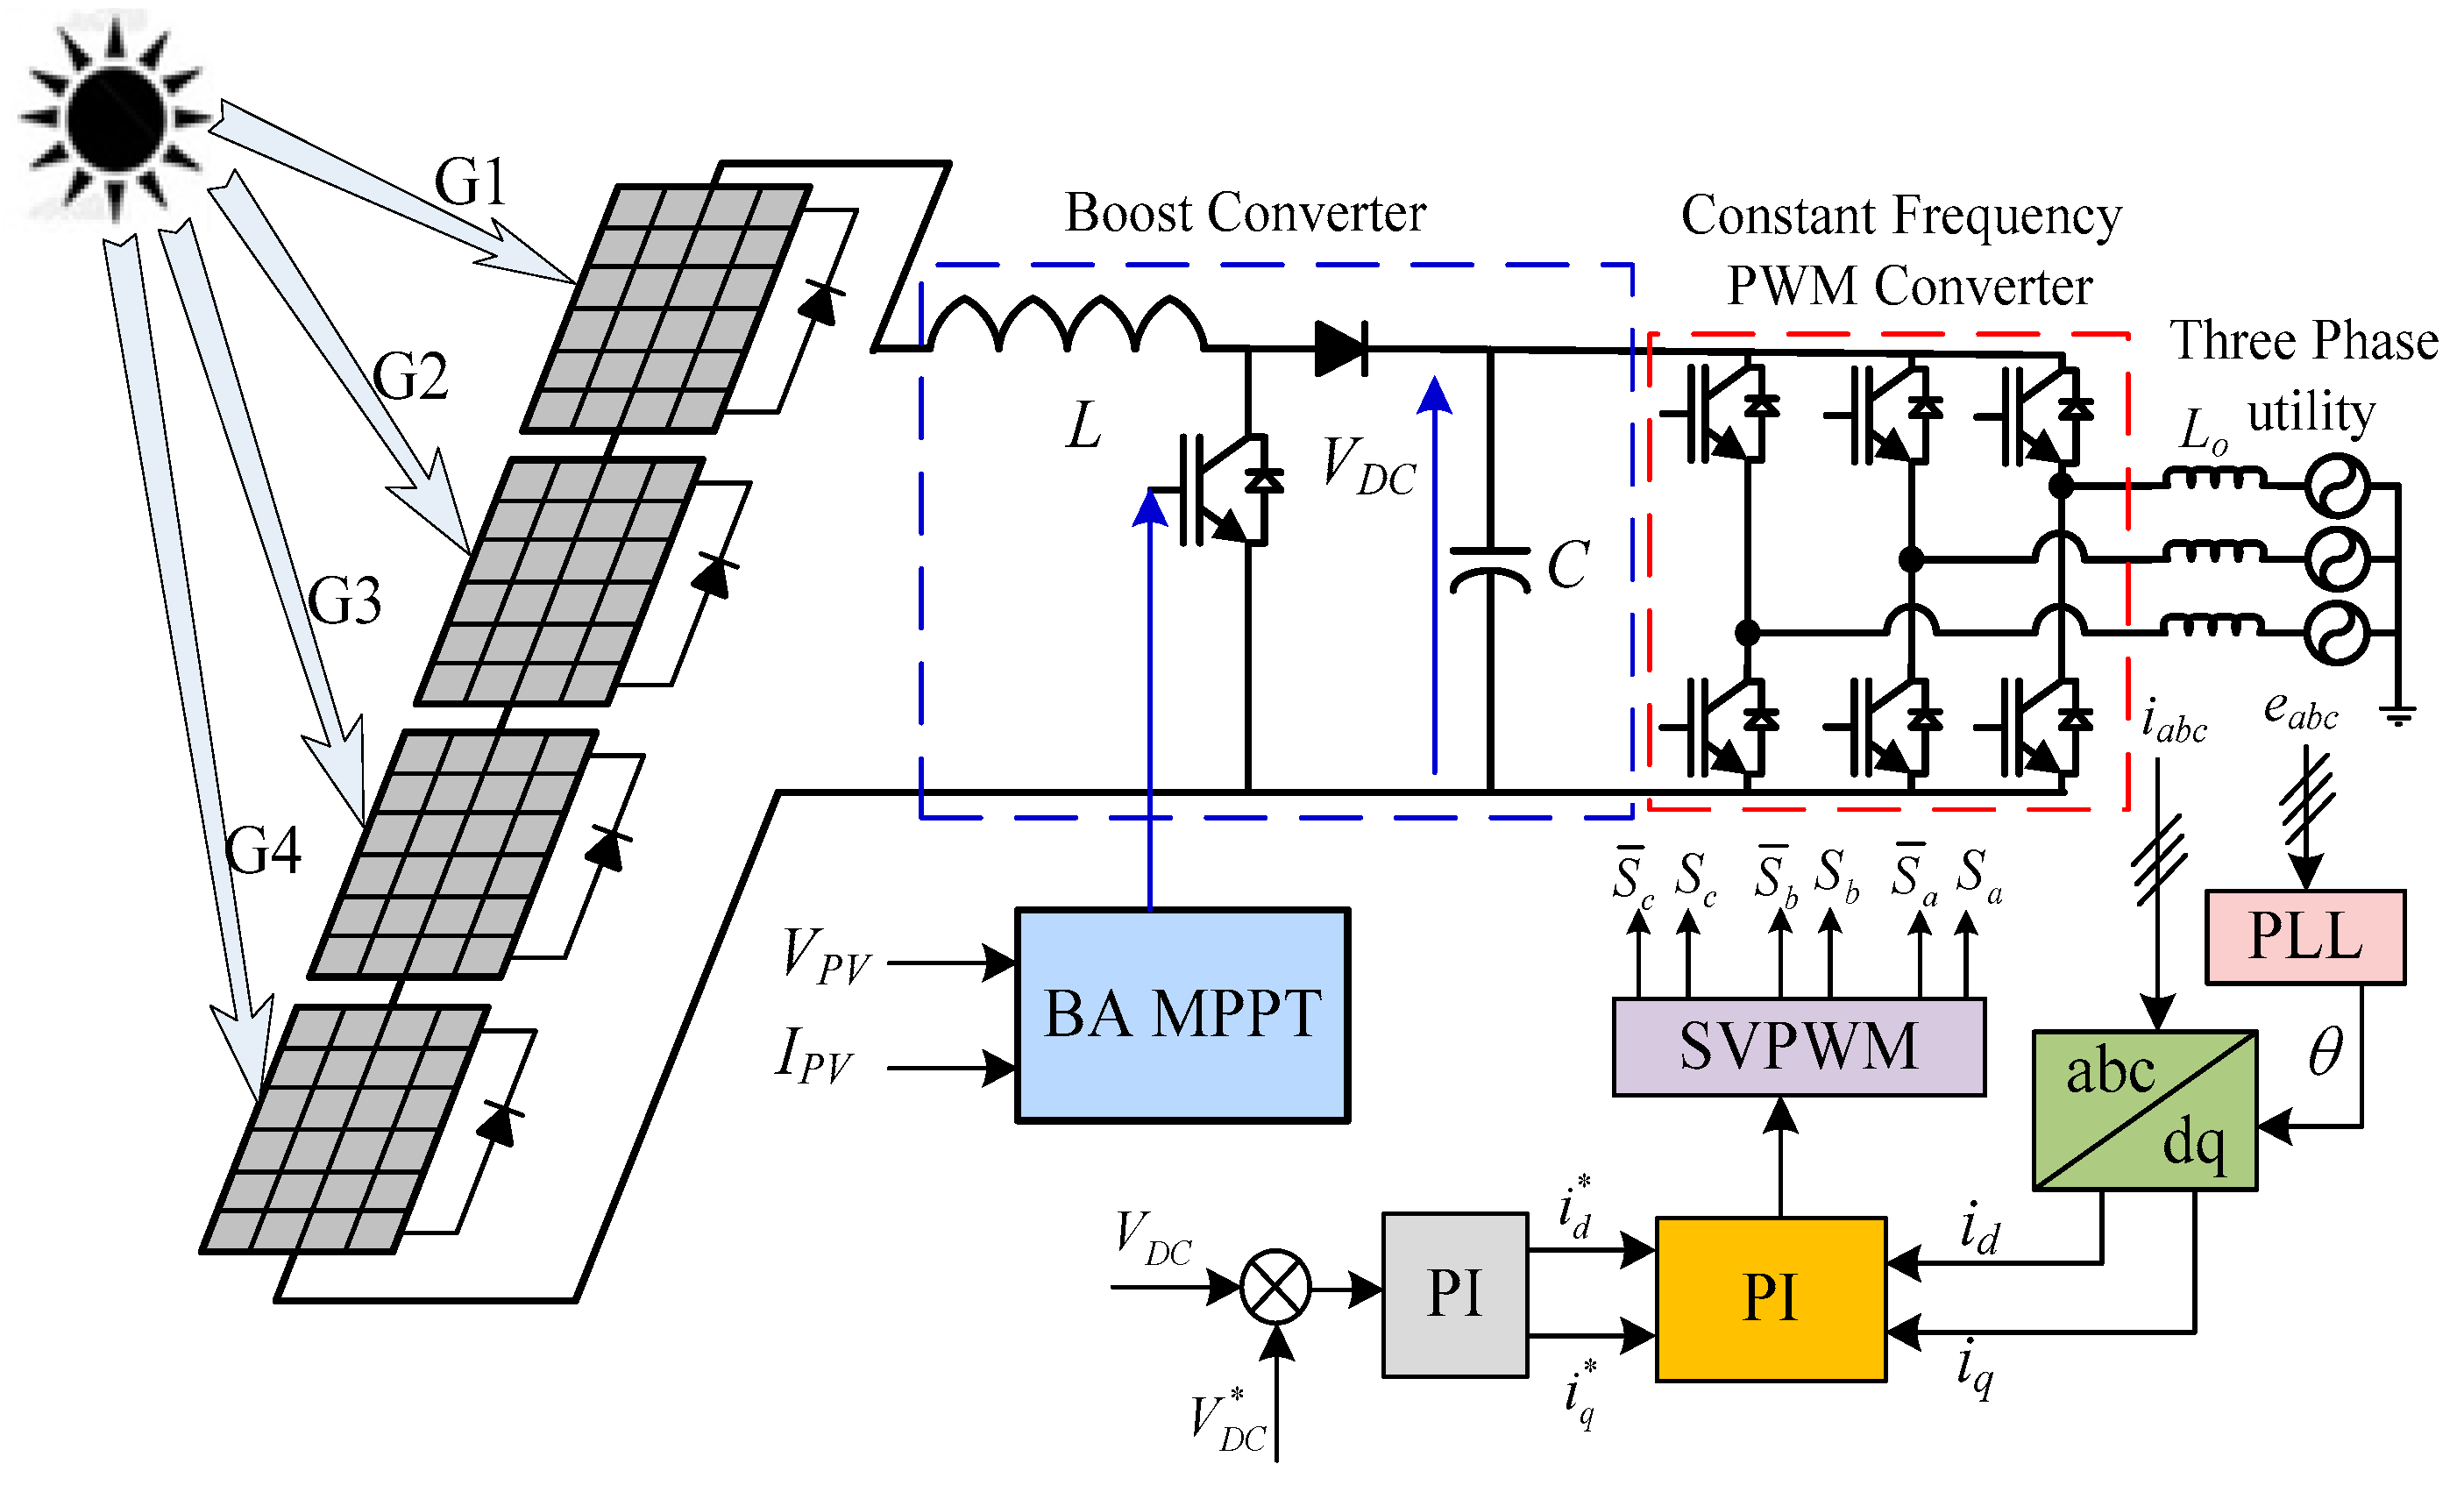
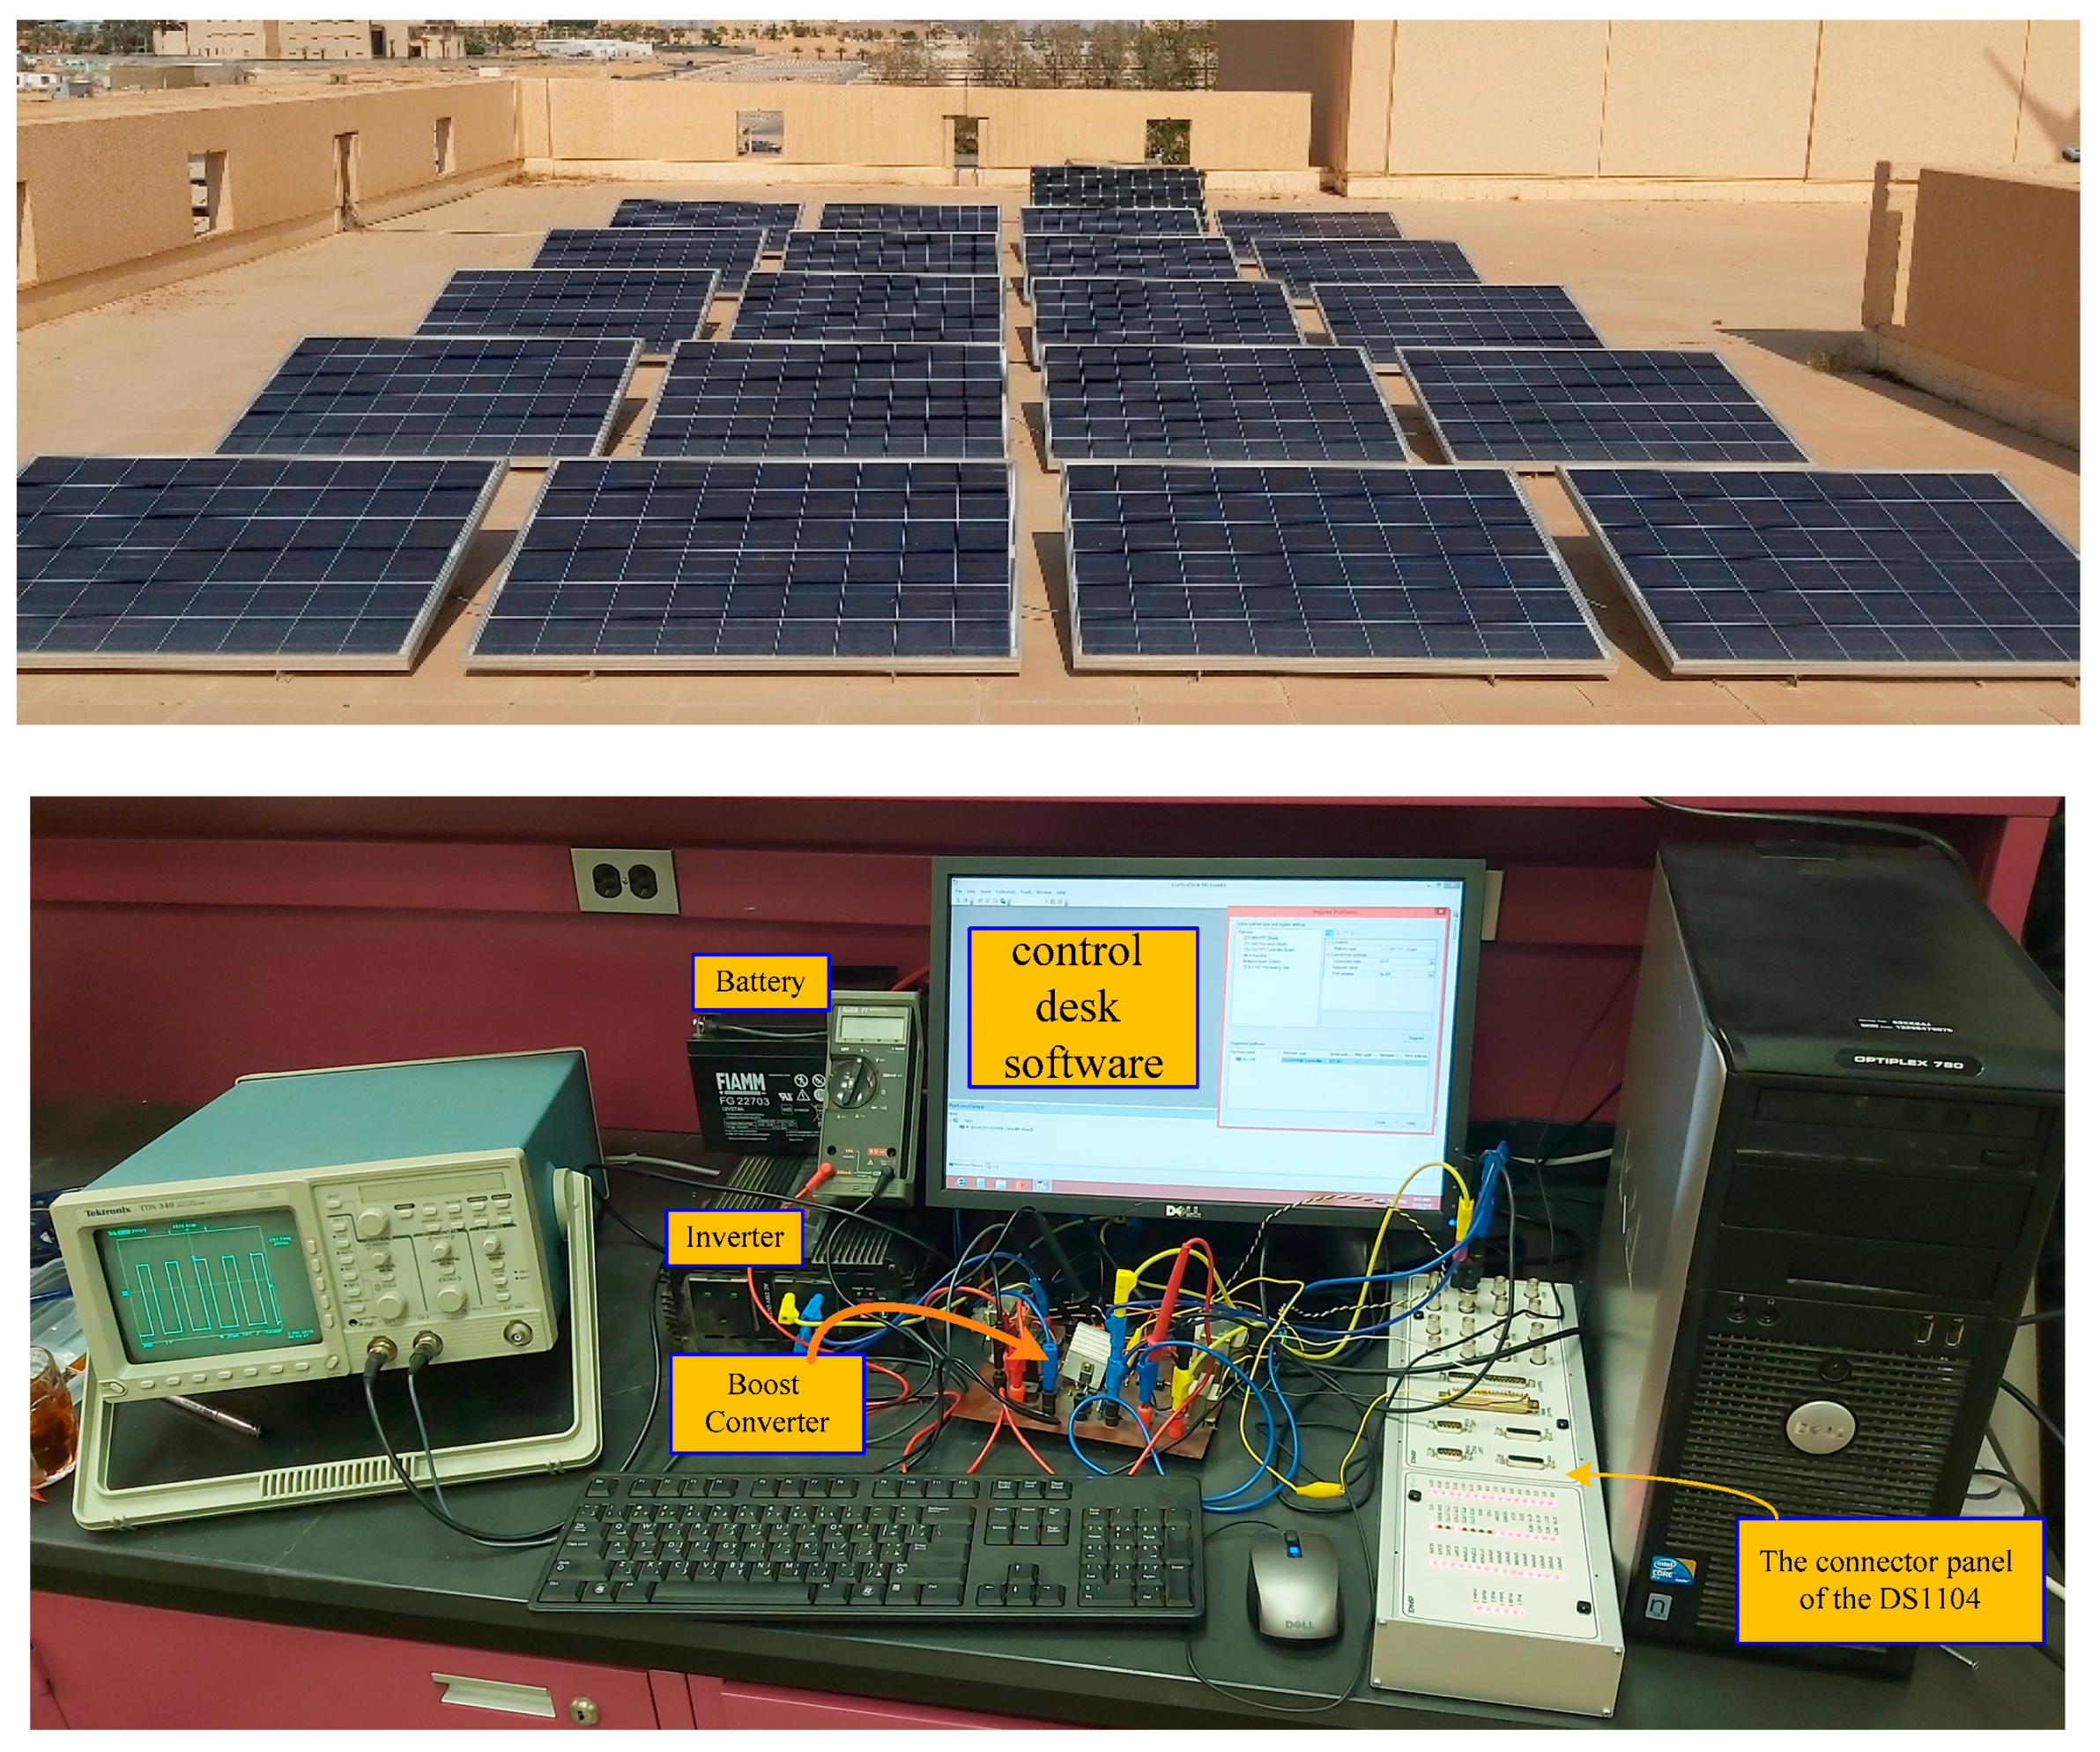
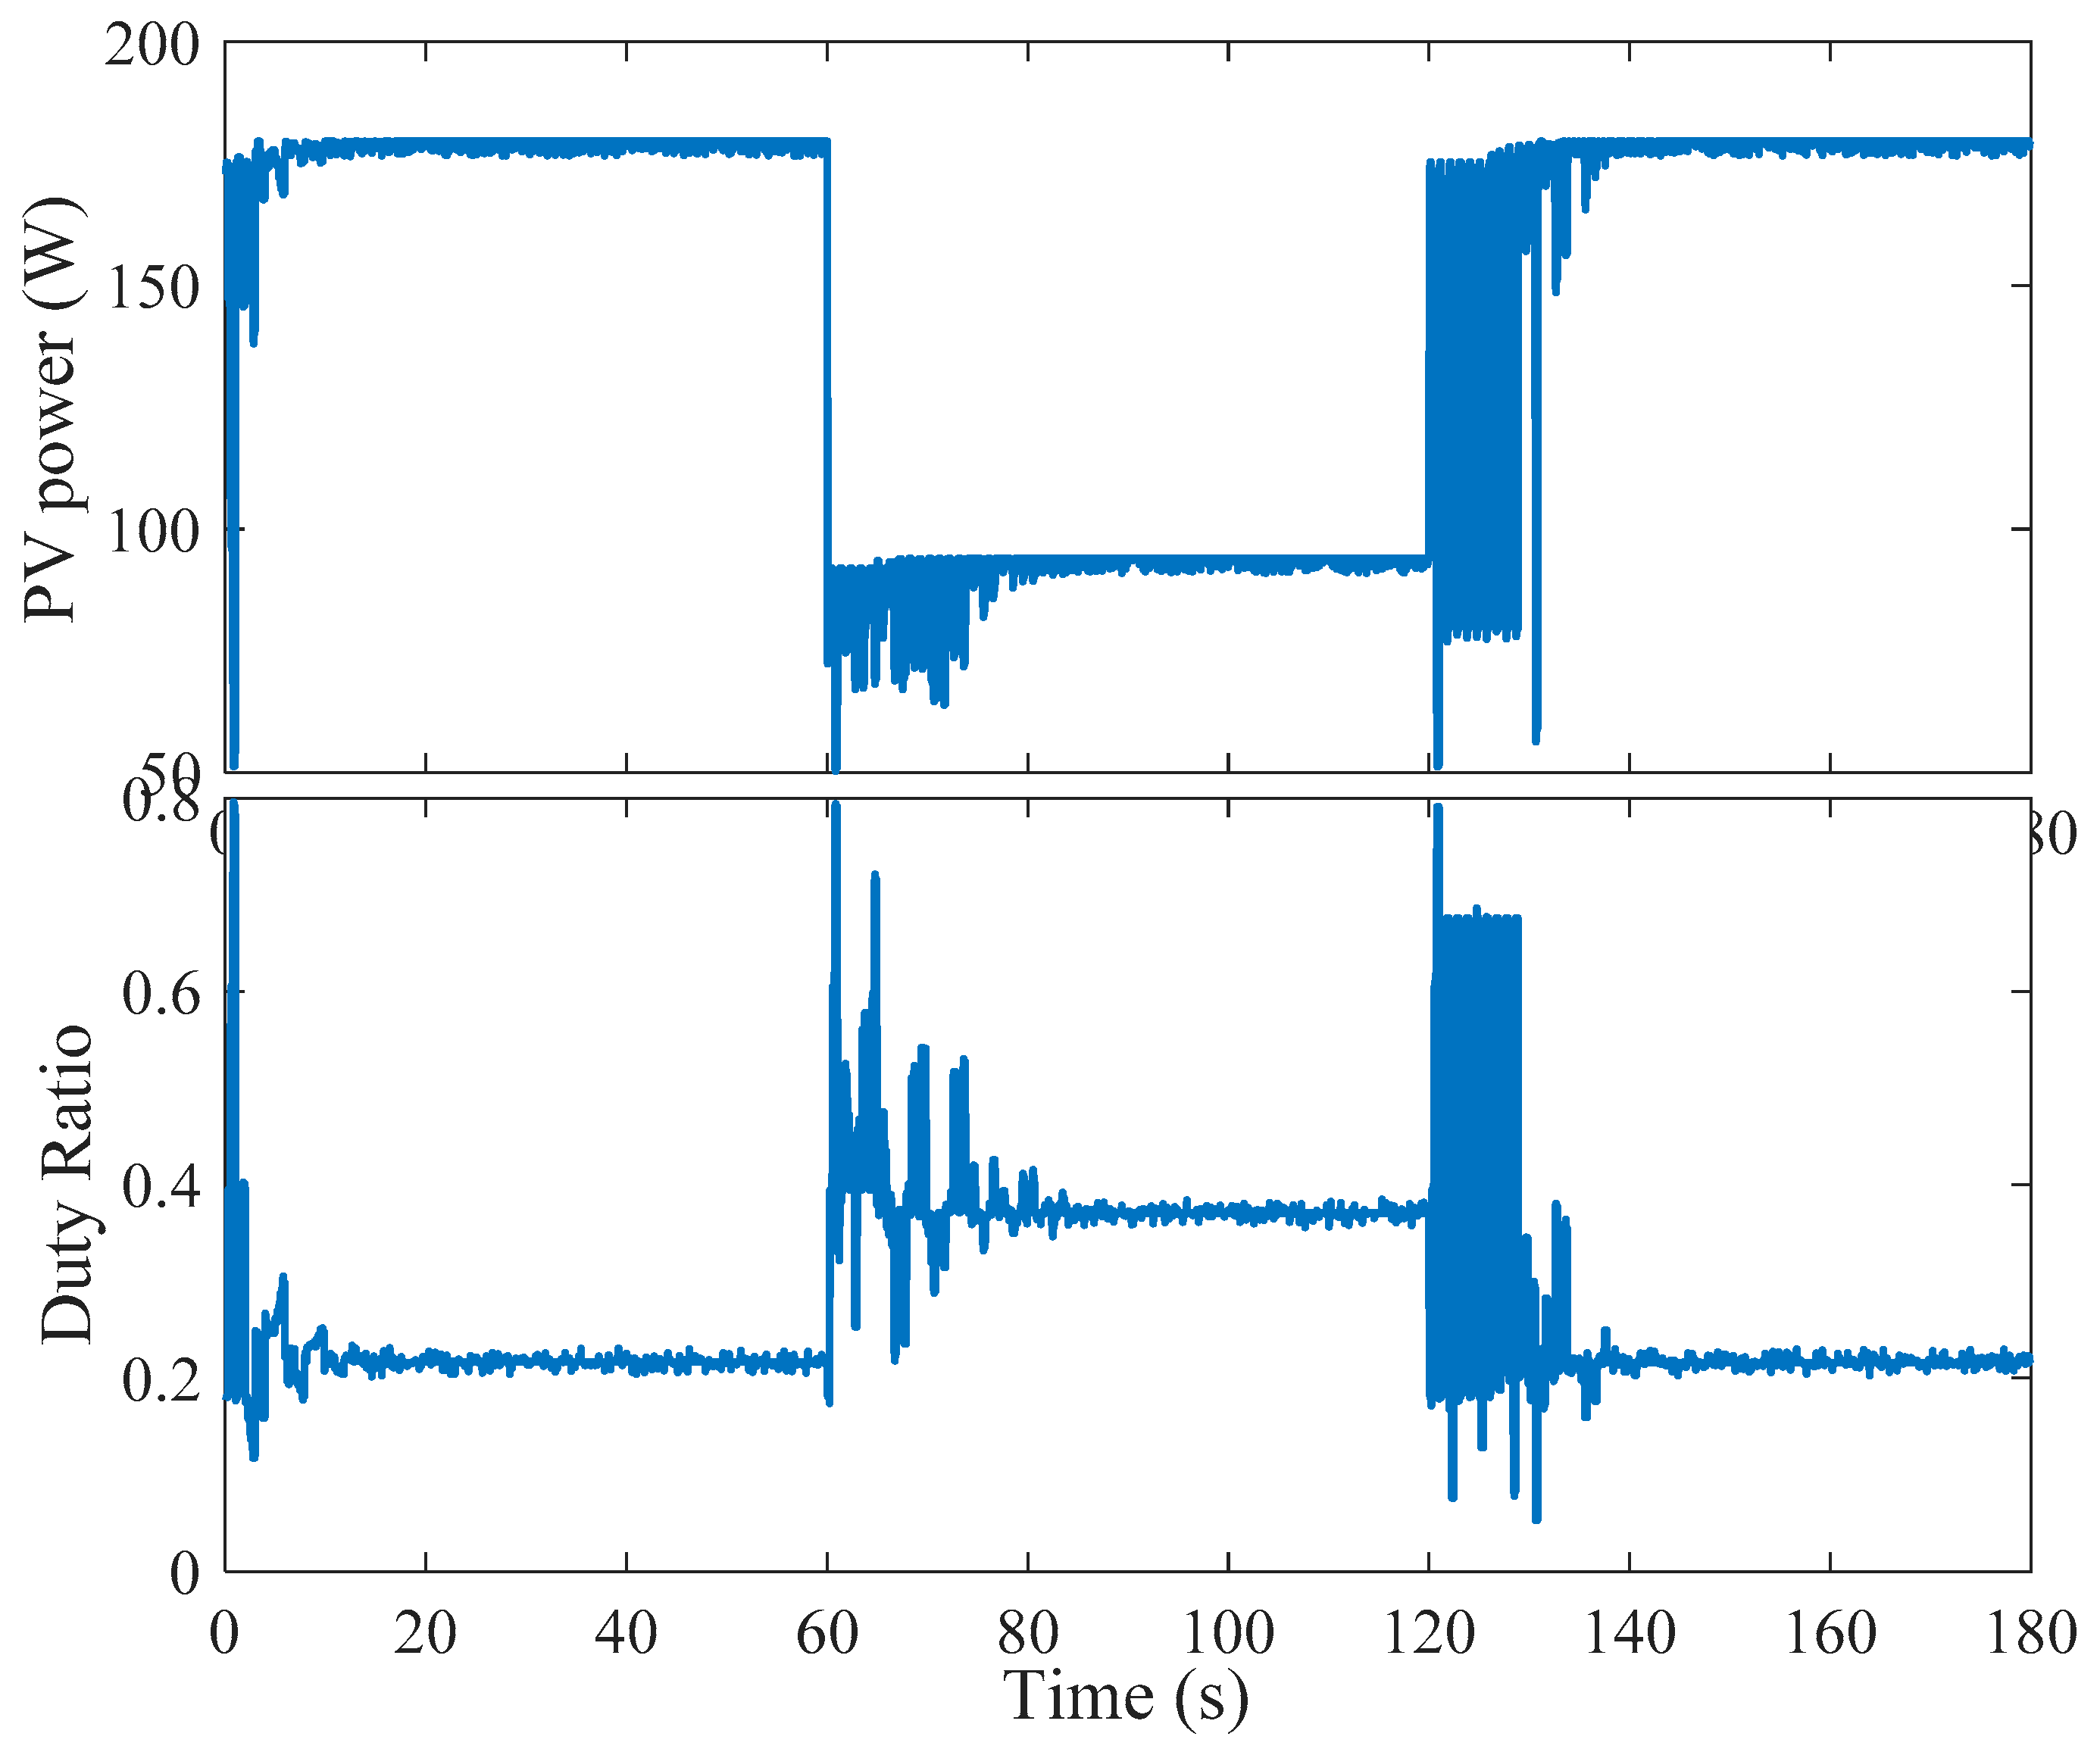
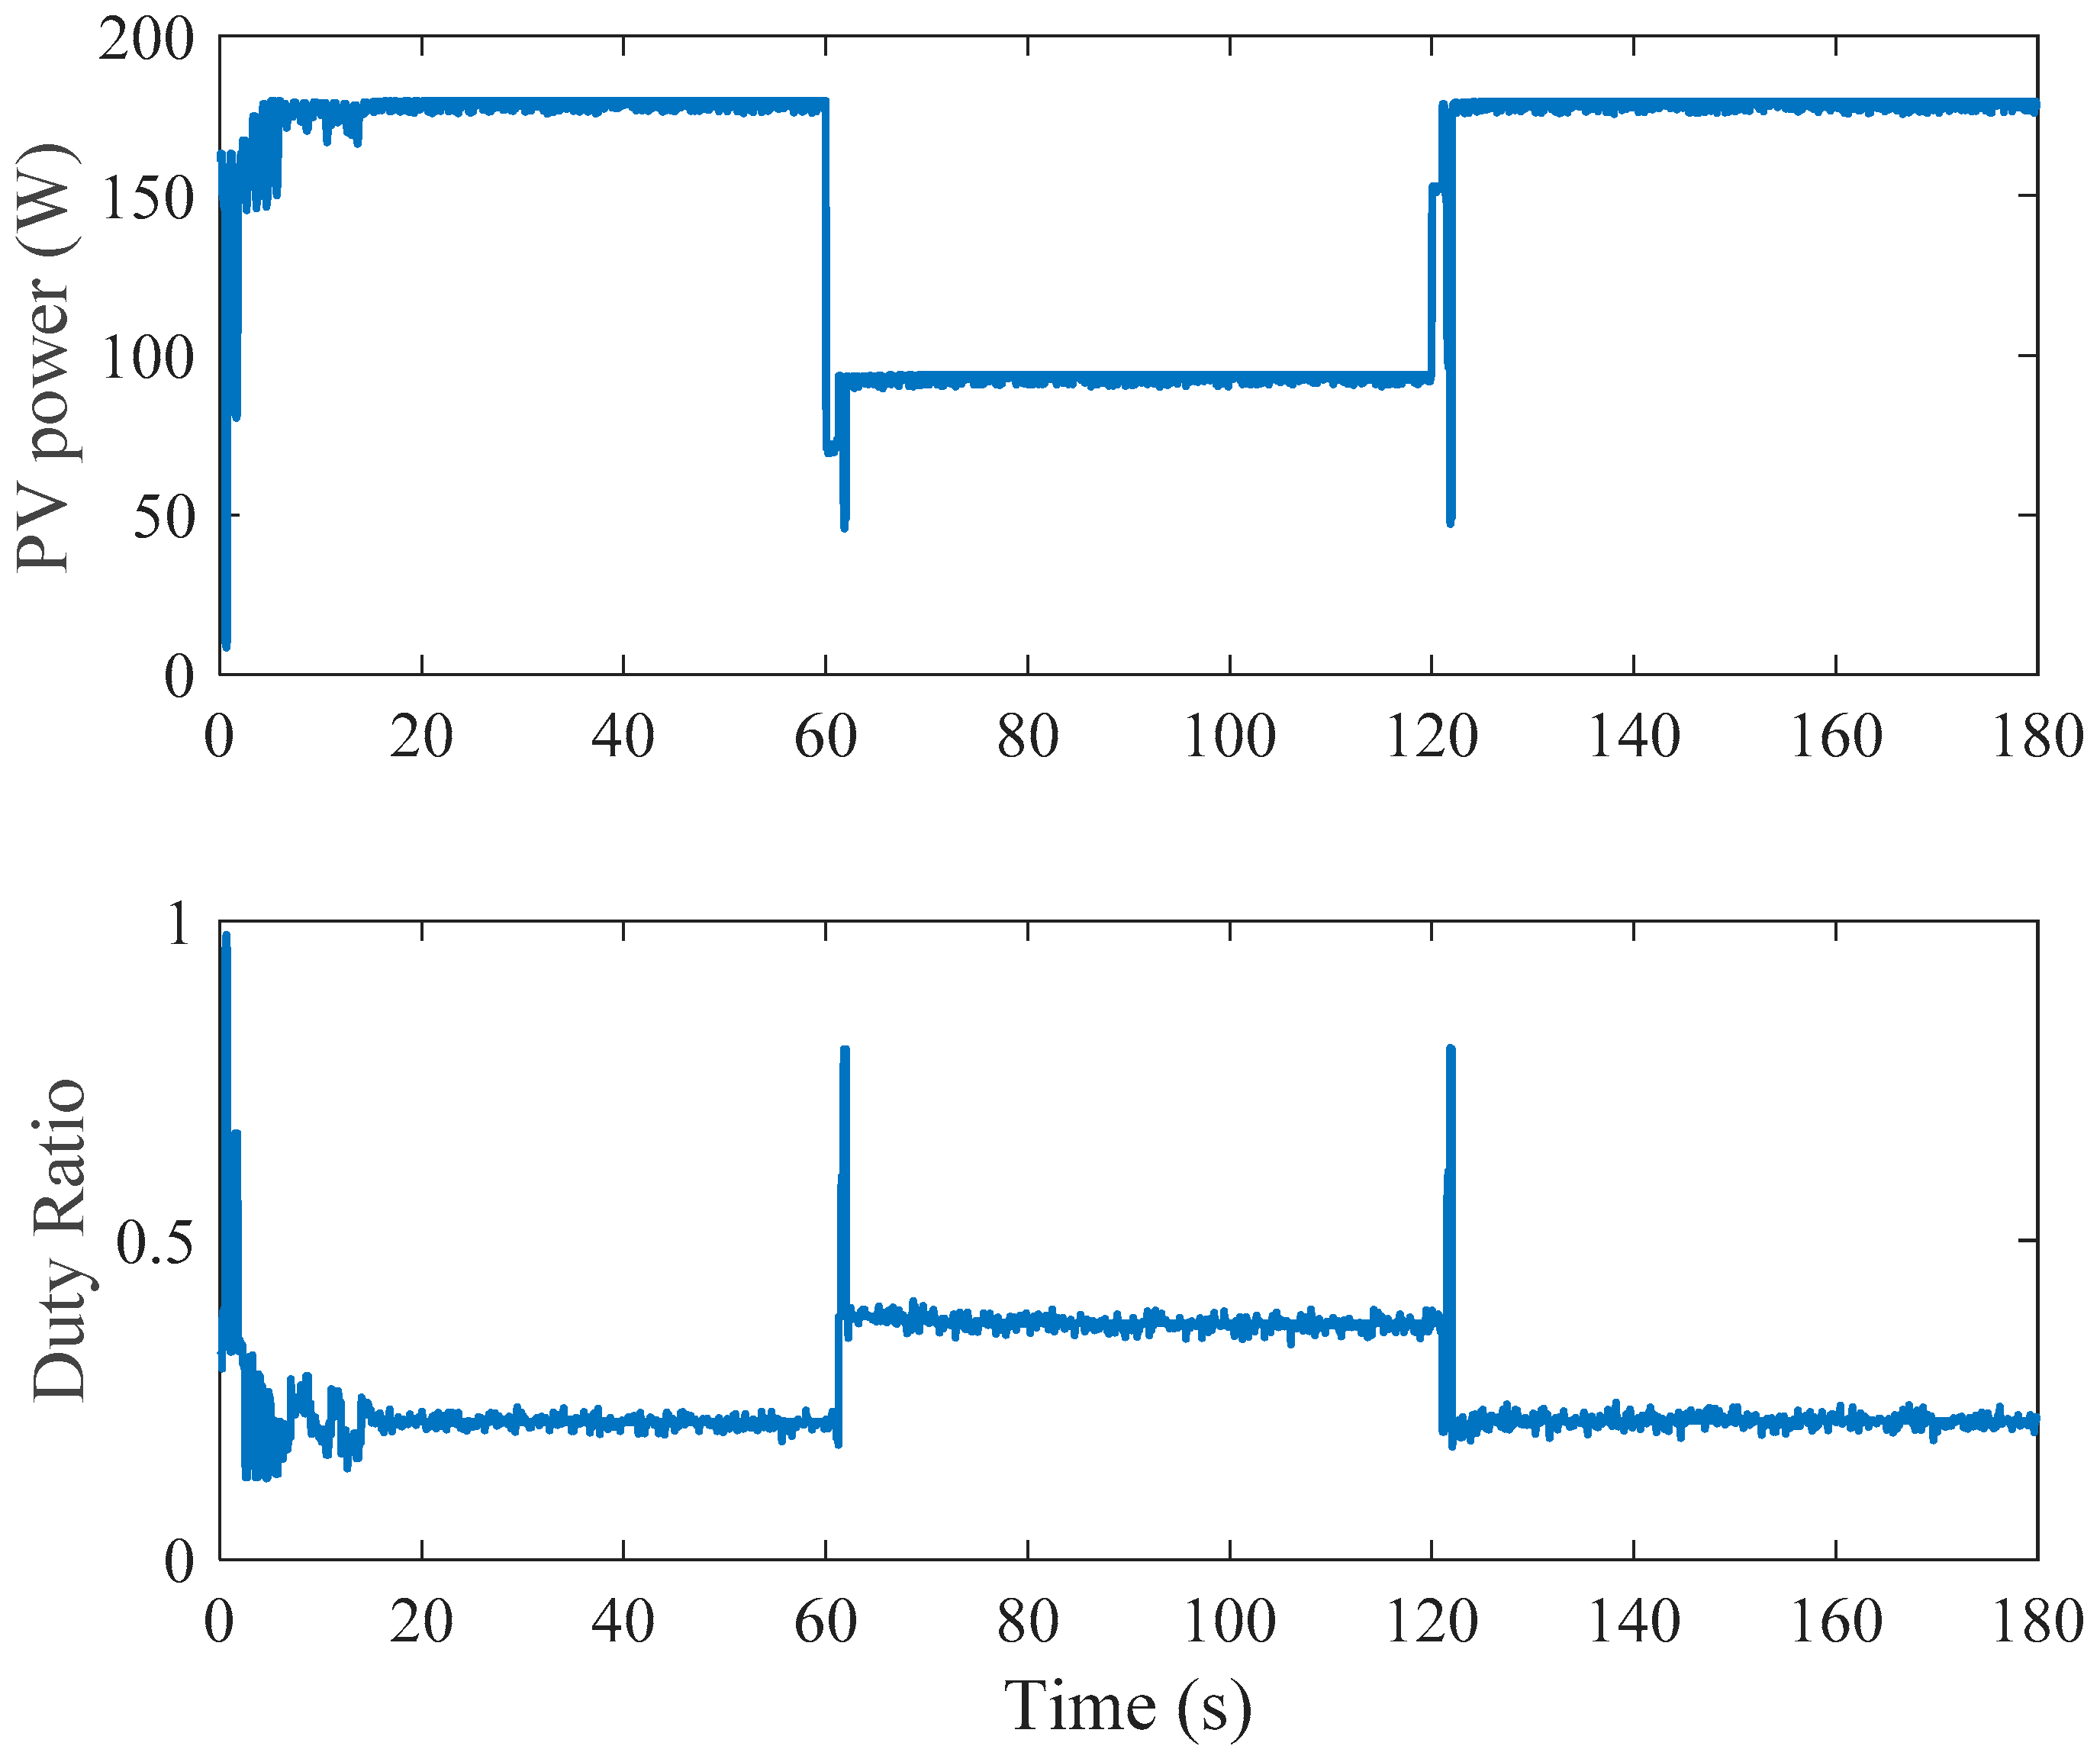
5. Experimental Results
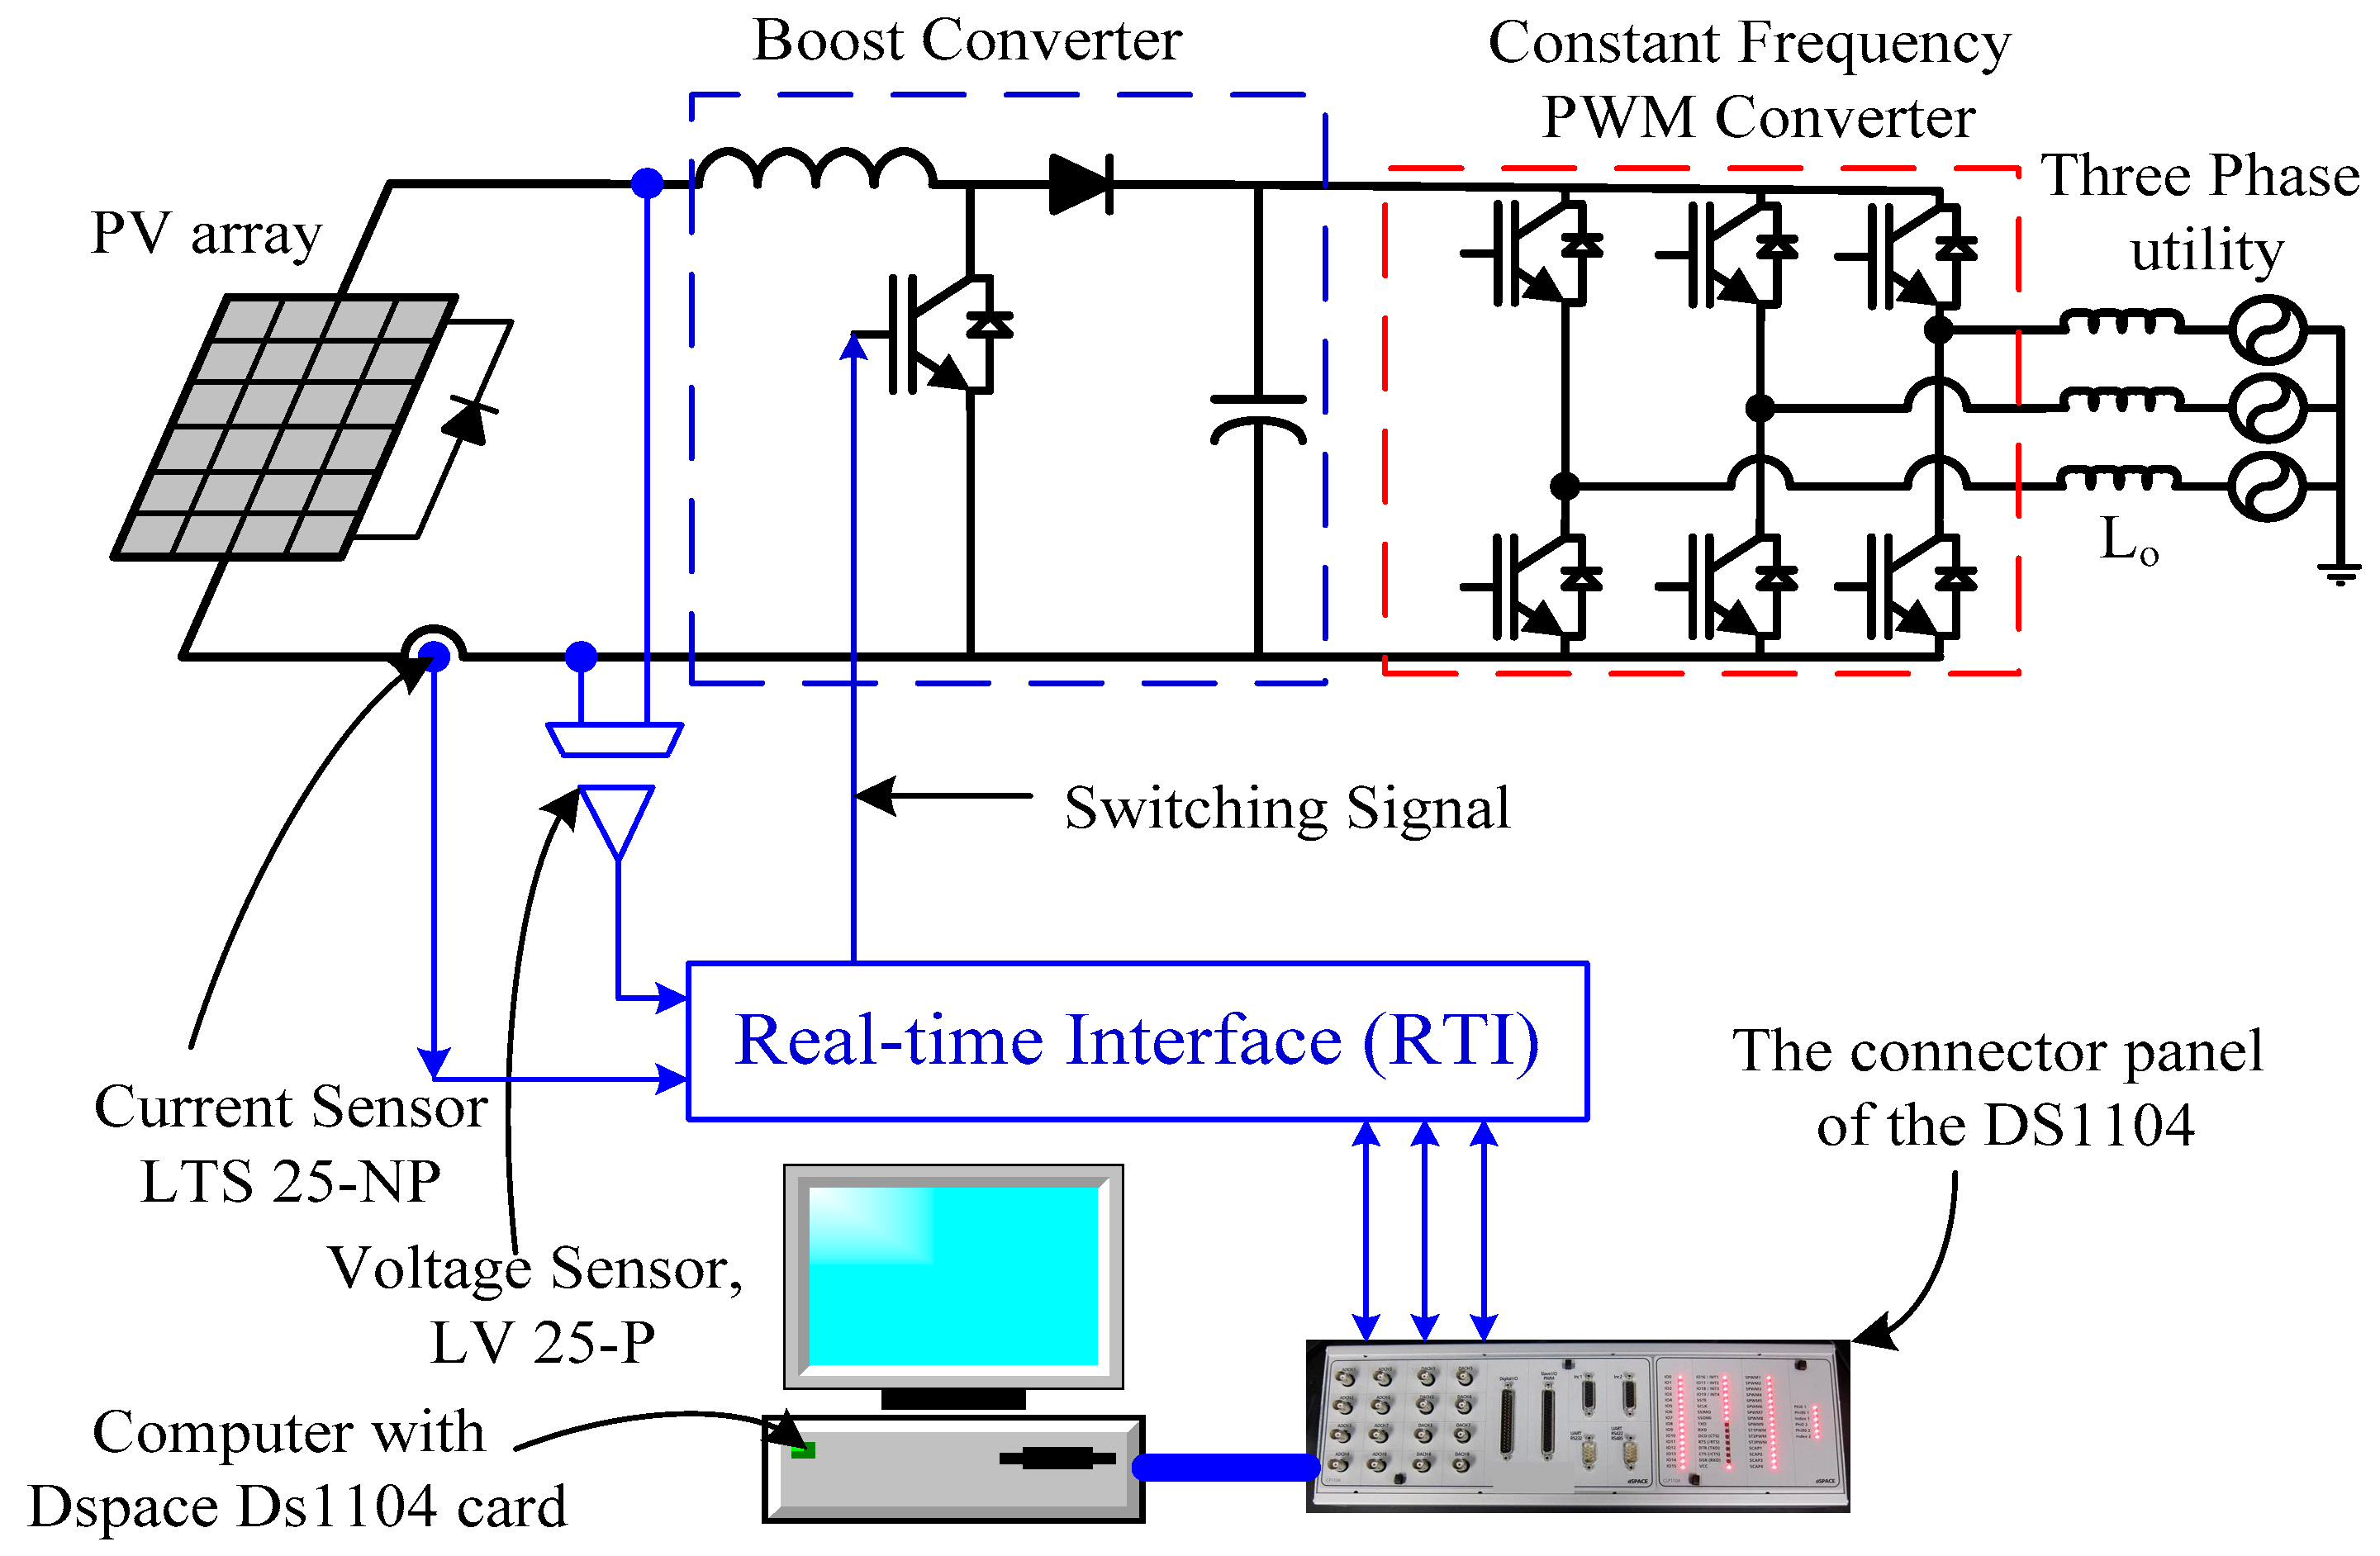
5.1. Hardware Setup

The new proposed strategy “scanning particle” has been experimentally validated in the lab to prove its operation. The new proposed strategy is built in the Matlab code and the output/input have been modeled in the Simulink to be fed to the power circuit by using dSPACE (DS1104 hardware card) interface circuit. The value of the duty ratio generated from Matlab code is fed into the Simulink to generate the pulse duration and then fed this value to the DS1104 hardware card. This signal is fed into the real time interface circuit (RTI) as shown in Figure 11. The signal from the RTI is connected to the driver circuit of the MOSFET of the DC/DC converter. The PV array current is sensed using current sensor and fed back to the RTI and then the DS1104 hardware card to be used as an input to the proposed MPPT strategy. Similarly, the PV array terminal voltage is sensed using voltage sensor and fed into the RTI, DS1104 hardware card, and then to the Simulink to feed the Matlab code. The generated power can be calculated by multiplying the PV array current and voltage. Single phase 220 V inverter is used to be interconnected to electric utility as shown in Figure 12. The hardware circuit contains the following components:
  • Ten PV modules (Sunperfect Solar CRM185S156P-54) [15] connected in two parallel branches each one has five series modules. As shown in the upper picture of Figure 12. The partial shading done by covering the targeted module with semi-transparent sheets.
  • Current Sensors Part number: LTS 25-NP.
  • Voltage sensor, Part number: LV 25-P.
  • Boost converter inductor and capacitor values are L = 0.5 mH and C = 200 μF.
  • The boost converter switch is MOSFET IXFP72N20X3 having 200 V and 72 A rating. A driver IC 74HC14 is used to drive this MOSFET. The switching frequency used in the experimental circuit is 20 kHz.
  • 2000 W single phase inverter to transfer the generated power to the electric utility.
  • dSPACE (DS1104 hardware card) and the connector panel of the DS1104.

5.2. Experimental Results

The proposed strategy “scanning particle” is implemented in the lab as shown in Figure 12. The first experimental results study for reinitializing the particles at the duty ratios of the anticipated peaks. The experimental results are recorded for 3 min, the system work in uniform distribution in the first and last minutes, the second minute the two PV modules are covered with semi-transparent sheets to form the PSC. It is clear from Figure 13 that, the system is initialized with the duty ratios at the anticipated peaks obtained from Equation (3) and it takes about 5 s to capture the GP.
After 1 min the shading pattern changed by covering the two modules with semi-transparent sheets which can be detected from the condition shown in Equation (2) and the PSO spent 8 s to capture the new GP. Similarly, in the third min when the two cover sheets removed the code detects that using Equation (2) and reinitialize the particles and captured the GP after 8 s.
The second study uses the scanning particle is shown in Figure 14. It is clear from this figure that the code is regularly initialized ad it spent 5 s to catch the GP. After 1 min, the two modules were covered by the semi-transparent sheets to form the PSC which can be detected using the condition shown in Equation (2) and it initiates the scanning particle to look for the new position of peaks which captured it within 0.5 s as shown in Figure 14. This will happen again in the beginning of the third minute when the two semi-transparent sheets removed. The results are recorded in in the control desk of the dSPACE software as a graphical user interface provided in dSPACE. It is clear from this results that, the scanning particle strategy captured the GP within 0.5 s compared to 5 s for normal reinitialization. The experimental results prove the better performance of scanning particle strategy compared to the normal reinitialization in terms of convergence time.

6. Conclusions

Partial shading in PV systems generates one global peak (GP) and multiples of local peaks (LPs). Conventional MPPT techniques may not able to capture the GP. Particle swarm optimization (PSO) has been selected from the many metaheuristic techniques to work as an MPPT of PV energy systems. This technique shows good results in this application, but has two chronic problems—long convergence time and premature convergence. The new proposed strategy in this paper “scanning particle” solved these two issues completely. To the best of the author’s knowledge, this is the first time that the concept of scanning particle has been used to improve the performance of PSO when used as an MPPT. Results of simulation showed that the convergence time reduced by 650% and 450% as compared to the cases of random reinitialization and reinitialization at the anticipated peaks, respectively. Moreover, the scanning particle strategy never missed capturing the GP in the one hundred time that the simulation was run. The outstanding simulation and experimental results from the scanning particle strategy shows a great improvement in the PSO MPPT of PV systems in terms of performance, efficiency, stability, and the generated energy.

Author Contributions

Conceptualization, A.M.E.; Data curation, A.M.E.; Funding acquisition and Investigation, A.M.E. and M.S.A.-S.; Methodology, A.M.E.; Project administration, A.M.E., M.S.A.-S. and A.G.A.-K.; Software, A.M.E., M.S.A.-S. and A.G.A.-K.; Writing—original draft, A.M.E., M.S.A.-S. and A.G.A.-K.; Writing—review & editing, A.M.E. and M.A.S. All authors have read and agreed to the published version of the manuscript.

Funding

The King Saud University, Deanship of Scientific research, Research Chair Saudi Electricity Company Chair in Power System Reliability and Security.

Acknowledgments

This work was supported by the King Saud University, Deanship of Scientific research, Research Chair Saudi Electricity Company Chair in Power System Reliability and Security.

Conflicts of Interest

The authors declare no conflict of interest.

References

  1. Eltamaly, A.M.; Farh, H.M.H.; Mamdooh, S.A. Grade point average assessment for metaheuristic GMPP techniques of partial shaded PV systems. IET Renew. Power Gener. 2019, 13, 1215–1231. [Google Scholar] [CrossRef]
  2. Alsumiri, M. Residual Incremental Conductance Based Nonparametric MPPT Control for Solar Photovoltaic Energy Conversion System. IEEE Access 2019, 7, 87901–87906. [Google Scholar] [CrossRef]
  3. Rezk, H.; Eltamaly, A.M. A comprehensive comparison of different MPPT techniques for photovoltaic systems. Sol. Energy 2015, 112, 1–11. [Google Scholar] [CrossRef]
  4. Eltamaly, A.M. Performance of MPPT techniques of photovoltaic systems under normal and partial shading conditions. In Advances in Renewable Energies and Power Technologies; Elsevier: Amsterdam, The Netherlands, 2018; pp. 115–161. [Google Scholar]
  5. Eltamaly, A.M.; Al-Saud, M.S.; Abokhalil, A.G. A Novel Bat Algorithm Strategy for Maximum Power Point Tracker of Photovoltaic Energy Systems under Dynamic Partial Shading. IEEE Access 2020, 8, 10048–10060. [Google Scholar] [CrossRef]
  6. Ahmed, J.; Salam, Z. A Maximum Power Point Tracking (MPPT) for PV system using Cuckoo Search with partial shading capability. Appl. Energy 2014, 119, 118–130. [Google Scholar] [CrossRef]
  7. Eltamaly, A.M.; Farh, H.M.H. Dynamic global maximum power point tracking of the PV systems under variant partial shading using hybrid GWO-FLC. Sol. Energy 2019, 177, 306–316. [Google Scholar] [CrossRef]
  8. Eltamaly, A.M.; Almoataz, Y.A. Modern Maximum Power Point Tracking Techniques for Photovoltaic Energy Systems; Springer International Publishing: New York, NY, USA, 2019. [Google Scholar]
  9. Jiang, L.L.; Maskell, D.L.; Patra, J.C. A novel ant colony optimization-based maximum power point tracking for photovoltaic systems under partially shaded conditions. Energy Build. 2013, 58, 227–236. [Google Scholar] [CrossRef]
  10. Sundareswaran, K.; Peddapati, S.; Palani, S. MPPT of PV systems under partial shaded conditions through a colony of flashing fireflies. IEEE Trans. Energy Convers. 2014, 29, 463–472. [Google Scholar]
  11. Benyoucef, A.S.; Chouder, A.; Kara, K.; Silvestre, S.; Sahed, O.A. Artificial bee colony based algorithm for maximum power point tracking (MPPT) for PV systems operating under partial shaded conditions. Appl. Soft Comput. 2015, 32, 38–48. [Google Scholar] [CrossRef] [Green Version]
  12. Singh, G.; Kaur, A. Maximum Power Point Tracking in Photovoltaic Solar Energy Systems using Hybrid PSO-GSA Method. Int. J. Eng. Res. Technol. 2015, 4, 391–394. [Google Scholar]
  13. Kumar, N.; Hussain, I.; Singh, B.; Panigrahi, B.K. Single sensor-based MPPT of partially shaded PV system for battery charging by using cauchy and gaussian sine cosine optimization. IEEE Trans. Energy Convers. 2017, 32, 983–992. [Google Scholar] [CrossRef]
  14. Aouchiche, N.; Aitcheikh, M.S.; Becherif, M.; Ebrahim, M.A. AI-based global MPPT for partial shaded grid connected PV plant via MFO approach. Sol. Energy 2018, 171, 593–603. [Google Scholar] [CrossRef]
  15. Eltamaly, A.M.; Mamdooh, S.A.; Abokhalil, A.G.; Farh, H.M.H. Photovoltaic maximum power point tracking under dynamic partial shading changes by novel adaptive particle swarm optimization strategy. Trans. Inst. Meas. Control 2019. [Google Scholar] [CrossRef]
  16. Koran, A.; LaBella, T.; Lai, J.-S. High efficiency photovoltaic source simulator with fast response time for solar power conditioning systems evaluation. IEEE Trans. Power Electron. 2013, 29, 1285–1297. [Google Scholar] [CrossRef]
  17. Chao, K.-H.; Huang, C.-H. Bidirectional DC–DC soft-switching converter for stand-alone photovoltaic power generation systems. IET Power Electron. 2014, 7, 1557–1565. [Google Scholar] [CrossRef]
  18. Efendi, M.Z.; Murdianto, F.D.; Setiawan, R.E. Modeling and simulation of MPPT sepie converter using modified PSO to overcome partial shading impact on DC microgrid system. In Proceedings of the 2017 International Electronics Symposium on Engineering Technology and Applications (IES-ETA), Surabaya, Indonesia, 26–27 September 2017; IEEE: Piscataway, NJ, USA, 2017; pp. 27–32. [Google Scholar]
  19. Rajesh, R.; Mabel, M.C. A comprehensive review of photovoltaic systems. Renew. Sustain. Energy Rev. 2015, 51, 231–248. [Google Scholar] [CrossRef]
  20. Farh, H.M.H.; Mohd, F.O.; Ali, M.E.; Al-Saud, M.S. Maximum power extraction from a partially shaded PV system using an interleaved boost converter. Energies 2018, 11, 2543. [Google Scholar]
  21. Eltamaly, A.M.; Farh, H.M.H.; Al Saud, M.S. Impact of PSO reinitialization on the accuracy of dynamic global maximum power detection of variant partially shaded PV systems. Sustainability 2019, 11, 2091. [Google Scholar] [CrossRef] [Green Version]
  22. Farh, H.M.H.; Eltamaly, A.M.; Ibrahim, A.B.; Othman, M.F.; Al-Saud, M.S. Dynamic global power extraction from partially shaded photovoltaic using deep recurrent neural network and improved PSO techniques. Int. Trans. Electr. Energy Syst. 2019, 29, e12061. [Google Scholar] [CrossRef]
  23. Farh, H.M.H.; Eltamaly, A.M. Maximum Power Extraction from the Photovoltaic System under Partial Shading Conditions. In Modern Maximum Power Point Tracking Techniques for Photovoltaic Energy Systems; Springer: Cham, Switzerland, 2020; pp. 107–129. [Google Scholar]
  24. Chatterjee, A.; Siarry, P. Nonlinear inertia weight variation for dynamic adaptation in particle swarm optimization. Comput. Oper. Res. 2006, 33, 859–871. [Google Scholar] [CrossRef]
  25. Bingül, Z.; Karahan, O. A Fuzzy Logic Controller tuned with PSO for 2 DOF robot trajectory control. Expert Syst. Appl. 2011, 38, 1017–1031. [Google Scholar] [CrossRef]
  26. Clerc, M. The swarm and the queen: Towards a deterministic and adaptive particle swarm optimization. In Proceedings of the 1999 Congress on Evolutionary Computation-CEC99 (Cat. No. 99TH8406), Washington, DC, USA, 6–9 July 1999; IEEE: Piscataway, NJ, USA, 1999; Volume 3, pp. 1951–1957. [Google Scholar]
  27. Harrison, K.R.; Engelbrecht, A.P.; Ombuki-Berman, B.M. Optimal parameter regions and the time-dependence of control parameter values for the particle swarm optimization algorithm. Swarm Evol. Comput. 2018, 41, 20–35. [Google Scholar] [CrossRef]
  28. Abdulkadir, M.; Yatim, A.H.M.; Yusuf, S.T. An improved PSO-based MPPT control strategy for photovoltaic systems. Int. J. Photoenergy 2014, 2014, 818232. [Google Scholar] [CrossRef] [Green Version]
  29. Farh, H.M.H.; Eltamaly, A.M.; Othman, M.F. Hybrid PSO-FLC for dynamic global peak extraction of the partially shaded photovoltaic system. PLoS ONE 2018, 13, e0206171. [Google Scholar] [CrossRef] [PubMed]
  30. Lian, K.L.; Jhang, J.H.; Tian, I.S. A maximum power point tracking method based on perturb-and-observe combined with particle swarm optimization. IEEE J. Photovol. 2014, 4, 626–633. [Google Scholar] [CrossRef]
  31. Manickam, C.; Raman, G.R.; Raman, G.P.; Ganesan, S.I.; Nagamani, C. A hybrid algorithm for tracking of GMPP based on P&O and PSO with reduced power oscillation in string inverters. IEEE Trans. Ind. Electron. 2016, 63, 6097–6106. [Google Scholar]
  32. Sundareswaran, K.; Palani, S. Application of a combined particle swarm optimization and perturb and observe method for MPPT in PV systems under partial shading conditions. Renew. Energy 2015, 75, 308–317. [Google Scholar] [CrossRef]
  33. Hanafiah, S.; Ayad, A.; Hehn, A.; Kennel, R. A hybrid MPPT for quasi-Z-source inverters in PV applications under partial shading condition. In Proceedings of the 2017 11th IEEE International Conference on Compatibility, Power Electronics and Power Engineering (CPE-POWERENG), Cadiz, Spain, 4–6 April 2017; IEEE: Piscataway, NJ, USA, 2017; pp. 418–423. [Google Scholar]
  34. Avila, E.; Pozo, N.; Pozo, M.; Salazar, G.; Domínguez, X. Improved particle swarm optimization based MPPT for PV systems under Partial Shading Conditions. In Proceedings of the 2017 IEEE Southern Power Electronics Conference (SPEC), Puerto Varas, Chile, 4–7 December 2017; IEEE: Piscataway, NJ, USA, 2017; pp. 1–6. [Google Scholar]
  35. Dhas, B.; Sugirtha, G.; Deepa, S.N. A hybrid PSO and GSA-based maximum power point tracking algorithm for PV systems. In Proceedings of the 2013 IEEE International Conference on Computational Intelligence and Computing Research (ICCIC), Madurai, India, 26–28 December 2013; IEEE: Piscataway, NJ, USA, 2013; pp. 1–4. [Google Scholar]
  36. Abdulkadir, M.; Yatim, A.H.M. Hybrid maximum power point tracking technique based on PSO and incremental conductance. In Proceedings of the 2014 IEEE Conference on Energy Conversion (CENCON), Johor Baru, Malaysia, 13–14 October 2014; IEEE: Piscataway, NJ, USA, 2014; pp. 271–276. [Google Scholar]
  37. Shankar, G.; Mukherjee, V. MPP detection of a partially shaded PV array by continuous GA and hybrid PSO. Ain Shams Eng. J. 2015, 6, 471–479. [Google Scholar] [CrossRef] [Green Version]
  38. Chaieb, H.; Sakly, A. A novel MPPT method for photovoltaic application under partial shaded conditions. Sol. Energy 2018, 159, 291–299. [Google Scholar] [CrossRef]
  39. Basiński, K.; Ufnalski, B.; Grzesiak, L.M. Hybrid MPPT algorithm for PV systems under partially shaded conditions using a stochastic evolutionary search and a deterministic hill climbing. Power Electron. Drives 2017, 2, 49–59. [Google Scholar]
  40. Mohammadmehdi, S.; Rahmani, R.; Mekhilef, S.; Oo, A.M.T.; Stojcevski, A.; Soon, T.K.; Ghandhari, A.S. Simulation and hardware implementation of new maximum power point tracking technique for partially shaded PV system using hybrid DEPSO method. IEEE Trans. Sustain. Energy 2015, 6, 850–862. [Google Scholar]
  41. Said, S.Z.; Thiaw, L.; Wabuge, C.W. Maximum Power Point Tracking of Photovoltaic Generators Partially Shaded Using an Hybrid Artificial Neural Network and Particle Swarm Optimization Algorithm. Int. J. Energy Power Eng. 2017, 6, 91–99. [Google Scholar] [CrossRef]
  42. Guan, T.; Zhuo, F. An improved SA-PSO global maximum power point tracking method of photovoltaic system under partial shading conditions. In Proceedings of the 2017 IEEE International Conference on Environment and Electrical Engineering and 2017 IEEE Industrial and Commercial Power Systems Europe (EEEICI&CPS Europe), Milan, Italy, 6–9 June 2017; IEEE: Piscataway, NJ, USA, 2017; pp. 1–5. [Google Scholar]
  43. Suganya, R.; Rajkumar, M.V.; Pushparani, P. Simulation and Analysis of Boost Converter with MPPT for PV System using Chaos PSO Algorithm. Int. J. Emerg. Technol. Eng. Res. 2017, 5, 97–105. [Google Scholar]
  44. Fathabadi, H. Novel fast dynamic MPPT (maximum power point tracking) technique with the capability of very high accurate power tracking. Energy 2016, 94, 466–475. [Google Scholar] [CrossRef]
Figure 1. The PV energy system with BA-based MPPT.
Sustainability 12 01185 g001
Figure 2. P–V curves for different number of peaks.
Sustainability 12 01185 g002
Figure 3. P–d curves for different number of peaks.
Sustainability 12 01185 g003
Figure 4. P–d curves for five shading patterns used in the simulation.
Sustainability 12 01185 g004
Figure 5. The flowchart of PSO with scanning particle strategy used for MPPT of PV system.
Sustainability 12 01185 g005
Figure 6. The state-of-the-art strategy without reinitialization.
Sustainability 12 01185 g006
Figure 7. The state-of-the-art strategy with random initialization.
Sustainability 12 01185 g007
Figure 8. The state-of-the-art strategy with reinitialization at the anticipated places of peaks.
Sustainability 12 01185 g008
Figure 9. The simulation results for new proposed strategy “Scanning Particle”.
Sustainability 12 01185 g009
Figure 10. Transient during the scanning particle operation.
Sustainability 12 01185 g010
Figure 11. Schematic of hardware setup of the MPPT of PV system.
Sustainability 12 01185 g011
Figure 12. A picture of the experimental setup.
Sustainability 12 01185 g012
Figure 13. The experimental results in initialization and re initialization at the duty ratios of anticipated peaks.
Sustainability 12 01185 g013
Figure 14. The experimental results in initialization at the duty ratios of anticipated peaks and the reinitialization using the scanning particle.
Sustainability 12 01185 g014
Table 1. The five shading patterns used in the simulation.
Shading PatternsGlobal Peak
Duty RatioPower (kW)
SP1 = [200 400 800 1000]0.60393.5
SP2 = [300 500 700 900]0.37593.7
SP3 = [650 700 750 950]0.182157.8
SP4 = [100 250 550 650]0.60364.7
SP5 = [350 650 850 950]0.387119.5
Table 2. Main Electrical characteristics of SunPerfect Solar CRM185S156P-54 PV module.
Rated power for each PV module185.22 W
Number of cells in each PV module54
Open circuit voltage (Voc)32.2 V
Short circuit current (Isc)7.89 A
Table 3. And the state-of-the-art strategy using random reinitialization (Figure 7).
SPWithout Reinitialization (Figure 6)With Random Reinitialization (Figure 7)% Increase
dP (kW)dp(kW)
SP10.60393.50.60393.50
SP20.603830.603830
SP30.603880.182157.880
SP40.603650.603650
SP50.603970.411821.7
Table 4. Values of power and duty ratios for each scanning particle positions.
SP ChangeP(1)(d(1) = 0.2) (kW)P(2)(d(2) = 0.4) (kW)P(3)(d(3) = 0.6) (kW)P(4)(d(4) = 0.8) (kW)
SP1→SP275938349
SP2→SP31571258850
SP3→SP425466535
SP4→SP5861189751
SP5→SP150739453

