Application of Factor Analysis for Characterizing the Relationships between Groundwater Quality and Land Use in Taiwan’s Pingtung Plain


Abstract
1. Introduction
2. Materials and Methods
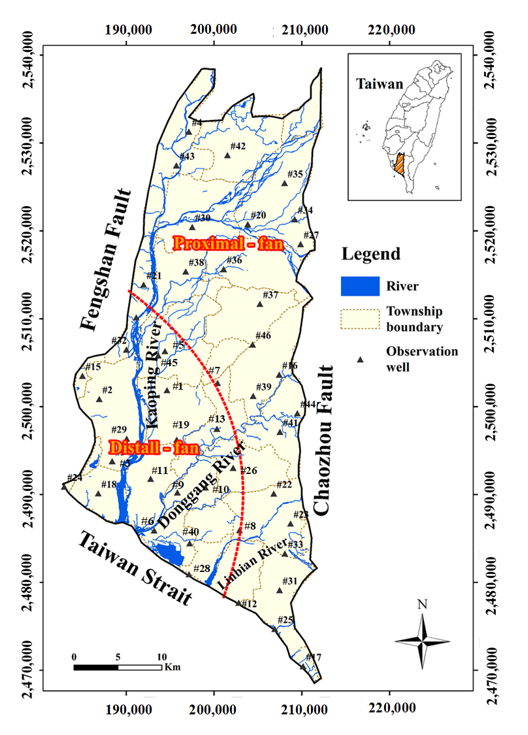
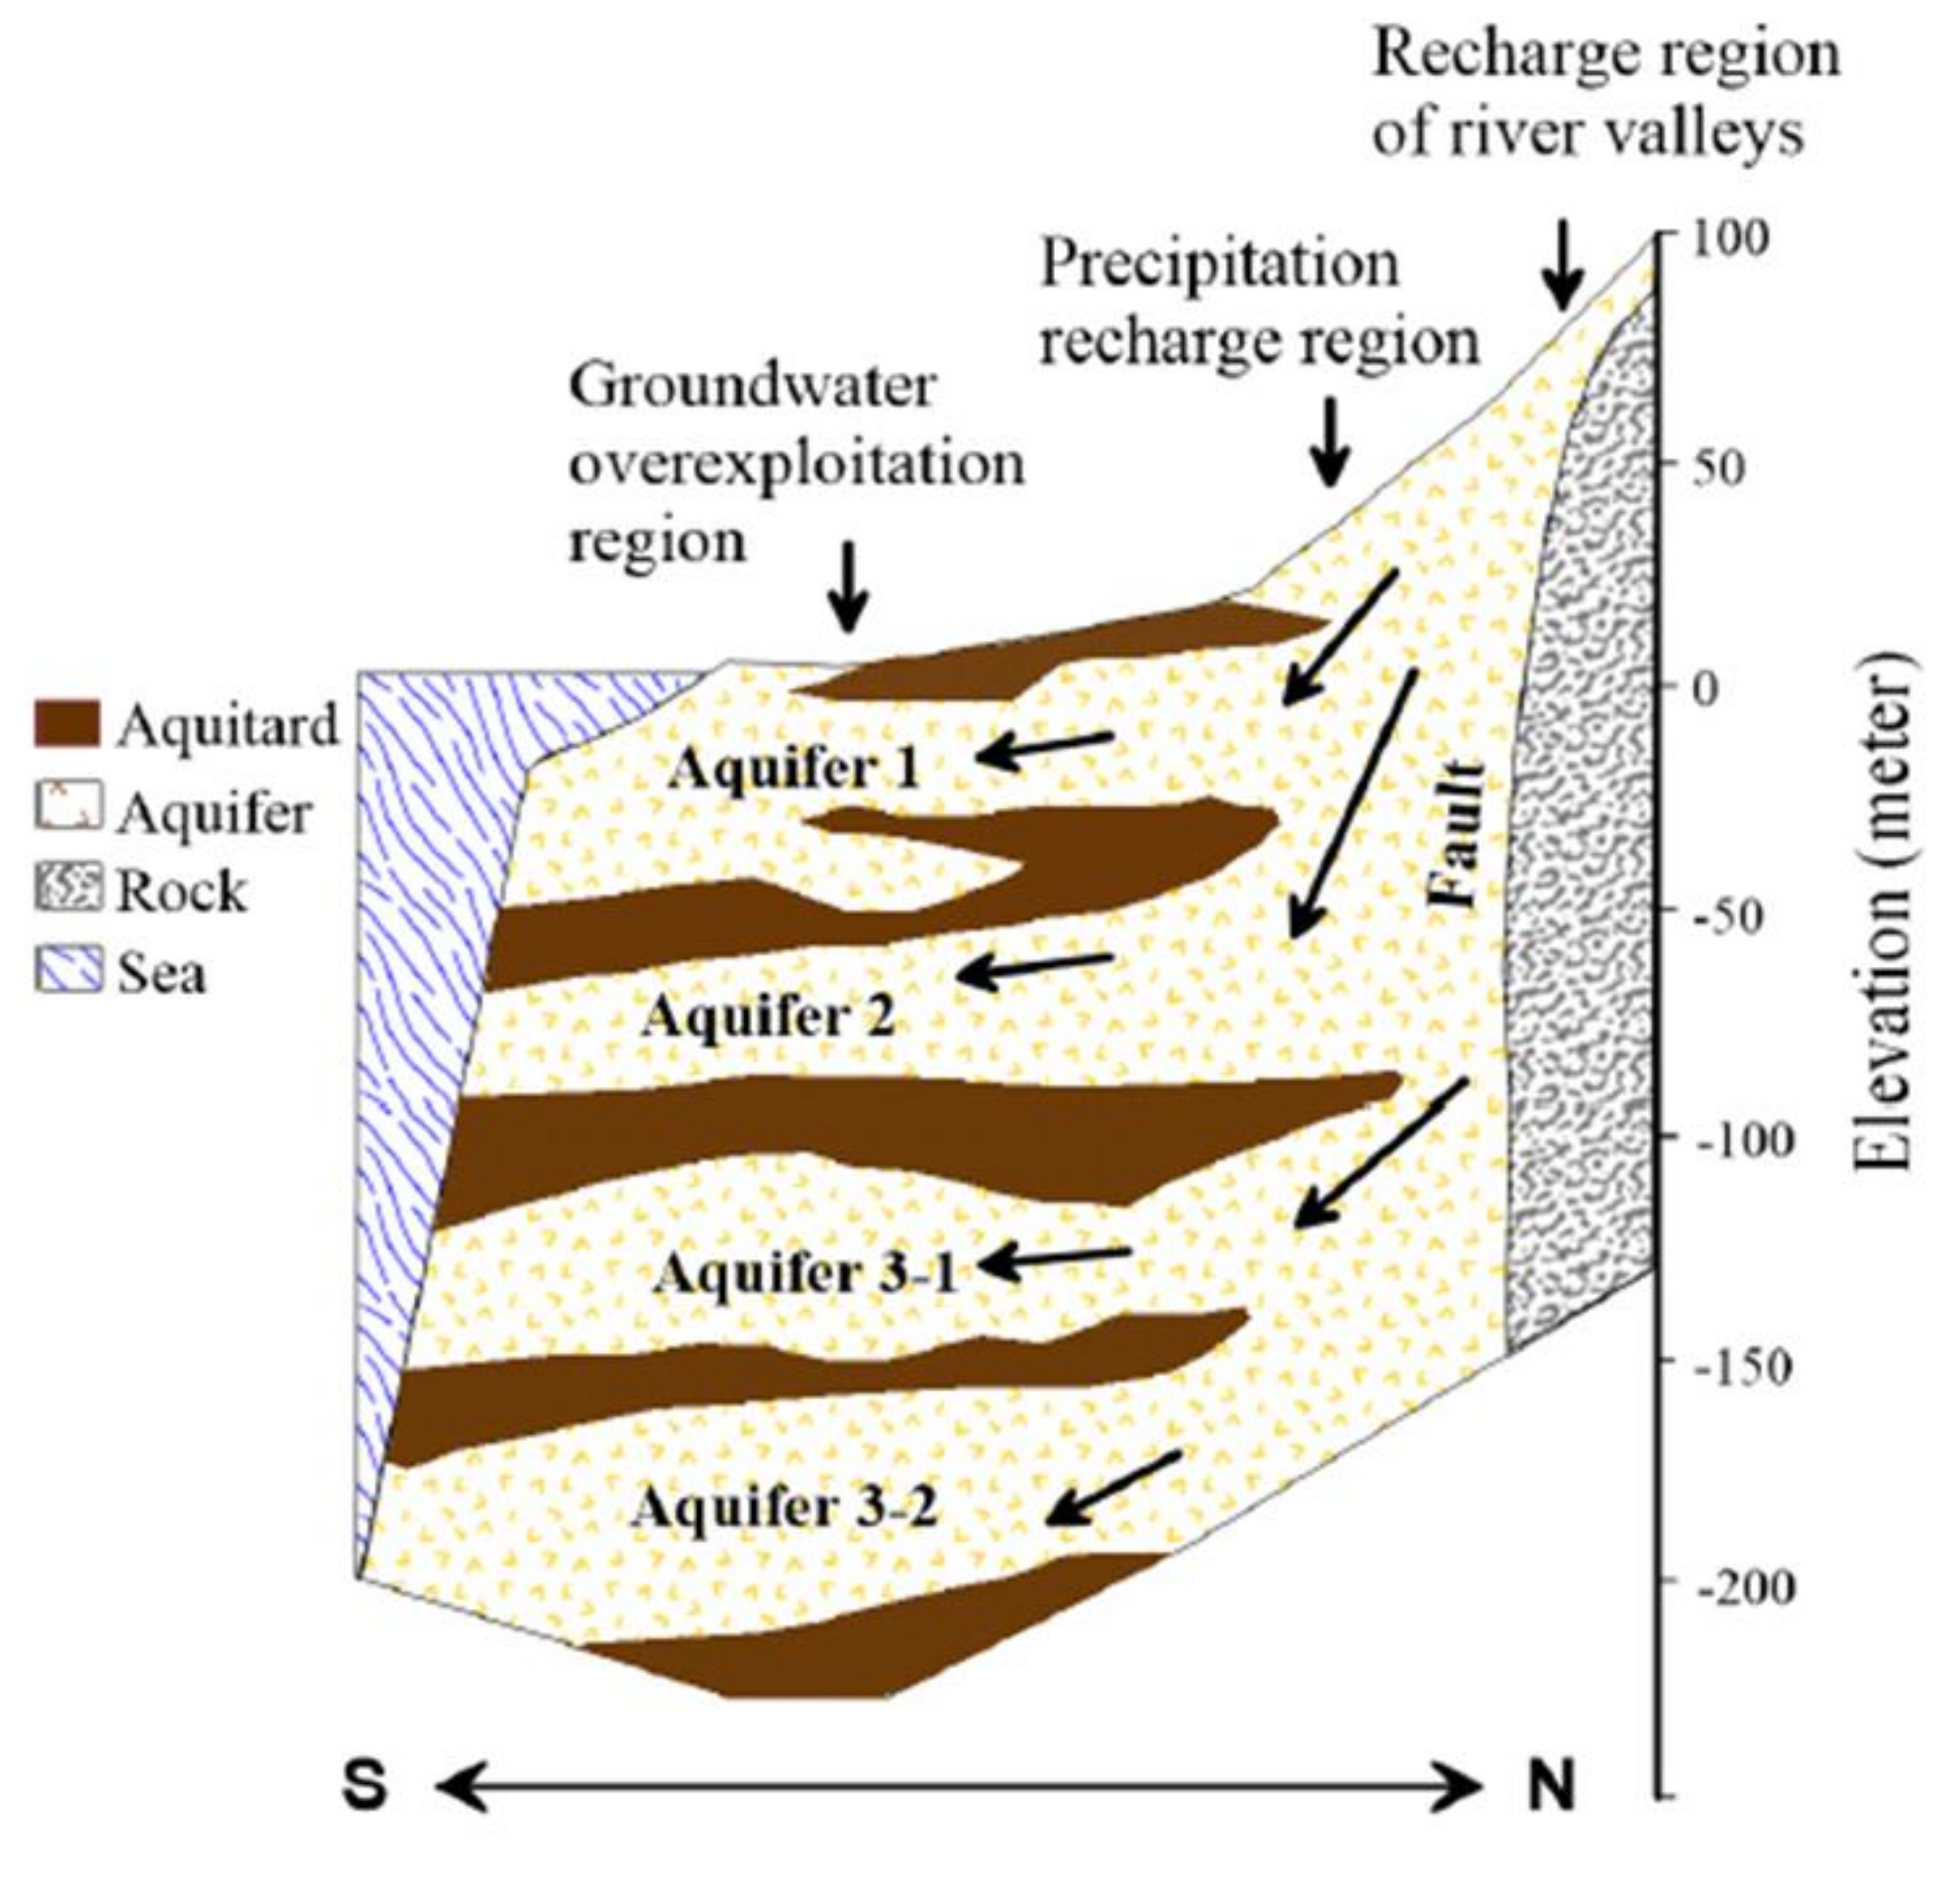
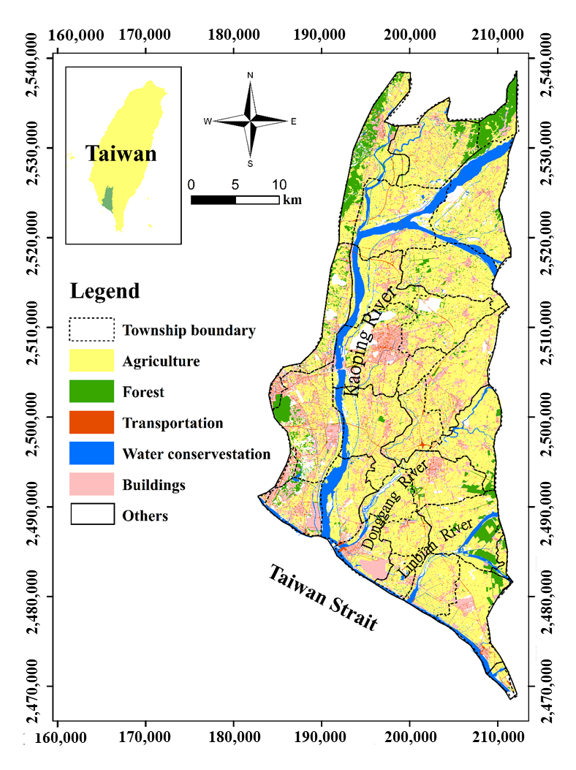
2.1. Study Area
2.2. Data Collection and Processing
2.3. Factor Analysis
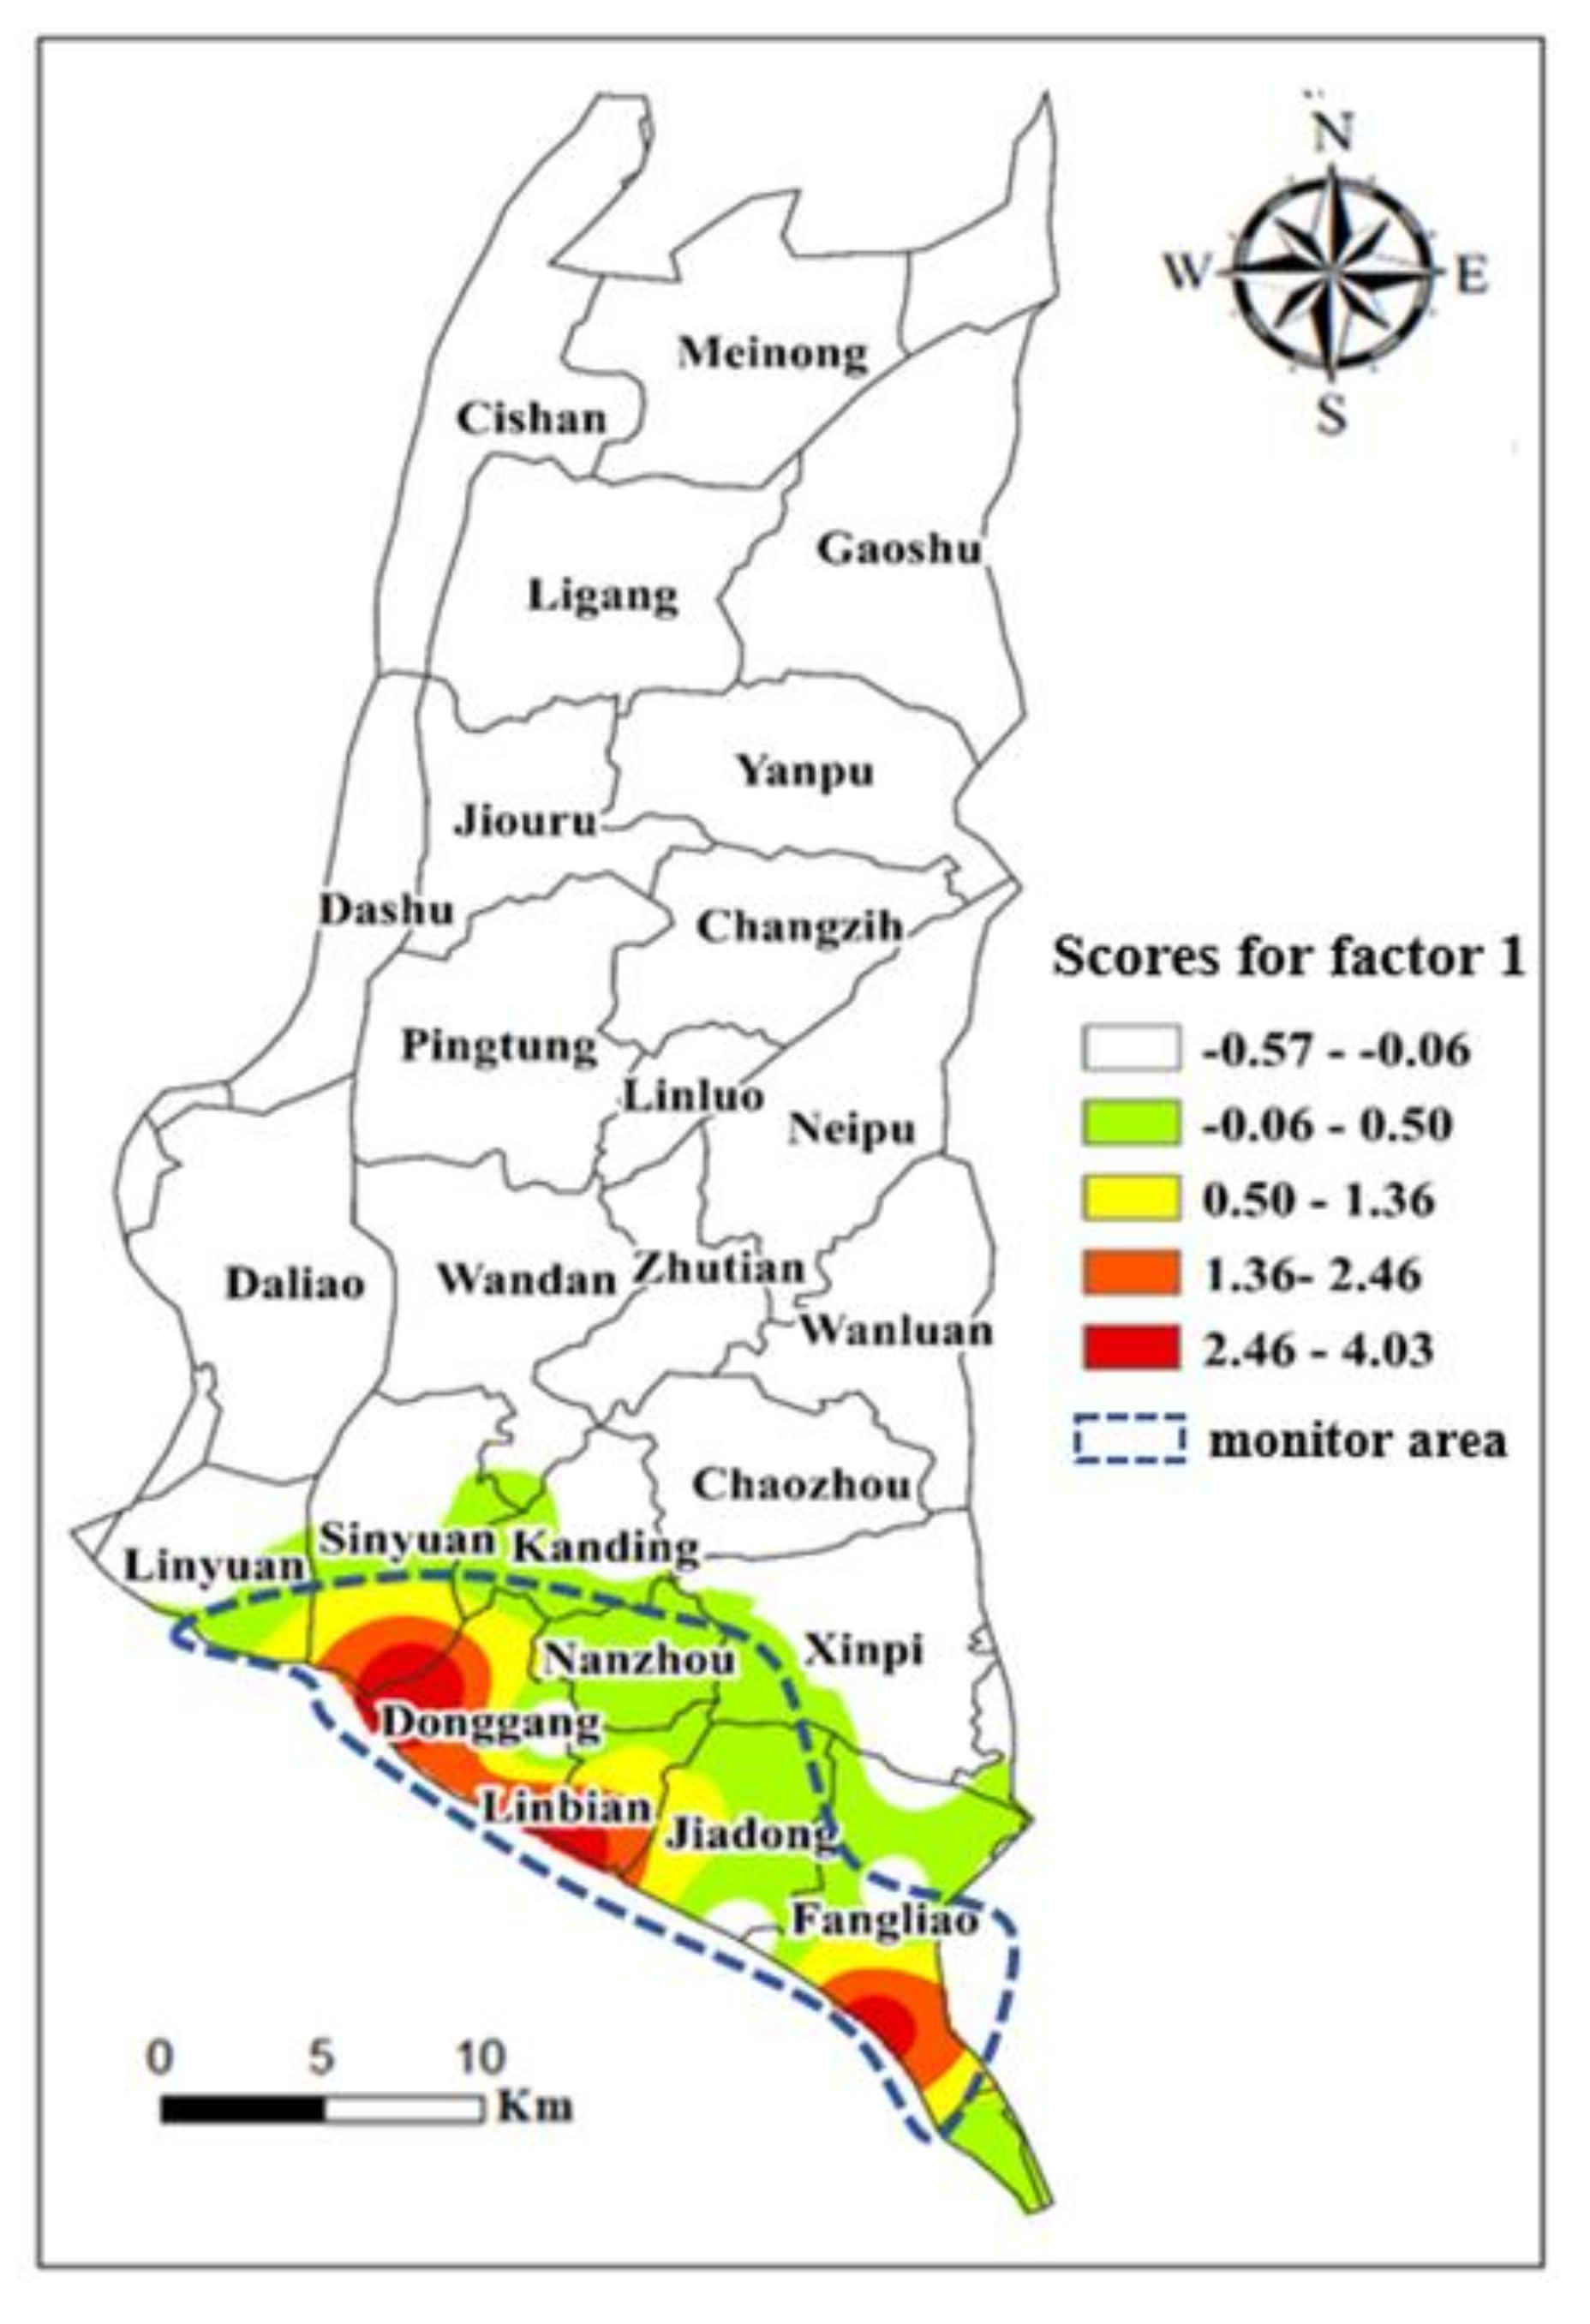
3. Results and Discussion
4. Conclusions
Author Contributions
Funding
Acknowledgments
Conflicts of Interest
Appendix A

| Wells | E.C. (μ S/cm) | HCO3− (mg/L) | E. Coli (CFU/100mL) | Cl− (mg/L) | SO42- (mg/L) | NO3−-N (mg/L) | TOC (mg/L) | As (mg/L) | Fe3+ (mg/L) | Mn2+ (mg/L) | Ca2+ (mg/L) | Mg2+ (mg/L) | Na+ (mg/L) | K+ (mg/L) |
|---|---|---|---|---|---|---|---|---|---|---|---|---|---|---|
| #1 | 993 | 314.0 | 4 | 50.5 | 159 | 0.048 | 0.55 | 0.008 | 4.305 | 0.600 | 151.000 | 22.975 | 34.275 | 4.503 |
| #2 | 542 | 139.0 | 70 | 27.7 | 59.5 | 0.005 | 0.50 | 0.004 | 0.474 | 1.160 | 45.600 | 22.700 | 35.550 | 3.120 |
| #3 | 752 | 274.8 | 100 | 109.5 | 1.033 | 0.122 | 0.72 | 0.017 | 114.335 | 2.619 | 78.433 | 37.133 | 73.467 | 15.908 |
| #4 | 700 | 213.5 | 63 | 17.5 | 69.4 | 1.905 | 0.60 | 0.001 | 0.025 | 0.373 | 104.250 | 22.800 | 21.150 | 15.650 |
| #5 | 10,385 | 217.0 | 3 | 16.6 | 58.05 | 0.005 | 0.35 | 0.010 | 3.080 | 0.408 | 115.000 | 13.600 | 18.450 | 7.465 |
| #6 | 35,541 | 262.4 | 14 | 16,562.5 | 1971.25 | 0.026 | 0.30 | 0.008 | 0.977 | 1.311 | 304.000 | 1002.500 | 7947.500 | 318.625 |
| #7 | 498 | 165.0 | 238 | 18.3 | 107 | 1.310 | 0.35 | 0.001 | 0.102 | 0.106 | 105.000 | 15.650 | 12.900 | 1.800 |
| #8 | 4700 | 195.5 | 198 | 19.0 | 40.1 | 0.005 | 0.95 | 0.009 | 6.140 | 0.450 | 76.800 | 22.050 | 22.400 | 4.350 |
| #9 | 780 | 307.7 | 9 | 31.6 | 102.843 | 0.604 | 0.67 | 0.068 | 4.929 | 0.246 | 122.571 | 24.257 | 75.243 | 2.490 |
| #10 | 411 | 81.0 | 3 | 3.9 | 28.75 | 1.005 | 0.50 | 0.001 | 3.685 | 0.291 | 34.550 | 8.340 | 19.600 | 1.385 |
| #11 | 634 | 215.0 | 275 | 84.9 | 59.35 | 2.815 | 0.50 | 0.001 | 0.403 | 0.826 | 118.000 | 21.500 | 39.400 | 19.800 |
| #12 | 453 | 133.5 | 205 | 79.6 | 10.95 | 0.005 | 0.80 | 0.076 | 0.565 | 0.137 | 48.250 | 18.200 | 46.700 | 2.930 |
| #13 | 515 | 175.0 | 9,345 | 17.0 | 72.933 | 3.190 | 0.40 | 0.004 | 0.903 | 0.167 | 82.067 | 14.867 | 14.233 | 1.513 |
| #14 | 405 | 154.0 | 50 | 18.9 | 51.55 | 5.740 | 0.25 | 0.000 | 0.181 | 0.194 | 59.750 | 20.300 | 23.600 | 4.660 |
| #15 | 3036 | 184.5 | 75 | 28.0 | 10.35 | 0.005 | 0.35 | 0.010 | 0.882 | 0.306 | 45.800 | 8.015 | 65.900 | 1.970 |
| #16 | 436 | 19.3 | 28 | 5.3 | 35.25 | 2.615 | 0.15 | 0.003 | 0.431 | 0.029 | 9.295 | 7.350 | 12.850 | 1.091 |
| #17 | 629 | 171.0 | 13 | 72.1 | 36.25 | 0.105 | 0.40 | 0.043 | 1.530 | 0.107 | 84.250 | 16.700 | 46.700 | 1.535 |
| #18 | 869 | 340.9 | 23 | 1178.4 | 108.4 | 0.256 | 0.61 | 0.063 | 4.821 | 0.122 | 111.000 | 30.800 | 45.222 | 6.772 |
| #19 | 494 | 177.0 | 600 | 25.0 | 103.8 | 0.445 | 0.50 | 0.024 | 3.750 | 0.517 | 86.150 | 12.585 | 19.350 | 2.425 |
| #20 | 592 | 171.5 | 88 | 4.5 | 151.25 | 2.688 | 0.20 | 0.000 | 0.018 | 0.002 | 95.200 | 16.750 | 14.000 | 1.465 |
| #21 | 534 | 54.0 | 700 | 10.3 | 12.55 | 8.095 | 0.15 | 0.001 | 0.062 | 0.001 | 28.700 | 8.435 | 12.850 | 2.030 |
| #22 | 475 | 118.7 | 22 | 3.5 | 64.5 | 1.033 | 0.17 | 0.000 | 0.018 | 0.001 | 55.033 | 13.533 | 6.120 | 0.908 |
| #23 | 10,145 | 76.0 | 385 | 4.7 | 18.3 | 2.535 | 0.20 | 0.000 | 0.013 | 0.001 | 30.400 | 11.400 | 7.775 | 0.764 |
| #24 | 816 | 334.5 | 5 | 26.7 | 157 | 0.060 | 0.58 | 0.050 | 4.050 | 0.094 | 151.250 | 18.600 | 34.250 | 2.518 |
| #25 | 16,728 | 97.5 | 3 | 14,450.0 | 1690 | 0.060 | 0.25 | 0.017 | 3.300 | 1.545 | 289.500 | 833.500 | 6435.000 | 230.500 |
| #26 | 571 | 169.5 | 5,500 | 50.5 | 61.5 | 0.005 | 0.70 | 0.001 | 3.025 | 0.604 | 89.000 | 17.250 | 29.750 | 5.305 |
| #27 | 515 | 145.7 | 33 | 2.4 | 100.2 | 0.650 | 0.13 | 0.000 | 0.196 | 0.004 | 63.467 | 17.533 | 6.527 | 0.944 |
| #28 | 32,787 | 202.4 | 8 | 16,402.5 | 2104.425 | 0.036 | 0.37 | 0.024 | 0.351 | 0.077 | 260.325 | 891.500 | 6982.500 | 279.900 |
| #29 | 660 | 158.5 | 75 | 38.8 | 118 | 0.025 | 0.50 | 0.009 | 4.135 | 0.550 | 117.000 | 19.850 | 33.350 | 4.400 |
| #30 | 571 | 107.0 | 250 | 5.5 | 102.3 | 1.090 | 0.30 | 0.005 | 0.110 | 0.001 | 80.150 | 13.900 | 12.350 | 1.920 |
| #31 | 436 | 201.7 | 8 | 6.4 | 32 | 4.700 | 0.40 | 0.000 | 0.063 | 0.004 | 66.800 | 23.667 | 11.033 | 1.423 |
| #32 | 400 | 261.1 | 2930 | 7.9 | 6.533 | 0.083 | 0.23 | 0.022 | 11.530 | 0.586 | 64.782 | 9.186 | 12.797 | 2.154 |
| #33 | 500 | 124.3 | 60 | 3.4 | 33.133 | 1.777 | 0.20 | 0.000 | 0.068 | 0.002 | 45.200 | 15.300 | 6.613 | 0.960 |
| #34 | 281 | 38.2 | 90 | 6.2 | 14.15 | 6.600 | 0.08 | 0.000 | 0.107 | 0.001 | 19.550 | 6.960 | 7.715 | 1.373 |
| #35 | 606 | 195.2 | 83 | 3.9 | 138.8 | 2.282 | 0.36 | 0.000 | 0.135 | 0.003 | 94.160 | 17.940 | 10.448 | 1.630 |
| #36 | 591 | 101.0 | 8 | 4.8 | 60.35 | 4.600 | 0.15 | 0.000 | 0.041 | 0.001 | 64.100 | 14.900 | 8.200 | 1.130 |
| #37 | 10,333 | 114.5 | 10 | 4.5 | 121.5 | 6.335 | 0.25 | 0.000 | 0.032 | 0.001 | 89.550 | 16.800 | 8.360 | 1.850 |
| #38 | 724 | 237.6 | 5 | 8.8 | 120.4 | 0.790 | 0.30 | 0.007 | 1.219 | 0.284 | 141.200 | 25.700 | 27.200 | 3.140 |
| #39 | 669 | 80.0 | 650 | 3.4 | 32.85 | 3.230 | 0.20 | 0.002 | 2.045 | 2.567 | 38.850 | 8.115 | 14.500 | 1.013 |
| #40 | 592 | 290.0 | 120 | 26.3 | 2.2 | 0.030 | 3.35 | 0.291 | 0.646 | 0.029 | 20.200 | 27.900 | 78.250 | 45.000 |
| #41 | 637 | 102.0 | 28 | 4.4 | 32.1 | 7.135 | 0.20 | 0.000 | 0.143 | 0.009 | 52.850 | 15.750 | 9.120 | 1.225 |
| #42 | 587 | 211.2 | 90 | 4.2 | 127.86 | 1.292 | 0.18 | 0.000 | 0.034 | 0.002 | 92.220 | 18.460 | 14.480 | 1.980 |
| #43 | 502 | 118.5 | 50 | 7.2 | 93.85 | 0.860 | 0.15 | 0.001 | 1.940 | 0.100 | 74.350 | 13.150 | 14.650 | 1.715 |
| #44 | 251 | 113.0 | 355 | 1.9 | 19.4 | 0.185 | 0.50 | 0.011 | 2.230 | 0.498 | 20.050 | 7.160 | 43.850 | 1.169 |
| #45 | 369 | 127.7 | 100 | 3.9 | 1.6 | 0.005 | 0.35 | 0.001 | 0.325 | 0.239 | 42.150 | 4.855 | 30.350 | 1.570 |
| #46 | 520 | 169.5 | 175 | 8.4 | 47.05 | 9.380 | 0.20 | 0.000 | 0.481 | 0.013 | 103.700 | 18.300 | 8.570 | 1.840 |
| Wells | Rice Field,% | Dryland, % | Fruit Farm,% | Uncultivated Land,% | Aquaculture, % | Livestock, % | Forest, % | Water Conservation, % | Human Settlement, % |
|---|---|---|---|---|---|---|---|---|---|
| #1 | 17 | 12 | 22 | 0 | 3 | 10 | 0 | 2 | 14 |
| #2 | 1 | 6 | 1 | 0 | 0 | 0 | 25 | 0 | 44 |
| #3 | 0 | 62 | 0 | 0 | 0 | 2 | 12 | 0 | 27 |
| #4 | 0 | 0 | 32 | 5 | 0 | 0 | 0 | 4 | 45 |
| #5 | 0 | 2 | 22 | 0 | 0 | 0 | 1 | 2 | 4 |
| #6 | 0 | 2 | 2 | 0 | 52 | 0 | 0 | 22 | 8 |
| #7 | 1 | 4 | 66 | 0 | 6 | 4 | 0 | 6 | 8 |
| #8 | 5 | 17 | 0 | 0 | 63 | 0 | 0 | 1 | 13 |
| #9 | 20 | 3 | 20 | 0 | 2 | 0 | 0 | 18 | 3 |
| #10 | 0 | 56 | 4 | 0 | 0 | 0 | 0 | 1 | 36 |
| #11 | 23 | 7 | 11 | 0 | 19 | 16 | 0 | 8 | 8 |
| #12 | 23 | 11 | 11 | 0 | 19 | 15 | 0 | 8 | 8 |
| #13 | 15 | 4 | 38 | 0 | 9 | 4 | 0 | 0 | 27 |
| #14 | 0 | 0 | 64 | 0 | 0 | 0 | 5 | 3 | 25 |
| #15 | 0 | 1 | 4 | 0 | 0 | 0 | 1 | 5 | 68 |
| #16 | 0 | 1 | 89 | 1 | 0 | 1 | 0 | 0 | 5 |
| #17 | 0 | 0 | 5 | 0 | 7 | 0 | 0 | 71 | 1 |
| #18 | 3 | 52 | 9 | 0 | 1 | 0 | 0 | 0 | 33 |
| #19 | 41 | 12 | 11 | 0 | 3 | 4 | 0 | 1 | 25 |
| #20 | 0 | 12 | 35 | 0 | 15 | 0 | 16 | 9 | 5 |
| #21 | 0 | 2 | 1 | 0 | 0 | 0 | 7 | 3 | 1 |
| #22 | 0 | 0 | 98 | 0 | 0 | 0 | 0 | 0 | 2 |
| #23 | 0 | 0 | 0 | 0 | 0 | 0 | 18 | 0 | 73 |
| #24 | 0 | 0 | 0 | 0 | 0 | 0 | 0 | 31 | 59 |
| #25 | 0 | 0 | 0 | 0 | 0 | 0 | 0 | 77 | 0 |
| #26 | 0 | 6 | 8 | 0 | 9 | 3 | 0 | 0 | 62 |
| #27 | 0 | 18 | 59 | 0 | 0 | 0 | 0 | 0 | 4 |
| #28 | 0 | 0 | 4 | 0 | 2 | 0 | 0 | 8 | 6 |
| #29 | 8 | 34 | 9 | 4 | 2 | 2 | 0 | 0 | 40 |
| #30 | 0 | 10 | 30 | 0 | 20 | 4 | 4 | 36 | 4 |
| #31 | 0 | 60 | 0 | 0 | 0 | 0 | 1 | 0 | 37 |
| #32 | 0 | 0 | 55 | 0 | 0 | 0 | 3 | 0 | 40 |
| #33 | 0 | 0 | 99 | 0 | 0 | 0 | 0 | 0 | 0 |
| #34 | 0 | 3 | 77 | 0 | 3 | 3 | 0 | 0 | 1 |
| #35 | 5 | 21 | 48 | 0 | 0 | 0 | 0 | 2 | 24 |
| #36 | 3 | 9 | 21 | 2 | 9 | 9 | 12 | 3 | 23 |
| #37 | 1 | 3 | 74 | 4 | 0 | 7 | 1 | 0 | 7 |
| #38 | 1 | 34 | 19 | 1 | 25 | 4 | 1 | 0 | 8 |
| #39 | 0 | 1 | 64 | 1 | 0 | 5 | 0 | 5 | 23 |
| #40 | 6 | 14 | 9 | 0 | 20 | 0 | 0 | 3 | 5 |
| #41 | 1 | 3 | 84 | 0 | 3 | 1 | 0 | 0 | 4 |
| #42 | 34 | 17 | 23 | 1 | 12 | 0 | 0 | 3 | 2 |
| #43 | 0 | 9 | 6 | 3 | 0 | 0 | 0 | 1 | 79 |
| #44 | 0 | 0 | 91 | 2 | 0 | 1 | 1 | 0 | 4 |
| #45 | 0 | 44 | 14 | 0 | 0 | 0 | 12 | 0 | 14 |
| #46 | 0 | 15 | 52 | 0 | 3 | 15 | 0 | 0 | 10 |
| Wells | Types of Unsaturated Soil | ||||
|---|---|---|---|---|---|
| Depth (m) | Gravel,% | Coarse Sand,% | Fine Sand,% | Clay,% | |
| #1 | 39.2 | 4 | 9 | 4 | 0 |
| #2 | 63.0 | 0 | 0 | 3 | 15 |
| #3 | 39.2 | 0 | 3 | 1 | 4 |
| #4 | 27.3 | 18 | 3 | 0 | 23 |
| #5 | 24.0 | 18 | 0 | 1 | 0 |
| #6 | 24.5 | 0 | 0 | 1 | 1 |
| #7 | 36.2 | 0 | 7 | 3 | 7 |
| #8 | 30.9 | 0 | 0 | 6 | 6 |
| #9 | 55.6 | 0 | 0 | 3 | 0 |
| #10 | 36.5 | 0 | 0 | 4 | 5 |
| #11 | 29.4 | 0 | 1 | 2 | 2 |
| #12 | 47.5 | 0 | 2 | 0 | 0 |
| #13 | 33.8 | 0 | 5 | 1 | 5 |
| #14 | 42.1 | 5 | 16 | 3 | 0 |
| #15 | 53.0 | 0 | 7 | 3 | 6 |
| #16 | 47.3 | 25 | 4 | 4 | 0 |
| #17 | 35.8 | 3 | 3 | 0 | 0 |
| #18 | 44.0 | 0 | 3 | 0 | 2 |
| #19 | 38.2 | 0 | 5 | 5 | 0 |
| #20 | 114.2 | 17 | 34 | 0 | 1 |
| #21 | 35.5 | 22 | 0 | 7 | 0 |
| #22 | 71.5 | 44 | 0 | 0 | 0 |
| #23 | 66.9 | 13 | 0 | 8 | 15 |
| #24 | 49.4 | 0 | 1 | 3 | 6 |
| #25 | 25.3 | 3 | 0 | 0 | 0 |
| #26 | 24.0 | 0 | 0 | 0 | 16 |
| #27 | 78.3 | 59 | 12 | 3 | 1 |
| #28 | 26.0 | 0 | 0 | 3 | 0 |
| #29 | 27.0 | 3 | 5 | 0 | 0 |
| #30 | 71.9 | 0 | 23 | 1 | 15 |
| #31 | 62.0 | 31 | 0 | 0 | 0 |
| #32 | 116.4 | 13 | 0 | 14 | 0 |
| #33 | 70.5 | 45 | 0 | 0 | 0 |
| #34 | 108.9 | 63 | 0 | 0 | 4 |
| #35 | 75.8 | 65 | 0 | 0 | 0 |
| #36 | 112.0 | 30 | 4 | 1 | 1 |
| #37 | 100.0 | 44 | 0 | 0 | 0 |
| #38 | 111.6 | 20 | 10 | 4 | 1 |
| #39 | 149.5 | 3 | 10 | 2 | 8 |
| #40 | 66.5 | 0 | 0 | 0 | 3 |
| #41 | 95.8 | 9 | 4 | 0 | 16 |
| #42 | 126.1 | 45 | 7 | 0 | 2 |
| #43 | 117.8 | 9 | 5 | 12 | 13 |
| #44 | 51.8 | 2 | 8 | 5 | 11 |
| #45 | 242.1 | 14 | 4 | 0 | 0 |
| #46 | 77.7 | 37 | 0 | 0 | 0 |
| EC | HCO3− | E. Coli | Cl− | SO42− | NO3−-N | TOC | As | Fe3+ | Mn2+ | Ca2+ | Mg2+ | Na+ | K+ | Rice Field | Dry-Land | Fruit Farm | Uncultivated Land | Aqua-Culture | Live-Stock | Forest | Water Conservation | Human Settlement | Gravel | Coarse Sand | Fine Sand | Clay | |
|---|---|---|---|---|---|---|---|---|---|---|---|---|---|---|---|---|---|---|---|---|---|---|---|---|---|---|---|
| EC | 1.00 | 0.09 | −0.10 | 0.91 | 0.91 | −0.16 | −0.08 | −0.03 | −0.05 | 0.18 | 0.75 | 0.91 | 0.92 | 0.92 | −0.16 | −0.22 | −0.24 | −0.04 | 0.31 | −0.15 | −0.06 | 0.26 | −0.13 | −0.15 | −0.22 | −0.01 | −0.13 |
| HCO3− | 1.00 | 0.02 | 0.09 | 0.11 | −0.43 | 0.42 | 0.41 | 0.26 | 0.11 | 0.43 | 0.09 | 0.08 | 0.13 | 0.25 | 0.24 | −0.39 | −0.16 | 0.21 | −0.03 | −0.17 | 0.03 | 0.11 | −0.30 | −0.07 | −0.05 | −0.17 | |
| E. Coli | 1.00 | −0.08 | −0.09 | 0.01 | 0.01 | −0.06 | −0.01 | 0.02 | −0.06 | −0.09 | −0.08 | −0.09 | 0.12 | −0.14 | 0.01 | −0.11 | 0.02 | 0.06 | −0.08 | −0.12 | 0.22 | −0.17 | −0.04 | 0.05 | 0.15 | ||
| Cl− | 1.00 | 0.99 | −0.20 | −0.07 | 0.00 | −0.04 | 0.26 | 0.83 | 0.99 | 0.99 | 0.99 | −0.13 | −0.17 | −0.25 | −0.12 | 0.24 | −0.15 | −0.13 | 0.43 | −0.19 | −0.20 | −0.17 | −0.08 | −0.17 | |||
| SO42− | 1.00 | −0.21 | −0.09 | −0.02 | −0.06 | 0.23 | 0.86 | 0.99 | 0.99 | 0.98 | −0.10 | −0.18 | −0.24 | −0.09 | 0.24 | −0.15 | −0.14 | 0.42 | −0.19 | −0.18 | −0.13 | −0.08 | −0.17 | ||||
| NO3−-N | 1.00 | −0.30 | −0.26 | −0.16 | −0.25 | −0.27 | −0.20 | −0.20 | −0.21 | −0.15 | −0.12 | 0.38 | 0.10 | −0.19 | 0.29 | 0.04 | −0.23 | −0.18 | 0.44 | 0.01 | −0.13 | −0.04 | |||||
| TOC | 1.00 | 0.92 | 0.10 | 0.02 | −0.10 | −0.06 | −0.07 | 0.02 | 0.14 | 0.14 | −0.29 | −0.07 | 0.28 | −0.03 | −0.10 | −0.04 | −0.02 | −0.33 | −0.17 | −0.13 | 0.03 | ||||||
| As | 1.00 | 0.01 | −0.08 | −0.06 | 0.00 | 0.00 | 0.07 | 0.14 | 0.03 | −0.22 | −0.14 | 0.15 | −0.05 | −0.14 | 0.10 | −0.11 | −0.27 | −0.16 | −0.11 | −0.12 | |||||||
| Fe3+ | 1.00 | 0.59 | 0.00 | −0.03 | −0.04 | −0.02 | −0.06 | 0.44 | −0.17 | −0.07 | −0.07 | −0.04 | 0.21 | −0.06 | 0.07 | −0.16 | −0.05 | 0.00 | −0.02 | ||||||||
| Mn2+ | 1.00 | 0.25 | 0.28 | 0.27 | 0.27 | −0.03 | 0.13 | −0.19 | −0.04 | 0.06 | 0.05 | 0.14 | 0.16 | 0.08 | −0.38 | −0.06 | 0.01 | 0.09 | |||||||||
| Ca2+ | 1.00 | 0.84 | 0.83 | 0.82 | 0.05 | −0.09 | −0.36 | −0.04 | 0.28 | 0.01 | −0.23 | 0.49 | −0.13 | −0.23 | −0.08 | −0.15 | −0.21 | ||||||||||
| Mg2+ | 1.00 | 0.99 | 0.99 | −0.12 | −0.17 | −0.25 | −0.11 | 0.27 | −0.15 | −0.12 | 0.44 | −0.19 | −0.20 | −0.17 | −0.08 | −0.17 | |||||||||||
| Na+ | 1.00 | 0.99 | −0.12 | −0.18 | −0.24 | −0.11 | 0.27 | −0.15 | −0.13 | 0.43 | −0.19 | −0.20 | −0.17 | −0.07 | −0.16 | ||||||||||||
| K+ | 1.00 | −0.12 | −0.17 | −0.26 | −0.11 | 0.30 | −0.14 | −0.13 | 0.40 | −0.20 | −0.22 | −0.18 | −0.09 | −0.15 | |||||||||||||
| Rice field | 1.00 | 0.00 | −0.19 | −0.08 | 0.14 | 0.37 | −0.20 | −0.08 | −0.14 | −0.11 | −0.02 | −0.02 | −0.22 | ||||||||||||||
| Dryland | 1.00 | −0.35 | −0.07 | −0.01 | −0.05 | 0.09 | −0.24 | 0.12 | −0.01 | −0.01 | −0.18 | −0.20 | |||||||||||||||
| Fruit farm | 1.00 | 0.15 | −0.26 | 0.04 | −0.22 | −0.27 | −0.39 | 0.51 | 0.16 | −0.09 | −0.02 | ||||||||||||||||
| Uncultivated land | 1.00 | −0.15 | 0.04 | −0.09 | −0.15 | 0.20 | 0.13 | −0.01 | −0.01 | 0.28 | |||||||||||||||||
| Aquaculture | 1.00 | 0.12 | −0.11 | 0.08 | −0.23 | −0.22 | 0.07 | −0.03 | −0.02 | ||||||||||||||||||
| Livestock | 1.00 | −0.11 | −0.09 | −0.17 | −0.03 | 0.00 | −0.16 | −0.14 | |||||||||||||||||||
| Forest | 1.00 | −0.12 | 0.22 | −0.07 | 0.22 | 0.11 | 0.20 | ||||||||||||||||||||
| Water conservation | 1.00 | −0.21 | −0.26 | 0.05 | −0.18 | −0.08 | |||||||||||||||||||||
| Human Settlement | 1.00 | −0.26 | −0.13 | 0.39 | 0.50 | ||||||||||||||||||||||
| Gravel | 1.00 | −0.07 | −0.21 | −0.26 | |||||||||||||||||||||||
| Coarse sand | 1.00 | −0.06 | 0.06 | ||||||||||||||||||||||||
| Fine sand | 1.00 | 0.14 | |||||||||||||||||||||||||
| Clay | 1.00 |
References
- Consuming Water Resources Database of Taiwan. Available online: http://wuss.wra.gov.tw (accessed on 30 June 2019).
- Agriculture Engineering Research Center. Survey, Analysis and Assessment of Groundwater Quality in Taiwan Areas in 2009; Water Resources Agency, Ministry of Economic Affairs, Executive Yuan: Taiwan, 2009; pp. 100–102. [Google Scholar]
- Agriculture Engineering Research Center. Survey, Analysis and Assessment of Groundwater Quality of Taiwan in 2010; Water Resources Agency, Ministry of Economic Affairs, Executive Yuan: Taiwan, 2010; pp. 151–158. [Google Scholar]
- Agriculture Engineering Research Center. Survey, Analysis and Assessment of Groundwater Quality of Taiwan in 2011; Water Resources Agency, Ministry of Economic Affairs, Executive Yuan: Taiwan, 2011; pp. 191–203. [Google Scholar]
- Agriculture Engineering Research Center. Survey, Analysis and Assessment of Groundwater Quality of Taiwan in 2012–2014 (1/3); Water Resources Agency, Ministry of Economic Affairs, Executive Yuan: Taiwan, 2012; pp. 85–101. [Google Scholar]
- Hsu, L.I.; Chen, G.S.; Lee, C.H.; Yang, T.Y.; Chen, Y.H.; Wang, Y.H.; Hsueh, Y.M.; Chiou, H.Y.; Wu, M.M.; Chen, C.J. Use of Arsenic-Induced Palmoplantar Hyperkeratosis and Skin Cancers to Predict Risk of Subsequent Internal Malignancy. Am. J. Epidemiol. 2013, 177, 202–212. [Google Scholar] [CrossRef] [PubMed]
- Liang, C.P.; Jang, C.S.; Chen, C.F.; Chen, J.S. Zonal Management of Multi-Purposes Groundwater Utilization Based on Water Quality and Impact on the Aquifer. Environ. Monit. Assess. 2016, 188, 431. [Google Scholar] [CrossRef] [PubMed]
- Liang, C.P.; Chien, Y.C.; Jang, C.S.; Chen, C.F.; Chen, J.S. Spatial Analysis of Human Health Risk Due to Arsenic Exposure through Drinking Groundwater in Taiwan’s Pingtung Plain. Int. J. Environ. Res. Public Health 2017, 14, 81. [Google Scholar] [CrossRef] [PubMed]
- Liang, C.P.; Chen, J.S.; Chien, Y.C.; Chen, C.F. Spatial Analysis of the Risk to Human Health from Exposure to Arsenic Contaminated Groundwater: A Kriging Approach. Sci. Total Environ. 2018, 627, 1048–1057. [Google Scholar] [CrossRef]
- Liang, C.P.; Hsu, W.S.; Chien, Y.C.; Wan, S.W.; Chen, J.S. The Combined Use of Groundwater Quality, Drawdown Index and Land Use to Establish a Multi-Purpose Groundwater Utilization Plan. Water Resour. Manag. 2019, 33, 4231–4247. [Google Scholar] [CrossRef]
- Bulka, C.M.; Jones, R.M.; Turyk, M.E.; Stayner, L.T.; Argos, M. Arsenic in Drinking Water and Prostate Cancer in Illinois Counties: An Ecologic Study. Environ. Res. 2016, 148, 450–456. [Google Scholar] [CrossRef]
- States, J.C. Disruption of Mitotic Progression by Arsenic. Biol. Trace Elem. Res. 2015, 166, 34–40. [Google Scholar] [CrossRef]
- Chen, C.; Jiang, X.; Zhang, Z. MicroRNA-155 Regulates Arsenite-Induced Malignant Transformation by Targeting Nrf2-Mediated Oxidative Damage in Human Bronchial Fepithelial Cells. Toxicol. Lett. 2017, 278, 38–47. [Google Scholar] [CrossRef]
- Liang, C.P.; Jang, C.S.; Liu, C.W.; Lin, K.H.; Lin, M.C. An Integrated GIS-Based Approach in Assessing Carcinogenic Risks via Food-Chain Exposure in Arsenic-Affected Groundwater Areas. Environ. Toxicol. 2010, 25, 113–123. [Google Scholar] [CrossRef]
- Liang, C.P.; Liu, C.W.; Jang, C.S.; Wang, S.W.; Lee, J.J. Assessing and Managing the Health Risk Due to Ingestion of Inorganic Arsenic from Fish and Shellfish Farmed in Blackfoot Disease Areas for General Taiwanese. J. Hazard. Mater. 2011, 186, 622–628. [Google Scholar] [CrossRef]
- Liang, C.P.; Jang, C.S.; Chen, J.S.; Wang, S.W.; Lee, J.J.; Liu, C.W. Probabilistic Health Risk Assessment for Ingestion of Seafood Farmed in Arsenic Contaminated Groundwater in Taiwan. Environ. Geochem. Health 2013, 35, 455–464. [Google Scholar] [CrossRef] [PubMed]
- Lerner, D.N.; Harris, R.C. The Relationship between Land Use and Groundwater Resources and Quality. Land Use Policy 2009, 26, 265–273. [Google Scholar] [CrossRef]
- Jang, C.S.; Lin, C.W.; Liang, C.P.; Chen, J.S. Developing a Reliable Model for Aquifer Vulnerability. Stoch. Environ. Res. Risk Assess. 2016, 30, 175–187. [Google Scholar] [CrossRef]
- Liang, C.P.; Hsu, S.Y.; Chen, J.S. An Analytical Model for Solute Transport in an Infiltration Tracer Test in Soil with a Shallow Groundwater Table. J. Hydrol. 2016, 540, 129–141. [Google Scholar] [CrossRef]
- Liu, C.W.; Lin, C.N.; Jang, C.S.; Ling, M.P.; Tsai, J.W. Assessing Nitrate Contamination and Its Potential Health Risk to Kinmen Residents. Environ. Geochem. Health 2011, 33, 503–514. [Google Scholar] [CrossRef]
- Wang, X. The Relationship of Land Use and Groundwater Quality: A Case Study of Rhode Island. Master’s Thesis, University of Rhode Island, Kingston, RI, USA, 1989. [Google Scholar]
- Eckhardt, D.V.A.; Stackelberg, P.E. Relation of Ground-Water Quality to Land Use on Long Island, New York. Ground Water 1995, 33, 1019–1031. [Google Scholar] [CrossRef]
- Jeong, C.H. Effect of Land Use and Urbanization on Hydrochemistry and Contamination of Groundwater from Taejon Area, Korea. J. Hydrol. 2001, 253, 194–210. [Google Scholar] [CrossRef]
- Ouyang, Y.; Zang, J.E.; Cui, L. Estimating Impact of Land Use on Groundwater Quality Using Trilinear Analysis. Environ. Monit. Assess. 2014, 186, 5353–5362. [Google Scholar] [CrossRef]
- Penha, A.M.; Chambel, A.; Murteira, M.; Morais, M. Influence of Different Land Use on Groundwater Quality in Southern Portugal. Environ. Earth Sci. 2016, 75, 622. [Google Scholar] [CrossRef]
- Water Resource Agency, Taiwan. Available online: https://www.wra.gov.tw/ (accessed on 30 June 2019).
- Heißerer, T.; Haslauer, C.; Bárdossy, A. Including Land Use Information for the Spatial Estimation of Groundwater Quality Parameters—1. Local Estimation Based on Neighbourhood Composition. J. Hydrol. 2016, 535, 688–698. [Google Scholar] [CrossRef]
- Central Geological Survey, Taiwan. Available online: https://www.moeacgs.gov.tw/ (accessed on 30 June 2019).
- Kaiser, H.F. The Varimax Criterion for Analytic Rotation in Factor Analysis. Psychometrika 1958, 23, 187–201. [Google Scholar] [CrossRef]
- Liu, C.W.; Lin, K.H.; Kuo, Y.M. Application of Factor Analysis in the Assessment of Groundwater Quality in a Blackfoot Disease Area in Taiwan. Sci. Total Environ. 2003, 313, 77–89. [Google Scholar] [CrossRef]
- Jang, C.S.; Chen, S.K. Integrating Indicator-Based Geostatistical Estimation and Aquifer Vulnerability of Nitrate-N for Establishing Groundwater Protection Zone. J. Hydrol. 2015, 523, 441–451. [Google Scholar] [CrossRef]
- Chen, W.F.; Liu, T.K. Dissolved Oxygen and Nitrate of Groundwater in Choshui Fan-Delta, Western Taiwan. Environ. Geol. 2003, 44, 731–737. [Google Scholar] [CrossRef]


| Parameter | Average (mg/L) | Maximum (mg/L) | Minimum (mg/L) | Standard Deviation (-) | Coefficient of Variation (-) | Exceed the Standard for Drinking | Percentage,% | Exceed the Standard for Agriculture | Percentage,% | Exceed the Standard for Aquaculture | Percentage,% |
|---|---|---|---|---|---|---|---|---|---|---|---|
| EC | 3155.60 | 35,541.13 | 251.00 | 7486.01 | 2.4 | -- | -- | 13 | 28 | -- | -- |
| HCO3− | 170.89 | 340.89 | 19.30 | 77.46 | 0.5 | 9 | -- | -- | -- | -- | -- |
| E. Coli | 503.07 | 9345.00 | 2.50 | 1608.82 | 3.2 | 15 | 33 | -- | -- | 0 | 0 |
| Cl− | 1075.45 | 16,562.50 | 1.85 | 3945.15 | 3.7 | 4 | 9 | 4 | 9 | -- | -- |
| SO42− | 185.86 | 2104.43 | 1.03 | 467.96 | 2.5 | 3 | 7 | 3 | 7 | -- | -- |
| NO3−-N | 1.86 | 9.38 | 0.01 | 2.47 | 1.3 | 0 | 0 | -- | -- | -- | -- |
| TOC | 0.44 | 3.35 | 0.08 | 0.48 | 1.1 | 0 | 0 | -- | -- | -- | -- |
| As | 0.02 | 0.29 | 0.00 | 0.05 | 2.6 | 12 | 26 | 4 | 9 | 4 | 9 |
| Fe3+ | 4.08 | 114.34 | 0.01 | 16.77 | 4.1 | 29 | 63 | 3 | 7 | -- | -- |
| Mn2+ | 0.37 | 2.62 | 0.00 | 0.60 | 1.6 | 29 | 63 | 20 | 44 | -- | -- |
| Ca2+ | 88.51 | 304.00 | 9.30 | 63.23 | 0.7 | -- | -- | -- | -- | -- | -- |
| Mg2+ | 74.97 | 1002.50 | 4.86 | 223.61 | 3.0 | -- | -- | -- | -- | -- | -- |
| Na+ | 488.15 | 7947.50 | 6.12 | 1778.95 | 3.6 | -- | -- | -- | -- | -- | -- |
| K+ | 22.13 | 318.63 | 0.76 | 68.91 | 3.1 | -- | -- | -- | -- | -- | -- |
| Rice field | 4.52 | 40.68 | 0.00 | 9.47 | 2.09 | ||||||
| Dryland | 12.26 | 61.56 | 0.00 | 17.21 | 1.40 | ||||||
| Fruit farm | 30.21 | 99.33 | 0.00 | 31.40 | 1.04 | ||||||
| Uncultivated land | 0.51 | 5.18 | 0.00 | 1.21 | 2.36 | ||||||
| Aquaculture | 6.70 | 63.39 | 0.00 | 12.94 | 1.93 | ||||||
| Livestock | 2.39 | 15.66 | 0.00 | 4.22 | 1.77 | ||||||
| Forest | 2.62 | 24.94 | 0.00 | 5.57 | 2.12 | ||||||
| Water conservation | 7.25 | 76.96 | 0.00 | 16.30 | 2.25 | ||||||
| Human Settlement | 20.47 | 78.96 | 0.00 | 21.49 | 1.05 | ||||||
| Gravel | 14.44 | 64.74 | 0.00 | 19.07 | 1.32 | ||||||
| Coarse sand | 4.22 | 34.34 | 0.00 | 6.60 | 1.56 | ||||||
| Fine sand | 2.26 | 13.52 | 0.00 | 3.05 | 1.35 | ||||||
| Clay | 4.09 | 22.54 | 0.00 | 5.85 | 1.43 |
| Common Factor | Eigenvalues | Percentages of Variance,% | Cumulative Eigenvalues,% |
|---|---|---|---|
| 1 | 7.42 | 28 | 28 |
| 2 | 3.36 | 12 | 40 |
| 3 | 2.50 | 9 | 49 |
| 4 | 1.83 | 7 | 56 |
| 5 | 1.55 | 6 | 62 |
| 6 | 1.38 | 5 | 67 |
| Parameter | Factor 1 | Factor 2 | Factor 3 | Factor 4 | Factor 5 | Factor 6 |
|---|---|---|---|---|---|---|
| Water quality | ||||||
| EC | 0.945 | 0.022 | −0.005 | −0.046 | −0.029 | 0.007 |
| HCO3− | 0.074 | 0.667 | 0.294 | 0.137 | 0.101 | −0.147 |
| E. Coli | −0.095 | −0.003 | −0.020 | 0.099 | 0.147 | −0.041 |
| Cl− | 0.986 | 0.031 | 0.000 | 0.041 | −0.052 | −0.058 |
| SO42− | 0.983 | 0.053 | −0.032 | 0.004 | −0.034 | −0.049 |
| NO3−-N | −0.153 | −0.669 | −0.212 | −0.122 | 0.223 | 0.017 |
| TOC | −0.079 | 0.213 | 0.947 | 0.050 | 0.050 | 0.019 |
| As | −0.027 | 0.168 | 0.923 | −0.053 | −0.041 | −0.104 |
| Fe3+ | −0.076 | 0.161 | 0.015 | 0.858 | −0.076 | −0.098 |
| Mn2+ | 0.244 | 0.089 | −0.020 | 0.833 | 0.064 | 0.101 |
| Ca2+ | 0.838 | 0.304 | −0.117 | 0.054 | 0.146 | −0.012 |
| Mg2+ | 0.989 | 0.030 | 0.008 | 0.051 | −0.038 | −0.053 |
| Na+ | 0.989 | 0.024 | 0.005 | 0.043 | −0.042 | −0.053 |
| K+ | 0.985 | 0.034 | 0.086 | 0.050 | −0.024 | −0.041 |
| Land use | ||||||
| Rice field | −0.146 | 0.341 | 0.017 | −0.106 | 0.612 | −0.219 |
| Dryland | −0.220 | 0.389 | −0.015 | 0.372 | 0.013 | −0.180 |
| Fruit farm | −0.250 | −0.742 | −0.148 | −0.090 | −0.135 | −0.039 |
| Uncultivated land | −0.067 | −0.077 | −0.123 | −0.066 | 0.044 | 0.803 |
| Aquaculture | 0.312 | 0.146 | 0.322 | −0.154 | 0.467 | −0.077 |
| Livestock | −0.113 | −0.162 | −0.054 | 0.084 | 0.837 | 0.033 |
| Forest | −0.126 | 0.006 | −0.111 | 0.171 | −0.138 | 0.012 |
| Water conservation | 0.415 | 0.094 | 0.061 | 0.051 | −0.123 | −0.050 |
| Human settlement | −0.186 | 0.494 | −0.167 | 0.033 | −0.240 | 0.495 |
| Geological material | ||||||
| Gravel | −0.176 | −0.494 | −0.289 | −0.249 | −0.123 | −0.177 |
| Coarse sand | −0.217 | −0.002 | −0.196 | −0.085 | 0.085 | −0.029 |
| Fine sand | −0.072 | 0.287 | −0.213 | −0.191 | −0.239 | 0.017 |
| Clay | −0.140 | −0.012 | 0.061 | 0.045 | −0.144 | 0.724 |
Publisher’s Note: MDPI stays neutral with regard to jurisdictional claims in published maps and institutional affiliations. |
© 2020 by the authors. Licensee MDPI, Basel, Switzerland. This article is an open access article distributed under the terms and conditions of the Creative Commons Attribution (CC BY) license (http://creativecommons.org/licenses/by/4.0/).
Share and Cite
Liang, C.-P.; Wang, C.-H.; Wang, S.-W.; Chang, T.-W.; Chen, J.-S. Application of Factor Analysis for Characterizing the Relationships between Groundwater Quality and Land Use in Taiwan’s Pingtung Plain. Sustainability 2020, 12, 10608. https://doi.org/10.3390/su122410608
Liang C-P, Wang C-H, Wang S-W, Chang T-W, Chen J-S. Application of Factor Analysis for Characterizing the Relationships between Groundwater Quality and Land Use in Taiwan’s Pingtung Plain. Sustainability. 2020; 12(24):10608. https://doi.org/10.3390/su122410608
Chicago/Turabian StyleLiang, Ching-Ping, Chia-Hui Wang, Sheng-Wei Wang, Ta-Wei Chang, and Jui-Sheng Chen. 2020. "Application of Factor Analysis for Characterizing the Relationships between Groundwater Quality and Land Use in Taiwan’s Pingtung Plain" Sustainability 12, no. 24: 10608. https://doi.org/10.3390/su122410608
APA StyleLiang, C.-P., Wang, C.-H., Wang, S.-W., Chang, T.-W., & Chen, J.-S. (2020). Application of Factor Analysis for Characterizing the Relationships between Groundwater Quality and Land Use in Taiwan’s Pingtung Plain. Sustainability, 12(24), 10608. https://doi.org/10.3390/su122410608