Article

Spatial Planning of Green Infrastructure for Mitigation and Adaptation to Climate Change at a Regional Scale

Land Laboratory, Department of Agroforestry Engineering, University of Santiago de Compostela, 27002 Lugo, Spain
*
Author to whom correspondence should be addressed.
Sustainability 2020, 12(24), 10525; https://doi.org/10.3390/su122410525
Submission received: 25 November 2020 / Revised: 11 December 2020 / Accepted: 14 December 2020 / Published: 16 December 2020

Abstract

:
Green infrastructure has acquired greater importance in recent years in relation to climate change adaptation. Green infrastructure planning has been identified as a new and innovative means of land planning that can contribute to preventing the impacts of climate change. However, this has been explored more thoroughly in urban areas than at the regional scale. The present study proposes a methodology including multi-criteria evaluation techniques for assessing the ESS involved in the fight against climate change and for the spatial planning of multifunctional green infrastructure areas based on the results of this assessment. Application of the methodology for green infrastructure planning aimed at confronting climate change at landscape level in the region of Galicia (NW Spain) successfully delimited multifunctional green infrastructure zones. Results show that delimited zones have a higher provision potential for more ESS than protected natural areas and areas that are not part of the green infrastructure.

1. Introduction

The IPCC predictions for climate change (CC) in Europe foresee hotter and drier summers and alterations in precipitation regimes, with an increase in the frequency of heavy storms and rainfall events [1]. These changes will affect ecosystem dynamics and thus the composition of the species the ecosystems host. As a consequence, CC may exert negative impacts on biodiversity [1], as recognized in the EU biodiversity strategy for 2030 [2], which states that CC and biodiversity loss are intrinsically linked. Biodiversity and the provision of other ecosystem services (ESS) may, in turn, play an important role in preventing the negative effects of CC [3]. In this line, the EU biodiversity strategy [2] states that “nature is a vital ally in the fight against CC” and refers to nature based solutions and green infrastructure (GI) as key factors in mitigating the negative effects of CC. Consequently, the EU Commission communication “Green Infrastructure: Enhancing Europe’s Natural Capital” [4], establishes the basis for the creation of GI in EU member states, in order to tackle biodiversity loss. This endeavor requires methodologies that can be applied at a regional scale to help policymakers and planners to delimit GI elements. In this paper, we will focus on the development of a methodology for delimiting GI aimed at helping to mitigate the negative effects of CC on biodiversity.
The concept of GI was first proposed by Rosenberg [5], who considered urban parks an extension of the infrastructure of cities, providing functions in addition to recreation, such as storm water infiltration. The notion of GI has since evolved and many definitions have been proposed [6]. The idea most frequently shared by these definitions is that GI is a network of green areas interconnected by several environmental functions at different scales, where natural processes work simultaneously to provide a greater environmental, social, and economic value [7]. Nonetheless, this idea is interpreted in different ways in GI planning. Thus, we can find examples of GI that consider green spaces as natural areas, such as wetlands and forests [8], as well as other examples that consider these spaces as grey infrastructure aimed at producing environmental benefits, such as fostering sustainable mobility or producing green energy [9,10]. In a similar way, depending on the interpretation, we can find examples of GI that focus on promoting environmental benefits [11,12], social functions [13,14], and fostering economic benefits [15,16]. The large number of definitions and interpretations provide an opportunity to find common ground to create an equilibrium between nature conservation and socioeconomic development [7]. However, this also creates ambiguities that may disrupt this balance when GI are implemented in practice [7].
As this study aimed to develop a methodology that EU member states can use to delimit the GI foreseen in the biodiversity strategy [2] and mandated by the communication of the EU Commission on GI [4], we will adopt the definition provided in aforementioned document: “GI is a strategically planned network of natural and semi-natural areas with other environmental features designed and managed to deliver a wide range of ESS”. According to this definition, development of the methodology will focus on delimiting multifunctional GI areas that will ensure the provision of several ESS that contribute to mitigating the impacts of CC on biodiversity.
As recognized by the EU Commission, GI can help to counteract the effects of CC by preventing floods, regulating hydrological flow, filtering pollutants, preventing erosion, and restoring connectivity to enable migration of species [17]. These benefits have been confirmed in many scientific studies [18,19,20] and can potentially prevent biodiversity loss due to CC [2]. Consequently, GI is acquiring increasing importance in relation to CC adaptation [21]. However, Matthews et al. [22] warned that integration of GI in commonly used planning tools and processes is one of the main challenges to applying GI for CC adaptation. Therefore, GI should be conceived as a spatial concept [23] and thus, spatial planning methods should be used for designing GI.
The basis for taking integrated spatial planning decisions to design a GI, is mapping the potential for providing ESS [24,25]. Several methods have been developed to map ESS provision potential [26,27]. The most commonly used methods consider land-cover maps as a proxy for ecosystems and consequently establish relationships between land cover and the ESS provision potential [26]. ESS mapping from land-cover data is widely applied because the methods involved are simple to implement and use readily available data. However, methods based on land-cover mapping may not be accurate enough to estimate the provision potential of ESS that are influenced by landscape patterns [28]. In this case, other methods that estimate the provision potential through more complex models are better suited, although they demand more data, which are often not available [29].
ESS mapping enables planners to identify areas of land with the highest potential for providing ESS, as well as the types of land cover that are compatible with ESS provision and also the impact of change in land cover on the ESS provision potential. However, the outcomes of ESS analysis have not been widely used for the spatial planning of GI, as they are difficult to incorporate in the planning process due to the complex relationships between different ESS [25,30,31]. In addition, most previous research in this area has focused on how GI contributes to CC adaptation in urban areas [32,33,34,35], where the ESS provided by green areas are more evident. At a larger scale, landscape patterns are more complex and may induce synergies and trade-offs [28,36,37] that will increase the complexity of mapping ESS provision. This makes the process of incorporating ESS in planning procedures at this scale even more difficult.
On the other hand, the methods available for planning GI at regional scale mainly focus on locating corridors [38] or on designing GI with specific objectives, in which particular ESS are taken into account; e.g., GI designed to regulate water cycles [39]. Examples of regional-scale GI spatial planning methods that consider a wide range of ESS are scarce [40] and we do not know of any that specifically concern ESS related to CC mitigation and/or adaptation. Most of the available methods are based on multi-criteria decision analysis [41,42] or consist of algorithms of heuristic optimization designed for different purposes and that are applied to delineate GI [23,43,44].
Methods of multi-criteria decision analysis include that proposed by Liquete et al. [42], which combines the provision potential of different ESS to identify GI areas for conservation (those with a high combined ESS provision potential) and GI areas for restoration (those with a moderate ESS provision potential). Kopperoinen et al. [40] also combined maps of the provision potential of several ESS to identify GI multifunctional areas.
In addition to maximizing the provision potential of several ESS, heuristic methods can incorporate criteria for delimiting GI that cannot be considered in methods based on multi-criteria decision analysis. This applies to criteria such as the size and compactness of the delimited areas or their proximity to other elements of the GI. These methods can therefore delimit larger and more regular GI areas [45] that reduce edge effects [28] and have a greater potential to provide a wider variety of ESS [37]. On the other hand, heuristic optimization methods require more computation time and specific knowledge for fitting the optimization criteria. In addition, they produce an average optimum for the criteria considered and therefore do not grant maximization of ESS provision potential in the areas delimited [45]. The available heuristic methods that can be used for GI planning include spatial conservation prioritization techniques for planning natural spaces [23,44] and land cover optimization algorithms for land planning [43]. In addition, the Marxan software was designed for reserve selection in conservation planning and has been used by Schröter and Remme [45] to delineate ESS hotspots and by Vallecillo et al. [44] to delineate GI areas under different scenarios considering several ESS.
None of the aforementioned methods delineate multifunctional GI areas that would provide a variety of ESS with a specific purpose, such as mitigating the impacts of CC on biodiversity and the population. Moreover, none of the methods delineate GI areas by considering how they will be integrated with other GI elements such as core areas and corridors. These two elements are key to developing a methodology for spatial planning of GI, as areas must be delimited according to their function and by taking into account how they complement other areas in zoning plans.
In the present study, we propose a methodology for delimiting multifunctional zones that will act as buffers to counteract the impacts of CC in core areas and corridors in GI. The method has been tested by applying it to GI zoning in the region of Galicia (NW Spain). With this aim, the ESS involved in CC mitigation and adaptation were identified and their provision potential was mapped for the whole region. A multi-criteria evaluation method was used to combine the resulting ESS provision potential maps to produce a suitability map for multifunctional areas. The cells with the highest suitability values were selected, and the largest highly suitable cell patches adjacent to core areas and corridors in the GI were then delineated as multifunctional buffer zones. The resulting zones were analyzed to check whether they meet the criteria of having a high potential for providing several ESS and serving as buffer zones to prevent the impacts of CC in core areas and corridors in the GI. The methodology successfully delimited multifunctional GI elements that can counteract the impacts of CC since results show that they have a high potential for providing more CC related ESS than GI corridors and core areas as well as zones outside the GI. The delimited areas were found to be rather irregular due to landscape heterogeneity in the region. Suggestions are made for ways of incorporating landscape structure for delineating GI, in order to produce more regular GI elements and thus increase ESS provision.
In the following sections, the study area is introduced together with the criteria that are followed to select the CC related ESS to map. Then, the methodologies that were used to map the provision potential of the selected ESS and to delimit the GI multifunctional buffer zones are presented. The obtained ESS provision potential maps and the delineated multifunctional buffer zones are analyzed in the results section. With this aim, zonal statistics were used to estimate which land covers have the highest ESS provision potential and whether the delineated GI multifunctional buffer zones have a ESS provision potential higher than other areas. Landscape statistics were also used to assess whether the delineated GI zones are compact and located close to the areas that demand the ESS they produce. Finally, the main conclusions from the results analysis are presented.

2. Materials and Methods

2.1. Study Area

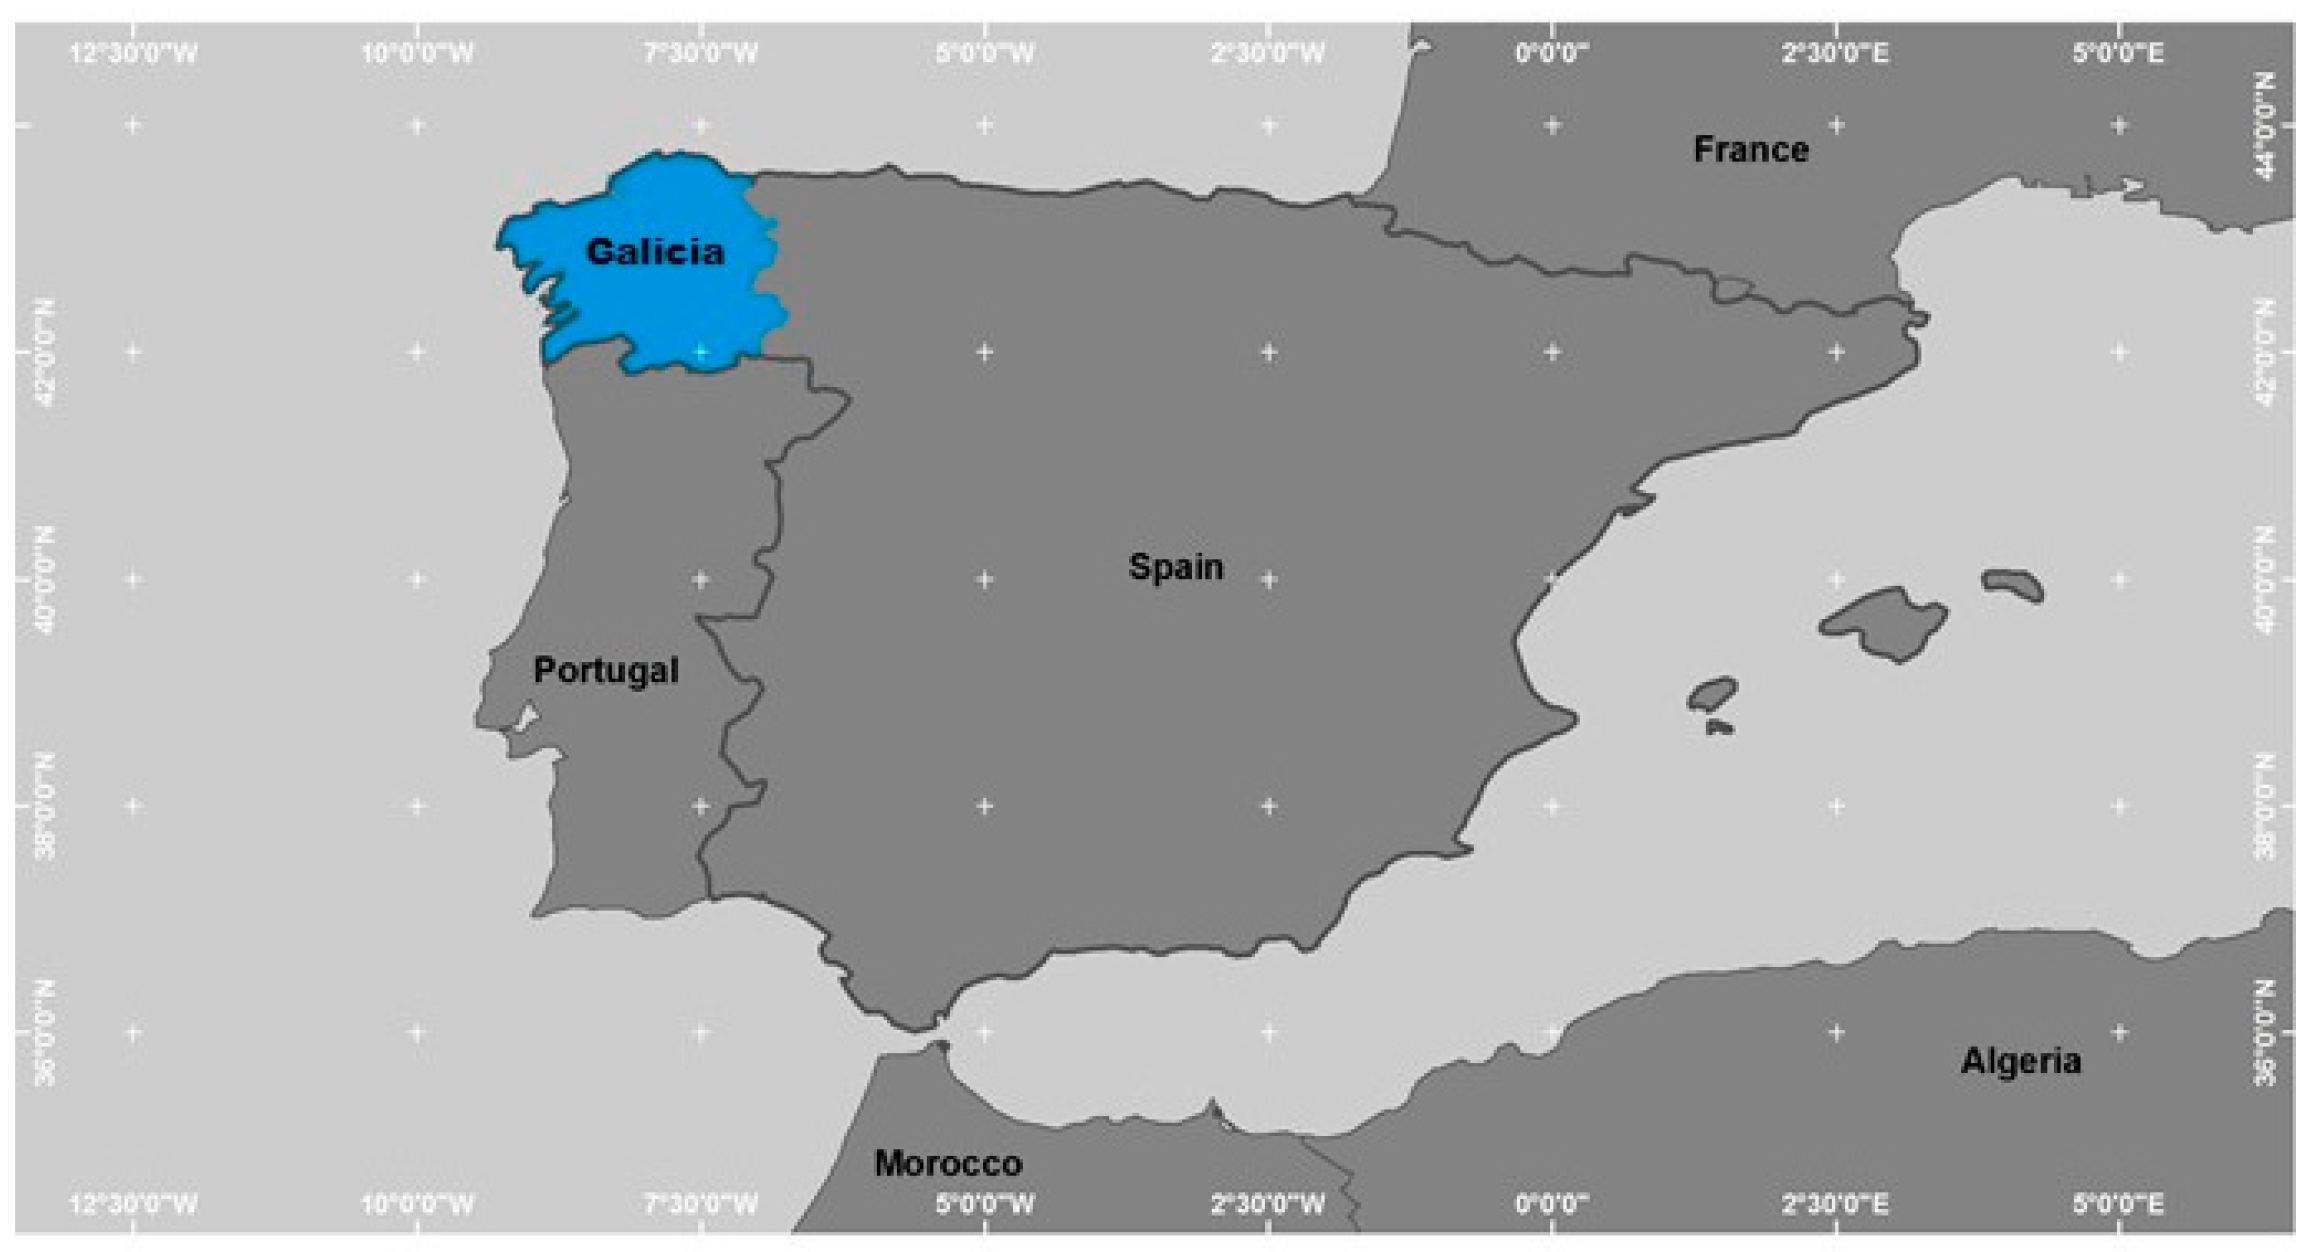
The region of Galicia, in north-western Spain (Figure 1), occupies an area of approximately 2.9 million hectares and has a population of around 2.7 million. Some 60% of the inhabitants of Galicia own land. Each landowner has on average 1.7 ha of land divided in 7 plots, resulting in an average plot size of 0.25 ha [46]. Around 30% of the population settlements in Spain are in Galicia [47], although the surface area of the region only accounts for 5.7% of the total surface area of the country [48]. The Galician population is disperse, but most of the population is concentrated on the Atlantic shore of the region. Inland Galicia is mainly rural and is currently suffering a population decline, leading to abandonment of agriculture and afforestation of agricultural land with fast growing exotic species [49]. This situation is leading to deterioration of ecosystems and therefore the biodiversity the ecosystems host [50] and the services they provide.
Galician soils are mainly sandy and have a high organic matter content, due to the mild and rainy oceanic climate that predominates in most of the region [51]. Average summer temperatures are rising and summer droughts are more frequent due to CC [52]. This has led to an increase in the frequency of wildfires in the region [53]. In the future, soil organic matter may evolve faster due to higher temperatures and therefore its capacity to retain water and nutrients will be reduced, exacerbating the effect of drought and leading to changes in the species composition of ecosystems. This adds to the deterioration of ecosystems due to rural population decline and is further exacerbated by CC.
The aforementioned trends increase the need for GI planning that will help to mitigate the impact of CC on natural values. The zoning of GI is rather complicated in the region due to land cover fragmentation, fostered by smallholdings and a varied terrain composed of hills and small valleys.

2.2. Selection of Ecosystem Services

Delineation of multifunctional buffer zones in GI is based on the capacity of an area to provide ESS involved in the reduction of CC impacts on biodiversity. In order to identify these ESS, the potential impacts of CC in the study area were identified by reviewing the IPCC reports.
According to the 5th assessment report of the IPCC [1], in the coming decades, CC will have the following consequences in Europe:
-
More frequent extreme precipitation events in northern and continental Europe, which will increase erosive processes and floods.
-
Increased drought and wildfire risk in the south of Europe.
-
Leaching of soil nutrients and pollutants in northern and continental Europe due to an increase in winter precipitation, which will lead to water pollution, poorer water quality, and reduced soil fertility.
-
Increased incidence of forest and agriculture pests and diseases.
-
Changes in ecosystems and in the composition of animal and plant populations. In southern Europe, these changes may lead to a decrease in biodiversity and to homogenization of populations. As a consequence, ESS such as pollination, pest control, and biodiversity may be affected.
The ESS involved in reducing the previously identified impacts of CC were selected by consulting version 5.1 of the Common International Classification of Ecosystem Services (CICES 5.1) developed by the European Environment Agency [54]. We used this classification as it is widely applied worldwide.
According to CICES 5.1, the following ESS will contribute most to counteracting the consequences of CC in the study area:
-
2.1.1.2 Filtration/sequestration/storage/accumulation of pollutants by microorganisms, algae, plants and animals.
-
2.2.1.1 Control of erosion rates.
-
2.2.1.3 Regulation of hydrological cycle and water flow (including flood control)
-
2.2.1.5 Fire protection.
-
2.2.2.1 Pollination.
-
2.2.2.3 Maintenance of breeding populations and habitats (including the protection of the genetic pool).
-
2.2.3.1 Pest control.
-
2.2.6.1 Regulation of the chemical composition of the atmosphere and the oceans.
For the purposes of the present study, ESS 2.2.6.1 was split into 3 ESS depending on the capacity of the ecosystems to capture and store carbon in the mid and long term:
-
Carbon capture: Capacity of vegetation to capture carbon in tissues for less than 20 years.
-
Mid-term carbon storage: Capacity of ecosystems to capture and store carbon for 20–150 years.
-
Long-term carbon storage: Capacity of ecosystems to capture and store carbon for more than 150 years.

2.3. Mapping of ESS Provision Potential

The methods used for mapping the ESS depend on the data available. In most cases, the ESS were mapped by using land-cover as a proxy. Additional biophysical variables were used when available. All variables considered were combined by using a weighted sum model to estimate the ESS provision potential. When enough data became available, more complex regression models were used [29].

2.3.1. Materials

As previously mentioned, in most cases, land cover was used as the main variable to map the ESS. The most accurate and up-to-date data on land cover for the study region is the Spanish Information System on Land Occupation (SIOSE) for 2014. The scale of these data (1:25,000) is of high enough resolution for mapping the ESS at the case study scale.
The SIOSE includes numerous mixed land cover categories composed of the percentages of several land cover types. In order to be able to use the data, these mixed categories were assigned the land cover type occupying the highest proportion of the surface area. In those cases where two types of land cover occupied the same proportion of land, a mixed category was created. Many land cover categories were also combined into a single category in order to simplify the data and make them easier to handle. The following SIOSE categories were finally considered for mapping: bare rock, bodies of continental water, bodies of salt water, cliffs, artificial land cover, coniferous forest, crops and fields, crops, deciduous forest, eucalyptus plantations, eucalyptus and coniferous, wetlands, sport facilities, shrub land, shrubs and trees, shrubs and rocks, mixed forests, crops and shrubs, crops and urban, crops and trees, fields, beaches, afforested land, transportation infrastructure, landfill, vine yards and woody crops, mineral extraction sites, burnt areas, urban areas, urban green areas.
Additional data used for ESS mapping included the following:
-
Digital terrain model of the IGN (Spanish National Geographic Institute) provided in raster format with a resolution of 25 × 25 m
-
Average annual precipitation raster map, of resolution 100 × 100 m, which was obtained by 3D interpolation of meteorological data from 129 meteorological stations, reported by Martínez Cortizas et al. [55]. The 3D interpolation was carried out with the v.vol.rst module of GRASS GIS 6.3.1 software by using the DEM derived from the Shuttle Radar Topography Mission with a cell size of 100 × 100 m as the starting point.
-
Average annual temperature raster map of resolution 100 × 100 m, obtained by 3D interpolation of meteorological data from 129 meteorological stations, as reported by Martínez Cortizas et al. [55].
-
A solar irradiance raster map, of resolution 2 × 2 m, provided by the Galician Institute for Regional Planning Studies, which forms part of the Galician Regional Ministry of Environment, Territory and Housing.
-
An erosion risk raster map, of resolution 25 × 25 m, constructed, by the INES (Spanish National Survey on Soil Erosion), using the Universal Soil Loss Equation (USLE) and provided by the Spanish Ministry of Agriculture, Fisheries and Food.
-
The 2012 Spanish Survey of Terrestrial Species from the Spanish Ministry of Ecological Transition, which uses a grid of cells of 10 × 10 km.
-
The Lithological Map of Galicia, scale 1:50,000, provided by the Galician Institute for Regional Planning Studies, which forms part of the Galician Regional Ministry of Environment, Territory, and Housing.
-
Cartography on bogs, wet shrublands, and dry shrublands provided by the Institute of Agricultural Biodiversity and Rural Development (IBADER) of the University of Santiago de Compostela.
-
Vector map of flood plains for a return period of 100 years provided by the Spanish Ministry of Ecological Transition.
-
Raster map of soil sand content, of resolution 500 × 500 m, extracted from a study of the Spanish National Institute of Agriculture Research (INIA) on the occurrence of heavy metals in agriculture soils [56].

2.3.2. Methods

We present below in more detail the methods developed in this study to map the provision potential of the following ESS: Regulation of hydrological flow (2.2.1.3), fire protection (2.2.1.5), pollination (2.2.2.1), pest control (2.2.3.1), and maintenance of breeding populations (2.2.2.3). The other ESS considered have already been mapped in a previous study, and the methods used to map them are described in García et al. [57].

2.3.3. Regulation of the Hydrological Cycle

The potential of ecosystems to regulate hydrological flow was estimated by considering the capacity of the land cover and soil to retain and infiltrate water [58]. The capacity of land cover to retain water was determined by assigning a weight between 0 and 1 to each SIOSE land cover type, where 1 indicates a high capacity to retain water and 0 indicates no capacity to retain water (Table 1). The weights were estimated on the basis of those used in Burkhard et al. [59] to map flood protection and other ESS in a region of Germany by assigning weights to the land cover types included in the CORINE (European Union program for COORdination of INformation on the Environment) Land Cover database. SIOSE feeds data to the CORINE land cover database and therefore there is a correspondence between SIOSE and CORINE land cover categories, thus enabling use of the aforementioned weights as reference values.
The capacity of soil to retain water was estimated considering the Topographic Wetness Index (TWI) and the percentage of sand in the soil [60]. The TWI was obtained from the DTM. The map of soil sand percentage was resampled to a resolution of 25 × 25 m using a bilinear interpolation method. Both the TWI map and the sand percentage map were normalized between 0 and 1 using a linear normalization method (Equation (1)).
Normalized value = (valuemin value)/(max valuemin value)
Flood plains with a return period of 100 years were also taken into account due to their key role in regulating the hydrological cycle. Therefore, a binary raster map of resolution 25 × 25 m was produced where the flood plains were assigned a value of 1 and the other areas a value of 0.
All of the aforementioned maps were combined by using Equation (2) to obtain the potential for regulation of the hydrological cycle.
ES provision potential = normalized capacity of land cover to retain water × 0.35
+ normalized TWI × 0.35 + normalized soil sand % × 0.15 + flood plains × 0.15
Land cover and TWI were considered the two main factors that control water retention by the vegetation and the terrain. This is the reason why they have been given the higher weights. Percentage of sand only accounts for the drainage capacity of soils and thus runoff reduction; yet runoff will be mainly reduced by vegetation. In the case of flood plains, they overlap areas with a high TWI. therefore, these two factors were given a lower weight.

2.3.4. Fire Protection

This ecosystem service is related to the capacity of ecosystems to prevent the spread of forest fires, which is determined by the fire severity. The severity of a wild fire is conditioned by the ecosystem biomass (type, volume, and structure) and its humidity content [61].
The ecosystem capacity to prevent fire expansion due to biomass was estimated using SIOSE land cover as a proxy. Therefore, weights between 0 and 1 were assigned to land cover types, where 1 indicates land cover with the lowest content of biomass and thus the highest capacity to prevent fire. These weights were determined by consulting the studies of Fernandes, Proença et al., and González et al. [61,62,63] (Table 1).
Biomass humidity is determined considering precipitation and temperature [61]. Solar irradiance was used as a proxy for temperature as this variable is more representative of temperature at a fine scale [64] than the available temperature data. Maps of annual average precipitation were used to yield precipitation data. Both solar irradiance and precipitation maps were resampled to a 25 × 25 m resolution through bilinear interpolation, and they were normalized to between 0 and 1. The maps were normalized using Equation (1) for precipitation and Equation (3) for irradiation.
Normalized value = (max valuevalue)/(max valuemin value)
As soil moisture also influences the fuel humidity [65], the TWI was also taken into account in calculating the fire protection potential. Slope and wind also influence the speed of fire spread, which determines fire severity and thus the capacity of ecosystems to prevent fire expansion [66]. Slope is already considered in the TWI as it is one of the parameters used to calculate this index. However, wind data with a sufficient resolution for the scale of this study were not available. Therefore, only the TWI was considered and was normalized to values between 0 and 1 by using Equation (1).
All the variables were combined using Equation (4) to determine the potential of ecosystems for fire protection.
ES provision potential = normalized biomass × 0.4 + normalized TWI × 0.3 +
normalized irradiance × 0.2 + normalized precipitation × 0.1
Biomass is the most determinant factor; this is why it has been given the highest weight. The moisture content of biomass is the second most important and is determined by water stored in soil and temperature. As it is difficult to obtain data on soil water content in the driest months it was decided to use the TWI as a proxy. Therefore, it was given the second highest factor. Irradiance was considered as a proxy of temperature at a very local scale. This is why it was given the third highest weight. Precipitation was used to account for humidity due to climatic conditions. However, there were only data at a global scale and it was not possible to estimate the water deficit in drier summers. This is why this factor has been given the lowest weight.

2.3.5. Pollination

The methodology used to map the provision potential of this ecosystem service is based on that reported in InVest [67], which can take into account several pollinator species and uses land cover maps as input data. In this study, we only considered bees as pollinator species, due to their importance in crop pollination. Thus, we considered a hypothetical generic bee species to represent the average behavior of the bee species that may be present in the area.
The potential of ecosystems to promote pollination is estimated by multiplying two indices that account for the accessibility of the pollinator to floral resources in an area (FR) and the suitability of land cover for providing nesting sites (HN). FR is calculated using Equation (5):
F R   ( x , s ) = j J w s j x X l L R A ( l ( x ) , j )   f a ( s , j )   exp ( D ( x , x ) s ) x X exp ( D ( x , x ) α s )
where w s j is the weight that represents the relative production of floral resources for pollinator species s in season j, D(x,x’) is the distance in a straight line between locations x and x’ within the flight radius of the pollinator, αs is the average flight distance for the pollinators, RA(l,j) is the relative abundance of floral resources in land cover l during season j, and fa(s,j) is the relative feeding activity for the pollinator species s during season j.
As only a generic bee species was considered and seasonal variance in flower resources cannot be taken into account due to a lack of data, w s j and fa(s,j) were omitted from the equation. The average flight distance (αs) for an average bee species is estimated to be equal to 1 km [68]. RA(l,j) was calculated by assigning weights between 0 and 1 according to land cover potential for providing flower resources. The weights (Table 1) were assigned according to Grundel et al. and Carré et al. [69,70]. The parameter related to nesting sites (HN) was calculated using Equation (6):
H N ( x , s ) = l L N ( l ( x ) , s )
where N(l,s) is an index that determines the capacity of land cover l to provide nesting for pollinator species s. If a pollinator species has several nesting preferences, N(l,s), the index assigned to cell x is that maximizing the preference for pollinator species s.
As we considered a generic bee species, the species preference for one type of nest or other is not applicable. Therefore, land cover types were weighted according to their capacity to provide any kind of nest. Therefore, the weights for nesting suitability associated with each land cover type were used directly as the value of HN. These weights take values between 0 and 1 and were estimated taking into account the papers from Potts et al. and Carré et al. [70,71] (Table 1).

2.3.6. Maintenance of Breeding Populations/Habitats and Pest Control

Both ecosystem services were mapped in a similar way, using as a basis the 2012 Spanish Survey of Terrestrial Species. This survey uses a grid of 10 × 10 km where the number of individuals of each species in each cell is provided.
In the case of the ecosystem service related to maintenance of breeding populations, the abundance of species in each cell of the grid was used as an indicator of the ecosystem capacity to host breeding populations and provide breeding habitats. The data from the Spanish Survey of Terrestrial Species were downscaled to produce a map with a cell size of 25 × 25 m.
Many researchers use logistic regressions to downscale species abundance data to a 1 × 1 km grid [72,73]. Nevertheless, logistic regressions establish the relationship between the probability of occurrence of a binary variable (presence or absence of a species in a grid) and a series of independent variables. In this study, we aimed to downscale the 10 × 10 km data by establishing relationships between a number of independent variables and the number of species present in a cell. Thus, we used a Poisson regression model [74], which is highly suited to determining these type of relationships [75].
The independent variables were selected by considering the variables used by Olivero et al. and Keil et al. [72,73] and selecting those for which there were available data for the study area. Therefore, the following independent variables were considered and calculated for each cell in the species abundance map: Mean average annual precipitation, mean solar irradiance, mean slope, variance of the slope, mean elevation, variance of the elevation, mean distance from motorways, mean distance from rivers, mean distance from population settlements larger than 1000 inhabitants, mean population density, edge density (ED) of land cover, and percentage of land cover (PLAND). For calculation of ED and PLAND, the land cover categories were grouped into 10 land cover types according to their similarity (Table 2). The ED and PLAND were then calculated for each of these 10 grouped land cover types by using FRAGSTATS [76].
The Poisson regression model was calibrated with a backward stepwise regression method using the “stepwiser” tool of R statistics software. The resulting model was then run in order to downscale the species abundance data, using the variables calculated for the cells of a grid with 1 × 1 km resolution as input. The resulting 1 × 1 km species abundance map was resampled to a cell size of 25 × 25 m using bicubic interpolation. This map represents the capacity of ecosystems to host breeding populations and habitats.
The same methodology was used to calculate the pest control potential. In this case, only the abundance of species that act as pest predators was considered. Civantos et al. [77] used a similar method. Therefore, the pest predators considered were those considered by Civantos et al. [77] and that are present in the study area.

2.4. Delimitation of Multifunctional GI Zones

The multifunctional buffer areas delimited using the current methodology are aimed at mitigating CC by means of carbon capture and storage and at reducing CC impacts in the core areas and the corridors. Therefore, delineation of these GI zones was based on the identification of areas with a high potential to provide several ESS involved in the mitigation and adaptation of CC and on the proximity of these areas to core areas and corridors of the GI.
The core areas of the GI correspond to the Natura 2000 network in Galicia. The corridors were delimited by the Institute of Agriculture Biodiversity and Rural Development of the University of Santiago de Compostela (IBADER) by interpreting aerial photographs and using the river network of the region as a basis.
The potential of an area to provide several ESS was determined by taking into account an average ESS provision potential map. This map was obtained by adding the normalized values of the ESS provision potential maps considered (Equation (1)) and dividing the result by the number of maps.
Multifunctional buffer zones were delimited by selecting 20% of the cells of the average ESS provision potential map with the highest values. The area of the patches formed by the selected cells was calculated and those patches of area less than 100 ha were discarded. Selection of patches with a minimum size ensures that the resulting multifunctional areas produce a large number of ESS [37] and can be properly managed.
Finally, from the remaining patches, those adjacent to a corridor or a core area were selected in order to ensure that the multifunctional buffer zones can reduce CC impacts in GI core areas and corridors. The holes inside the multifunctional buffer zones and the gaps between them and the core areas or corridors were added to the multifunctional areas when they met the following conditions: The holes and gaps are smaller than 5 ha or they are bigger than 5 ha but they do not correspond to artificial land cover.

3. Results

3.1. Maps of ESS Provision Potential

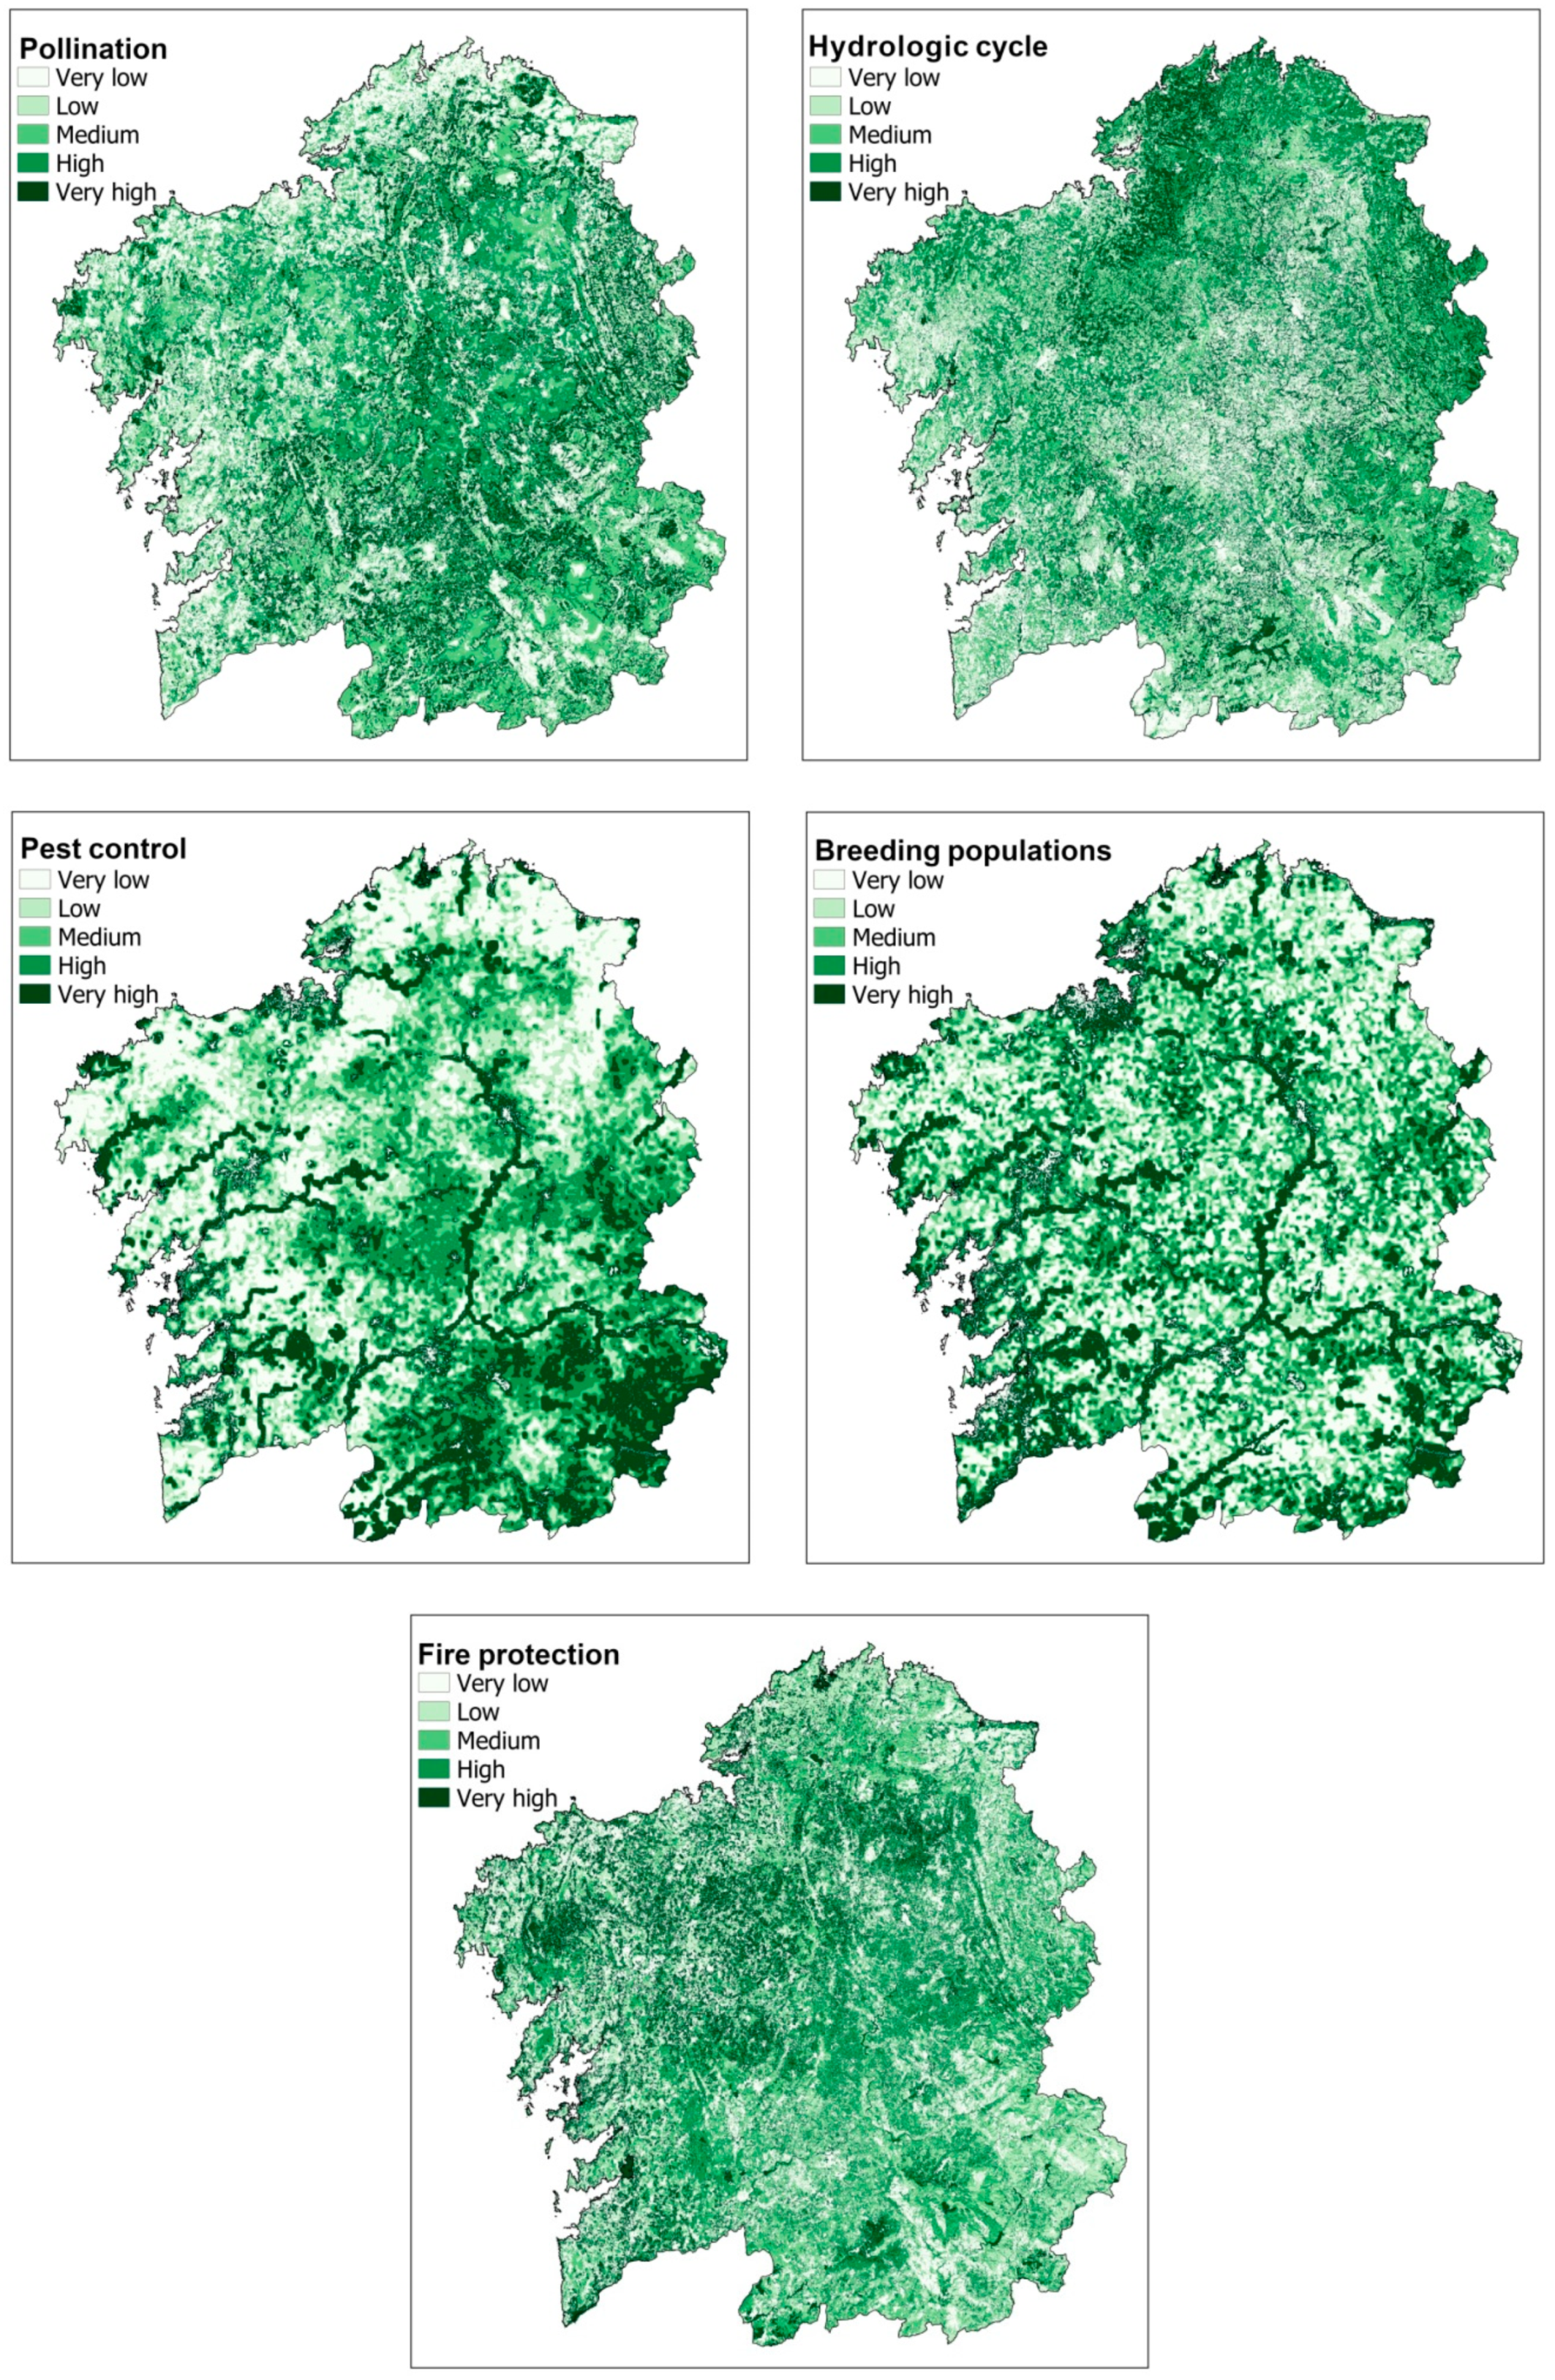
Mapping the ESS provision potential (as described above) produced the maps shown in Figure 2. The maps of the provision potential for other ESS considered for delineating the multifunctional buffer areas were provided by García et al. [57]. For a more detailed analysis of the results of the mapping, the SIOSE land cover maps were overlaid on the ESS provision potential maps in order to calculate the average provision potential of each land cover type by using the QGIS zonal statistics tool. This analysis produced information about which are the types of land cover with the highest potential to produce several ESS and thus provide clues on which should be included in the planned GI.
The top five types of land cover in terms of provision potential for each ESS are shown in Table 3. Forest was the land cover type with the highest provision potential for filtering pollutants, erosion control, hydrological flow regulation, and carbon capture. In the case of carbon capture, the forests with the highest provision potential were productive stands of fast-growing species. On the other hand, fire protection followed the opposite behavior and the types of land cover with the highest provision potential were those with lower biomass, such as agricultural land and rocky terrain. Regarding the maintenance of breeding populations and pest control, the types of land cover with the highest provision potential were very similar and were related to coastal areas and wetlands. We can see some inconsistencies in the ESS long-term carbon storage, as bare rock had a high potential. This is due to the low resolution used for the cartography of bogs, which have a very high provision potential for this ESS and are usually located in depressions on mountain tops, where rocky outcrops are frequent. Afforested land also had a high ESS provision potential, which may be due to eucalyptus plantations encroaching on these bogs. Finally, the land cover types with the highest potential for provision of pollination-related ESS were those that provide more nesting sites for bees. These are namely: bare land where nests can be dug, rocks and trunks with cavities, and beehives (in urban areas).
The maps in Figure 2 were used to produce a suitability map for delineating the multifunctional buffer zones, so that they met the objective of maximum ESS provision. As explained in the previous section, this suitability (or average ESS provision potential) was obtained by adding all the normalized ESS provision potential maps and dividing the result by the number of ESS. As in the case of each individual ESS, the resulting average ESS provision potential map was overlaid with the land cover polygons of SIOSE 2014 to extract the average provision potential value for each land cover type. The top three land cover types with the highest average provision potential (Table 4) were native deciduous forest, followed by mixed forest and productive forest. Wetland also displayed a high average provision potential. The land cover type with the highest potential after forests and wetlands was shrubland.

3.2. Delineation of Multifunctional Buffer Zones

Multifunctional buffer zones were delineated according to the methodology explained in previous sections, producing the map presented in Figure 3.
The multifunctional buffer zones delimited are quite irregular, and thus the edge they share with corridors and core areas of the GI is rather limited. This can be seen by calculating the ratio of the edge shared between multifunctional buffer areas and other GI by the total edge of the multifunctional buffer zones, which is 7.1%.
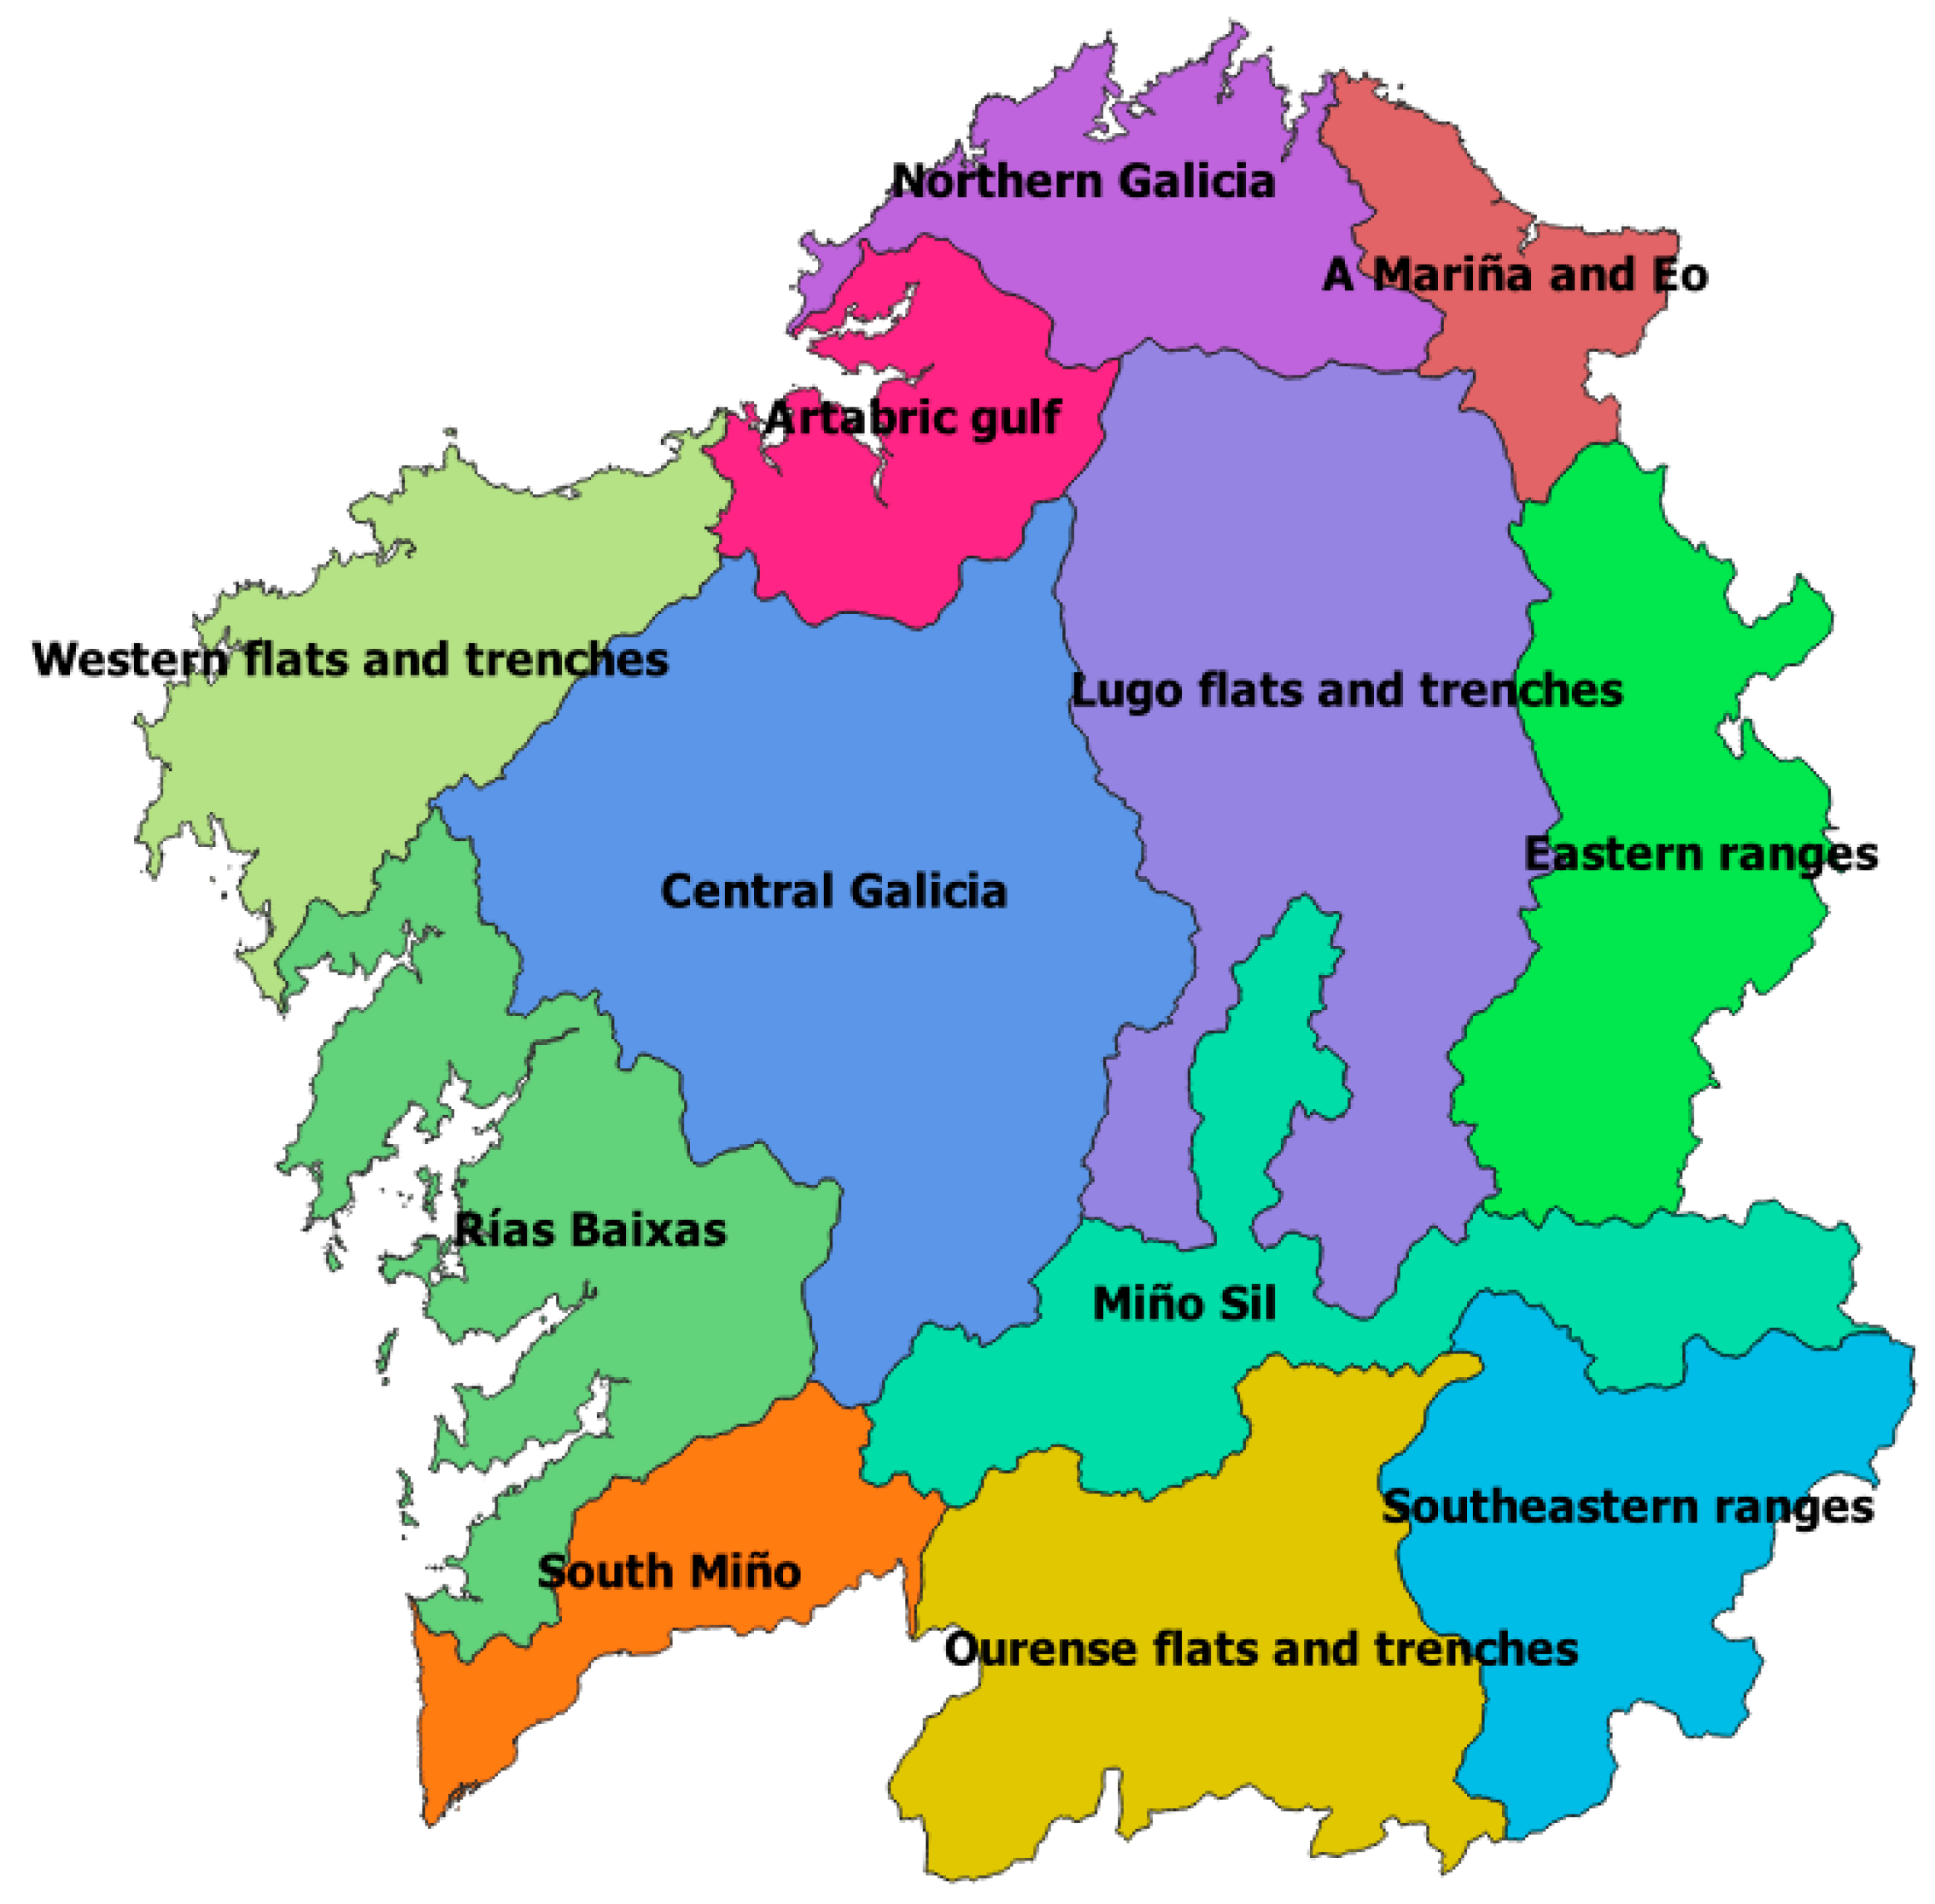
The irregularity and low adjacency were influenced by the heterogeneous landscape of the region, which is highly fragmented. To demonstrate this, the study area was split into uniform landscape areas considering the 12 Great Landscape Areas of Galicia (Figure 4) defined in the Galician Landscapes Catalogue [78]. The heterogeneity of the landscape in each Great Landscape Area was estimated by calculating the edge density (ED) of the SIOSE land cover types in each area with FRAGSTATS [76]. The irregularity of the delimited multifunctional buffer areas within each landscape area was then measured by calculating the mean fractal dimension (FRAC_MN) with FRAGSTATS [76] (Table 5). The correlation between the ED and the FRAC_MN was calculated with the Spearman index, yielding a value of ρ = 0.69, indicating a high correlation.
From the map in Figure 3, it can be seen that despite the irregularity of the multifunctional areas, in most cases, the methodology successfully delimited zones close to core areas and corridors, where the ESS are required.
In order to test that the delimited multifunctional buffer zones meet the requirements of having a high potential for producing several ESS, the average ESS provision potential was calculated in the areas of the GI and outside the GI. Comparison of the average ESS provision potential in the GI areas and the rest of the region showed that the average ESS provision potential in delimited multifunctional buffer zones was higher (Table 6).
More detailed analysis of the average provision potential for the ESS considered in each GI area (Table 7) showed that most of the ESS have a higher average provision potential in the delimited multifunctional buffer zones than in the other areas of the GI. This is not the case for breeding populations, pest control, or long-term carbon storage. These 3 ESS were found to be closely correlated with biodiversity. For long-term carbon storage, the highest provision potential corresponded to bogs and wetland, both of which host high biodiversity values. As core areas and corridors were delimited by taking into account priority habitats and biodiversity values, it is not surprising that the average provision potential was higher for these ESS. Nonetheless, the average provision potential of these three ESS in multifunctional buffer areas was higher than for areas outside GI, except for long-term carbon storage, for which similar values were obtained.
For fire protection, the average provision potential was similar in GI areas and areas outside GI. Nevertheless, provision of this ESS was related to low biomass land cover types, while the provision of other ESS was mainly related to forest land (see previous section). Therefore, there is a trade-off between provision of fire protection and provision of most of the other ESS. This may explain why the provision potential values for this ecosystem service in the delimited multifunctional buffer zones are not much higher than in other areas. Thus, the selected areas maximize the provision potential of most ESS related to forest areas (Table 8) and these areas have a low provision potential for fire protection.
Given the aforementioned results, it is proven that the consideration of the average ESS provision potential as a suitability layer ensured that the delimited multifunctional areas have a high potential for providing several ESS.
Landscape fragmentation also represents a challenge in relation to ensuring that a certain amount of land is delimited as multifunctional zones. This is because fragmentation leads to the selection of many small and disperse suitable patches that do not meet the criteria of minimum surface or adjacency to core areas and corridors. When these patches were excluded, the assigned area was thus significantly reduced. As seen in Table 9, the percentage of multifunctional areas relative to the total area of the region was much lower than the initially selected 20% of cells with the highest average provision potential value for the ESS considered.

4. Conclusions

The proposed methodology successfully delimited multifunctional zones in GI with a high potential to provide ESS that contribute to counteracting the consequences of CC in areas with high biodiversity and natural values. The use of land cover as a proxy for mapping the ESS provision potential facilitates identification of the types of land cover with the highest potential to provide ecosystem services. Furthermore, combining several ESS provision potential maps in a suitability map to delimit GI not only ensures the GI multifunctionality, but also further aids identification of the types of land cover with the highest potential to provide several ESS.
However, application of the methodology in Galicia has shown that complex landscape patterns produce irregular GI areas and faces challenges in relation to delineating the minimum surface area. On the other hand, by identifying the types of land cover with a high potential to provide several ESS, planners can obtain an idea of how to fine-tune the results of the delimitation. Therefore, the boundaries of the delimited areas can be adjusted to include land cover types with high potential to provide ESS and exclude those with a lower potential, thus ensuring that the GI is close to areas where there is a demand for the ESS it produces.
Trade-offs between ecosystem services occur, and although an area may have a high potential to produce several ESS, it may also have a low potential to produce others. In this case, using land cover as a proxy may hamper the identification of areas with a high potential to provide several ESS. For example, although forests have a high potential to capture carbon, filter pollutants, and regulate hydrological cycle, they do not have high potential for fire prevention. Nevertheless, irregular and mixed landscapes of forests and fields may have a high potential to prevent fires while producing other ESS more closely linked to forests. In addition, landscape patterns can also create synergies or trade-offs among ESS and either increase or reduce their provision potential or increase the provision of ESS in areas close to zones of demand [28,36]. Qiu and Turner [37] suggest delimiting areas that are large enough to comprise spatial heterogeneity and reduce trade-offs. Similarily, Walz et al. [79] suggest that landscape units should be used to delimit GI multifunctional areas.
Bearing all of the above in mind, future methodologies should explore the potential of including landscape structure in ESS mapping, mainly in those cases where the ecosystem service is not clearly linked to a particular land cover type [36]. In this regard, tier III methods, as defined in Maes et al. [29] (which rely on a regression model to link data from a statistical survey with spatial variables), will be more efficient for analyzing the relationship between landscape pattern or landscape units and ecosystem service provision potential. However, these methodologies require input of large amounts of data.
Another possible way of improving methodologies for the spatial planning of GI is to delineate landscape units and identify those with the highest potential to provide several ESS. This would reduce the influence of landscape heterogeneity on the results of the GI zoning and thus produce more regular delimited areas.
Author Contributions

Conceptualization, A.M.G. and I.S.; methodology, A.M.G., X.L., and I.S.; formal analysis, A.M.G. and X.L.; data curation, A.M.G. and X.L.; writing, A.M.G. and I.S.; project administration, I.S. and D.M.; funding acquisition, D.M. and I.S. All authors have read and agreed to the published version of the manuscript.

Funding

This research was funded by Fundación Biodiversidad of the Spanish Ministry of Ecological Transition, project title “INVERCLIMA—Infraestructura Verde para la adaptación de la ordenación territorial al cambio climático”.

Conflicts of Interest

The authors declare no conflict of interest.

References

  1. Barros, V.R.; Field, C.B.; Dokken, D.J.; Mastrandrea, M.D.; Mach, K.J.; Bilir, T.E.; Chatterjee, M.; Ebi, K.L.; Estrada, Y.O.; Genova, R.C.; et al. IPCC Climate Change 2014: Impacts, Adaptation, and Vulnerability. Part B: Regional Aspects. Contribution of Working Group II to the Fifth Assessment Report of the Intergovernmental Panel on Climate Change; Cambridge University Press: Cambridge, UK, 2014. [Google Scholar]
  2. European Commission Communication of the Commission to the European Parliament, the Council, the European Economic and Social Committeee and the Committee of the Regions. EU Biodiversity Strategy for 2030: Bringing Nature Back into Our Lives 2020. Available online: https://ec.europa.eu/transparency/regdoc/rep/1/2020/EN/COM-2020-380-3-EN-MAIN-PART-1.PDF (accessed on 25 November 2020).
  3. Naumann, S.; Anzaldua, G.; Berry, P.; Burch, S.; McKenna, D.; Frelih-Larsen, A.; Gerdes, H.; Sanders, M. Assessment of the Potential of Ecosystem-Based Approaches to Climate Change Adaptation and Mitigation in Europe. Final report to the European Commission, DG Environment, Contract No. 070307/2010/580412/SER/B2, Ecologic institute and Environmental Change Institute, Oxford University Centre for the Environment. 2011. Available online: https://ec.europa.eu/environment/nature/climatechange/pdf/EbA_EBM_CC_FinalReport.pdf (accessed on 16 December 2020).
  4. European Commission Communication of the Commission to the European Parliament, the Council, the European Economica and Social Committee and the Committee of the Regions: Green Infrastructure (GI) —Enhancing Europe’s Natural Capital 2013. Available online: https://eur-lex.europa.eu/resource.html?uri=cellar:d41348f2-01d5-4abe-b817-4c73e6f1b2df.0014.03/DOC_1&format=PDF (accessed on 25 November 2020).
  5. Rosenberg, E. Public Works and Public Space: Rethinking the Urban Park. J. Archit. Educ. 1996, 50, 89–103. [Google Scholar] [CrossRef]
  6. Benedict, M.A.; McMahon, E. Green Infrastructure: Linking Landscapes and Communities; Island Press: Washington, DC, USA, 2006; ISBN 978-1-59726-027-5. [Google Scholar]
  7. Wright, H. Understanding green infrastructure: The development of a contested concept in England. Local Environ. 2011, 16, 1003–1019. [Google Scholar] [CrossRef]
  8. Benedict, M.A.; McMahon, E.T. Green infrastructure: Smart conservation for the 21st Century. Renew. Resour. J. 2002, 20, 12–17. [Google Scholar]
  9. DB Advisors. Economic Stimulus: The Case of “Green” Infrastructure, Energy Security and “Green” Jobs. Available online: http://www.dbadvisors.com/content/_media/1113_GreenEconomicEstimulus.pdf (accessed on 5 May 2010).
  10. Plymouth City Council. Plymouth’s Green Infrastructure Delivery Plan 2010. Available online: https://www.plymouth.gov.uk/sites/default/files/GreenInfrastructurePlan.pdf (accessed on 24 November 2020).
  11. Tzoulas, K.; Korpela, K.; Venn, S.; Yli-Pelkonen, V.; Kaźmierczak, A.; Niemelä, J.; James, P. Promoting ecosystem and human health in urban areas using Green Infrastructure: A literature review. Landsc. Urban Plan. 2007, 81, 167–178. [Google Scholar] [CrossRef] [Green Version]
  12. Aguilera, F.; Valenzuela, L.M.; Botequilha-Leitão, A. Landscape metrics in the analysis of urban land use patterns: A case study in a Spanish metropolitan area. Landsc. Urban Plan. 2011, 99, 226–238. [Google Scholar] [CrossRef]
  13. Ahern, J. Green infrastructure for cities: The spatial dimention. In Cities of the Future: Towards Integrated Sustainable Water and Landscape Management; Novotny, V., Brown, P., Eds.; IWA Publishing: London, UK, 2007; pp. 267–283. [Google Scholar]
  14. Kambites, C.; Owen, S. Renewed prospects for green infrastructure planning in the UK 1. Plan. Pr. Res. 2006, 21, 483–496. [Google Scholar] [CrossRef]
  15. ECOTEC. City Region Green Infrastructure Strategic Planning: Raising the Quality of the North’s City Regions. Available online: http://www.thenorthernway.co.uk/downloaddoc.asp?id=545 (accessed on 29 May 2010).
  16. Collinge, G. Valuing green infrastructure: Developing a toolbox. In Presentation at the Yorkshire Conference Series: Green Space, Green Belt and Green Infrastructure; Royal Town Planning Institute (RTPI): Leeds, UK, 2010. [Google Scholar]
  17. European Commission. Green Infrastructure and Climate Adaptation. Available online: https://ec.europa.eu/environment/nature/ecosystems/pdf/Green%20Infrastructure/GI_climate_adaptation.pdf (accessed on 24 November 2020).
  18. Mell, I.C. Can you tell a green field from a cold steel rail? Examining the “green” of Green Infrastructure development. Local Environ. 2013, 18, 152–166. [Google Scholar] [CrossRef]
  19. Mell, I.C.; Henneberry, J.; Hehl-Lange, S.; Keskin, B. Promoting urban greening: Valuing the development of green infrastructure investments in the urban core of Manchester, UK. Urban For. Urban Green. 2013, 12, 296–306. [Google Scholar] [CrossRef]
  20. Roy, S.; Byrne, J.; Pickering, C. A systematic quantitative review of urban tree benefits, costs, and assessment methods across cities in different climatic zones. Urban For. Urban Green. 2012, 11, 351–363. [Google Scholar] [CrossRef] [Green Version]
  21. Sussams, L.W.; Sheate, W.R.; Eales, R.P. Green infrastructure as a climate change adaptation policy intervention: Muddying the waters or clearing a path to a more secure future? J. Environ. Manag. 2015, 147, 184–193. [Google Scholar] [CrossRef]
  22. Matthews, T.; Lo, A.Y.; Byrne, J.A. Reconceptualizing green infrastructure for climate change adaptation: Barriers to adoption and drivers for uptake by spatial planners. Landsc. Urban Plan. 2015, 138, 155–163. [Google Scholar] [CrossRef]
  23. Snäll, T.; Lehtomäki, J.; Arponen, A.; Elith, J.; Moilanen, A. Green Infrastructure Design Based on Spatial Conservation Prioritization and Modeling of Biodiversity Features and Ecosystem Services. Environ. Manag. 2016, 57, 251–256. [Google Scholar] [CrossRef] [PubMed] [Green Version]
  24. Arkema, K.K.; Verutes, G.M.; Wood, S.A.; Clarke-Samuels, C.; Rosado, S.; Canto, M.; Rosenthal, A.; Ruckelshaus, M.; Guannel, G.; Toft, J.; et al. Embedding ecosystem services in coastal planning leads to better outcomes for people and nature. Proc. Natl. Acad. Sci. USA 2015, 112, 7390–7395. [Google Scholar] [CrossRef] [Green Version]
  25. Ruckelshaus, M.; McKenzie, E.; Tallis, H.; Guerry, A.; Daily, G.; Kareiva, P.; Polasky, S.; Ricketts, T.; Bhagabati, N.; Wood, S.A.; et al. Notes from the field: Lessons learned from using ecosystem service approaches to inform real-world decisions. Ecol. Econ. 2015, 115, 11–21. [Google Scholar] [CrossRef] [Green Version]
  26. Martínez-Harms, M.J.; Balvanera, P. Methods for mapping ecosystem service supply: A review. Int. J. Biodivers. Sci. Ecosyst. Serv. Manag. 2012, 8, 17–25. [Google Scholar] [CrossRef]
  27. Schägner, J.P.; Brander, L.; Maes, J.; Hartje, V. Mapping ecosystem services’ values: Current practice and future prospects. Ecosyst. Serv. 2013, 4, 33–46. [Google Scholar] [CrossRef] [Green Version]
  28. Mitchell, M.G.E.; Bennett, E.M.; Gonzalez, A. Strong and nonlinear effects of fragmentation on ecosystem service provision at multiple scales. Environ. Res. Lett. 2015, 10, 094014. [Google Scholar] [CrossRef]
  29. Maes, J.; Crossman, N.D.; Burkhard, B. Mapping ecosystem services. In Routledge Handbook of Ecosystem Services; Routledge: London, UK, 2016; pp. 188–204. [Google Scholar]
  30. De Groot, R.S.; Alkemade, R.; Braat, L.; Hein, L.; Willemen, L. Challenges in integrating the concept of ecosystem services and values in landscape planning, management and decision making. Ecol. Complex. 2010, 7, 260–272. [Google Scholar] [CrossRef]
  31. Portman, M.E. Ecosystem services in practice: Challenges to real world implementation of ecosystem services across multiple landscapes—A critical review. Appl. Geogr. 2013, 45, 185–192. [Google Scholar] [CrossRef]
  32. Demuzere, M.; Orru, K.; Heidrich, O.; Olazabal, E.; Geneletti, D.; Orru, H.; Bhave, A.G.; Mittal, N.; Feliu, E.; Faehnle, M. Mitigating and adapting to climate change: Multi-functional and multi-scale assessment of green urban infrastructure. J. Environ. Manag. 2014, 146, 107–115. [Google Scholar] [CrossRef]
  33. Geneletti, D.; Zardo, L. Ecosystem-based adaptation in cities: An analysis of European urban climate adaptation plans. Land Use Policy 2016, 50, 38–47. [Google Scholar] [CrossRef] [Green Version]
  34. Gill, S.E.; Handley, J.F.; Ennos, A.R.; Pauleit, S. Adapting Cities for Climate Change: The Role of the Green Infrastructure. Built Environ. 2007, 33, 115–133. [Google Scholar] [CrossRef] [Green Version]
  35. Kabisch, N.; Korn, H.; Stadler, J.; Bonn, A. Nature-Based Solutions to Climate Change Adaptation in Urban Areas: Linkages between Science, Policy and Practice; Theory and Practice of Urban Sustainability Transitions; Springer International Publishing: Cham, Switzerland, 2017; ISBN 978-3-319-53750-4. [Google Scholar]
  36. Mitchell, M.G.E.; Bennett, E.M.; Gonzalez, A. Forest fragments modulate the provision of multiple ecosystem services. J. Appl. Ecol. 2014, 51, 909–918. [Google Scholar] [CrossRef]
  37. Qiu, J.; Turner, M.G. Spatial interactions among ecosystem services in an urbanizing agricultural watershed. Proc. Natl. Acad. Sci. USA 2013, 110, 12149–12154. [Google Scholar] [CrossRef] [PubMed] [Green Version]
  38. Chang, Q.; Li, X.; Huang, X.; Wu, J. A GIS-based Green Infrastructure Planning for Sustainable Urban Land Use and Spatial Development. Procedia Environ. Sci. 2012, 12, 491–498. [Google Scholar] [CrossRef] [Green Version]
  39. Liu, Y.; Theller, L.O.; Pijanowski, B.C.; Engel, B.A. Optimal selection and placement of green infrastructure to reduce impacts of land use change and climate change on hydrology and water quality: An application to the Trail Creek Watershed, Indiana. Sci. Total Environ. 2016, 553, 149–163. [Google Scholar] [CrossRef] [PubMed]
  40. Kopperoinen, L.; Itkonen, P.; Niemelä, J. Using expert knowledge in combining green infrastructure and ecosystem services in land use planning: An insight into a new place-based methodology. Landsc. Ecol. 2014, 29, 1361–1375. [Google Scholar] [CrossRef]
  41. Dige, G.; Liquete, C.; Kleeschulte, S.; Banko, G.; European Environment Agency; European Topic Centre for Spatial Information and Analysis (ETC/SIA). Spatial Analysis of Green Infrastructure in Europe; Publications Office: Luxembourg, 2014; ISBN 978-92-9213-421-1. [Google Scholar]
  42. Liquete, C.; Kleeschulte, S.; Dige, G.; Maes, J.; Grizzetti, B.; Olah, B.; Zulian, G. Mapping green infrastructure based on ecosystem services and ecological networks: A Pan-European case study. Environ. Sci. Policy 2015, 54, 268–280. [Google Scholar] [CrossRef]
  43. Hu, H.; Fu, B.; Lü, Y.; Zheng, Z. SAORES: A spatially explicit assessment and optimization tool for regional ecosystem services. Landsc. Ecol. 2015, 30, 547–560. [Google Scholar] [CrossRef] [Green Version]
  44. Vallecillo, S.; Polce, C.; Barbosa, A.; Castillo, C.P.; Vandecasteele, I.; Rusch, G.M.; Maes, J. Spatial alternatives for Green Infrastructure planning across the EU: An ecosystem service perspective. Landsc. Urban Plan. 2018, 174, 41–54. [Google Scholar] [CrossRef]
  45. Schröter, M.; Remme, R.P. Spatial prioritisation for conserving ecosystem services: Comparing hotspots with heuristic optimisation. Landsc. Ecol. 2016, 31, 431–450. [Google Scholar] [CrossRef] [PubMed] [Green Version]
  46. Spanish Directorate General for Cadastre Cadastral Statistics. Technical Report; Ministry of Treasury and Economics: Madri, Spain, 2010.
  47. Spanish National Institute of Statistics Nomenclator. Available online: https://www.ine.es/nomen2/index.do (accessed on 15 December 2020).
  48. Spanish National Geographic Institute. Database of Administrative Divisions of Spain. Available online: https://datos.gob.es/gl/catalogo/e00125901-spaignllm (accessed on 15 December 2020).
  49. Corbelle-Rico, E.; Crecente-Maseda, R. Urbanización, forestación e abandono. Cambios recentes na paisaxe de Galicia, 1985–2005. Revista Galega de Economía 2014, 23, 35–52. [Google Scholar] [CrossRef] [Green Version]
  50. Bas López, S.; Guitián Rivera, J.; Sobral, M. Biodiversidad en plantaciones de eucalipto y en robledales del sur de Galicia: Plantas y aves. Nova Acta Científica Compostelana Bioloxía 2018, 25, 71–81. [Google Scholar]
  51. Macías, F.; Calvo de Anta, R.; Rodríguez Lado, L.; Verde, R.; Pena Pérez, X.; Camps Arbestain, M. El sumidero de carbono de los suelos de Galicia. Edafología 2004, 11, 341–376. [Google Scholar]
  52. Álvarez, V.; Taboada, J.; Lorenzo, M. Cambio climático en Galicia en el siglo XXI: Tendencias y variabilidad en temperaturas y precipitaciones. Revista Avances en Ciencias de la Tierra 2011, 2, 65–85. [Google Scholar]
  53. Barreal, J.; Loureiro, M.L.; Picos, J. Estudio de la causalidad de los incendios forestales en Galicia. Economía Agraria y Recursos Naturales 2012, 12, 99–114. [Google Scholar] [CrossRef] [Green Version]
  54. Haines-Young, R.; Potschin, M.B. Common International Classification of Ecosystem Services (CICES) V5.1 and Guidance on the Application of the Revised Structure; European Environemnt Agency: Copenhaguen, Denmark, 2018. [Google Scholar]
  55. Martínez Cortizas, A.; Pérez Alberti, A. Atlas climático de Galicia; Xunta de Galicia: Santiago de Compostela, Spain, 1999.
  56. Rodríguez Martín, J.A.; López Arias, M.; Grau Corbí, J.M. Metales Pesados, Materia Orgánica y Otros Parámetros de Los Suelos Agrícolas y Pastos de España; Instituto Nacional de Investigación y Tecnología Agraria y Alimentaria, Ministerio de Medio Ambiente y Medio Rural y Marino: Madrid, Spain, 2009; ISBN 978-84-491-0980-5. [Google Scholar]
  57. García, A.M.; Santé, I.; Loureiro, X.; Miranda, D. Green infrastructure spatial planning considering ecosystem services assessment and trade-off analysis. Application at landscape scale in Galicia region (NW Spain). Ecosyst. Serv. 2020, 43, 101115. [Google Scholar] [CrossRef]
  58. Nedkov, S.; Burkhard, B. Flood regulating ecosystem services—Mapping supply and demand, in the Etropole municipality, Bulgaria. Ecol. Indic. 2012, 21, 67–79. [Google Scholar] [CrossRef]
  59. Burkhard, B.; Kroll, F.; Müller, F.; Windhorst, W. Landscapes‘ Capacities to Provide Ecosystem Services—A Concept for Land-Cover Based Assessments. Landsc. Online 2010, 15, 1–22. [Google Scholar] [CrossRef]
  60. Sørensen, R.; Zinko, U.; Seibert, J. On the calculation of the topographic wetness index: Evaluation of different methods based on field observations. Hydrol. Earth Syst. Sci. 2006, 10, 101–112. [Google Scholar] [CrossRef] [Green Version]
  61. Fernandes, P.M. Fire-smart management of forest landscapes in the Mediterranean basin under global change. Landsc. Urban Plan. 2013, 110, 175–182. [Google Scholar] [CrossRef] [Green Version]
  62. Proença, V.; Pereira, H.M.; Vicente, L. Resistance to wildfire and early regeneration in natural broadleaved forest and pine plantation. Acta Oecologica 2010, 36, 626–633. [Google Scholar] [CrossRef]
  63. González, J.R.; Palahí, M.; Trasobares, A.; Pukkala, T. A fire probability model for forest stands in Catalonia (north-east Spain). Ann. For. Sci. 2006, 63, 169–176. [Google Scholar] [CrossRef]
  64. Makowski, K.; Jaeger, E.B.; Chiacchio, M.; Wild, M.; Ewen, T.; Ohmura, A. On the relationship between diurnal temperature range and surface solar radiation in Europe. J. Geophys. Res. Atmos. 2009, 114. [Google Scholar] [CrossRef] [Green Version]
  65. Creed, I.F.; Sass, G.Z. Digital Terrain Analysis Approaches for Tracking Hydrological and Biogeochemical Pathways and Processes in Forested Landscapes. In Forest Hydrology and Biogeochemistry; Levia, D.F., Carlyle-Moses, D., Tanaka, T., Eds.; Ecological Studies Volume 216; Springer: Dordrecht, The Netherlands, 2011; pp. 69–100. ISBN 978-94-007-1362-8. [Google Scholar]
  66. Chuvieco, E.; Aguado, I.; Yebra, M.; Nieto, H.; Salas, J.; Martín, M.P.; Vilar, L.; Martínez, J.; Martín, S.; Ibarra, P.; et al. Development of a framework for fire risk assessment using remote sensing and geographic information system technologies. Ecol. Model. 2010, 221, 46–58. [Google Scholar] [CrossRef]
  67. Pollinator Abundance: Crop Pollination (INVEST). Available online: http://releases.naturalcapitalproject.org/invest-userguide/latest/croppollination.html (accessed on 24 November 2020).
  68. Greenleaf, S.S.; Williams, N.M.; Winfree, R.; Kremen, C. Bee foraging ranges and their relationship to body size. Oecologia 2007, 153, 589–596. [Google Scholar] [CrossRef]
  69. Grundel, R.; Jean, R.P.; Frohnapple, K.J.; Glowacki, G.A.; Scott, P.E.; Pavlovic, N.B. Floral and nesting resources, habitat structure, and fire influence bee distribution across an open-forest gradient. Ecol. Appl. 2010, 20, 1678–1692. [Google Scholar] [CrossRef]
  70. Carré, G.; Roche, P.; Chifflet, R.; Morison, N.; Bommarco, R.; Harrison-Cripps, J.; Krewenka, K.; Potts, S.G.; Roberts, S.P.M.; Rodet, G.; et al. Landscape context and habitat type as drivers of bee diversity in European annual crops. Agric. Ecosyst. Environ. 2009, 133, 40–47. [Google Scholar] [CrossRef]
  71. Potts, S.G.; Vulliamy, B.; Roberts, S.; O’Toole, C.; Dafni, A.; Ne’eman, G.; Willmer, P. Role of nesting resources in organising diverse bee communities in a Mediterranean landscape. Ecol. Entomol. 2005, 30, 78–85. [Google Scholar] [CrossRef]
  72. Olivero, J.; Toxopeus, A.G.; Skidmore, A.K.; Real, R. Testing the efficacy of downscaling in species distribution modelling: A comparison between MaxEnt and Favourability Function models. Anim. Biodivers. Conserv. 2016, 39, 99–114. [Google Scholar] [CrossRef]
  73. Keil, P.; Belmaker, J.; Wilson, A.M.; Unitt, P.; Jetz, W. Downscaling of species distribution models: A hierarchical approach. Methods Ecol. Evol. 2013, 4, 82–94. [Google Scholar] [CrossRef]
  74. Keil, P.; Jetz, W. Downscaling the environmental associations and spatial patterns of species richness. Ecol. Appl. 2014, 24, 823–831. [Google Scholar] [CrossRef] [PubMed]
  75. Consul, P.C.; Famoye, F. Generalized poisson regression model. Commun. Stat. Theory Methods 1992, 21, 89–109. [Google Scholar] [CrossRef]
  76. McGarigal, K.; Cushman, S.A.; Neel, M.C.; Ene, E. FRAGSTATS: Spatial Pattern Analysis Program for Categorical Maps. 2002. Available online: https://www.umass.edu/landeco/research/fragstats/documents/fragstats.help.4.2.pdf (accessed on 25 November 2020).
  77. Civantos, E.; Thuiller, W.; Maiorano, L.; Guisan, A.; Araújo, M.B. Potential Impacts of Climate Change on Ecosystem Services in Europe: The Case of Pest Control by Vertebrates. BioScience 2012, 62, 658–666. [Google Scholar] [CrossRef] [Green Version]
  78. Xunta de Galicia, Consellaría de Medio Ambiente, Territorio e Vivenda. Catálogo das Paisaxes de Galicia. Available online: https://cmatv.xunta.gal/seccion-organizacion/c/CMAOT_Instituto_Estudos_Territorio?content=Direccion_Xeral_Sostibilidade_Paisaxe/Catalogo_paisaxe_galicia/seccion.html&std=Descarga.html (accessed on 24 November 2020).
  79. Walz, U.; Syrbe, R.-U.; Grunewald, K. Where to map? In Mapping Ecosystem Services; Burkhard, B., Maes, J., Eds.; Pensoft Publishers: Sofia, Bulgaria, 2017; pp. 159–165. ISBN 978-954-642-829-5. [Google Scholar]
Figure 1. Location of the study area.
Sustainability 12 10525 g001
Figure 2. Maps of ESS provision potential produced by the proposed methodology. The values of the provision potential range from 0 to 1. Each category of the legend corresponds to a quintile of this range. Maps of the provision potential for other ESS considered for the delineation of multifunctional buffer areas are presented in García et al. [57].
Sustainability 12 10525 g002
Figure 3. Core areas, corridors, and multifunctional areas.
Sustainability 12 10525 g003
Figure 4. Great landscape areas of Galicia according to the Galician Landscape Catalogue [78].
Sustainability 12 10525 g004
Table 1. Weights assigned to land cover types for calculating the provision potential of different ecosystem services (ESS).
Land Cover TypeFire ProtectionHydro. Cycle Reg.Pollination (RA)Pollination (HN)
Bare rock1001
Bodies of continental water 10.200
Bodies of salt water 10.200
Cliffs1001
Artificial land cover0001
Coniferous forest0.10.60.30
Crops & fields0.90.20.70.7
Crops0.90.20.31
Deciduous forest0.60.80.81
Eucalyptus plantations0.30.60.30
Eucalyptus & conif.0.10.60.40
Wetlands1100
Sport facilities0000
Shrub land0.60.410.3
Shrubs and trees0.10.40.80,5
Shrubs and rocks0.70.20.70.5
Mixed forests0.50.60.81
Crops & shrubs0.70.20.70.5
Crops & urban10.20.31
Crops & trees0.70.20.50.7
Fields0.90.210.5
Beaches1001
Afforested land0.20.20.30.5
Transportation inf.0000
Landfill0001
Vine yards & woody crops0.70.20.30.5
Mineral extraction sites0001
Burnt areas0001
Urban areas0001
Urban green areas0.70.20.80.5
Table 2. Aggregation of land cover types.
SIOSE 2014 Land Cover CategoriesGrouped Land Cover Type
Agriculture and urban, urban green areasSemi-natural areas
Bushes and treesShrubs with trees
Bush land, bushes and rocksShrubs
Sport facilities, transportation infrastructure, landfills, mineral extraction sites, urban areas, artificial land coverArtificial land cover
Deciduous forest, mixed forestForests
Crops, vine yards and woody crops.Agriculture
Agriculture land and bushes, agriculture land and trees, fieldsLow intensity agriculture
Coniferous forests, eucalyptus plantations, mixed eucalyptus and coniferous forests, forested land.Productive forest
Continental water bodies, salt water bodies, wetlandsWetland
Bare rock, cliffs, beaches, burnt areasBarren land
Table 3. Average ESS provision potential of Spanish Information System on Land Occupation (SIOSE) land cover types.
ESS: FiltrationESS: Erosion
Land Cover TypeAvg. Provision pot.Land Cover TypeAvg. Provision pot.
Deciduous forest0.55Mixed forest0.91
Mixed forest0.53Deciduous forest0.90
Shrubs and trees0.42Eucalyptus plantations0.84
Eucalyptus & conif.0.42Eucalyptus & conif.0.83
Eucalyptus plantations0.42Coniferous forest0.81
ESS: Hydrological cycle reg.ESS: Carbon capture
Land cover typeAvg. provision pot.Land cover typeAvg. provision pot.
Wetland0.64Eucalyptus plantations0.93
Beaches0.54Afforested land0.62
Deciduous forest0.52Eucalyptus & conif.0.62
Eucalyptus plantations0.44Mixed forest0.45
Mixed forests0.43Coniferous forest0.29
ESS: Fire protectionESS: Pollination
Land cover typeAvg. provision pot.Land cover typeAvg. provision pot.
Crops & urban0.94Bare rock0.59
Bare rock0.94Deciduous forests0.52
Crops0.93Crops0.49
Wetlands0.93Mixed forests0.48
Crops & fields0.92Crops & urban0.45
ESS: Long-term carbon storageESS: Short-term carbon storage
Land cover typeAvg. provision pot.Land coverAvg. provision pot.
Wetland0.69Deciduous forest0.79
Bodies of salt water 0.52Wetland0.48
Bare rock0.36Coniferous forest0.43
Shrubs and rocks0.33Mixed forest0.42
Afforested land0.32Shrubs and rocks0.42
ESS: Breeding populationsESS: Pest control
Land cover typeAvg. provision pot.Land coverAvg. provision pot.
Bodies of continental water 0.81Wetland0.74
Bodies of salt water 0.81Bodies of salt water 0.73
Wetland0.81Bodies of continental water 0.71
Crops & urban0.80Bare rock0.67
Beaches0.79Beaches0.67
Table 4. Average values of ESS provision potential for each land cover type.
Land Cover TypeAverage ESS Provision Potential
Deciduous forest0.551
Mixed forest0.526
Eucalyptus plantations0.464
Wetland0.445
Eucalyptus and coniferous0.440
Coniferous forest0.426
Shrubland0.423
Shrubs and trees0.404
Afforested land0.401
Table 5. Edge density of SIOSE land cover types and average fractal dimension of multifunctional buffer areas in each great landscape area.
Great Landscape AreaED SIOSE Land Cover TypesFRAC_MN Multifunctional Buffer Areas
Lugo flats and trenches118.21.18
Western flats and trenches100.021.14
Ourense flats and trenches 87.691.15
Central Galicia 113.061.16
Northern Galicia89.361.15
Artabric gulf116.881.16
A Mariña and Eo79.261.14
Miño Sil106.661.16
Rías Baixas114.231.18
Eastern ranges101.781.2
Southeastern ranges87.781.16
South Miño118.491.19
Table 6. Average ESS provision potential in each green infrastructure (GI) area and areas outside GI.
Average ESS Provision Potential
Core areas0.49
Corridors0.50
Multifunctional buffer zones0.59
Areas outside GI0.45
Table 7. Average provision potential of considered ESS in each GI area and areas outside GI.
Breeding PopulationsPest ControlLong-Term Carbon StorageFire Protection
Core areas0.780.640.340.88
Corridors0.780.650.340.89
Multifunctional buffer areas0.770.620.290.89
Areas outside GI0.750.610.290.89
Carbon captureHydrological cycleErosionFiltration
Core areas0.110.370.660.34
Corridors0.130.390.680.37
Multifunctional buffer areas0.270.450.920.49
Areas outside GI0.190.340.610.27
PollinationShort-term carbon storage
Core areas0.350.42
Corridors0.360.46
Multifunctional buffer areas0.540.63
Areas outside GI0.290.27
Table 8. Percentage cover by the five most frequent land cover types in the delimited multifunctional buffer zones.
% Cover in Multifunctional Buffer Zones
Deciduous forest47.87%
Mixed forest41.49%
Shrubland4.8%
Crops and fields1.08%
Crops0.89%
Table 9. Area of the GI zones delineated and the percentage of area that they cover relative to the total.
ZoneArea (ha)Area (%)
Core areas358,89512.14
Corridors263,2548.90
Multifunctional zones116,7423.95
Total GI738,89124.99
Galicia2,957,127100
Publisher’s Note: MDPI stays neutral with regard to jurisdictional claims in published maps and institutional affiliations.