1. Introduction
Green infrastructure is often seen as a common strategy to increase urban green areas through the construction of natural and semi-natural environments [
1]. Green roofs and green wall systems are some of these strategies to promote a set of ecosystem services providing environmental, economic and social benefits through natural solutions [
2,
3,
4]. Among the ecosystem services, green roofs and green wall systems can provide regulation services (e.g., local climate regulation [
5,
6], air quality improvement, etc. [
7]), provisioning services (e.g., food - urban agriculture and ornamental resources), habitat services (e.g., suitable living spaces for wild plants and animals) and cultural services (e.g., aesthetic improvement and recreational spaces), among others [
3]. In addition, these solutions provide several other social, economic and environmental benefits at public and private level [
2,
8].
However, despite the several socio-environmental benefits of green roofs and green walls [
2,
9,
10,
11], these solutions are still underused on an urban scale. The reason is that the high costs associated with installation and maintenance make them unattractive to the building owner. Overall, from a financial perspective, the investor and/or owner will negatively evaluate these types of solutions. On the other hand, from an economic perspective, these solutions may provide added value, but many benefits are difficult to quantify and therefore are not easily monetized [
2,
4,
12] to feed in cost–benefit analysis.
In this regard, many cities have developed forms of incentives to promote green infrastructure to reduce part of the private investor’ costs [
13], and thus, stimulate the increase of green areas in urban centers to promote public benefits at the urban level. Nevertheless, many cities, countries or regions do not have specific incentive policies for the promotion of green infrastructure solutions. In these cases, alternative ways of quantifying green infrastructure benefits should be observed, considering other aspects, such as the building occupancy activity.
Youth hostels are alternative lodgings that, in general, are cheaper than hotels and combine accommodation services with a youthful and friendly atmosphere [
14,
15]. This market segment has grown rapidly in recent years and become an important economic activity in the tourism industry [
15]. Due to the specificities of youth hostels, such as spaces for integration and socialization among guests, creating a comfortable environment through green infrastructure installation could influence potential clients when choosing a hosting location.
The objective of this paper is to evaluate users’ views regarding green roofs and green walls in youth hostels and the influence of these solutions in the decision-making process to select a hosting location, the willingness to pay, and the potential effects on the individual well-being. Additionally, the analyses and recommendations can be a supporting tool for managers and owners when choosing investment opportunities to attract new clients, and therefore cover this knowledge gap within an ever-changing and demanding market.
This paper is organized into five sections.
Section 1 includes the introduction, present the paper motivations, and identify relevant theories to support the research through literature review.
Section 2 presents the research approach and methodology applied in the data analysis. Results are shown in
Section 3 and discussed in
Section 4. The main conclusions are indicated in
Section 5.
1.1. Tourism and Hospitality Industry in Times of COVID-19
Travel and Tourism Sector impact accounted for 10.3% of global GDP, moving 8.9 trillion dollars in 2019 [
16]. In Portugal, the sector injected 16.6 million euros into the national economy, which represented 14.6% of national GDP in 2018 [
17,
18]. In the context of tourism accommodation sector, in 2018, Portugal had 6868 establishments in operation, including hotel activity, tourism in rural areas and lodging tourism, camping sites, local accommodation and youth hostels [
17].
The COVID-19 pandemic had an impact on international tourism resulting in a significant reduction in the demand. The tourism and hospitality industry may have been the sector most affected due to travel restrictions made by several countries. However, predicting the real impact in the tourism industry worldwide remains highly uncertain, and the effects will be determined in the long term [
19,
20].
The tourism sector recovery from COVID-19 crisis will require a combined approach between governments and private sectors. Promoting economic stimulus packages with comprehensive tourism recovery plans aimed at restoring traveler confidence can be the key to an effective recovery [
20]. Moreover, private sector initiatives such as the application of new health, safety and hygienic protocols can help restore traveler confidence as well as promoting sustainable practices.
Tourism contributes significantly to environmental degradation mainly at the local level [
21]. In this regard, within the benchmarking of the tourism and hospitality industry, sustainable practices are an alternative which can improve competitiveness and attract new travelers [
22]. However, sustainable tourism development requires broad participation of all stakeholders, monitoring, and reducing impacts that contribute significantly to environmental degradation in a continuous process of assessment [
23,
24]. Incorporating eco-solutions such as green infrastructure can be a complementary part of preventive and corrective measures for achieving sustainability in this sector and consequently an attractiveness differential.
1.2. Green Infrastructure and Human Health
According to the World Health Organization (1946) [
25], “health is a state of complete physical, mental and social well-being and not merely the absence of disease or infirmity.” Studies have demonstrated that close contact with nature (natural or constructed environments) may positively affect human health via multiple pathways, promotes peaceful feelings, well-being, encourages thinking and reflecting, reduces anxiety and the risk of illnesses involving chronic stress [
26,
27,
28,
29].
In recent years, the concept of biophilic design based on the biophilia hypothesis developed by Edward O. Wilson (1984) [
30], received increasing attention by architects, designers, psychologists and social scientists [
31,
32]. According to the biophilia hypothesis, human beings have an innate tendency to connect with nature which plays a key role in human physical and mental wellbeing [
30]. Biophilic values can be highly variable and subjective from person to person. Biophilic tendencies may remain latent or manifest, depending on the external stimulus, which explains the different human inclination to natural environments [
33]. Biophilic design, therefore, is an attempt to bring nature into the built environment. Green infrastructure solutions are alternative solutions that fulfil this human need for exposure to nature creating new patterns of nature connections [
32].
The human connection with nature is affected by several factors including the environmental background [
34,
35,
36,
37], gender—supported by the gender socialization and identity theory [
38,
39,
40] and other elements that condition human behavior.
Studies about physical and psychological effects caused by green infrastructure are focused especially on urban parks and forests or other similar infrastructure types [
26,
28,
41,
42,
43,
44]. Regarding green roofs and green walls, few serious studies have shown potential psychological benefits to human beings, providing restorative, sensory experiences, and other positive feelings that contribute to reduce stress and improve human health [
29,
45,
46,
47,
48,
49,
50].
In the hospitality sector, decision-making process to select the most appropriate accommodation to stay is influenced by several different factors, such as attractive prices and location, but also several specific requirements that depend on the individual background [
51,
52,
53]. In this regard, biophilic design can be a market strategy to distinguish from other lodging places [
54] and therefore, attract new clients. However, there is a lack of studies on the effects of green infrastructure in the hospitality industry, especially low-cost lodging such as youth hostels. This paper is an attempt to narrow this knowledge gap.
2. Materials and Methods
2.1. Structuring the Problem
Green infrastructure is an alternative solution for adapting cities to climate change. Green roofs and green walls bring numerous economic and socio-environmental benefits, however, at the private level, the cost–benefit analysis of these solutions is generally negative. In this context, directing the quantification of benefits according to the specificities of each case may be a viable solution for promoting green infrastructure at the urban level. This study focuses on the assessment of the youth hostel user’s opinion regarding green roofs and green walls and the influence of these solutions in the decision-making process for the choice of the hosting location.
2.2. Case Study and Sampling
The survey was conducted during the summer of 2019 in different youth hostels located in Lisbon, Portugal. The local climate condition is typically Mediterranean climate (Csa) with hot and dry summers and relatively mild winters according to the Köppen–Geiger climate classification system. The questionnaires were applicated in five different hostels. A total of 352 questionnaires were collected and evaluated to identify incoherent questionnaires. Finally, the sample used in the study consisted of 345 valid respondents.
2.3. Questionnaire Development
To measure the respondents’ preferences and views regarding green roofs and green walls, a structured questionnaire was applied [
46,
48]. Voluntary participation and privacy assurances were made before the participants agreed to answer the questionnaire. The questionnaire was carried out between August and October 2019. The questionnaire was designed in three sections regarding sociodemographic characteristics (first section), respondents’ views (second section) and preferred green infrastructure typologies (third section) (
Table 1).
The first section was drawn up to obtain information about guest sociodemographic characteristics, such as occupation, age, gender, educational attainment, nationality, monthly income, childhood environmental background and present living environment. The second section consisted of twelve questions concerning personal views about potential benefits, disadvantages and respondents’ perceptions about green roofs and green walls installation in the youth hostel. The respondents were asked to indicate their degree of preference using a Likert-type scale, with responses ranging from “very unlikely” (1) to “very likely” (5). Where 1 is very unlikely, 2 is unlikely, 3 is neutral, 4 is likely, and 5 is very likely (12 items, Cronbach’s α = 0.66).
In the third section, five images were presented to the respondents: Inaccessible Green Roof; Accessible Green Roof; Indoor Living Wall; Outdoor Living Wall and Green Façade. Participants were asked to rank on an attractiveness scale from the first, most preferred (1st), to the fifth, least preferred (5th).
2.4. Data Analysis
Data were compiled and organized using Microsoft Excel. Inconsistent data were discarded before conducting the statistical analyses. Data were analyzed using the software SPSS for Windows version 25 [
55] and R software [
56]. Analyses were conducted in two phases. Firstly, the original sample (n = 345) was assessed on the socio-demographic characteristics and respondents’ views about green infrastructure (green roofs and green walls). Secondly, clustering analysis was performed to identify potential homogeneous groups.
In the first phase, Spearman’s rank correlation coefficient was used to evaluate the possible association between the dependent variable “green infrastructure as a decision point for choosing a hosting location” and explanatory variables. Posteriorly, respondents were categorized by age and the nonparametric Kruskal–Wallis H test was performed. There were no significant differences between age groups and the dependent variable.
In the second phase, the exploratory factor analysis (EFA) with a component analysis and orthogonal rotation method (Varimax) was performed to evaluate whether the survey items have similar patterns of responses. Six factors were extracted that explain 67.35% of the total variance. Based on the recommendations made by [
57], cluster analysis was carried out using extracted factors as input. Clustering analysis was performed using k-means method. The four-cluster solution was defined.
All statistical tests employed in data analyses were two-tailed and were significant when
p-value is ≤0.05. Bivariate relationships were analyzed using Chi-square test (χ
2). Respondents’ preferences by green infrastructure typologies were performed using Scott-Knott Test (
p-value ≤0.05) [
58]. The Scott-Knott Test is a procedure of multiple comparisons of means that was selected because it distinguishes results without ambiguity and therefore provides clear results [
59] to identify preferred typologies.
3. Results
3.1. Socio-Demographic Characteristics
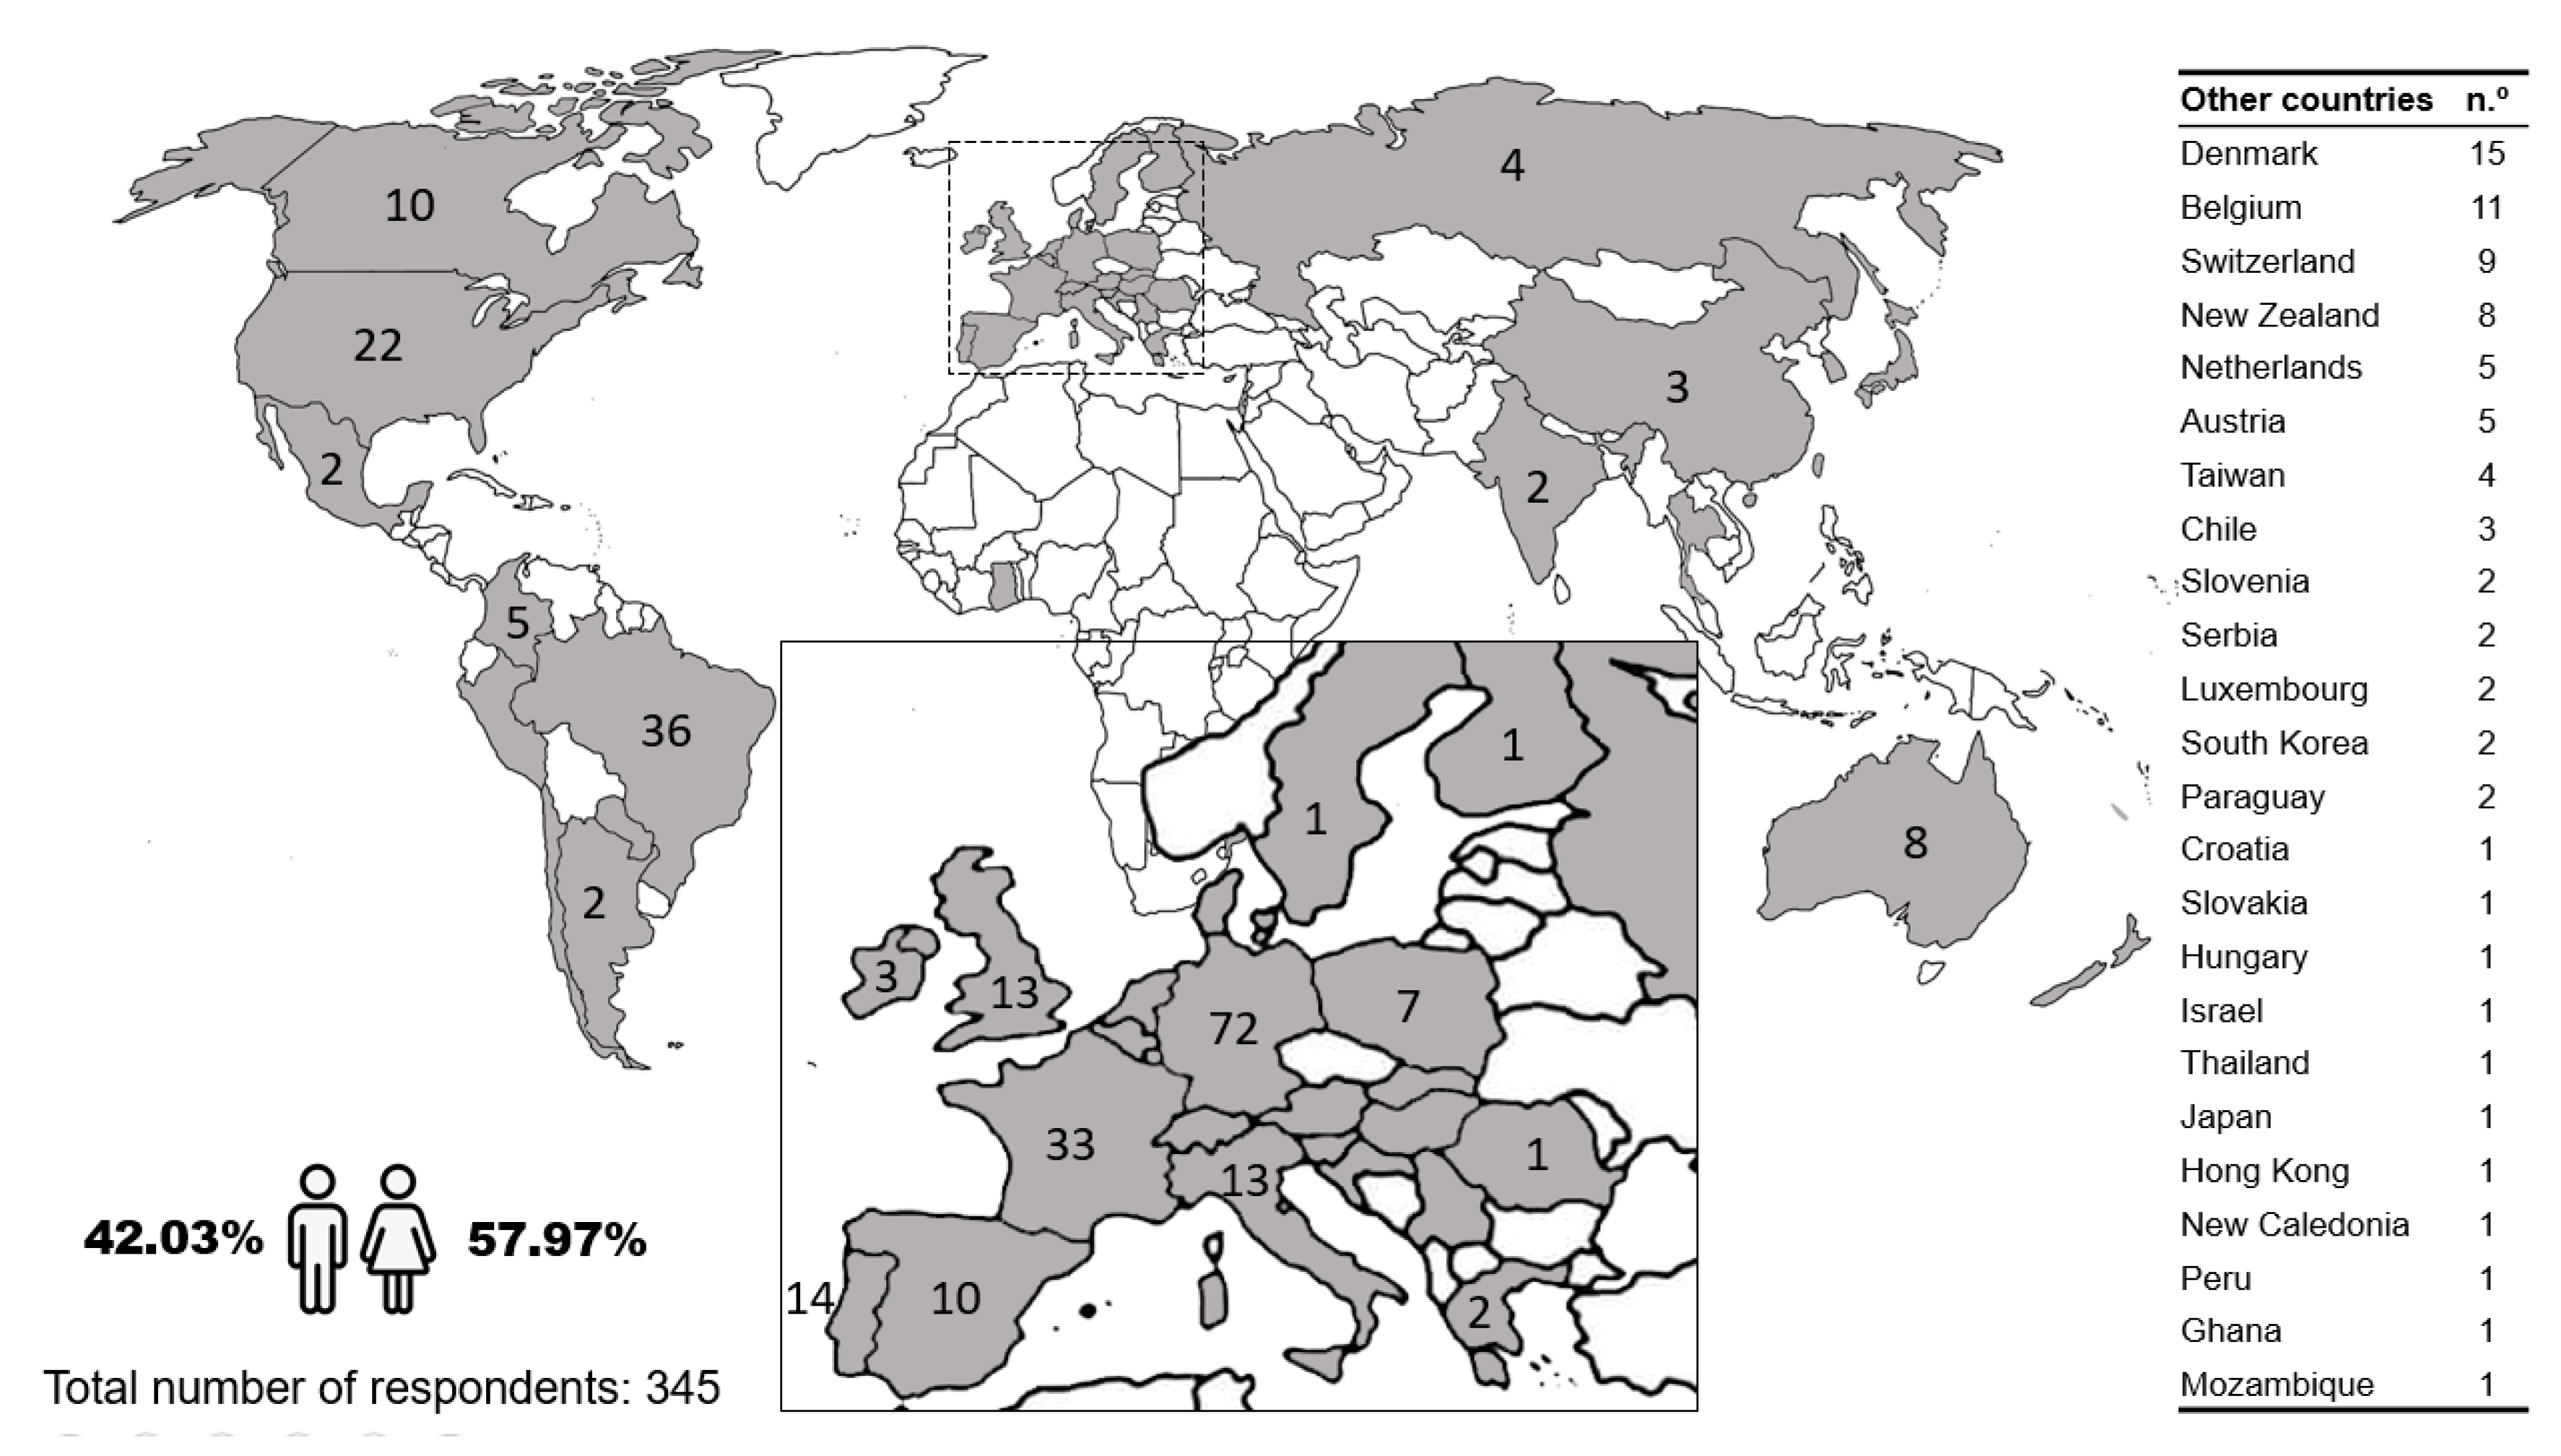
This survey was answered by 345 respondents from 46 countries and 5 different continents (
Figure 1). The socio-demographic characteristics of the survey respondents are shown in
Table 2. From all the surveyed respondents, 57.97% are female and 42.03% are male. Most respondents (53.76%) are employed in different sectors. However, students are the second largest and more homogeneous group, representing 27.17% aged between 14 and 36 years old (
Table 2).
Most participants are within the age range of 18–35 years old (71.01%). The respondents’ educational level is well distributed among master’s (27.25%), bachelor’s (37.97%) and high school (31.88%). There is an exception for doctorate level, which represents only 2.9%. The average monthly income of respondents is 994.56 euros. However, 27.25% declare receiving more than 1600 euros, and 26.67% less than 400 euros per month. The environmental background for most participants is predominantly urban, on both adulthood (71.01%) and childhood (56.23%).
3.2. Respondents’ Perceptions toward Green Infrastructure Solutions
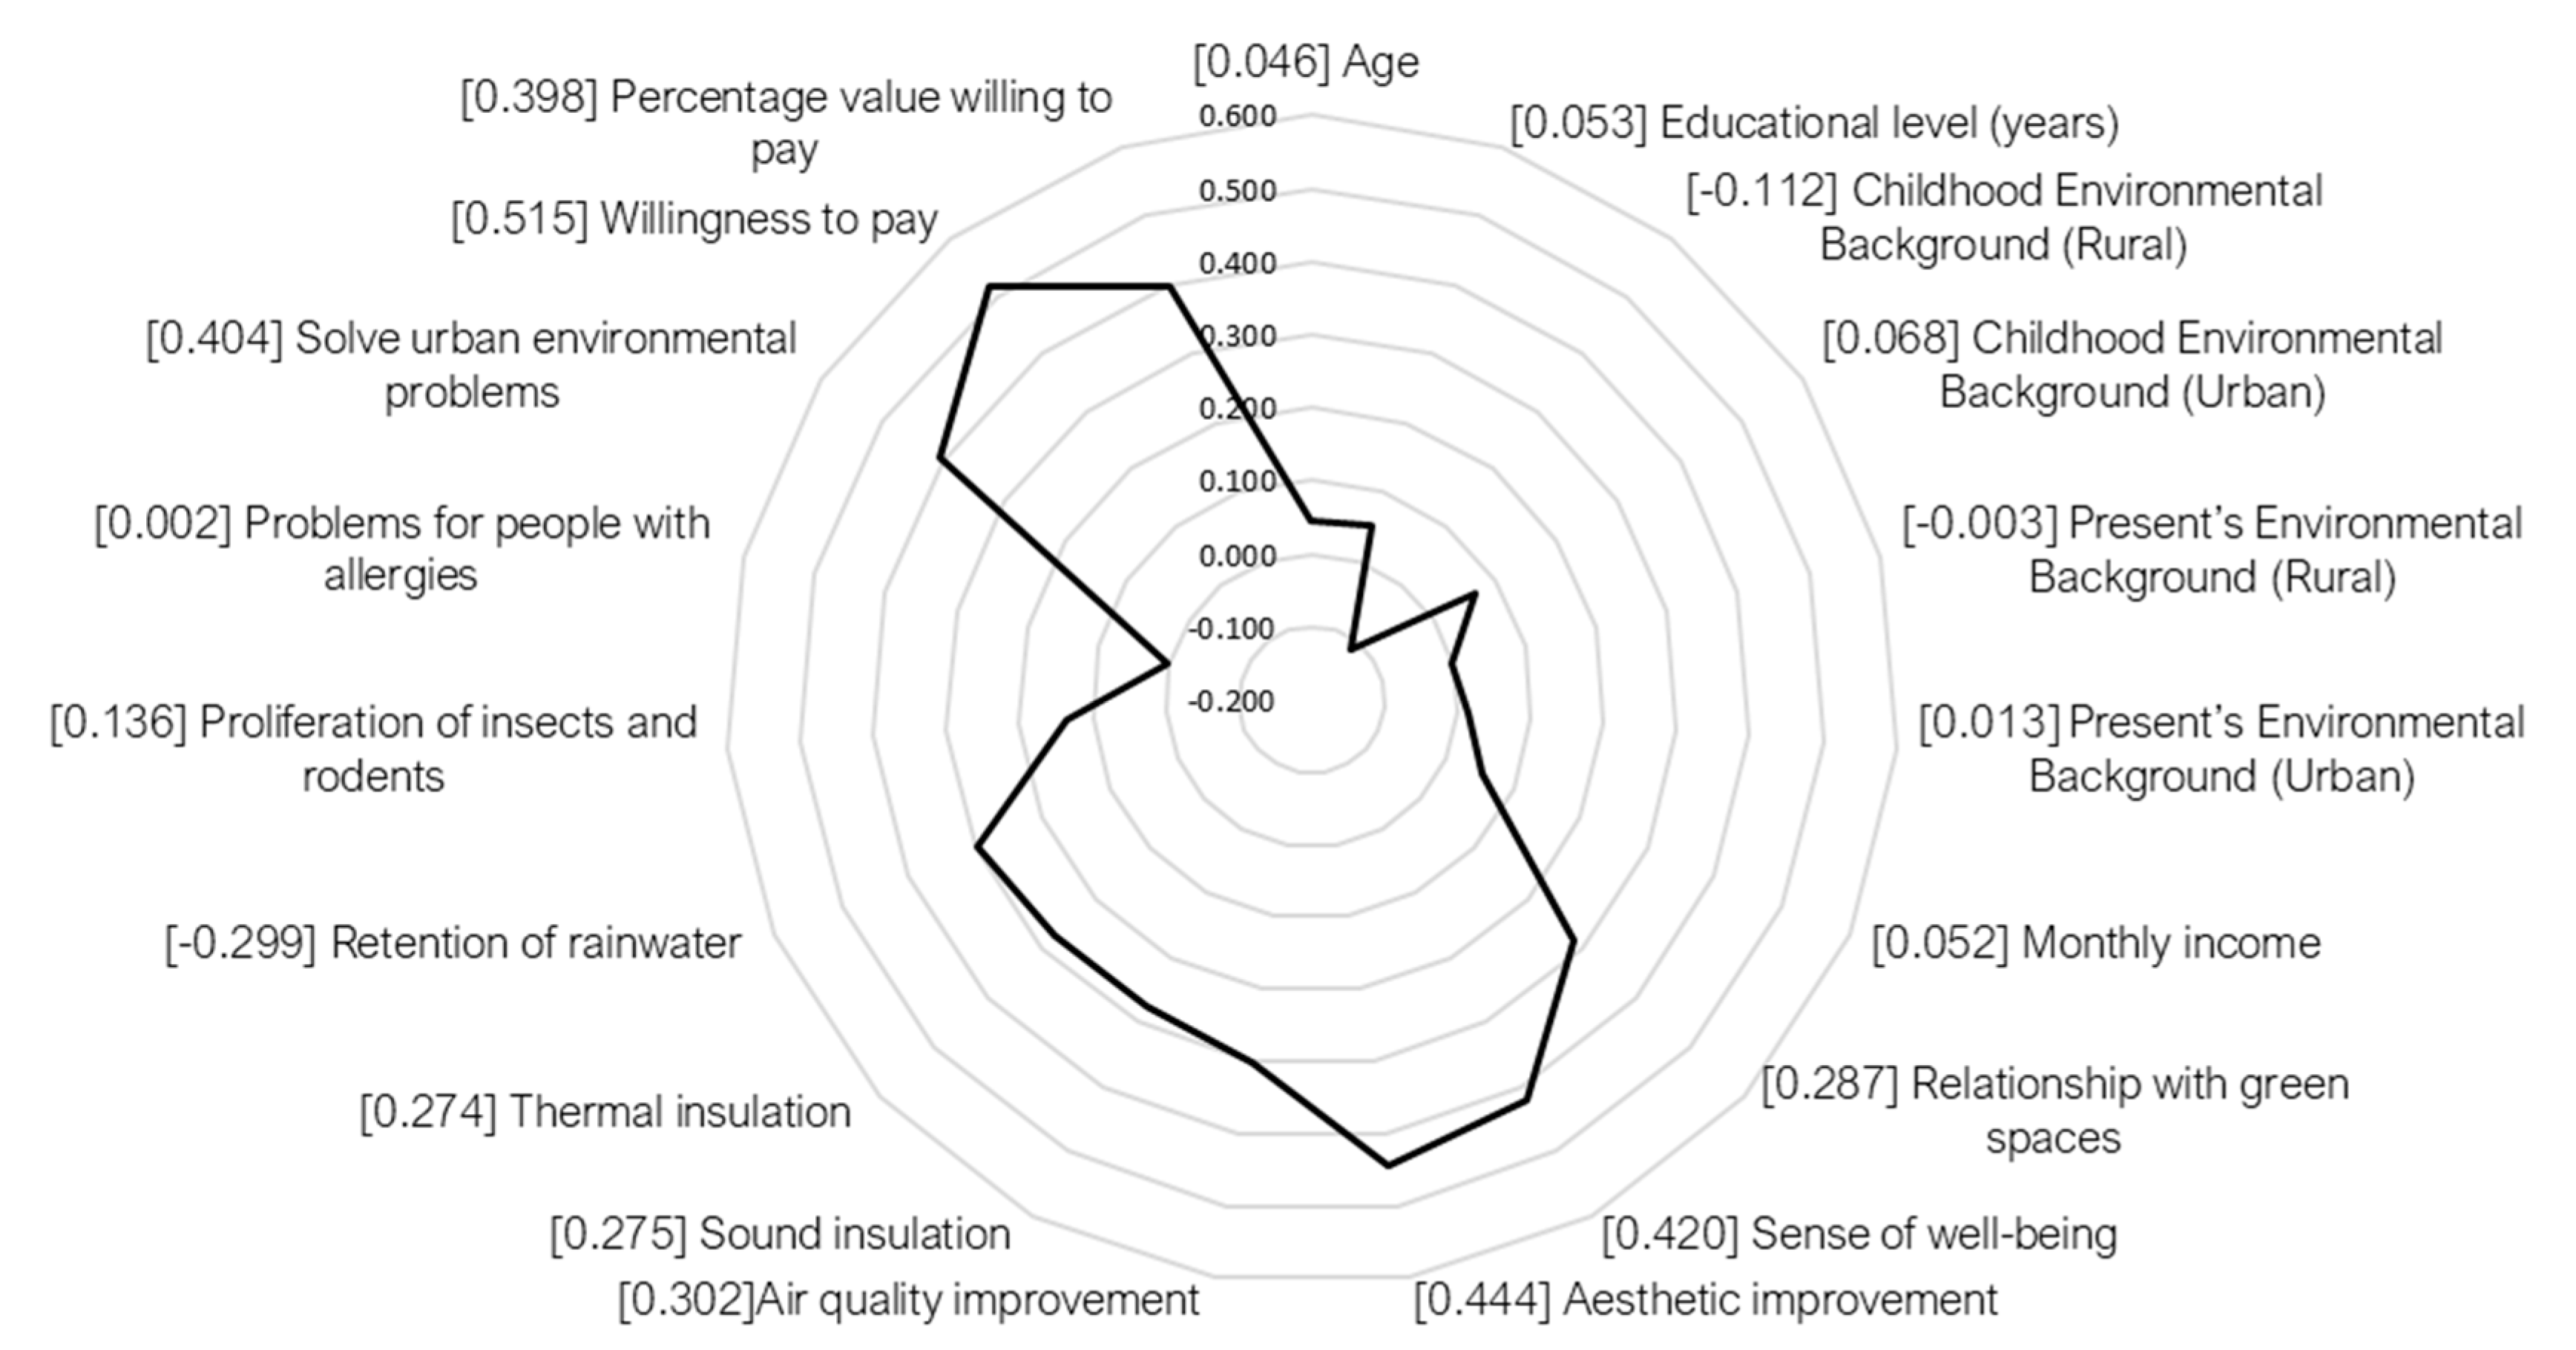
Spearman’s rank correlation coefficient was used as a hypothesis test to verify the dependence level between the dependent variable “green infrastructure as a decision point for choosing a hosting location” and independent variables.
Figure 2 shows the correlation coefficients outcomes. The application of the Spearman test allowed to verify a moderate positive correlation between “green infrastructure as a decision point for choosing a hosting location” and (i) willingness to pay (0.515); (ii) aesthetic value (0.444); (iii) improvement in the sense of well-being (0.420); and (iv) solution for urban environmental problems (0.404).
The respondents were categorized by age into teenagers (under 18 years; n = 37), young adults (aged 18–35 years; n = 245), middle-aged adults (aged 36–55 years, n = 48), and older adults (aged older than 55 years, n = 15) [
60]. Kruskal–Wallis test by ranks was used to classify the views of respondents regarding green roofs and green walls in the common hostel areas. No significant differences were found among age groups and “green infrastructure as a decision point for choosing a hosting location” (χ
2 = 4.177,
p-value = 0.243, df = 3).
Posteriorly, an exploratory factor analysis (EFA) was performed to evaluate whether the survey items have similar patterns of responses and reduce data to a smaller set of unobserved factors without losing much information. EFA was applied with a component analysis and orthogonal rotation method (Varimax). For selecting the number of factors, the eigenvalue criteria were applied. EFA to the respondents’ answers revealed six factors with an eigenvalue higher than one. The combined factor loadings explain 67.35% of the total variance, concerning the respondents’ perception (Keiser–Meyer–Olkin = 0.718; χ2 = 3013.16; df = 190; p < 0.001).
The first factor (Factor 1) includes the following variables: (i) relationship with green spaces; (ii) green infrastructure (GI) provides a greater sense of well-being; (iii) GI promotes local aesthetic improvement; (iv) GI promotes sound insulation; (v) GI promotes thermal insulation; (vi) GI promotes retention of rainwater and (vii) GI is a potential solution for urban environmental problems.
The second factor (Factor 2) includes (i) GI as a decision point for choosing a hosting location; (ii) willingness to pay; (iii) percentage value willing to pay. This factor is related to the preference of respondents to host in an accommodation establishment with green infrastructure and their willingness to pay for it. Factor 3 includes the present environmental background (rural, urban or forest) and Factor 4, the childhood environmental background (rural, urban or forest). Factor 5 includes educational level, age and monthly income, and Factor 6 comprises whether GI promotes the proliferation of insects and rodents; and cause problems for people with allergies.
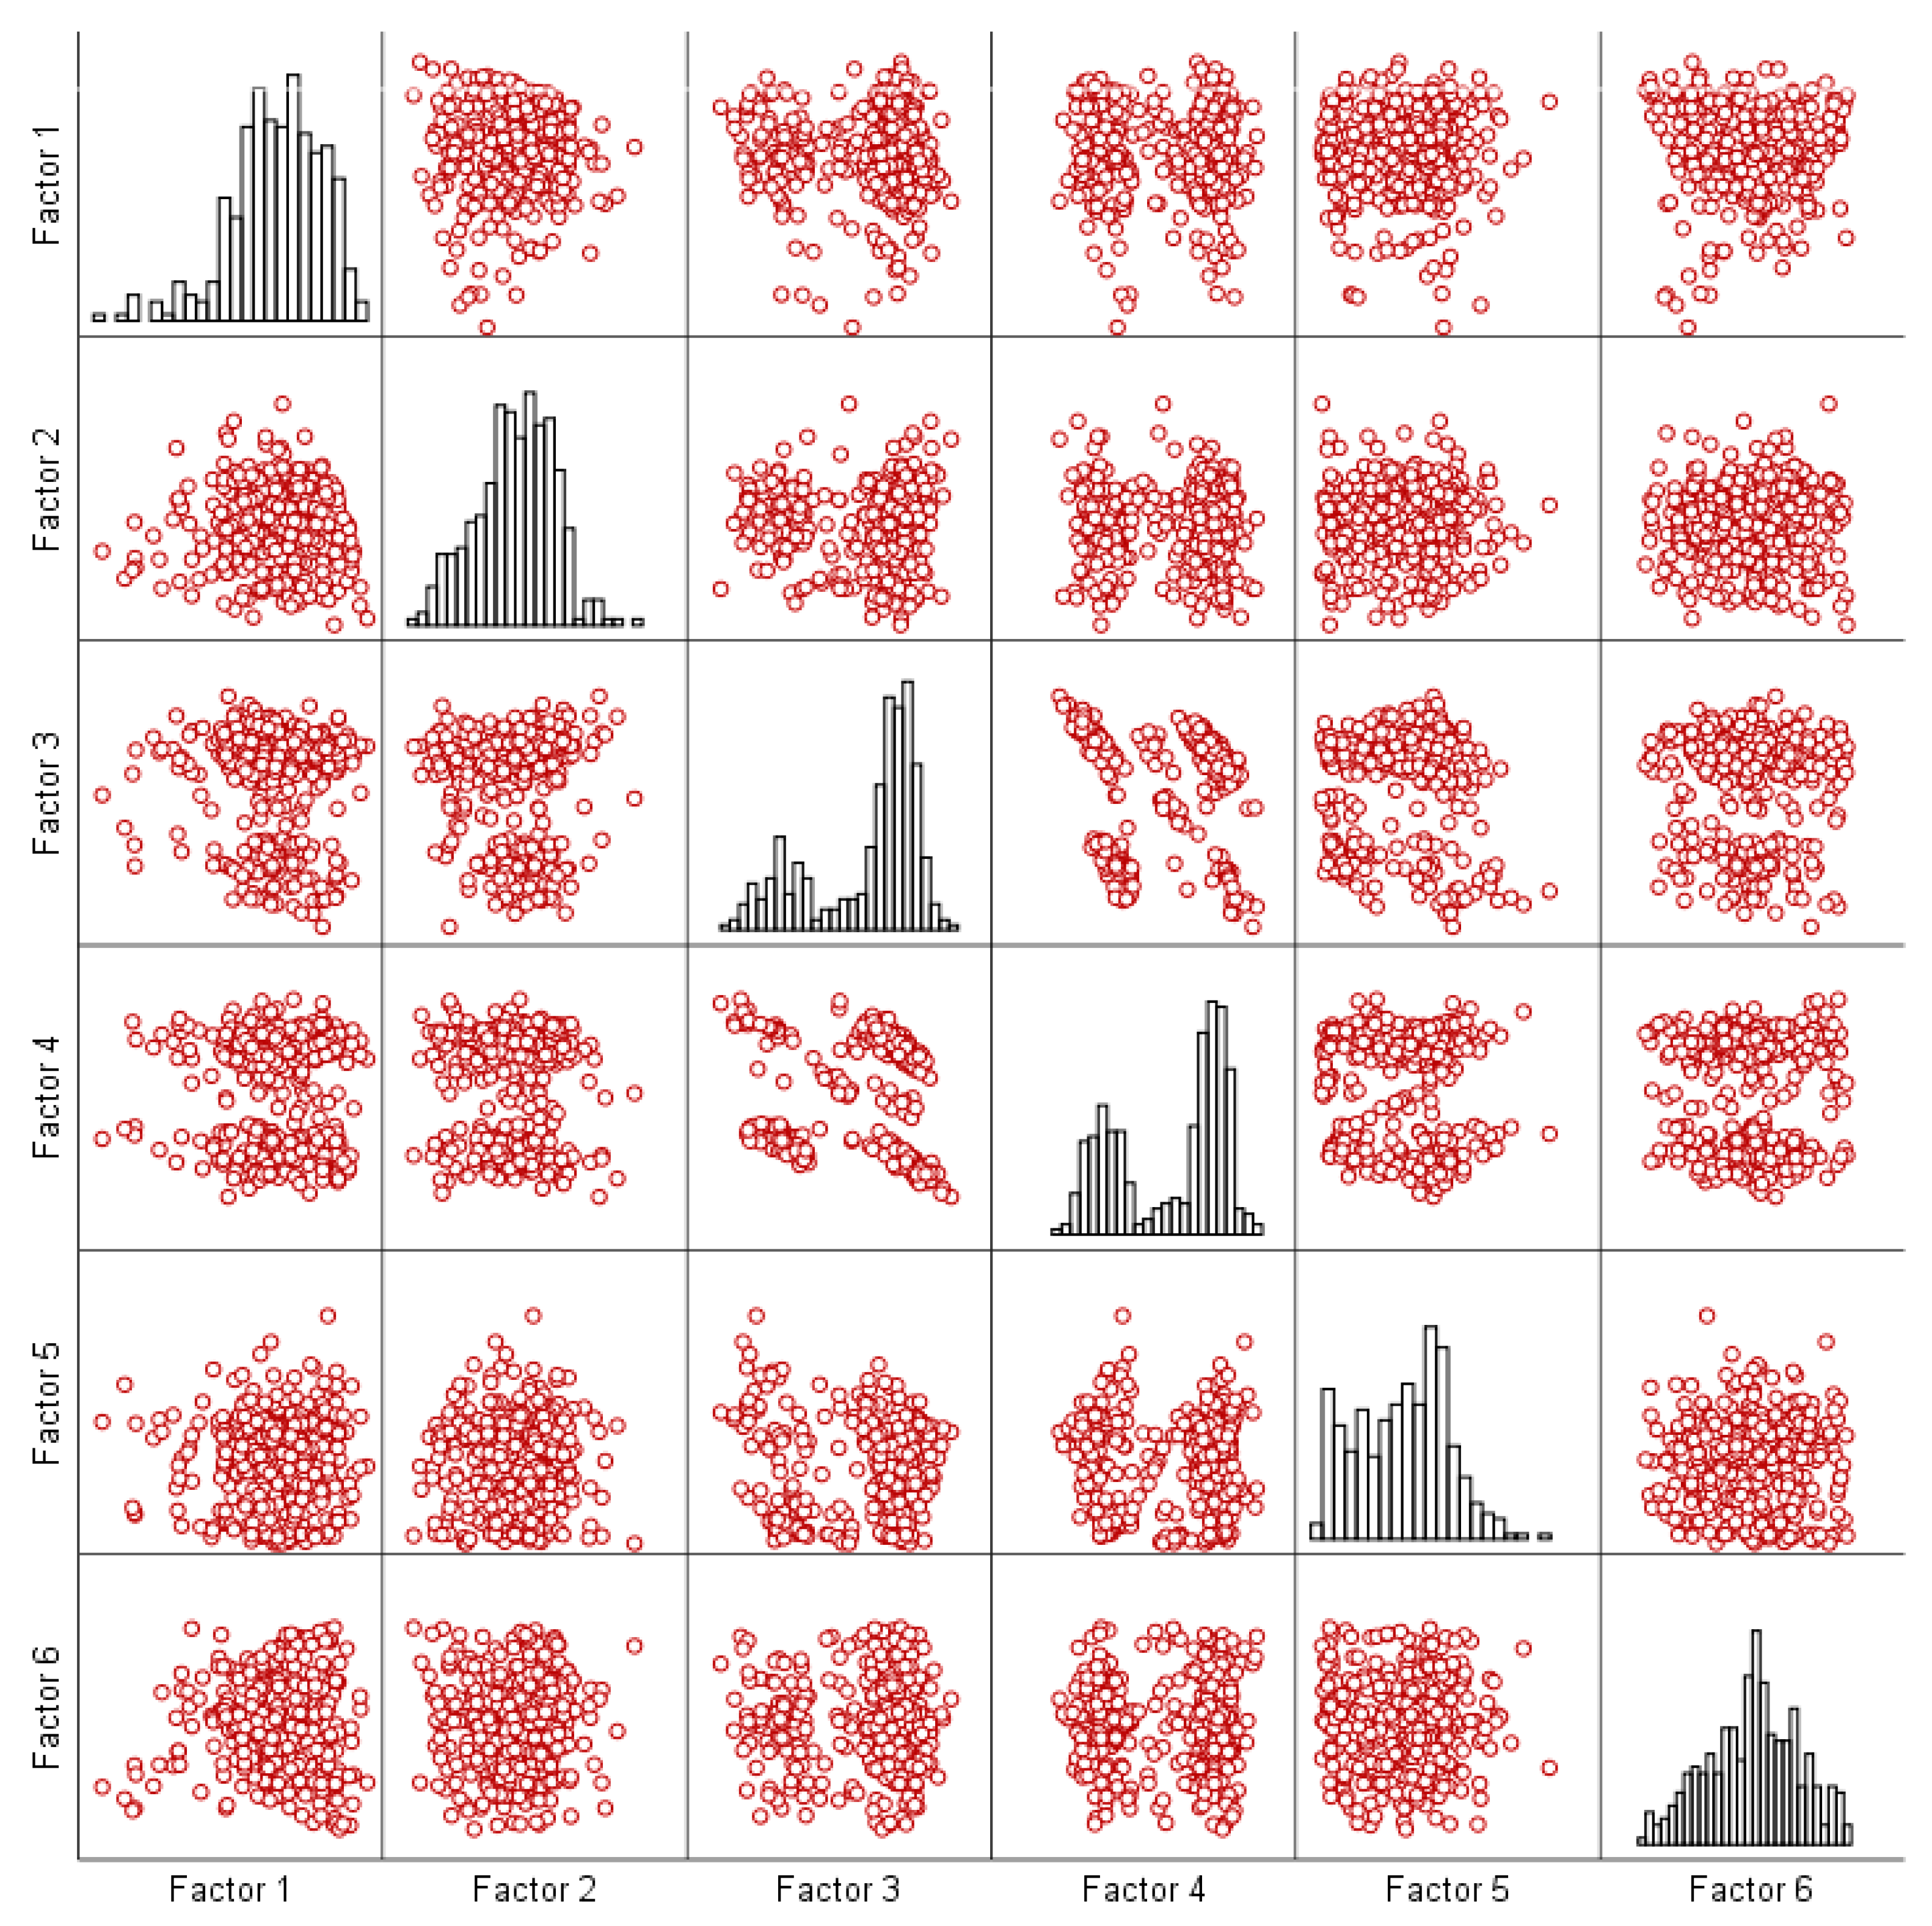
Table 3 illustrates each item’s weight in the corresponding factor, that is, the item’s contribution to the factor score. Moreover,
Figure 3 shows the scatterplots matrix for graphically analyzing the existing association between factors. The histograms in the diagonal represent the variable/factor in the
y-axis. The findings indicate the formation of two main agglomeration groups, clearly perceptible in Factor 3 and Factor 4, which are related to the respondents’ environmental background (present and childhood).
3.3. Respondents’ Clustering
Cluster Analysis was applied to identify possible homogeneous groups of respondents. Using the extracted factors as input for k-means method for clustering [
57], several numbers of clusters were tested. Finally, four-cluster solutions were defined to describe the highest number of statistically significant differences between respondents.
Table 4 shows the final cluster centers of each factor in the corresponding cluster.
Respondents from Cluster 1 present a strong negative influence regarding the Factor 1 (preconceptions) and Factor 2 (willingness to pay/decision point), and a positive influence relating to Factor 4 (childhood environmental background). For Cluster 2, a positive influence is observed for Factor 2 and Factor 3 (present environmental background).
Respondents from Cluster 3 have a strong negative influence regarding Factor 3. While Cluster 4 respondents present a negative influence regarding Factor 2 and Factor 4. Factors 5 and 6, which explain 9.48% and 7.02%, respectively (
Table 3), did not have a significant influence on any cluster, as confirmed by
Table 5 (ANOVA). Factors 5 and 6 also have the highest mean square error and statistically the lowest F. Therefore, these factors are less significant than the others on the clusters’ formation.
Regarding socio-demographic characteristics, the main difference observed between clusters concerns the gender and environmental background of respondents (
Table 6). Cluster 1 concentrates “male urban individuals” who lived in urban spaces during childhood (81.43%) and who continue to live today (85.71%). Cluster 1 is formed mostly by men (61.43%). On the other hand, Cluster 2, which is the largest grouping (38%), is formed mostly by women (68.94%) with the similar environmental background than Cluster 1 and is therefore called “female urban individuals.”
Likewise, Clusters 3 and 4 differ in terms of environmental context but have similar proportions of men and women. Clusters 3 agglomerates “rural individuals” that lived in rural areas during their childhood (60.87%) and continue to live today (98.55%). While most respondents located in Cluster 4 are characterized by rural childhood (74.32%) and current urban life (75.68%) - “rural-to-urban migration people” (
Table 6).
3.4. New Respondents’ Clustering and Views
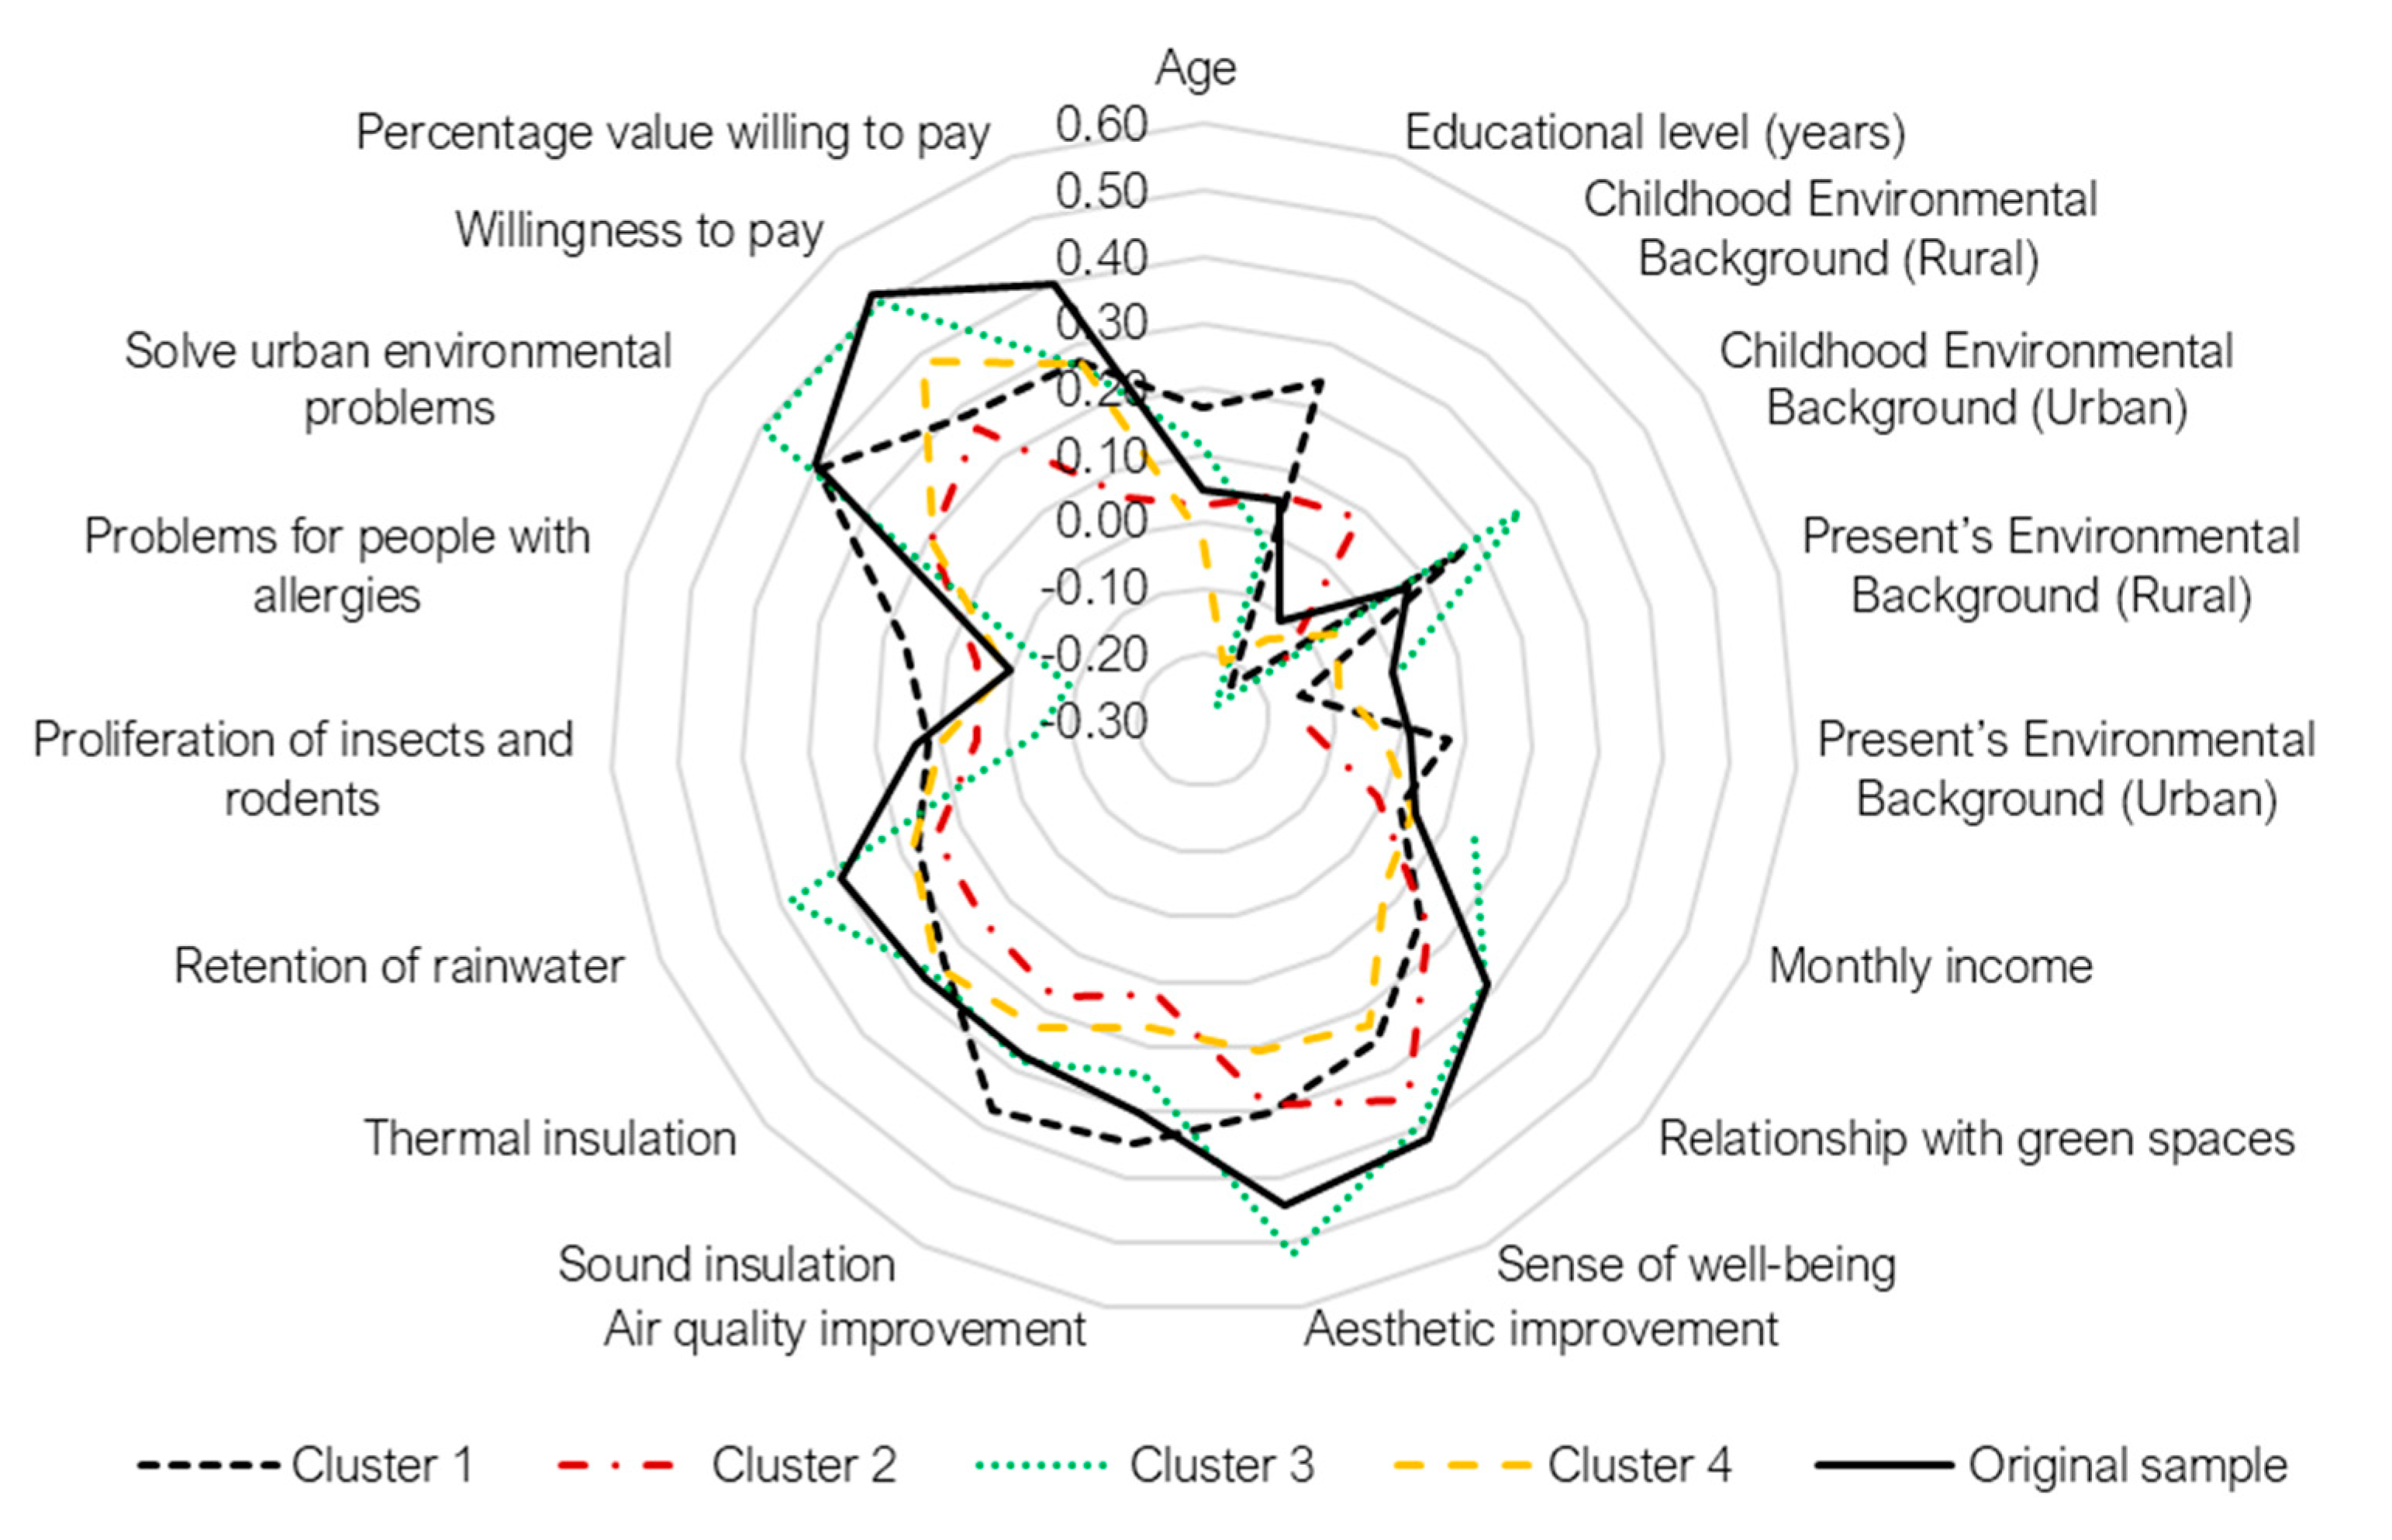
Clustering analysis allowed to identify similarities between respondents and create groups with high internal homogeneity. These clusters were then compared with the original sample through the Spearman rank correlation coefficient.
Figure 4 illustrates the variations between the original sample and the new groupings of respondents for “green infrastructure as a decision point for choosing a hosting location.” Similar patterns were verified in Cluster 3 with slightly higher coefficients for (i) aesthetic improvement (0.518) and (ii) solve urban environmental problems (0.496). Lower coefficients were identified for (i) willingness to pay (0.500) and (ii) sense of well-being (0.392).
Table 7 reported the percentage distribution of answers and descriptive statistics of the respondents’ view for each cluster compared to the original sample.
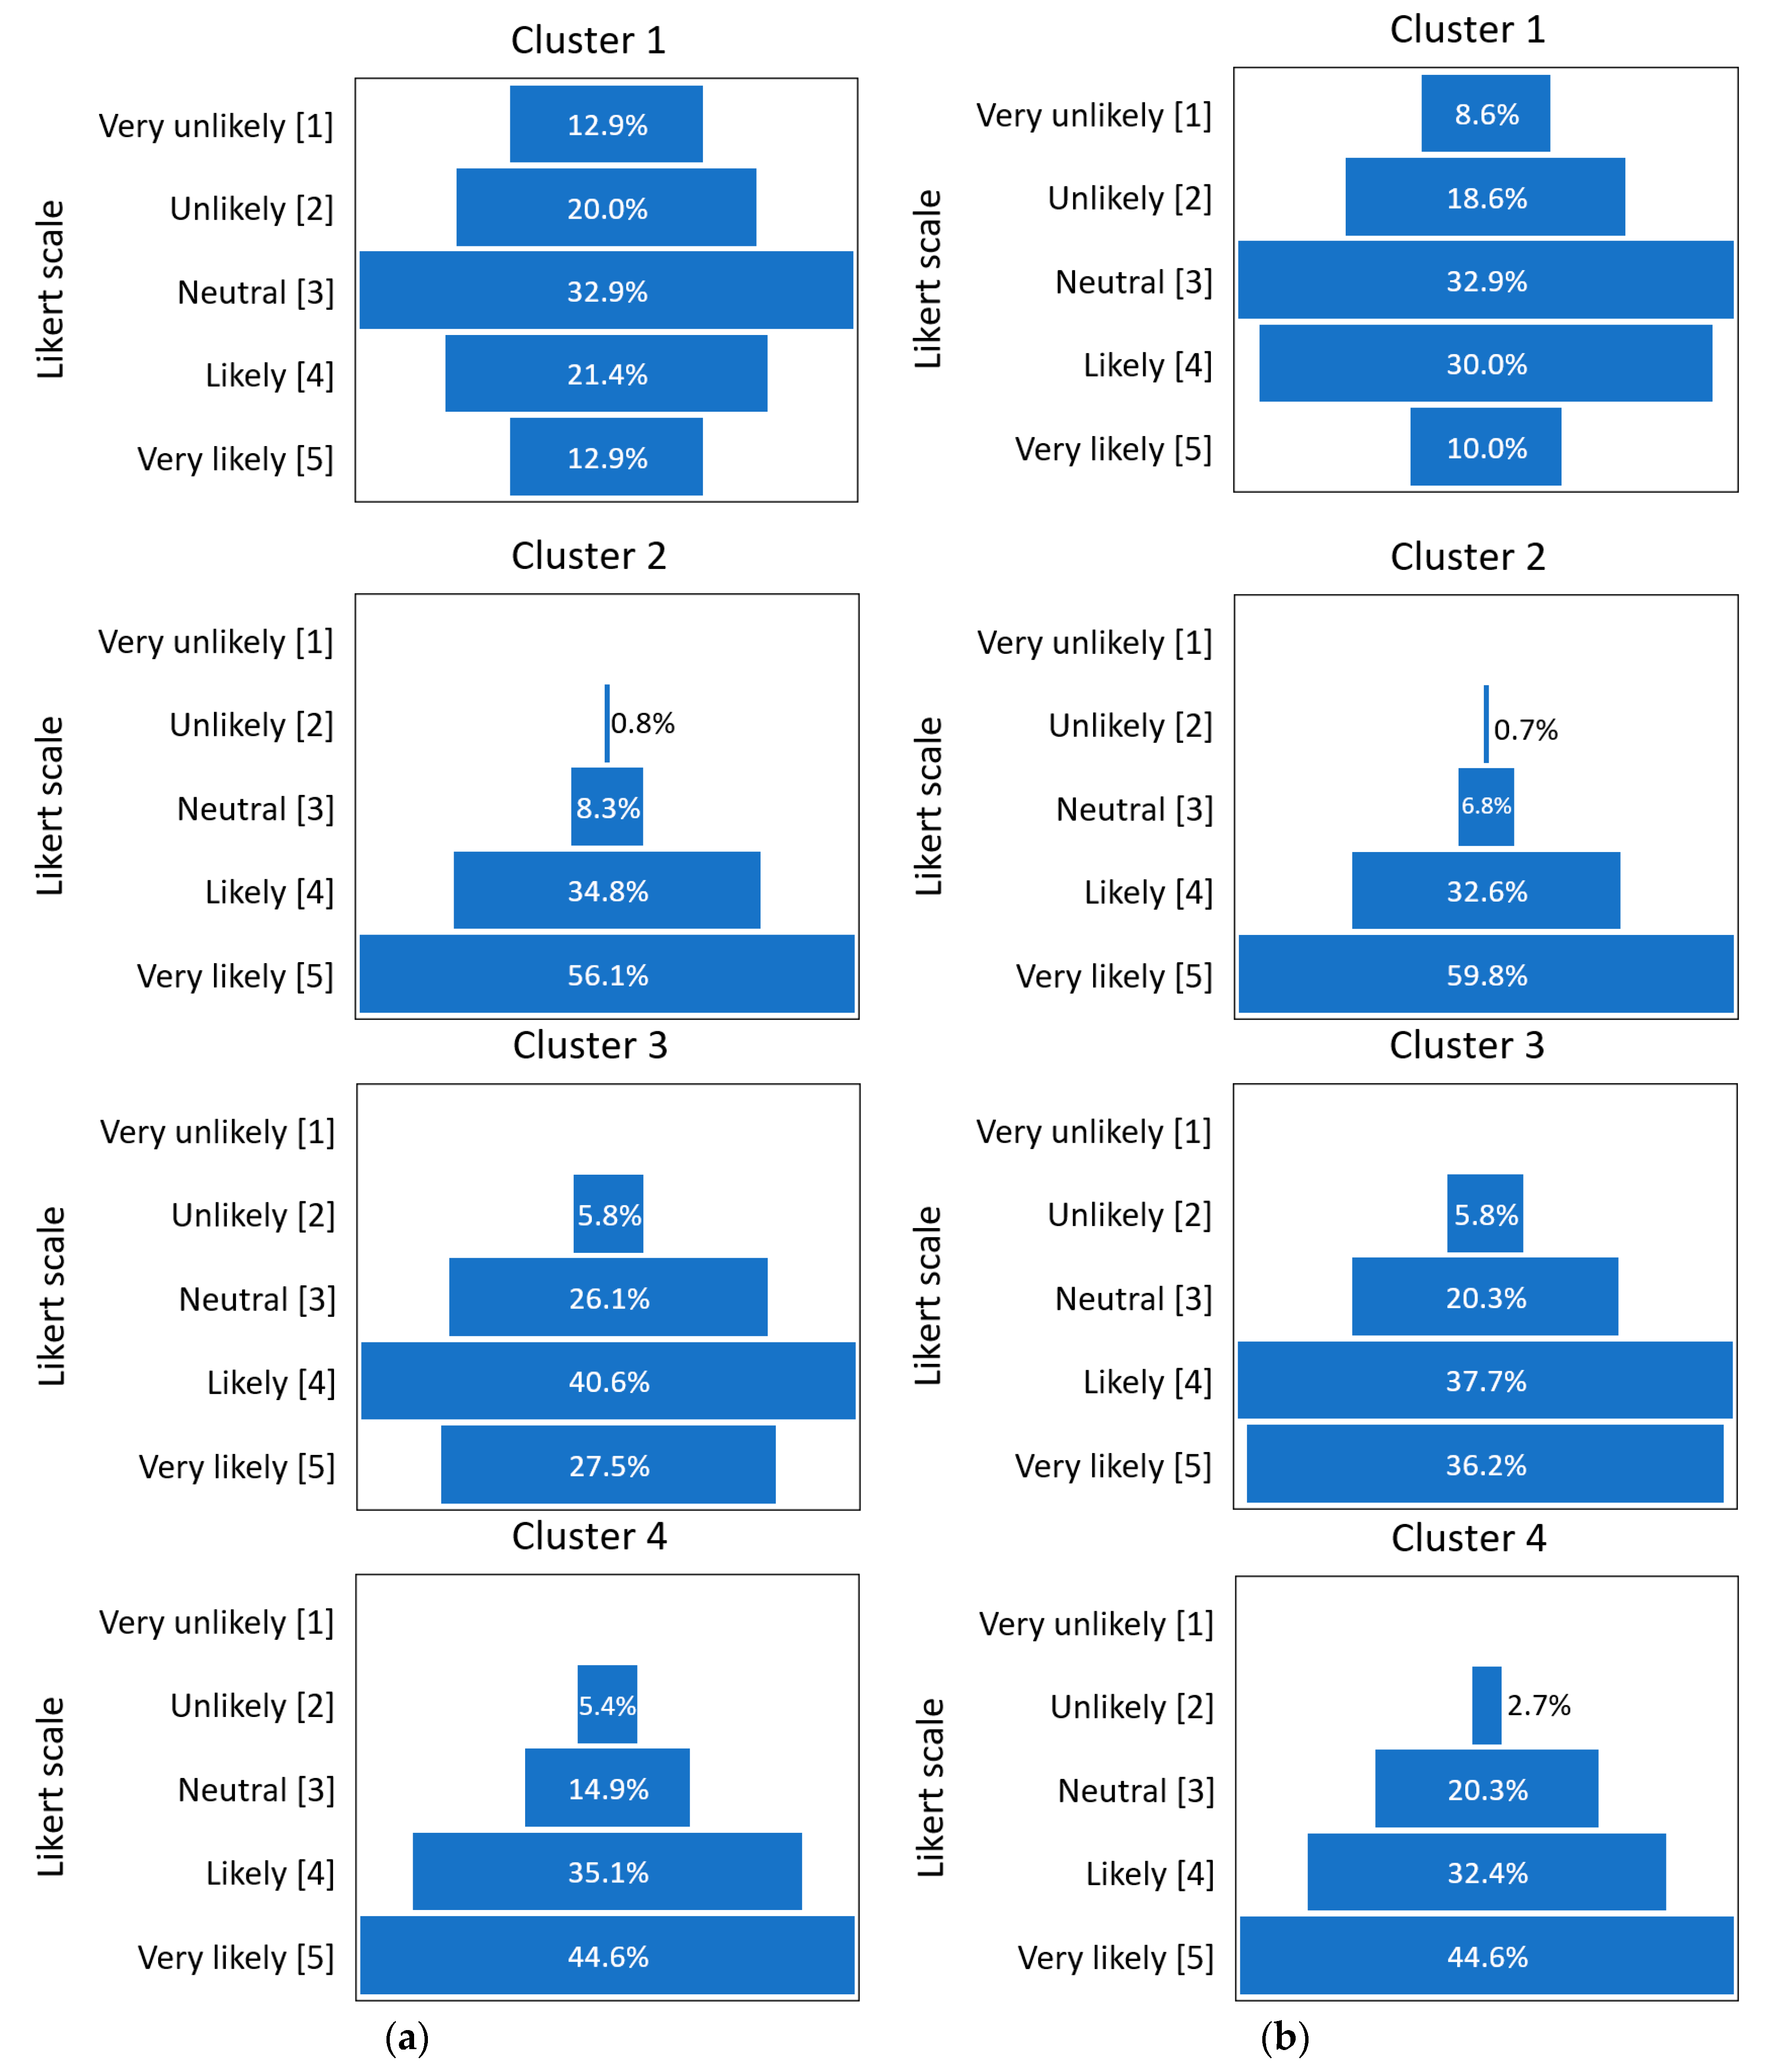
Regarding the sense of well-being, most respondents from Cluster 1 do not consider the green infrastructure solutions as a measure to improve the individual well-being (66% answered neutral or lower). In contrast, the respondents from the other clusters indicated mainly positive scores in the “sense of well-being” (
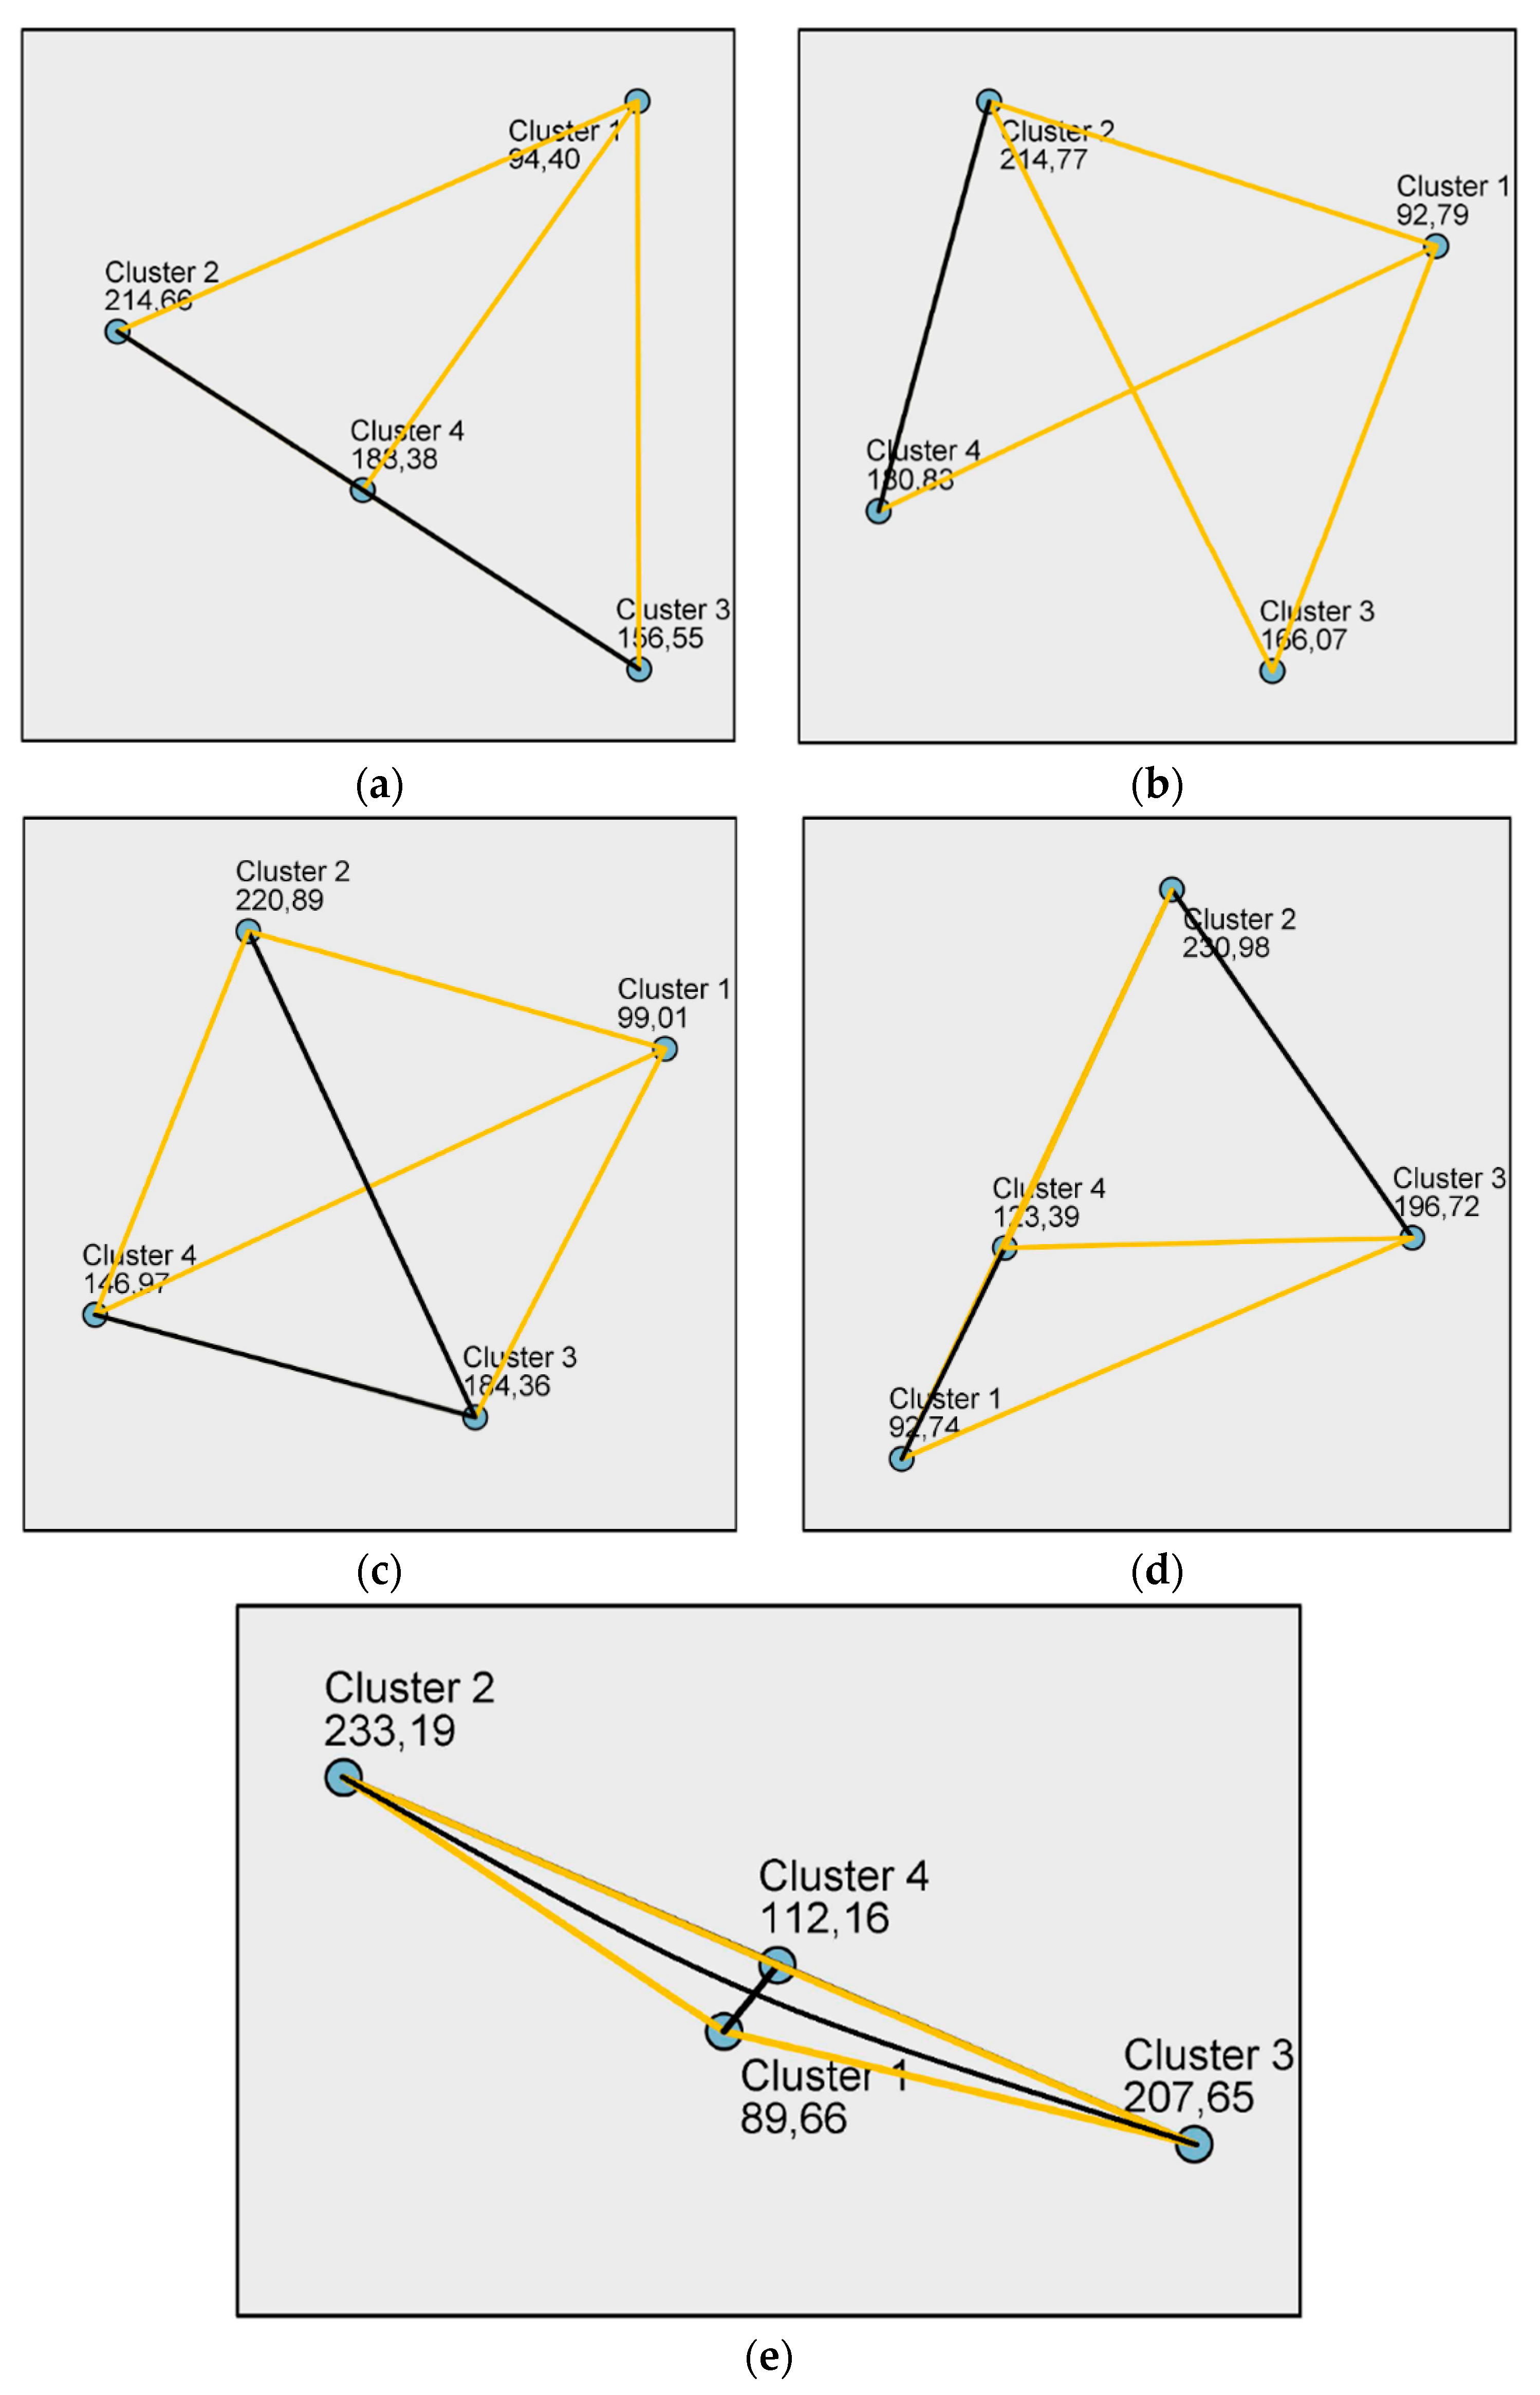
Figure 5a). Applying the Kruskal–Wallis test, it was confirmed that there are significant differences between Cluster 1 and other clusters (
p-value ≤ 0.001) (
Figure 6a). Similar behavior was observed for “aesthetic improvement” (
Figure 5b and
Figure 6b).
Another important variable with significant correlation coefficient is related to the respondents’ perceptions of “green infrastructure as strategies to increase urban greening and tackle urban environmental problems.” For this variable, the initial correlation (0.404—original sample) is similar to Cluster 3 (0.496) and Cluster 1 (0.396), but significantly lower for Cluster 2 (0.191) and Cluster 4 (0.187) (
Figure 4).
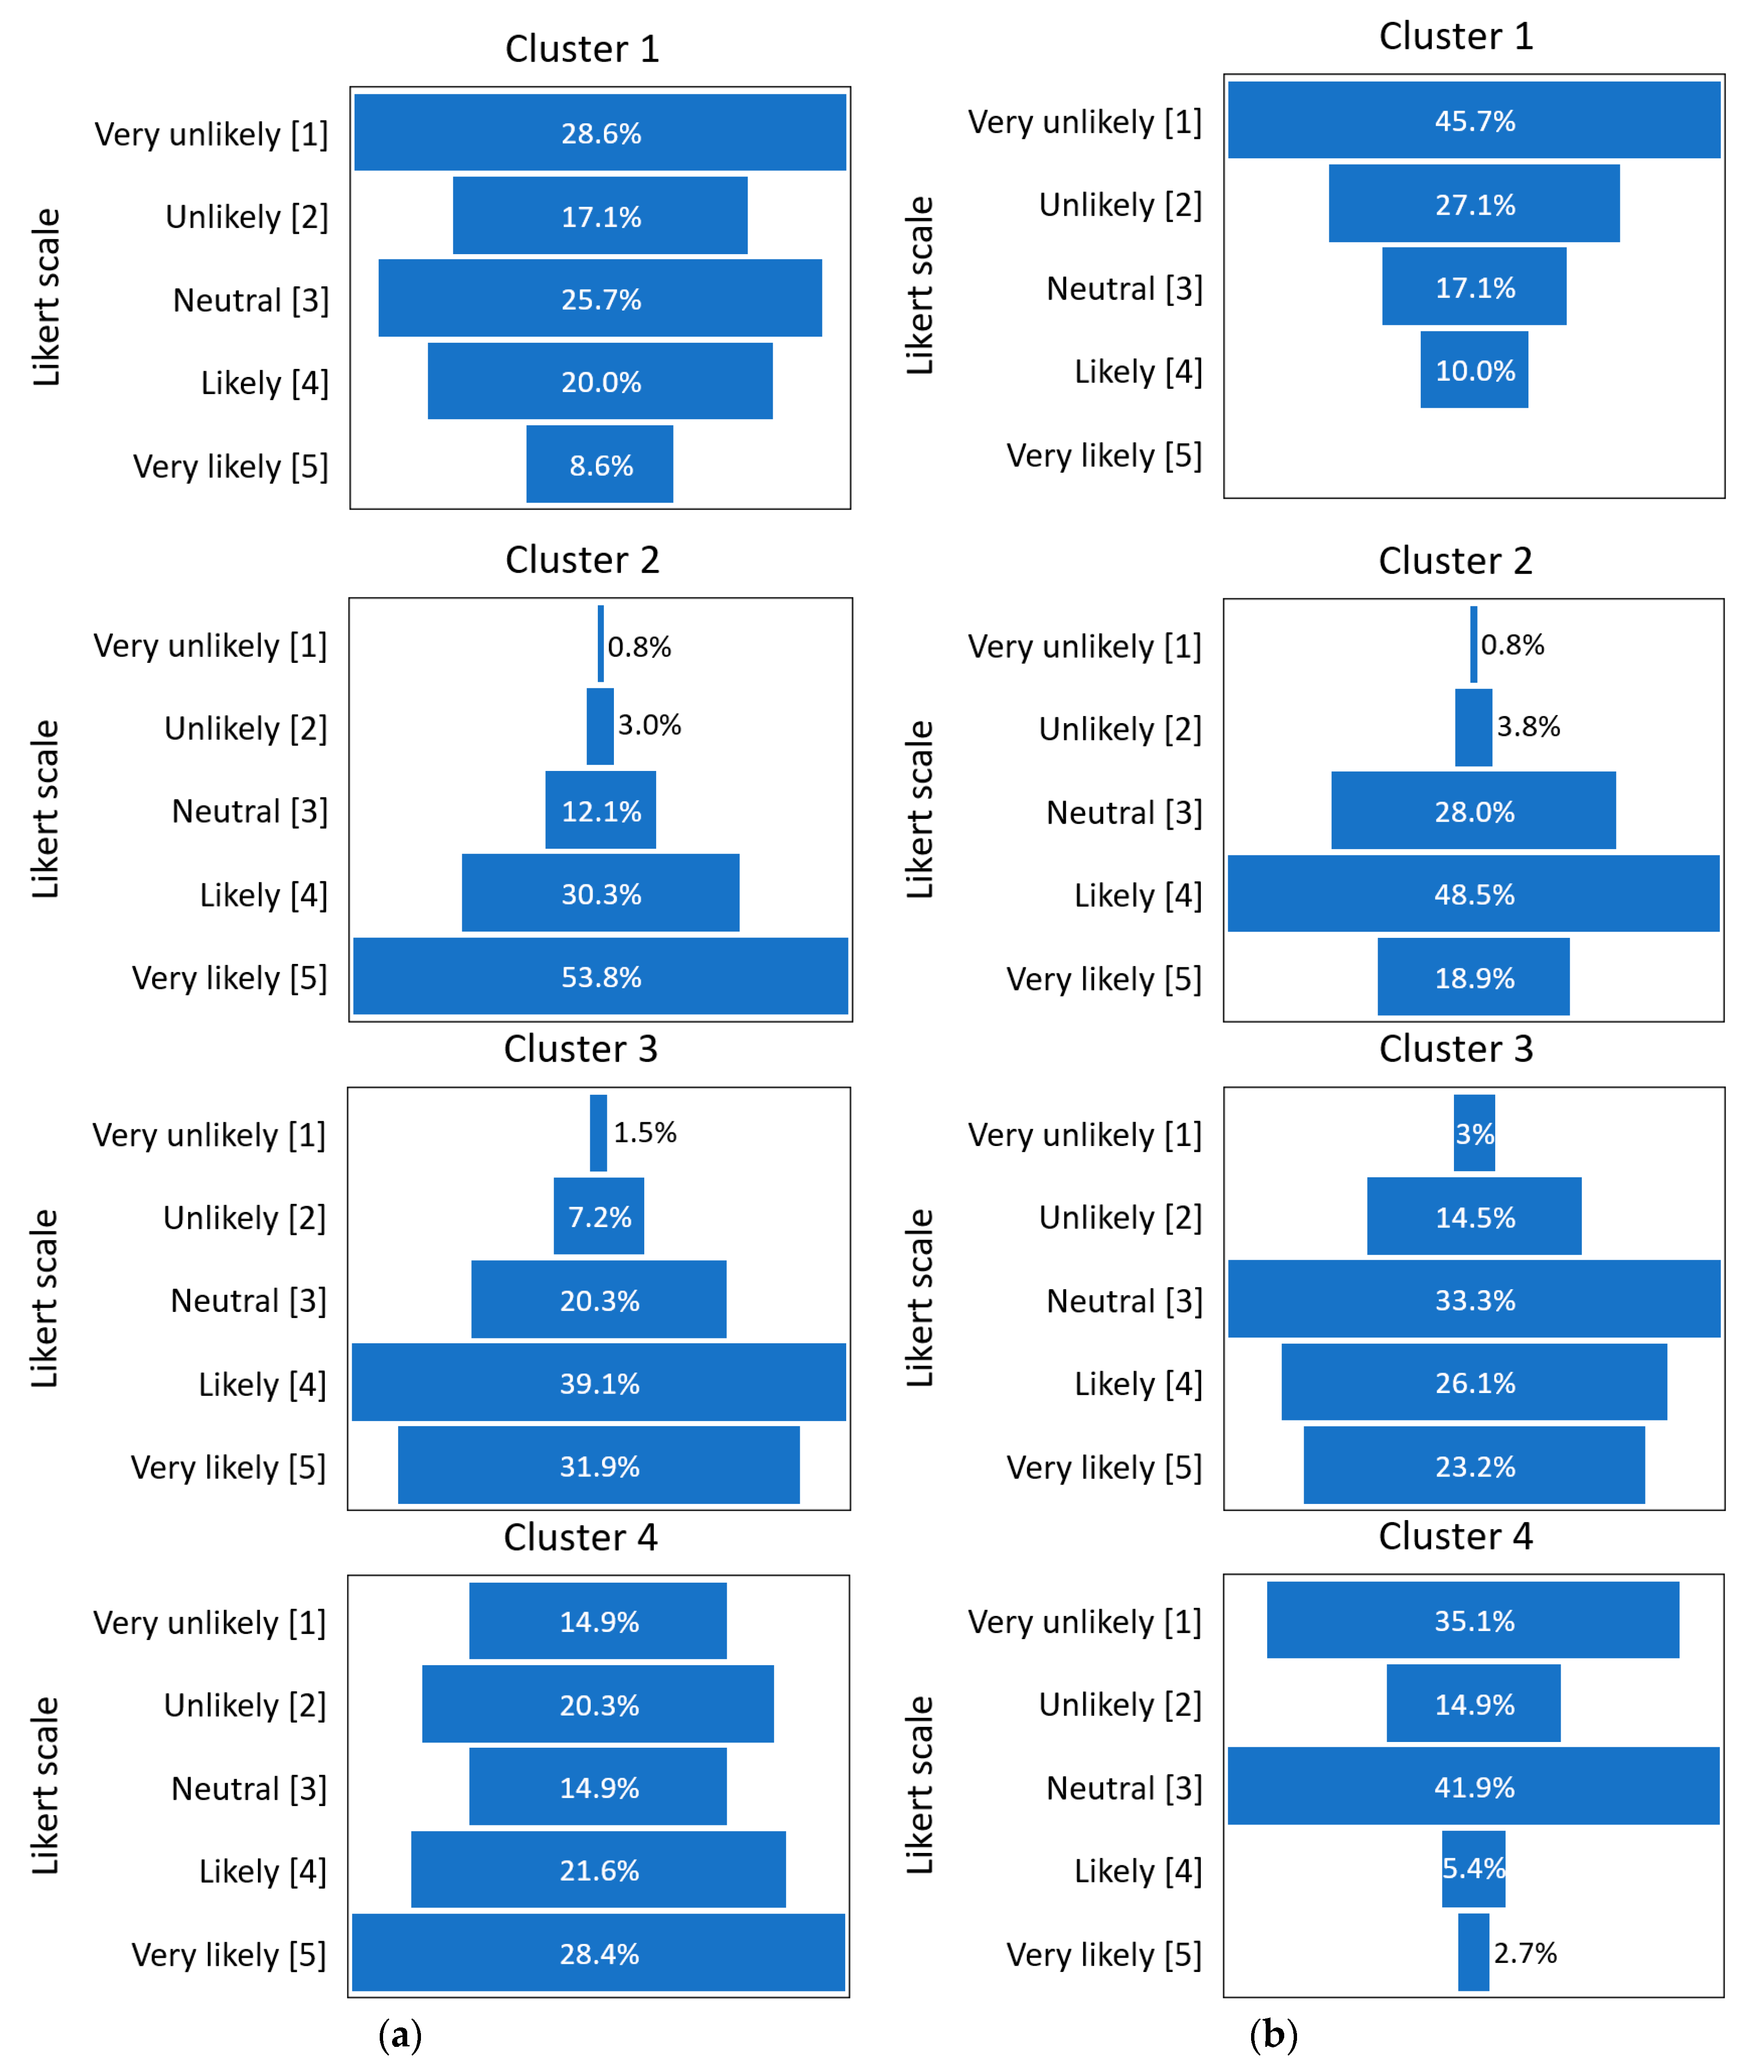
Regarding “green infrastructure as a decision point for choosing a hosting location” most respondents from Cluster 1 indicated neutral or lower scores (72%). While respondents from other clusters answered positive scores for this variable (
Figure 7a). No significant differences between Cluster 3 and Cluster 2 (χ
2 = 36.535,
p-value = 0.063) or Cluster 3 and Cluster 4 (χ
2 = 37.382,
p-value = 0.121) were observed (
Figure 6c).
For the “willingness to pay”, it was verified that most respondents from Cluster 1 and Cluster 4 are not willing to pay an additional daily rate for a youth hostel with green infrastructure in the common areas. In other words, 90% of the respondents from Cluster 1 and 92% from Cluster 4 answered neutral or lower for this variable and therefore they are not willing to pay for these solutions. On the other hand, 67% of the respondents from Cluster 2 answered “Likely—4” and “Very likely—5”, showing the potential willingness to pay for a youth hostel with green infrastructure. For Cluster 3, only 49% answered positively (“Likely—4” and “Very likely—5”) (
Figure 7b). Statistically comparing clusters by Kruskal–Wallis test it was verified that there are no significant differences between Cluster 1 and 4 (χ
2 = −22.505,
p-value = 0.982); and between Clusters 2 and 3 (χ
2 = 25.537,
p-value = 0.457) (
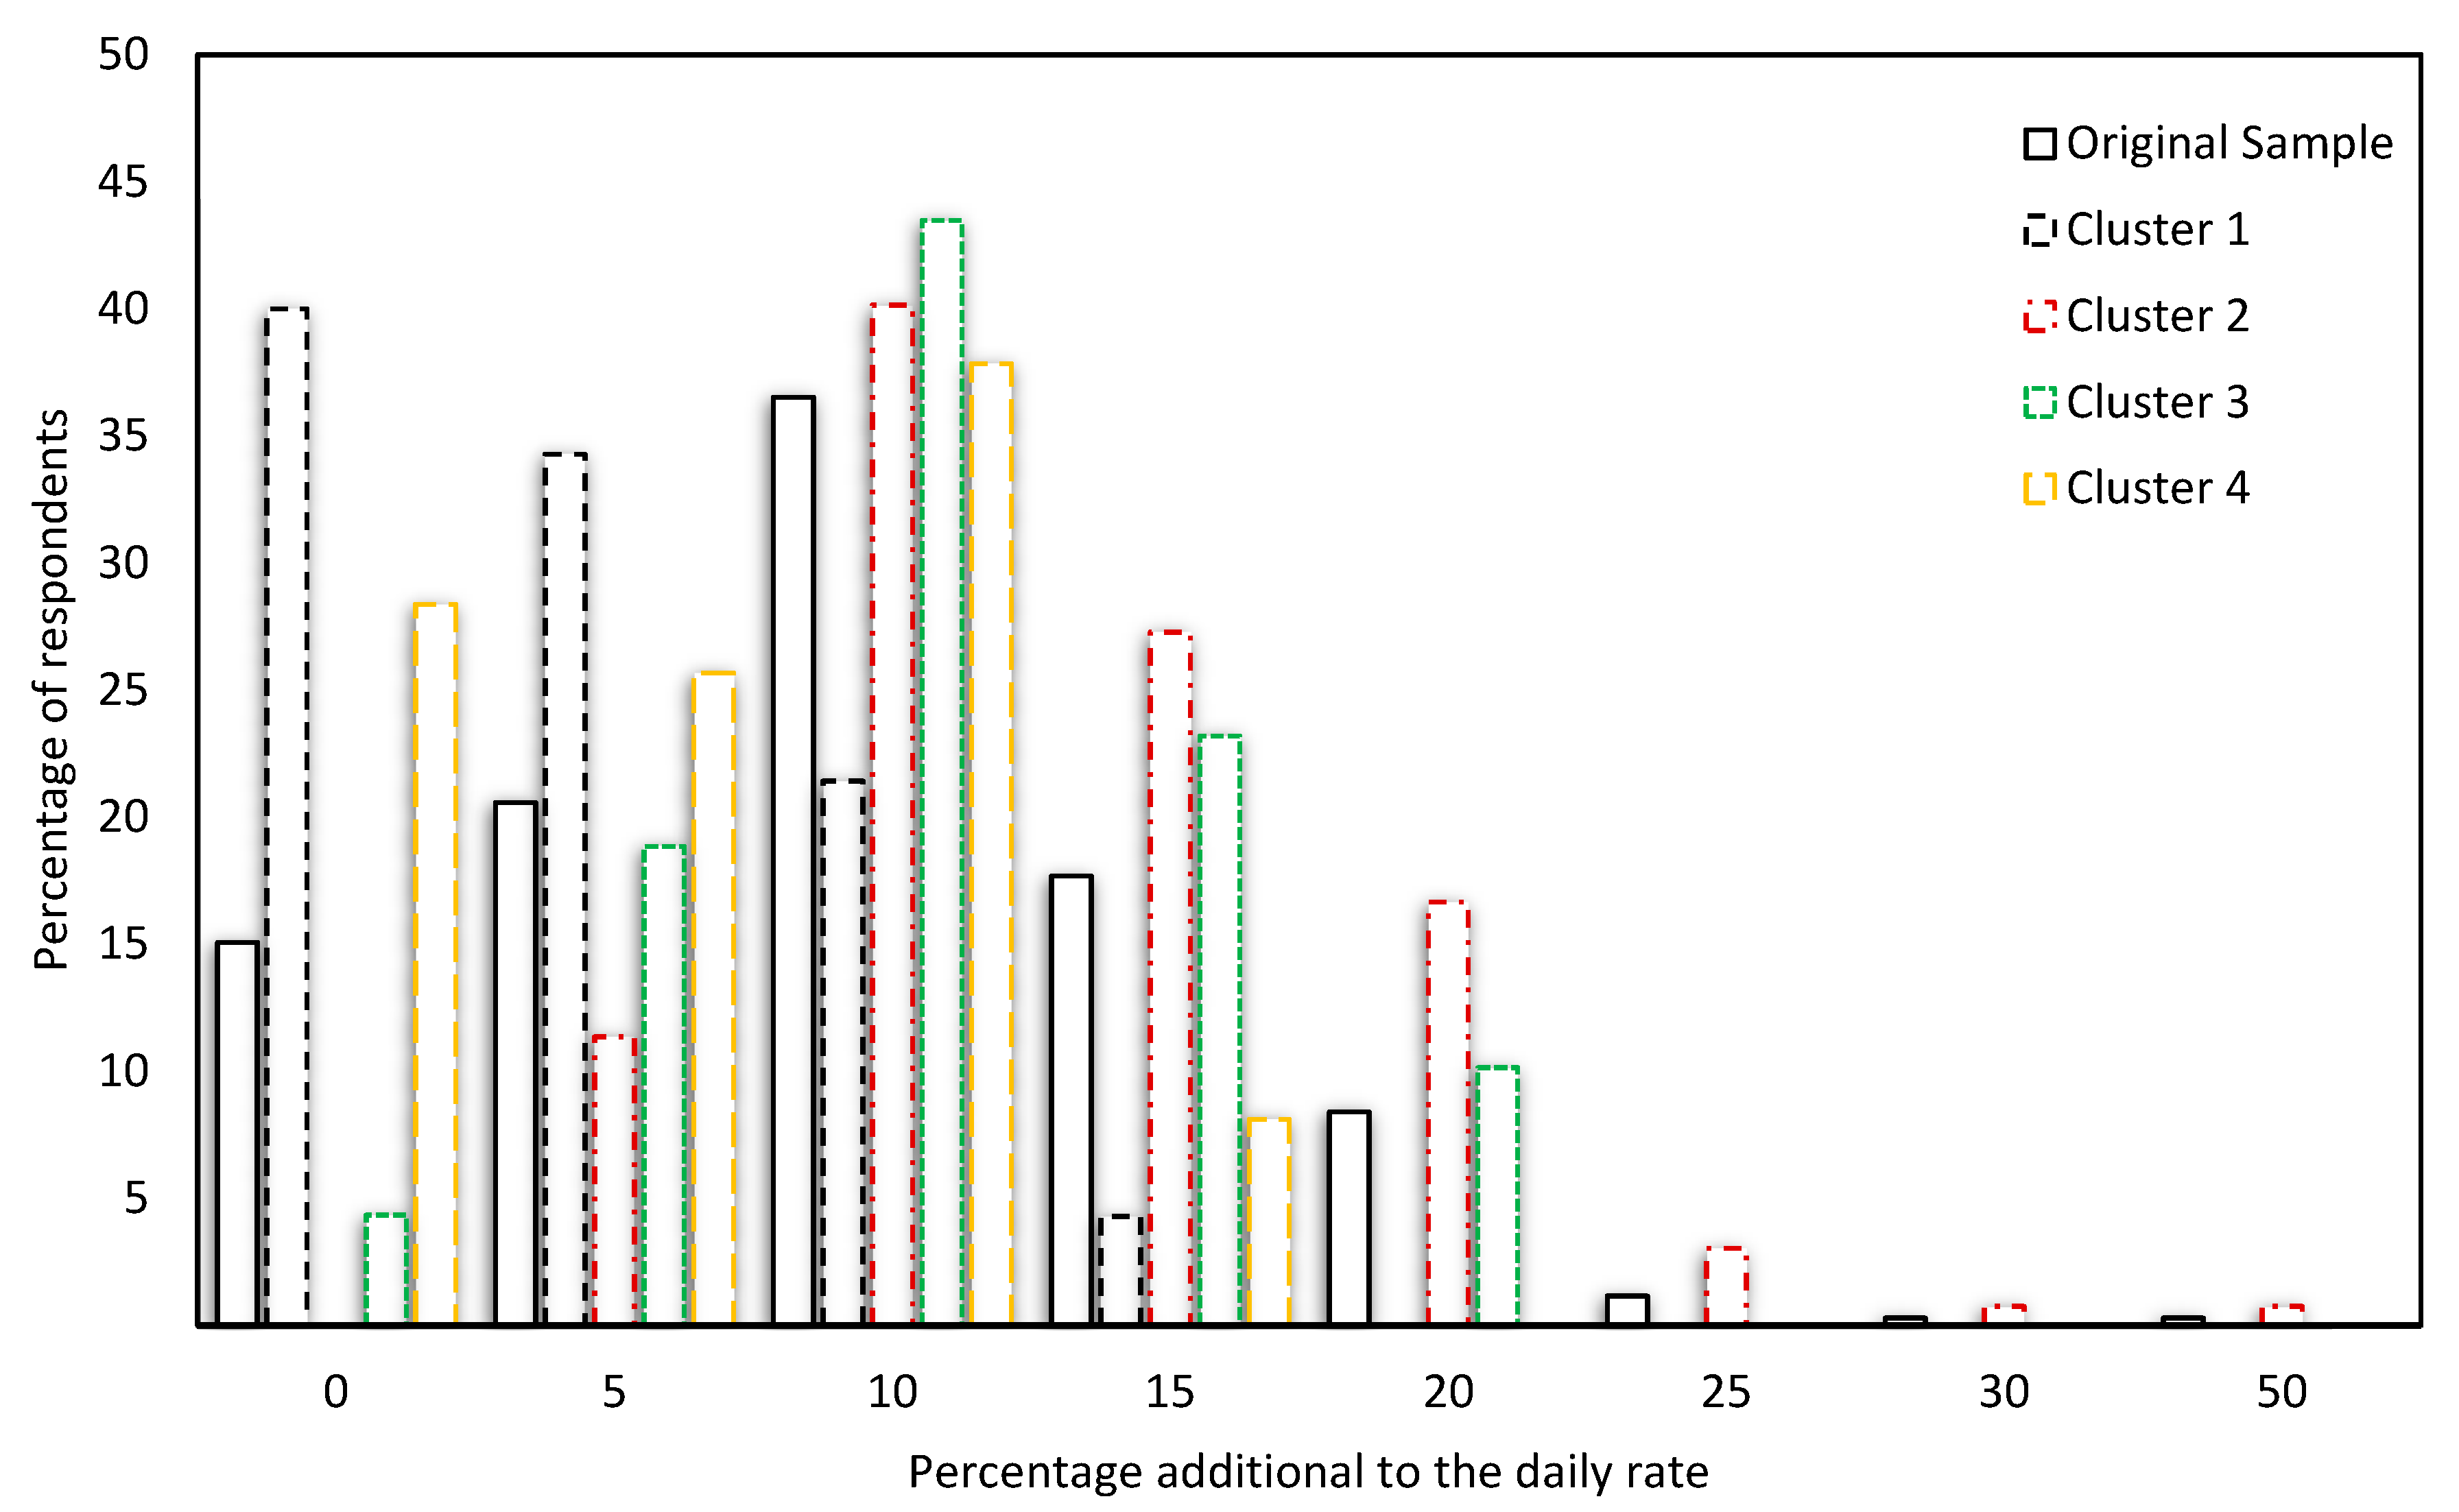
Figure 6e). Furthermore, respondents were asked to indicate the additional percentage to the daily rate that they are willing to pay, considering the existence of green infrastructure in the youth hostel. The statistical differences between clusters are shown in
Figure 6d and the results for the additional percentage in
Figure 8.
3.5. Assessment of Respondents’ Preferences
Respondents were asked to indicate their preference level for each green infrastructure typology. The evaluation was conducted through five color images representing different types of green infrastructure (Accessible Green Roof; Inaccessible Green Roof; Indoor Living Wall; Outdoor Living Wall and Green Façade). The Scott-Knott test was applied using R Software [
56] to evaluate differences between groups and consequently respondents’ preferences among green infrastructure typologies.
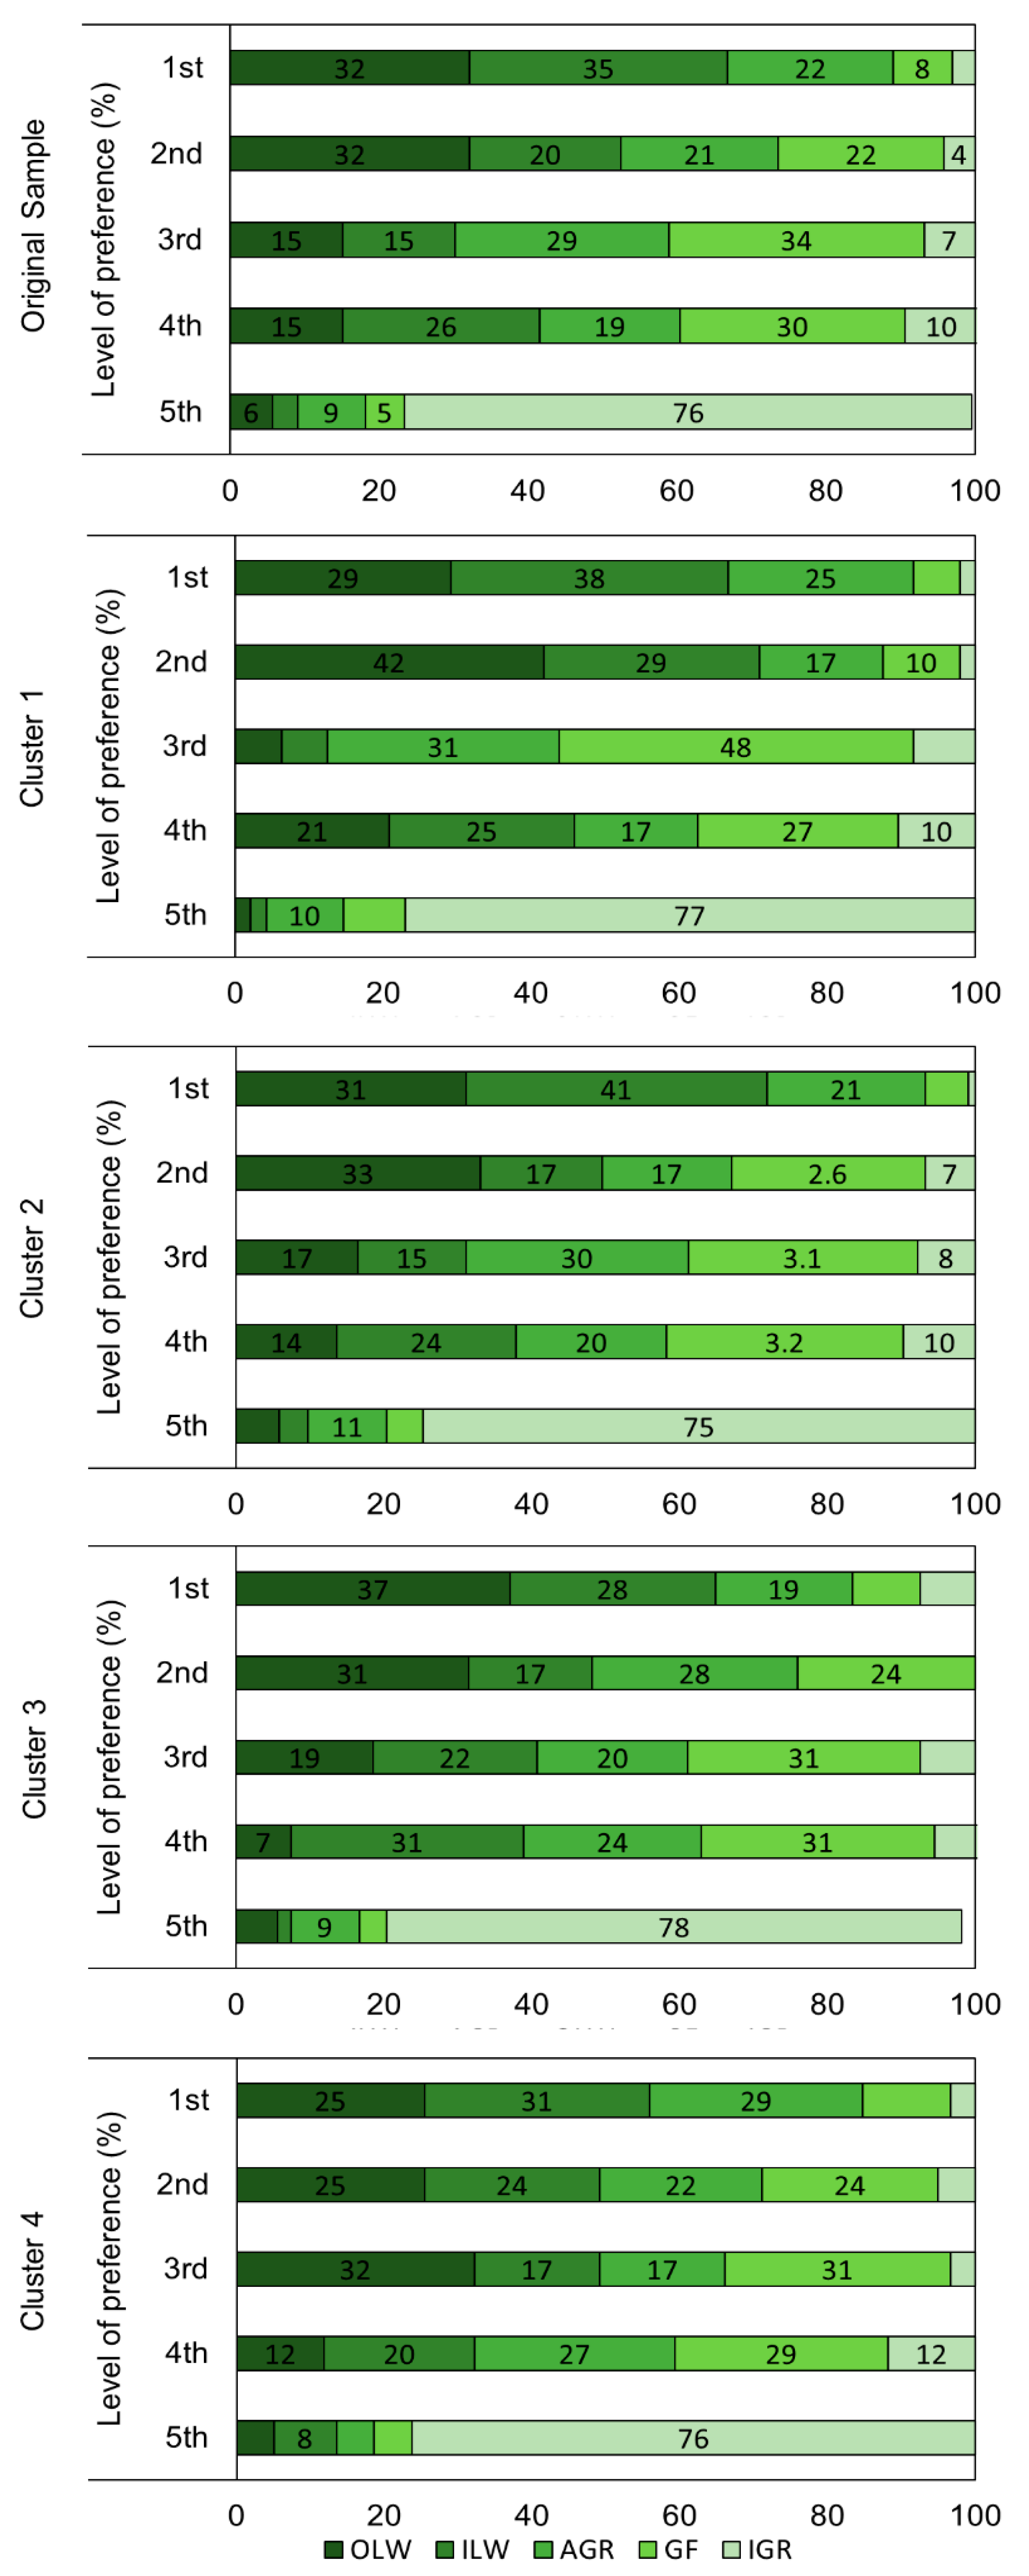
For the original sample, results show that the indoor living wall (ILW) and accessible green roof (AGR) are the most preferred green infrastructure typologies and did not differ significantly between both by Scott-Knott test (
p < 0.05) (
Table 8).
Preferred typologies indicated by respondents from Cluster 1 did not differ from the original sample. However, AGR appears most frequently (mode) as the first attractiveness option. Except for Cluster 4, the other groupings showed a similar behavior regarding the attractiveness ranking of the analyzed typologies.
Figure 9 illustrates the percentage distribution of responses for each analyzed Cluster. Green façades (GF) and inaccessible green roofs (IGR) are the least preferred typologies, respectively, for all clusters.
4. Discussion
This study aims to investigate the effects of green roofs and green walls associated with the decision-making process to select a hosting location. It was found that there were no significant correlations when the original sample was analyzed.
With the application of clustering analysis, four groups with different socio-demographic characteristics were identified. Cluster 1 includes “male urban individuals”; Cluster 2 includes “female urban individuals”; Cluster 3 includes “rural individuals”; and Cluster 4 includes “rural-to-urban migration people”. This approach allowed to explore different perceptions regarding GI that would not have appeared from assessing only the original sample.
In general, respondents from Cluster 1 answered more often lower ratings for all questions. This may lead to the conclusion that “male urban individuals” have less sensitivity towards the green infrastructure benefits and therefore it is not considered a factor in the decision-making process to select a hosting location. On the other hand, respondents from Cluster 2, composed mostly of women from urban areas, gave the highest scores for the same questions. Demonstrating a noticeable difference between the perceptions of men and women with similar environmental backgrounds. These results are in line with the reported by the literature which indicates that women have a modestly stronger environmental concern and sensitivity than men [
38,
39,
40]. In fact, in the green infrastructure’s “aesthetic improvement” and “sense of well-being” (
Figure 5), women (Cluster 2) have rated these elements with positive scores, while most men gave low importance to them. Moreover, these gender differences were identified as statistically significant by the Kruskal–Wallis test (
p-value < 0.05) (
Figure 6a,b).
The gender differences identified are backed by the gender socialization and identity theory, which argues that males and females acquire different values through their interaction with key agents of socialization in early childhood [
38,
61]. The pro-environmental behavior observed by women may be related to their socialization process. Moreover, biophilic elements tend to be perceived differently from individual to individual [
31,
54]. In general, women tend to have more likely to place importance on social and environmental concerns [
62,
63,
64], besides having higher emotional empathy [
65], which influence them to adopt environmentally friendly conducts. Thus, explaining the positive results found for Cluster 2 in terms of the individual well-being and aesthetic improvement, as well as the willingness to pay a higher daily rate and consider green roofs and green walls as a deciding factor to select a hosting location.
Regarding the environmental background, represented by Cluster 3 and Cluster 4, respondents gave similar ratings to the “aesthetic improvement,” “sense of well-being” and “strategy to solve urban environmental problems” given by green infrastructure. All of these items received positive scores, which was expected, considering the ecological systems theory developed by Bronfenbrenner (1979) [
66] that theorizes about the interaction between environment, individual perceptions and development. According to this theory, individuals develop through their environmental contexts and the interactions at multiple levels in a hierarchical structure of systems.
Both clusters are characterized by a childhood rural background. So, the adults’ sensitivity towards green infrastructure may be strongly influenced by their contact with nature during childhood. In this perspective, Evans et al. (2018) [
36] and Jensen and Olsen (2019) [
37] have argued that childhood experiences in nature are correlated to individuals pro-environmental behavior in adulthood. In other words, pro-environmental adults recall childhoods with intense interactions with natural environments as observed by Chawla and Derr (2012) [
67]. The findings of the study are in line with the latest and oldest studies about childhood connection with natural environments and their influences on adults’ perceptions [
34,
35,
36,
37].
Analyzing the variable “green infrastructure as a decision point for choosing a hosting location,” it was observed that most respondents gave positive scores. However, these values are notably lower than the “sense of well-being,” “aesthetic improvement” and “strategy to solve urban environmental problems” within the same cluster (as seen in
Table 7). This could be related to the specificities of this accommodation typology and target public. Youth hostels attract a specific traveler group [
68] that prioritizes cheaper lodging alternatives [
14] and preferer, in order: cleanliness, location, personal service, security and facilities [
15,
68,
69]. No specific studies were found focused on the influence of green infrastructure as a key factor to select a hosting location. Moreover, it is important to highlight that when the respondents classify the “green infrastructure as a decision point for choosing a lodging location”, hypothesis is considered when choosing two establishments with the same daily rate, not considering other services and hostel facilities. The given response compares only this variable.
Finally, the respondents’ willingness to pay for a higher daily rate in youth hostels with green infrastructure was assessed. Results revealed a low willingness to pay for most respondents. According to [
70], willingness to pay might be a parameter that is not perfectly correlated with people’s actual behavior, but it can indirectly determine whether they have any level of environmental commitment. So, the respondents from Cluster 2, who are notoriously more environmentally concerned, as pointed out earlier, are willing to pay more for these solutions.
Overall, the green infrastructure provided a sense of well-being and psychological restoration for most respondents. Which may be related to the aesthetic improvement caused by green infrastructure that could be the key factor that positively affects subconscious parts of the brain [
71]. These findings agree with the results from previous studies, indicating that even small green spaces have the potential to offer experiential and recreational benefits to the users [
46,
72].
5. Conclusions
The study aimed to improve the understanding users’ preferences for the green infrastructure implementation in youth hostels. The paper provides an overview of users’ perceptions and attempts to understand the feasibility of installing green roofs and green walls based on the response of 345 respondents. Combining factor analysis and clustering analysis, four homogeneous groups were identified.
Most of the participants support green infrastructure solutions in accommodation establishments. This suggests that travelers are aware that sustainable practices are important in the tourism accommodation sector. This could also be a significant differential factor to attract new guests. Greater feelings of well-being and local aesthetic improvement provided by green spaces could contribute as a decision point for choosing a hosting location, especially if the prospective guests are “female urban individuals,” “rural individuals” or “rural-to-urban migration people”.
Statistical analysis confirmed that sociodemographic factors significantly influence respondents’ views and perceptions. In general, women have greater environmental concern than men, which is reflected in their decision-making by pro-environmental practices. It is reflected, for example, in the decision-making process to select a hosting location and in the willingness to pay for green infrastructure solutions. Willingness to pay a high daily rate is relatively higher for “female urban individuals” (≃67%) than in the other groups.
The empirical results of this study contribute to a better understanding of respondents’ perceptions and preferences about green infrastructure and offer useful insights to help managers and owners in the decision-making process. Overall, findings contribute to understanding the opportunities related to green roof and green wall implementation in youth hostels and provide an opportunity for managers and owners to reflect about innovation, sustainability, new investment opportunities and their payback period. There is no strong evidence to suggest that green infrastructure solutions increase the number of hostel guests. However, implementing these solutions could be a differentiating factor in the hospitality market.
Furthermore, it should be noted that the results presented here are not irrefutable and, therefore, must be analyzed sparingly in order to make the most appropriate decision, observing the characteristics and limitations of each business.
On-site studies, before and after the implementation of green infrastructure, could provide more accurate results on the real effectiveness of implementing green infrastructure at the level of accommodation establishments and the investment payback time.
