1. Introduction
In today’s society, regional planning must unavoidably consider the future. In fact, it should be created in an orderly way to meet public necessities and not be ordained by a casuistic and uncontrolled progression from the point of political and individual investments. Therefore, sustainable development and growth are undoubtedly the regional territories’ main concerns and objectives [
1,
2,
3,
4,
5,
6].
In this regard, land-uses and territorial occupation variations are relevant at global, national, and regional level once they produce outcomes on biological, natural, and economic structures [
7,
8,
9].
Additionally, land systems incorporate all processes and activities related to the human use of the territories, including technological and organizational advances and classifications, the profits earned from land, and the unintended cultural and environmental consequences of societal activities [
8,
10,
11]. In fact, these systems have vital connections that lead to a shift in the land cover [
12,
13].
The Coordination of Information on the Environment CORINE Land Cover (CLC) is a European initiative launched in all countries of the European Community (EC) in 1985, supporting the gathering and analysis of geospatial data. It was established to pursue the following intentions: (a) obtain and synchronize interdisciplinary data on the state of the environment; (b) focus on priority areas in each EU country; (c) coordinate and coordinate the organization and management of data at the local and international level; and (d) guarantee the compatibility of the collected data.
In fact, it was a part of the Copernicus GIO Land Monitoring 2011–2013 program. In this regard, GIO-land is an operational project of the European Copernicus program that intends to provide several land cover datasets, employing satellite images that are updated every six years in almost all European nations.
The CLC database is a mechanism for executing complex spatial analysis based on different land use classifications. Thereby, CLC classes have three levels in their hierarchical structure. The first level covers the five main kinds of land-use and land cover (artificial areas, agricultural areas, forest and semi-natural areas, wetlands, and water bodies). The second level has fifteen departments. Finally, the third level includes 44 units that note that the methodological scope of individual-level three classes is strictly defined [
14,
15,
16,
17].
Contextually, the Geographic Information System (GIS) produces access to vast land data sources and monitors changes in land sustained by high-resolution analyses of land cover and evaluations of changes, particularly in urbanization areas [
18,
19,
20,
21]. These systems can also observe the changes in human activities and urban ecological land cover [
22,
23]. Moreover, Urban Atlas (UA) includes many more detailed data i.e., it classifies high-resolution satellite images (SPOT 2.5 m, ALOS 2.5 m, RapidEye 5 m), promoting the separation of significant coverage classes. The smallest mapping unit is 0.25 hectares with an estimated accuracy of 5 m, which supports the production of land cover maps for only 305 large European cities with a population of more than 100,000. Nevertheless, the UA comprises only 20 land cover classes, considerably less than CLC [
22].
According to Fadigas [
10]: “(...) land-use and regional occupation changes are vital signs of human activities over the autochthonous habitat”. Thereby, the evaluation of land-use changes has remained indispensable in many thematic fields, such as, spatial planning, regional and urban planning, territorial management and governance, ecosystems protection and conservation, strategic planning, economic, financial, and social, among numerous other disciplines [
24,
25,
26,
27].
Therefore, the following research question was formulated: Do the patterns and dynamics of land-use in the Autonomous Region of the Azores change in a notable trend in the last three decades?
Contextually, this research will analyze and evaluate the land-use changes and evolution dynamics in all the Islands of the Azores Region between 1990 and 2018, based on the CLC data.
In this regard, we reinforce that the present study will expect to contribute to science by enabling a collection of big data related to the land-use changes as well as an overview of how they evolved in the last three decades in the Azores Autonomous Region.
Consequently, evaluating these evolutionary patterns and dynamics allows us to present some guidelines and proposals for future regional planning and management strategies and policies to be produced and administered over the Azores Archipelago.
2. The Azores Region: A Brief Overview
The Azores were discovered and populated by the Portuguese in the 15th century and have since been Portuguese territory.
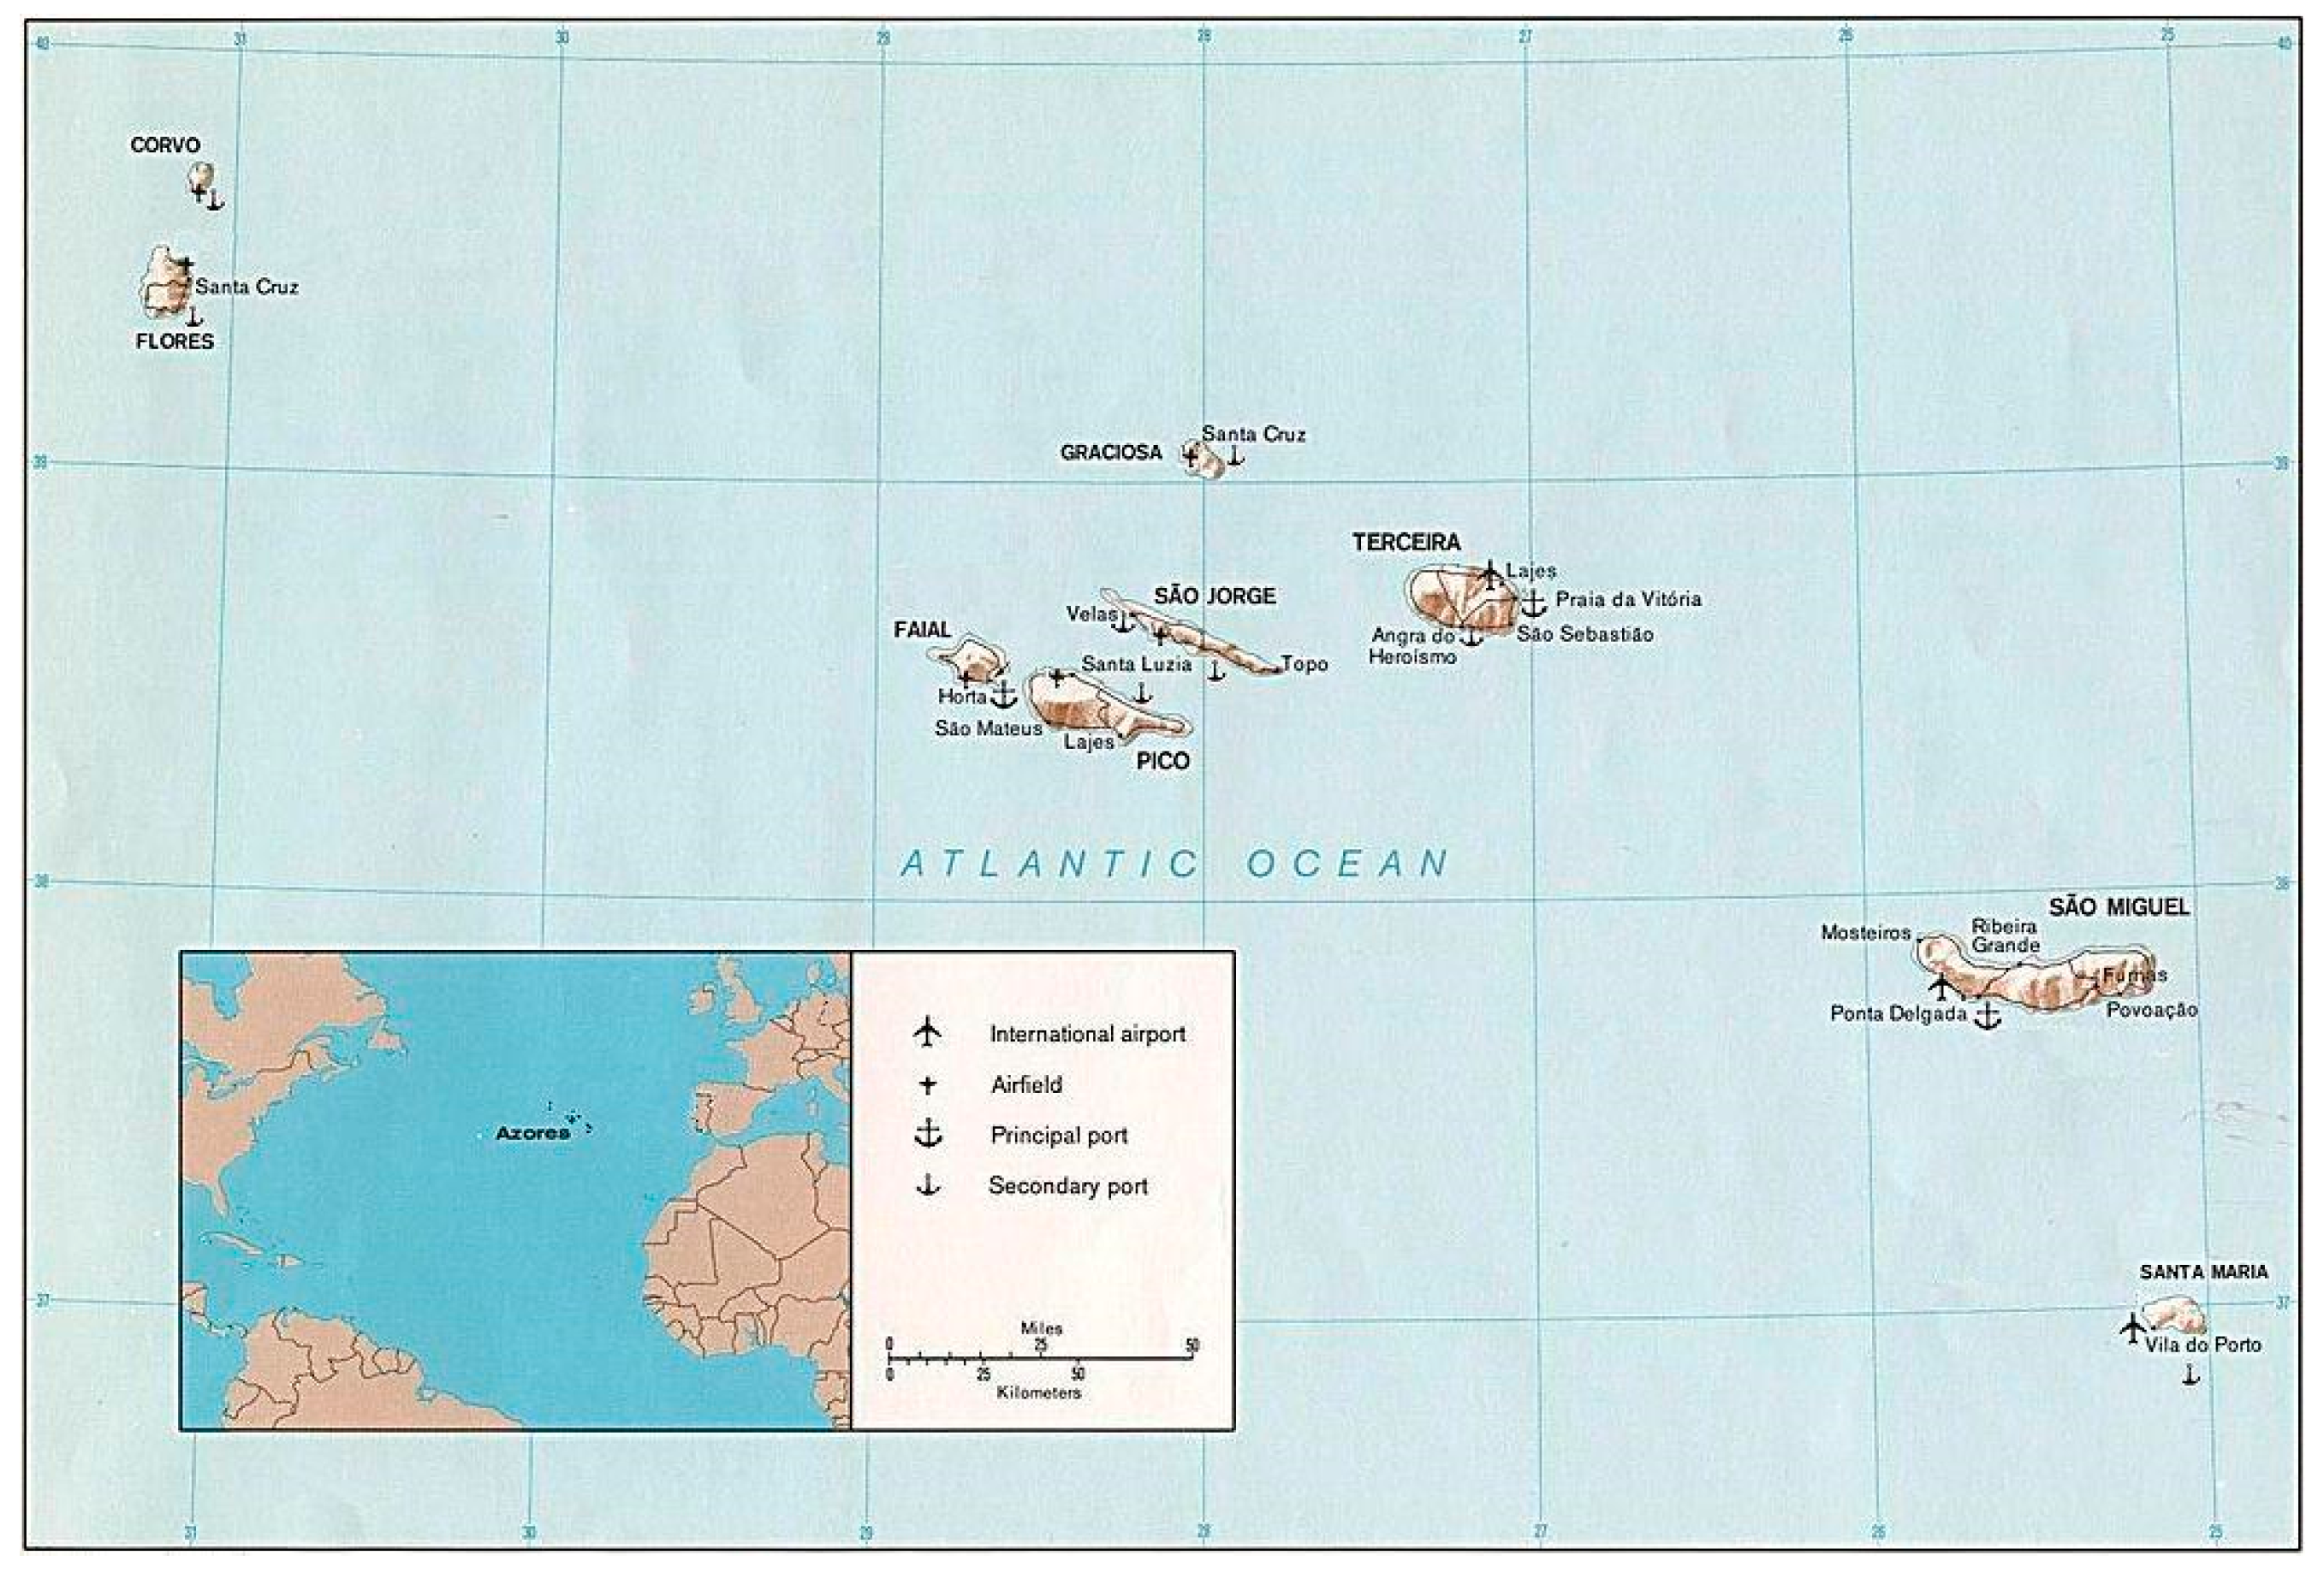
This Archipelago is in the Macaronesia Region, from the Greek “
makarón neseu” to designate the lucky ones (
Figure 1). Madeira, Cape Verde, and the Canary Islands are also included, all located in the Macaronesian biogeographic region. Comprised of nine islands, the Azores has a surface area of around 2322 km
2, corresponding to about 2.5% of the national territory (92,256 km
2).
These Vulcanic islands are grouped by geographical proximity in three groups (Eastern, Central, and Western), which show a variety of measurable surface and population, as shown in
Table 1, ordered in descending order by Area.
The three largest islands are São Miguel, Pico, and Terceira. These represent about 68.5% of the total area and about 85% of the Azores population. Population densities per km2 vary between 184 inhabitants on the largest island and 26 inhabitants on the smallest island. Among the 19 municipalities in the Azores, the largest is Ponta Delgada’s isle of São Miguel. Conversely, the smallest is Vila do Corvo. However, the lowest population density is on Flores Island.
Generally, the landscape of the Azores is characterized by a vigorous and busy orography, where the high altitude is associated with the rugged relief. The islands emerge sharply from the ocean, showing significant vertical development. The mountainous interior is furrowed by deep ravines, which tear the slopes down to sea level. The flat areas are poorly developed, with little representation in the island territory, emphasizing the west side of Santa Maria, the city of Ponta Delgada, graben of Ribeira Grande in São Miguel, and graben of Praia da Vitória in Terceira. The plateau regions can be summed up in the Central Plateau in Flores, in the Achada Plateau in Pico, and in the Graminhais and Furnas Achada Plateaus, both in the western half of São Miguel. The islands have differing maximum altitudes, ranging between 405 m in Graciosa and 2351 m in Pico, the highest point in Portugal. The islands’ landscapes often include magnificent lagoons that occupy the abatement craters of extinct volcanoes.
The occupation of the soil and its dynamics over time is based on the Regional Planning Plan for the Azores’ Territory [
29]. In this technical document, the primary objectives of sustainable economic and social development are translated into spatial terms. The impacts on the territory of the Azores result from four structuring systems: (i) Productive; (ii) Environmental Protection; (ii) Urban and rural; and (iv) Accessibility and equipment.
Concerning production systems, these represent the primary sources of income and employment generation, reflecting the endogenous capacity for economic support. In the case of the Azores, the emphasis is placed on the incidence and evolution of the agricultural and agri-food sector, the installed trends and prospects for qualification and diversification of the tourist sector, and extractive activities associated with civil construction.
The urban and rural systems represent the patterns and dynamics of urban occupation and rural settlement. Urban and rural settlement dynamics stand out in this context and the location, shape, and structure of urban agglomerations in harmony with urban expansion and housing dynamics. Therefore, it is possible to verify a tendency of slight population growth, the persistence of a high index of rurality in the population’s residence compared with average values in Portugal; besides, the predominance of relatively low population densities with small clusters.
Accessibility and equipment systems are part of the infrastructure, transport, communications, energy, and collective equipment networks. Here, the highlight goes to the need to provide a set of services (utilities, communications, and energy) and mobility conditions to populations, tourists, and economic agents, as a privileged instrument of cohesion and competitiveness policies.
The extension of the surface of ports and airports in the various islands of the Azores is connected with the size and population density of each of the islands. Exceptions made are those relating to the ports and airport of Terceira island, the largest extension of which is due to the presence of the Portuguese Air Force Air Base No. 4 and US 65th Air Base Group, as well as Santa Maria airport, as in the 1970’s this was the mandatory stopover for transatlantic flights.
Monteiro et al. [
30] present a reliable characterization of the Azorean territory occupation, which allows the following big picture to be extracted. Land use shows similar patterns in all the islands of the Azores, with emphasis on the installation of urban areas next to coastal regions; furthermore, the predominance of areas related to agricultural and pasture activities (about 48.8% of the Azores area), as well as forests and natural environments (about 42.6% of the Azores area) exists between these areas and the interior of the islands. This reality is reflected in the fact that the region’s main economic activity is agriculture and livestock, with this sector being responsible for about 9% of the wealth generated in the Azores and for about 10% of total employment [
31].
The territorial areas in which the forest and natural vegetation have greater representation are those where there is a protection status, attributed under the Regional Network of Protected Areas or the Natura 2000 Network, contributing to the conservation of biodiversity, strengthening the claim of Azores as a nature destination. Here, the Western Group islands assume a considerable weight, and São Jorge and Pico, with the surface’s occupations by agricultural areas as natural pastures and landscapes and the forest and natural vegetation of around 60%.
Concerning the lagoons, as they are typically points of relevant interest for tourist activity, they are only represented on three islands: Corvo, São Miguel, and Flores, with 1.89%, 1.15%, and 0.69% of the territory’s surface of the Azores, respectively. However, except Graciosa alone, all other islands have inland water bodies of appreciable beauty.
There is a significant increase in urban areas in evolutionary terms, reflecting the urban growth that has been witnessed in recent years. The agricultural and pasture areas have decreased in recent years, considering that in the 1990s they represented more than 50% of the Azores area. On the other hand, there was an increase in forest areas and natural environments, when in the middle of the 1990s, they represented nearly 30% of the Azores’ territory.
Regarding the artificial occupation of the territory, the urban occupation, about 3.4% of the surface of the territory of the Azores, is characterized mainly by discontinuous urban fabric, representing 67% of the total urban fabric of the Azores. Only on the largest island, São Miguel, is the continuous urban fabric predominant, at around 59%. Industry, commerce, general equipment, and infrastructure only represent 0.44% of the Azores’ surface’s total occupation. The islands with the greatest relative implantation of this economic activity are São Miguel and Terceira, the Azorean economy engines. At the same time, Pico and Flores present minor relative implantation.
Moreover, all islands have one or more port infrastructures representing on average 0.06% of each island’s surface area. Likewise, all islands have an airport infrastructure that means on average 0.4% of each island’s surface area. Santa Maria and Terceira, with 3.15% and 0.77% of the total surface area, respectively, are the exception. In the first case, this was due to the airport being the longest runway in the Azores, that served as a technical stopover for all transatlantic aviation in the 1970s. In the second case, for, in addition to civilian use, assuming the role of Portuguese Air Force Air Base No. 4 and US 65th Air Base Group. Road and narrow paths prevail in the road network, with highways 20 or more meters wide only in São Miguel and Terceira, representing 0.28% and 0.17% of each of these islands’ surface occupation. The areas of extraction of mineral masses, waste management, and construction present in all islands represent 0.37% of the Azores’ total area. Urban green spaces (only present on the islands of São Miguel, Terceira, and Santa Maria), sports, cultural, tourist, and leisure facilities (present on all islands except Corvo), represent 0.21% of the total area of the Azores.
3. Methodology
The areas analyzed are all the islands of the Azores archipelago. The data analyzed are land-uses for these islands during 1990, 2000, 2006, 2012, and 2018. This data is obtained from the Corine Land Cover offered by the European Environmental Agency [
32]. The information is in vector format, using polygons that evoke the different land-uses classified into three hierarchical levels using 44 classes, according to the European Environmental Agency (
Table 2).
Another layer of information used was the delimitation of each of the Azores’ islands, obtained from Eurostat. The visual information is also vector represented by polygons that evoke the boundary of each of the islands that make up the Azores islands. The three analysis components that can be managed by a Geographic Information System (GIS) are the thematic, temporal, and spatial components. In this regard, to analyze the variation of land-uses in the Azores islands over a series of years, it was necessary to establish a constant spatial component since the islands’ location will always be the same. It will still be analyzed in the same area of study. The analyzed data, both graphical and alphanumeric, have an exact adjustment, avoiding other settings such as fuzzy adjustment. The temporal component was controlled, as land-uses were analyzed in 1990, 2000, 2006, 2012, and 2018. Finally, the thematic component was free without any conditions. In this way, land-uses could vary freely over the years analyzed and always in the Azores Islands.
After all the information was obtained using the two layers, the analysis was performed using ArcGIS 10.5 software. Initially, clipping was performed according to the boundary layer of the islands on the land-use layer. In this way, a resulting layer was obtained as graphical information and polygons, and as alphanumeric information, the CLC codes of land-uses on each of the islands. A new field was then added to the table obtained for the resulting layer, where a geometric calculation was subsequently performed regarding the surface contained in each of the polygons referring to land-uses. The result was a layer where, among other fields, appeared one referring to land-uses according to the CLC code and another that showed the area in hectares measured according to the GIS. However, it was necessary to perform grouping queries according to the codes set out in
Table 2 to group the obtained polygons according to the categories: 1. Artificial surfaces, 2. Agricultural areas, 3. Forests and semi-natural areas, 4. Wetlands, and 5. Water bodies.
Subsequently, selection queries selected all polygons corresponding to land-uses grouped into the categories above. Finally, total inquiries also resulted in the sum of land-uses for each of the above categories. In each of the years analyzed, the same procedure was performed repetitively. Therefore, the process was repeated up to five times. It was also considered appropriate to obtain the thematic mapping to identify where the different uses of the soil are located and where there is an evolution. To obtain the thematic information, a thematic classification was first carried out by a single symbol using the field referring to the CLC code on land-uses. Once this thematic classification was carried out, all land-uses were grouped into the categories: 1. Artificial surfaces, 2. Agricultural areas, 3. Forests and semi-natural areas, 4. Wetlands, and 5. Water bodies. Finally, a color was assigned to each of the above categories. It was possible to differentiate each of these land-uses on each of the islands in a semiotic way. This repetitive process was carried out for each of the years analyzed.
4. Results
According to the categories analyzed, it was possible to group the values. Therefore, the amount of land occupation has been determined in each of the years studied for each of the nine islands of the Azores Archipelago (
Section 4.1). Thereby,
Section 4.2 enables us to understand how the land-uses changed in the Archipelago, creating a summary of the nine analyzed islands.
4.1. Island by Island Analysis
By analyzing
Table 3, it is possible to verify the evolution of land-uses in Corvo island between 1990–2018. In the analyzed period, most of the focused land-uses in Corvo´s island stay stable. In aggregate, changes came only from artificial surfaces (CLC-1) 40.38% increase and agricultural areas (CLC-2) 1.33% decrease. Only CLC-112 (Discontinuous urban fabric surfaces) and CLC-243 (Land principally occupied by agriculture, with significant areas of natural vegetation) have expanded their surface up to 40.38% and 6.34%, respectively. Note CLC-242 (Complex cultivation patterns) retrieved data only in 1990, suggesting in the following years a reconversion to CLC-243 and mainly to CLC-112. The remaining land-uses stayed stable.
Through
Table 4, it is possible to comprehend the evolution of land-uses in Faial island between 1990–2018. On this island, the results show a tendency of increase in several land-uses, mainly within artificial surfaces (CLC-1), which increased 346.60%. One of the most evident was the abrupt increase up to 425.68% in urban fabric (CLC-11), all discontinuous urban fabric surfaces (CLC-112), and increase up to 63.97% in industrial, commercial, and transport units (CLC-12), spread between CLC-121 (industrial or commercial units) and CLC-123 (Port areas). On the other hand, Agricultural areas (CLC-2) shows a 7.83% decrease, with reconversion between CLC-242 (Complex cultivation patterns) 39.70% decrease and CLC-243 (Land principally occupied by agriculture, with significant areas of natural vegetation) 14.10% decrease and CLC-211 (Non-irrigated arable land) 57.7% increase and CLC-231 (Pastures) 7.73% increase. Within 1.13% increase in forest and seminatural areas (CLC-3), some reconversion occurs, mainly between CLC-333 (Sparsely vegetated areas) 45.14% decrease and CLC-313 (Mixed forest) 173.42% increase.
Regarding the evolution of land-uses in Flores island (
Table 5) in the analyzed period (1990–2018), note a 46.63% increase in artificial surfaces (CLC-1) and a 6.07% decrease in agricultural areas (CLC-2). Again CLC-112 (Discontinuous urban fabric) is responsible for the highest increase, 31.10%. A slight decrease in agricultural areas (CLC-2), a consequence of heterogeneous agricultural areas, comes mainly from CLC-243 (Land principally occupied by agriculture, with significant areas of natural vegetation) 21.65% decrease compensated by 3.63% CLC-231 (Pastures) increase. Forest and seminatural areas (CLC-3) 3.05% increase came from a significant reconversion within, essentially between 10.16% increase in the forest (CLC-21) and CLC-333 (Sparsely vegetated areas) vanish in 2018. Shrub and herbaceous vegetation associations (CLC-32), while stable as a whole, faced reconversion between CLC-322 (Moors and heathland) 14.54% decrease and CLC-321 (Natural grassland) 19.00% increase and CLC-324 (transitional woodland shrub) 5.88% increase. There was also a slight increase in wetlands (CLC-4) caused exclusively by CLC-412 (Peatbogs) and no changes in water bodies (CLC-5).
Table 6 shows the evolution of land-uses in Graciosa island in the years 1990 to 2018. In Graciosa island, artificial surfaces (CLC-1) and forest and seminatural areas (CLC-3) increased 54.52% and 29.03%, respectively. Agricultural areas (CLC-2) decreased by 7.23%. Once more, discontinuous urban fabric surfaces (CLC-112) show a considerable 65.59% expansion between 1990–2018. Forest (CLC-31) and shrub and herbaceous vegetation associations (CLC-32) increased by 23.38% and 36.57%, respectively. We believe the decrease in agricultural areas (CLC-2) occurred mainly by reconversion of CLC-221 (Vineyards) 68.91% and CLC-231 (Pastures) 13.46% decreased into CLC-112, CLC-31, and CLC-32. Moreover, very high fluctuance with adequate justification was identified in the CLC- 124 (Airports), CLC-211 (Non-irrigated arable land), CLC-231 (Pastures), CLC-242 (Complex cultivation patterns), CLC-311 (Broad-leaved forest), CLC-312 (Coniferous forest), and CLC-322 (Moors and heathland), with the year 2000 showing outlier values by far, denoting a potential measurement error in that year. Graciosa island shows no wetlands (CLC-4) and stable water bodies (CLC-5) along the analyzed period 1990–2018.
If we focus on
Table 7, it is possible to follow the evolution of land-uses in Pico island from 1990 to 2018. Once more, we verify a considerable growth in CLC-112 (Discontinuous urban fabric) (105.92%). Nevertheless, in Pico´s island, the highest growth was identified in CLC-221 (Vineyards), with 123.26% of the variance between 1990 and 2018. Thus, the considerable increase in CLC-221 between 2012 and 2018 and the enormous growth in CLC-124 (Airports) between 2000 and 2006 allow straight flights from outside the Azores. Another point to consider is the high growth in CLC-412 (Peatbogs) between 2012 and 2018. On the contrary, the highest decrease corresponds to CLC-312 (Coniferous forest) and CLC-121 (Industrial or commercial units). Probably forest and seminatural areas (CLC-3) decrease in favor of other land-uses such as CLC-221 (Vineyards) and CLC-112 (Discontinuous urban fabric). If it had been the case, human action would have enormous on the island. Even though the CLC-121 (Industrial or commercial units) land-use decreased by 28.77%, the two highest increase is land-use of anthropogenic origin. Besides, apart from a CLC-313 (Mixed forest), a significant increase of 25.76% between 1990 and 2018, a 7.56% decay occurred from 2012 to 2018.
Table 8 enables us to follow the evolution of land-uses in São Jorge island between 1990–2018. In this island, the results show a strong dynamic on the land occupation surface over the analyzed years, with many decreases, increases, and some stability. Regarding the land occupation surfaces that occurred in São Jorge, artificial surfaces (CLC-1) and forest and seminatural areas (CLC-3) increased by 222.83% and 3.67%, converted mainly from reductions in agricultural areas (CLC-2) and wetlands (CLC-4) by 4.33% and 11.81%, respectively. Within agricultural areas (CLC-2) global decrease, some conversion occurred mainly between CLC-243 (Land occupied by agriculture, with significant areas of natural vegetation) 9.53% decrease, CLC-231 (Pastures) 3.59% increase. Within forest and seminatural areas (CLC-3) global increase, also some changes occurred mainly between forest (CLC-31) 4.73% increase, shrub, and herbaceous vegetation associations (CLC-32) 4.90% increase, both converted from open spaces with little or no vegetation (CLC-33) 44.86% decrease due to CLC-333 (Sparsely vegetated areas) 2018 disappearance. Within shrub and herbaceous vegetation associations (CLC-32), some land-uses were converted between CLC-323 (Moors and heathland) 10.86% increase, and CLC-321 (Natural grassland) and CLC-324 (Transitional woodland shrub surfaces) decreased by 11.29% and 8.63%, respectively. It is also possible to highlight increases in CLC-112 (Discontinuous urban fabric) by 243.80%, CLC-124 (Airports) by 126.89%, and CLC-322 (Moors and heathland) by 10.86%. However, CLC-112 presents a considerable dynamic over the years, being the highest increase in 2006, compared with 2000, and obtaining the highest amount of surface in its kind between 2006 and 2012. Even if the last period shows a slight 2.30% decrease, between 1990 and 2018, it shows a 3-digit increase. A similar situation occurs in CLC-324 (Transitional woodland shrub surfaces), however, with more sustained growth since 1990, but with a more substantial decrease from the highest period (2012) to the last analyzed period (a reduction of 22.30%). Focusing on remaining land occupation surfaces decreases in São Jorge, the most relevant (from the years 1990 to 2018) were found in CLC-242 (Complex cultivation patterns), with a reduction of 30.93%; followed by CLC-412 (Peatbogs), with a decrease of 11.81%. Let us consider the period between 2000 and 2018. There were also some relevant decreases in the land occupations that should be noted, as is the case of CLC-321 (Natural grassland) and CLC-333 (Sparsely vegetated areas).
Table 9 shows the evolution of land-uses in São Miguel island in the analyzed period (1990–2018). In the Azores largest island, where approximately half of the Azoreans live and lies most of the economic activity, several land occupation increases were verified from 1990 to 2018, as is the cases of CLC-112 (Discontinuous urban fabric), CLC-121 (Industrial or commercial units), CLC-131 (Mineral extraction sites), CLC-211 (Non-irrigated arable land), CLC-311 (Broad-leaved forest), with growths of 68.0%, 111.4%, 296.6%, 23.5%, and 23.56%, respectively. On the other hand, it was also possible to verify many decreases. Considering the decrease in the land occupation surfaces from 2000 to 2018, two typologies of surfaces should be highlighted: CLC-132 (Dump sites), CLC 243 (Land principally occupied by agriculture, with significant areas of natural vegetation) and CLC-321 (Natural grassland), with reductions of 12.24%, 21.10%, and 17.31%, respectively.
São Miguel island does not have any wetland (CLC-4) surfaces. During the 1990–2018 period, artificial surfaces (CLC-1) and forest and seminatural areas (CLC-3) raised 67.31% and 4.97%, mostly came from agricultural areas (CLC-2) 5.38% decrease. Within agricultural areas, some conversions occur between a 14.91% decrease in heterogeneous agricultural areas (CLC-24) and a 23.53% increase in arable land (CLC-21). Within forest and seminatural areas, shrub and herbaceous vegetation associations (CLC-32), mainly CLC-321 (natural grassland) and CLC-324 (Transitional woodland shrub) get converted into the forest (CLC-31), mainly in favor of CLC-311 (Broad-leaved forest) and CLC-312 (Coniferous forest).
If we considered the decreases in 2006–2018, we should emphasize the CLC-133 (Construction sites) and CLC-312 (Coniferous forest), with 55.29% and 5.97% reductions. Finally, if we consider the period between 2012–2018, significant reductions were also found in the CLC-141 (Green urban areas), CLC-242 (Annual crops associated with permanent crops), and CLC-324 (Transitional woodland shrub), with decrease variations of 14.27%, 8.259%, and 19.97%, respectively.
Table 10 shows the evolution of land-uses in Santa Maria island in the analyzed period (1990–2018). Santa Maria island, similar to São Miguel island, both the most southeastern islands of the Azores, does not have any wetland (CLC-4) surfaces. Artificial surfaces (CLC-1) 30.58% rise and forest and seminatural areas (CLC-3) 3.71% rise came from agricultural areas (CLC-2) 4.47% drop. There are 20 different land-uses registered according to the CLC classification. In this regard, although there are six land-uses without changes and five land-uses with slight differences. The other land-uses suffer a high variation. This one corresponds to CLC-313 (Mixed forest) with a growth of 173.92% for the highest increase. Secondly, the land-use CLC-313 increases 123.06%. These two figures indicate that the anthropogenic action has been higher and higher from 1990 to 2018 on the island. On the contrary, the highest decrease corresponds to CLC-131 (Mineral extraction sites) with a decrease of 54.27%, appearing to get converted into. The second highest diminution is for CLC-243 (Land principally occupied by agriculture, with significant natural vegetation areas). However, if it is compared with the previous land use, the variation will be considered very slight since it is a 14.66% decrease. Within artificial surfaces (CLC-1) increase, apart from a slight 4.06% decrease in CLC-124 (Airport), main mine dump and construction sites (CLC-13) decrease seams to get transformed into industrial, commercial, and transport units (CLC-12). Within agricultural areas (CLC2) decrease, all come from heterogeneous agricultural areas (CLC-24), even if some increase occurs in arable land (CLC-21) and pastures (CLC-23), very similar to São Miguel. Forest and seminatural areas (CLC-3) all within land-uses increased, except the 7.49% CLC-321 (Natural grassland) 7.49% decrease.
Finally, through
Table 11, it is possible to comprehend land-use evolution in Terceira island in the analyzed period (1990–2018). On this island, we found many changes, with several increases, decreases, and some stability in the land occupation surfaces during the analyzed periods. In aggregate, artificial surfaces (CLC-1) 82.50% increase, agricultural areas (CLC-2) 2,7% increase, and wetlands (CLC-4) 29.33% increase, all converted from the forest and seminatural areas (CLC-3) 2.23% decrease. Starting with the most increasing surface occupations from 1990 to 2018, the following land-uses should be emphasized: CLC-312 (Coniferous forest), CLC-131 (Mineral extraction sites), CLC-112 (Discontinuous urban fabric), CLC-211 (Non-irrigated arable land), and CLC-121 (Industrial or commercial units), with growths of 178.46%, 153.17%, 108.34%, 61.34%, and 55.74%, respectively.
Regarding the land occupation higher decreases in the period of 1990–2018, the following land-uses should be highlighted: CLC-321 (Natural grassland), CLC-412 (Peatbogs), CLC-242 (Complex cultivation patterns), CLC-313 (Mixed forest), and CLC-221 (Vineyards), with decrease variations of 59.9%, 54.7%, 48.8%, 47.7%, and 29.6%, respectively. Focusing on the reductions of the land surfaces from 2000 to 2018, there were significant decreases in CLC-242 (Complex cultivation) with a variation of 48.53%, and CLC-313 (Mixed forest) with a variation of 60.21%. Furthermore, for CLC-133 (Construction sites) through the Corine data, for Terceira´s Island, it was only possible to obtain the values for the years 2000 and 2006; thus, we believe this land-use appears from agricultural areas (CLC-2) conversion, and after 2006 was integrated into other land-uses within artificial surfaces (CLC-1). Within agricultural areas (CLC-2), 3.72% decreases the 61.34% and 3.47% only increases in CLC-211 (Non-irrigated arable land) and CLC-243 (Land principally occupied by agriculture, with significant areas of natural vegetation) should be noted, mainly from conversion of CLC-221 (Vineyards) 29.55% decrease and CLC-242 (Complex cultivation patterns) 48.80% decrease.
4.2. Summary of the Analysis
Contextually, a summary of the land-use occupation dynamics (from 1990 to 2018) was carried out to obtain an overview of this issue on the entire Archipelago.
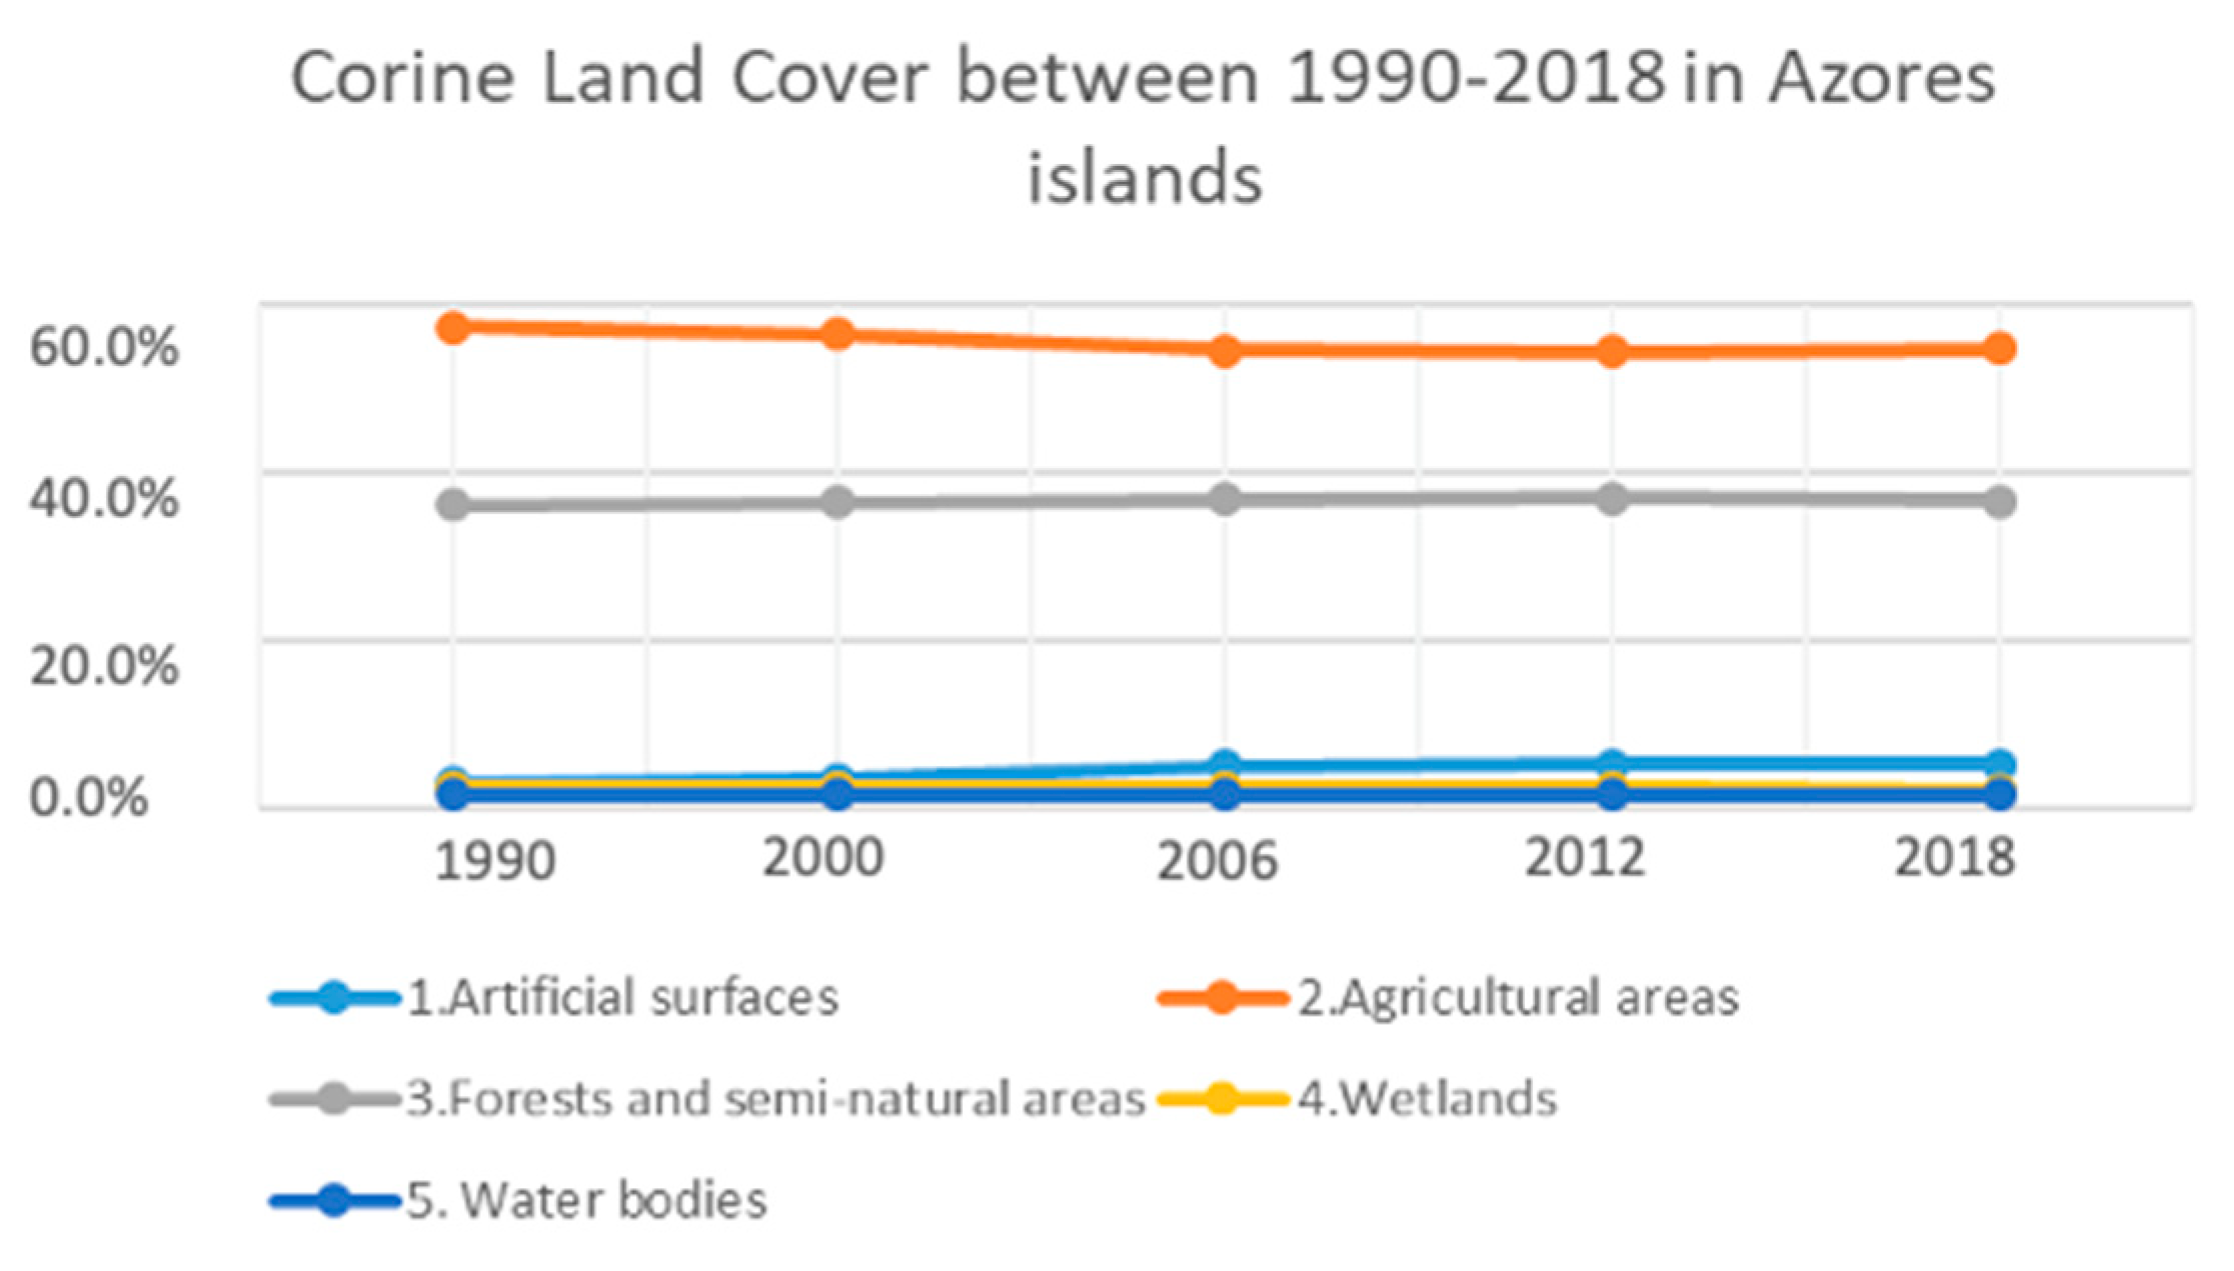
Thus, through
Table 12 and
Figure 2, it is possible to verify no significant alternations of values according to their position in each analyzed year. In other words, the maximum values are always the most numerous, going through intermediate values and reaching the minimum values. In this regard, the most considerable amount corresponds to Agricultural areas in all years. Therefore, it could be said that land occupation is primarily used for agricultural production in the Azores islands. On the contrary, the use of minority soil is the responsibility of Waterbodies. As a result, it could be established that bodies of water are scarce within the islands. It can even be seen in
Table 12 that very close percentage values correspond to Wetlands and Artificial surfaces. In this way, it could also be established that there are little wetlands, water bodies, and artificial surfaces on the islands. Therefore, there is little activity in the generation of artificial surfaces. Among the maximum and minimum values, those corresponding to Forests and semi-natural areas are set as intermediate values, which are considerably higher than the land-uses referred to as Artificial surfaces. Therefore, from the forest and semi-natural soil areas, it could be said that the values of occupation of land use according to the categories analyzed are no longer residual.
Concerning the evolution of land-uses according to the years analyzed, in
Figure 2, taking into account the higher values, it can be seen that the evolution of agricultural areas is reduced as the years pass until 2012. Between 2012 and 2018, it seems to have remained approximately constant, and there even appears a slight increase. The land-uses referred to as Forest and semi-natural areas seem to be roughly constant. Although there are indeed little ups and downs in the analyzed values, they are tiny. Regarding the smallest water bodies, values always remain stable over the years. Therefore, there has been no increase or decrease in all of these land-uses. Although it can be seen slightly, there is a slight decrease in land-uses corresponding to Wetlands. A contrary trend observed for Artificial surfaces that seems to increase values over the years slightly. Above all, the recovery of wetland surfaces is due for use in agriculture, forestry, and, in rare cases, artificialization.
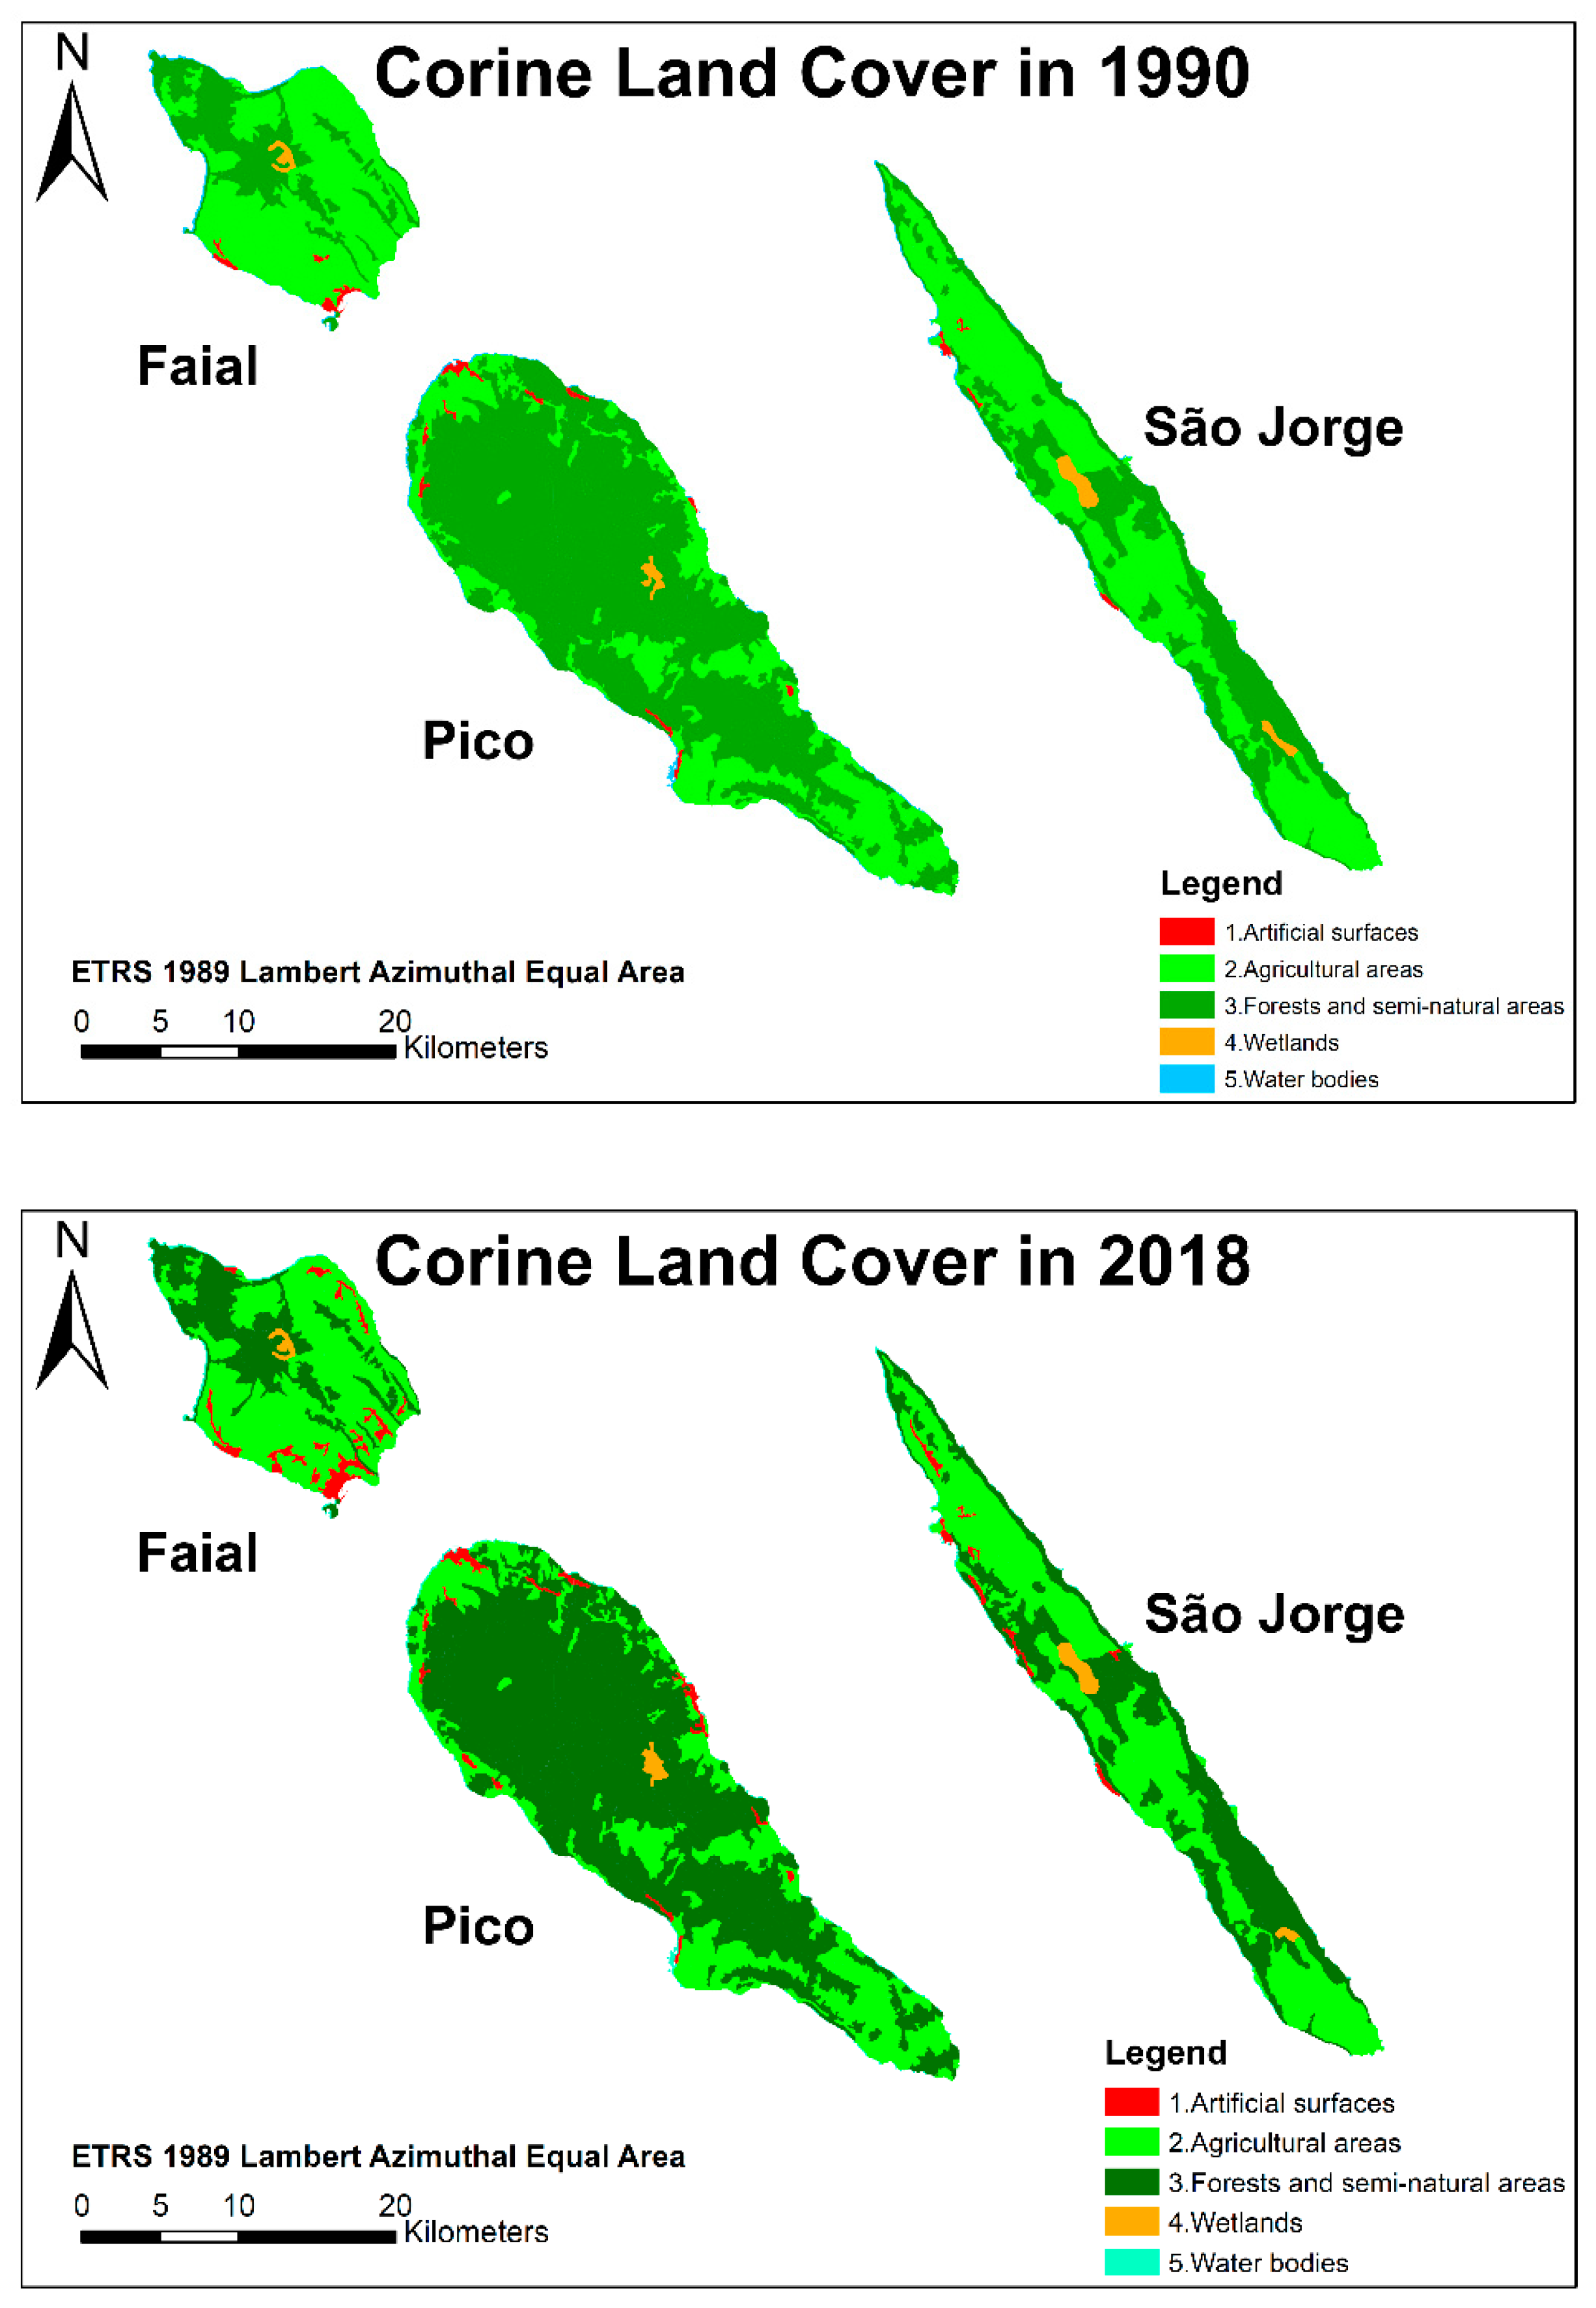
The thematic cartography of
Figure 3 gives us a clear view of the distribution and identification of each of the soil use groups analyzed. Starting in 1990, we can see that agricultural areas predominate on Faial and São Jorge’s island. However, Pico Island predominates the land-uses corresponding to Forest and semi-natural areas. Also, this predominance of land-uses is maintained over the years. However, it stands out that on the island of Faial, there has been a considerable increase in areas corresponding to artificial surfaces in the southwest of the island.
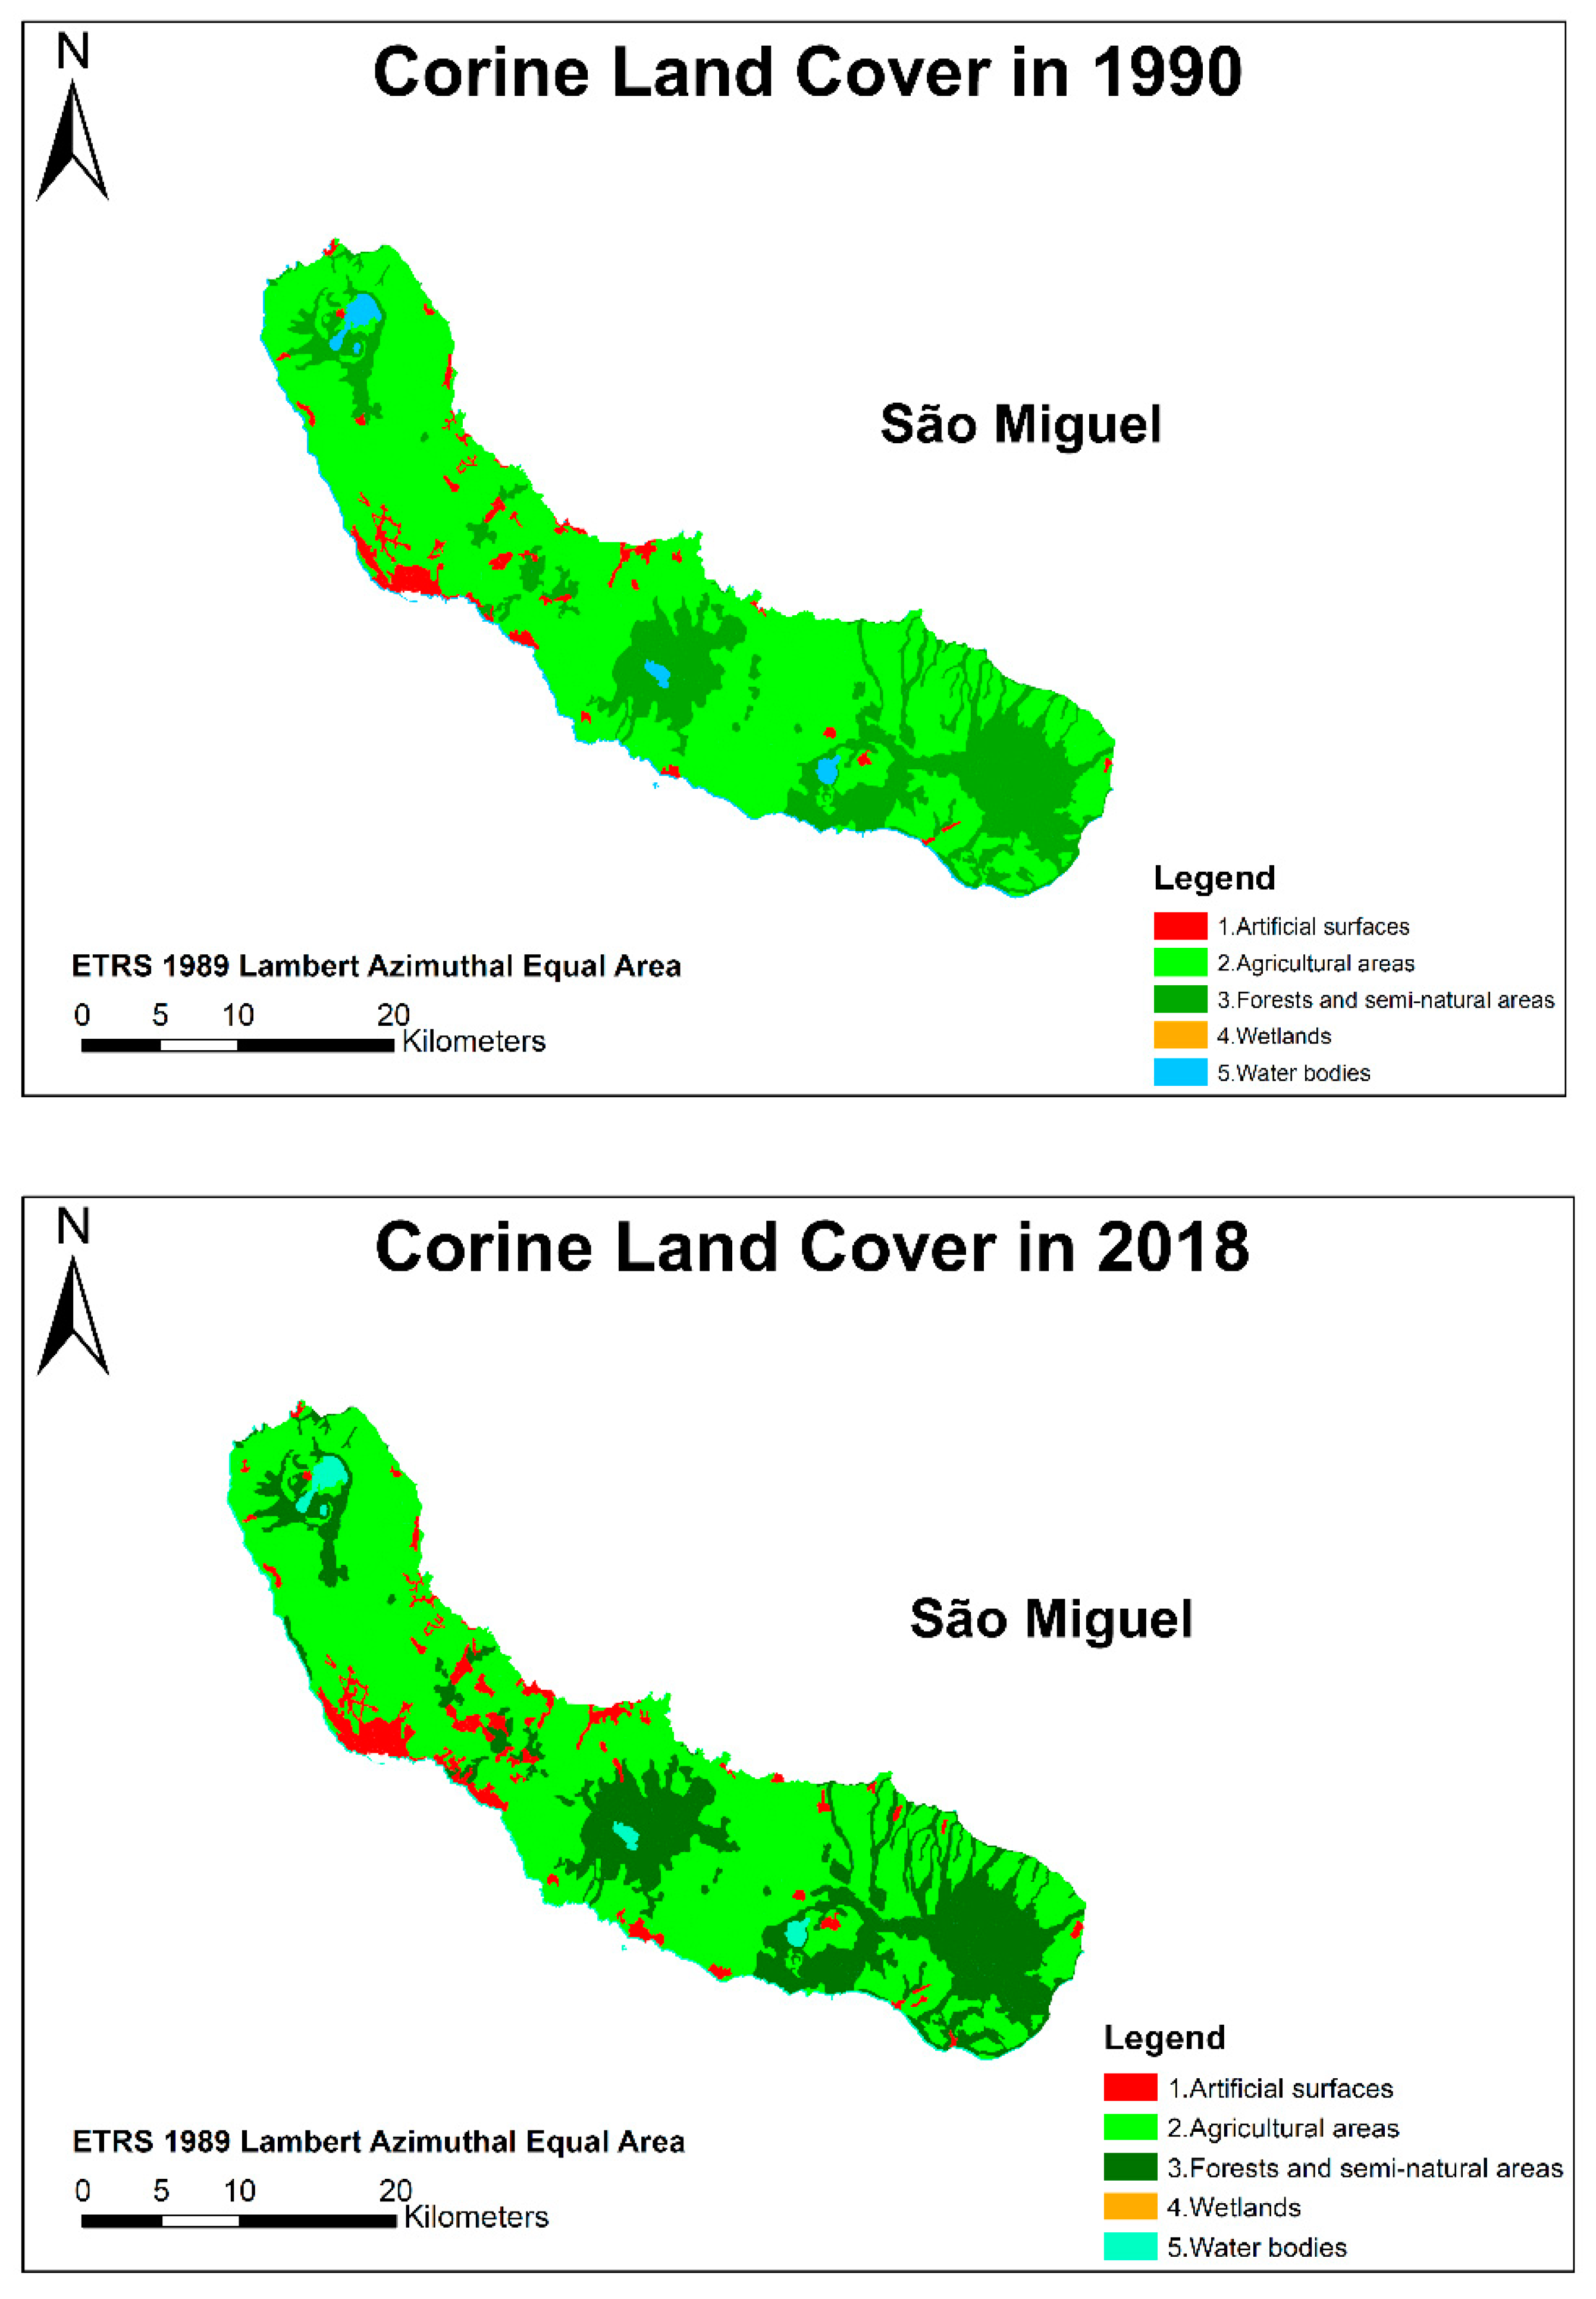
Also, from
Figure 4, we can observe how agricultural land is a predominant land use along with forests and semi-natural areas. Moreover, there is a high quality of the natural environment of the island related to existing vegetation. Besides, that there are already (from 1990) red spots corresponding to artificial surfaces that were expanded over the years (to 2018) especially in the northern half.
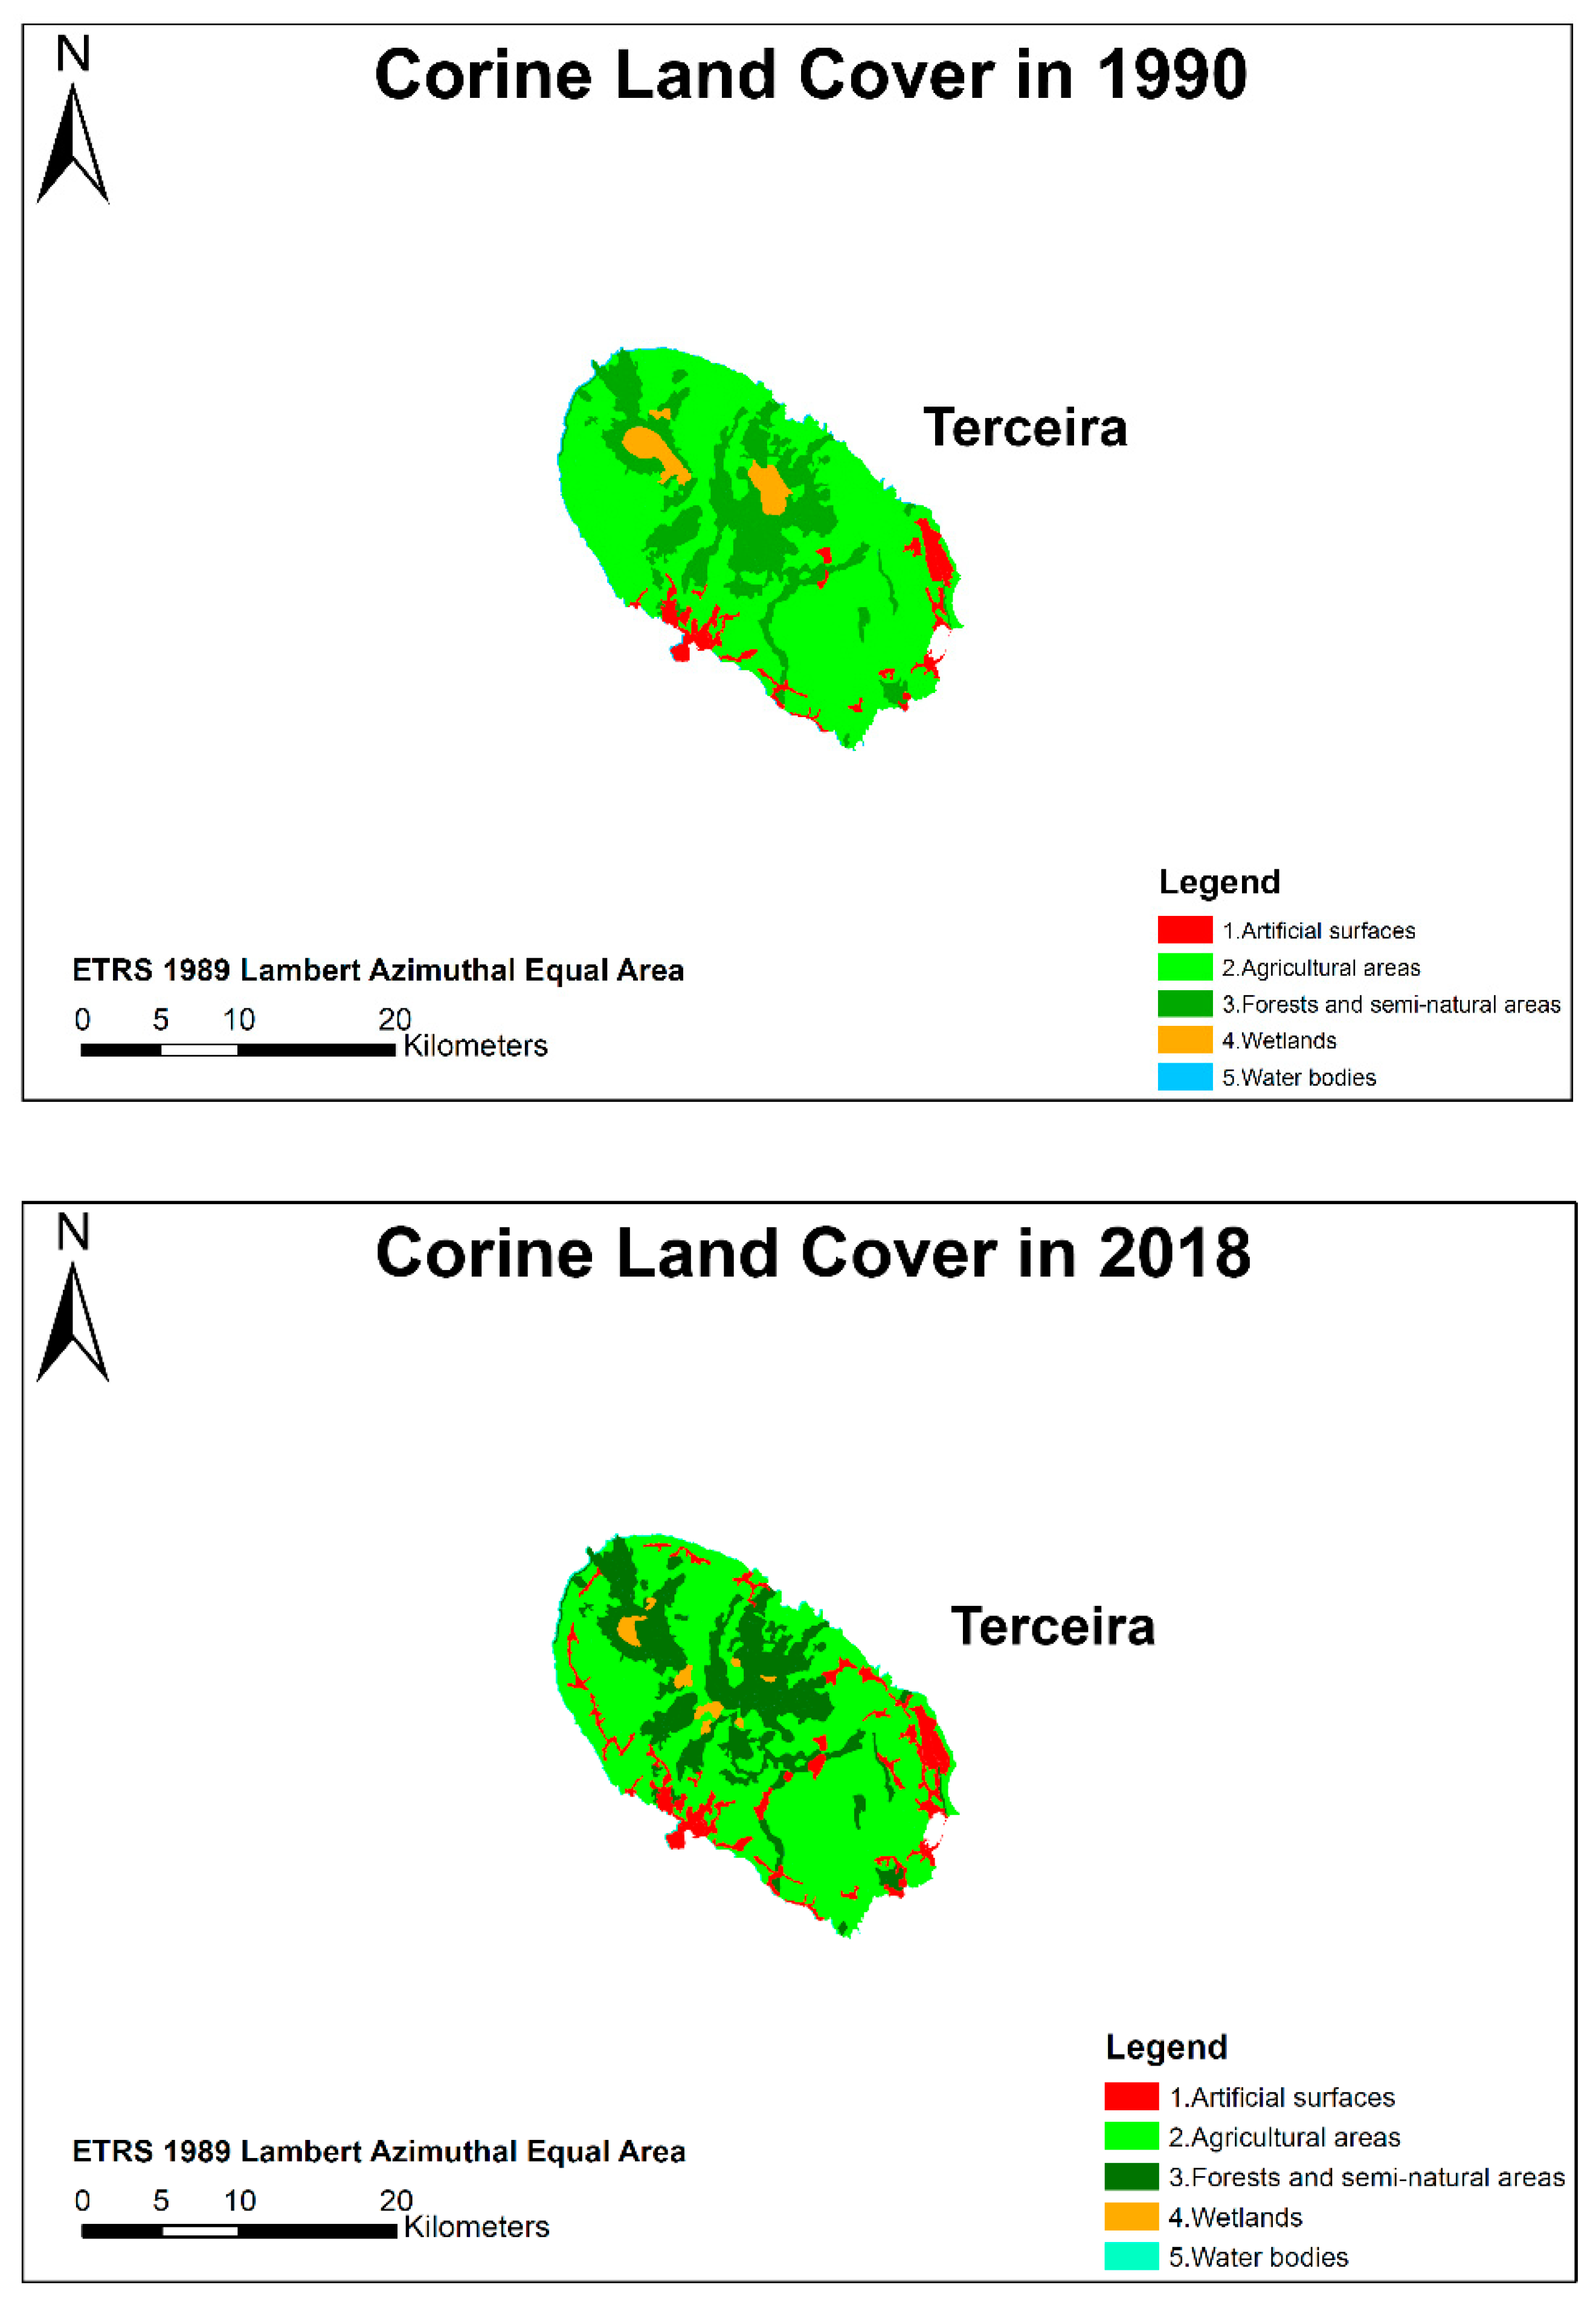
Moreover, from
Figure 5, we can see that most of the soil on the island of Terceira corresponds to agricultural areas followed by forest and semi-natural areas. Therefore, it can be said that there is a high quality of the natural environment on the island. Also, in 1990 are already appreciable red spots corresponding to artificial surfaces that progressively enlarge. These are more considerable in the southern half of the island and around lines that correspond to communication routes such as roads.
5. Discussion and Conclusions
The actual Azorean landscape results from a profound humanization that took place over five centuries. In fact, these landscapes show dynamics influenced by decisive historical events, insularity faded in some cases, delaying cultural and technological evolution with generally negative repercussions, sometimes also positive. This evolution was part of significant landscape changes based on long cycles dominated by some crops such as cereals, indigo, vines, oranges, tea, pineapples, cryptomeria, or pastures. In more recent times, we have witnessed more intensive and rapid transformations and also more localized, such as constructing large infrastructures i.e., airports, ports, highways, or urban expansions of the leading centers. The improvement of the means of communication with the outside, both with the Continent and with the world in general, and the bet that has been made to promote and publicize the Archipelago in the last decades, has been reflected in a set social, economic, and cultural dynamics that directly or indirectly interact with the landscape and are the source of fundamental problems.
Between 1990 and 2018, from 43 land-uses CLC nomenclature, Azores islands evidence 28 land-uses during the analyzed period. On no island in any moment of the analyzed period CLC-122 (Road and rail networks and associated land), CLC212 (Permanently irrigated land), CLC-213 (Rice fields), CLC-223 (Olives groves), CLC-241 (Annual crops associated with permanent crops), CLC-323 (Sclerophyllous vegetation), CLC-334 (Burnt areas), CLC-335 (Glaciers and perpetual snow), CLC- 421 (Salt marshes), CLC-422 (Salines), CLC423 (Intertidal flats), CLC-511 (Water courses), and CLC-522 (Estuaries) has occupation surface. Unfortunately, CLC could not return land-uses for CLC-331 (Beaches, dunes, and plains) CLC-521 (Coastal Lagoons) in Azores islands, even existing in São Jorge, a coastal lagoon named Fajã do Santo Cristo Lagoon, and in São Miguel, Faial, Santa Maria, and Pico volcanic sand beaches stands.
Only CLC-112 (Discontinuous urban fabric), CLC-231 (Pastures), CLC-243 (Land principally occupied by agriculture, with significant areas of natural vegetation), CLC-321 (Natural grassland), CLC-322 (Moors and heathland), and CLC-523 (Sea and ocean) is present in all nine islands. Once more, CLC cannot return for all islands, mainly the smallest ones, port areas, airports, and dump sites, when all islands definitely have those land-uses between 1990 and 2018. It is likely that a small island with small land-uses areas became imperceptible by CLC used. Only the two biggest islands, São Miguel and Terceira, where the two biggest cities stand, Ponta Delgada and Angra do Heroísmo, have continuous urban fabric land-uses (CLC-111) and green urban areas (CLC-141) land-uses. Remaining Azorean cities, towns and villages show a discontinuous urban fabric (CLC-112) pattern.
In aggregate dynamic terms, between 1990 and 2018, it appears that in most islands, there is a growth of artificial surfaces (CLC-1) and forest and seminatural areas (CLC3), essentially urban fabric (CLC-11), industrial, commercial, and transportation units (CLC-12) and forest (CLC31). Many of these changes resulted from the application of European Union funds under the various community support frameworks that, from 1989 to the present date, contribute to boosting investment in the Autonomous Region of the Azores. It should be noted that the Autonomous Region of the Azores has a Government with political and administrative autonomy.
Therefore, many of these investments co-financed by European Union funds have made it possible to develop ports, airports, roads, waste recovery centers, basic sanitation, wastewater treatment plants, industrial parks, social facilities, tourist, sports, and leisure facilities, natural attractions, protection areas for natural parks, among many others infrastructures for the economic and social development of the Azores. These investments forced the increase of artificial surfaces; at the same time, the increase of forest and seminatural areas, by decreasing agricultural areas, following the development strategy of the Azores pursued by several governments, based on sustainable economic development in harmony with the lush nature of the Azores. One of the axes of this development strategy is the Azores’ positioning as a touristic active nature destination, so the preservation and even extension of natural areas have been a reality. The conversion of pasture areas into natural areas of protection for the hydrographic basins of the leading natural lagoons, the recovery of extensive areas of vineyards in basaltic corrals characteristic of the landscapes of some Azorean islands. Furthermore, its implementation allows an integrated waste management system with the conversion of open sky dump sites, the construction of several hotel units and tourist facilities with a solid connection to the sea and land activities. In fact, these are some paradigmatic examples of the evolution of land-uses in the Autonomous Region of the Azores.
In addition to the above-mentioned, it is possible to highlight the various community incentive programs for public and private investment that since 1989 have supported the construction of ports, airports, industrial parks, hotels, the infrastructure of natural areas with tourist potential, and forestry and agricultural production. As an example from among dozens of programs, we have the VITIS incentive program aimed at private investment, which between 2014 and 2020 was responsible for the considerable recovery of the surface of vines on the island of Pico.
In fact, in the last few years, the most significant pressure to change the land-uses originated from the Azores’ affirmation as a nature tourist destination, emphasizing from 2015 the liberalization of airspace for flights originating outside the Azores Autonomous Region. Here, there has existed increasing pressure to protect and increase natural areas. However, at the same time, we have witnessed the necessity to install tourist equipment, mainly through the conversion of already artificial areas and the re-conversion of agricultural areas. Therefore, these issues could also be the explanation for these land-use changes.
Focusing on the repercussions of the phenomena referred to the land-use changes, these changes should be highlighted at various levels. Changes in the pasture area, which until 1999 underwent an evident expansion, occupying lower and higher regions than those traditionally used for this purpose, eliminated agricultural, forest, and pond areas, some of which were used for water supply. The management of drainage basins for these lake systems also requires measures that necessarily involve reducing the pasture area or applying acceptable practices. The basin plans have been implementing, seeking to correct them, as was the drainage basin’s case. From Lagoa das Furnas in São Miguel, the National Landscape Prize was awarded in 2012 to the Furnas Landscape Laboratory.
The exploitation of quarries and gravel should also be worthy of special attention to lessen the impacts on the landscape and the worsening of erosion problems. This activity is already covered by a sectorial land-use plan, published in 2015 in the Plan for Extractive Activities in the Autonomous Region of the Azores.
Furthermore, there has been the abandonment of agricultural areas and the resulting degradation of conventional systems and some of the associated built and cultural heritage, specifically the vine-yards in biscuit pens, the old cellars, some compartmentalization walls, the wind-mills, and the watermills—despite the effort inherent to the occasional recovery of some specimens and the protection of landscapes, such as the Pico Island Vineyard Culture Landscape, designated by UNESCO in 2004.
Eventually, we will assist in an increment in tourist demand and the prospect of pressure on specific places, particularly for equipment construction. Therefore, we believe that better coordination should be conducted between the existing planning and management techniques to reach even more reliable and accurate management of this expanding sector.
The study of the land-use changes patterns and dynamics is vital to understand regions’ tendencies and developments [
33,
34,
35]. During this investigation, it was possible to recognize the changes in all the CLC levels in the Azores Region in the Period 1990–2018.
Thus, it was credible to establish that these land-uses suffered some changes, characterized by increasing and decreasing periods. Some of those decreasing values are disturbing and should have special attention by the autonomous government authorities to provide preservation and conservation towards these unique Azorean landscapes and environments.
Hence, considering the uniqueness of these ultra-peripheral territories, their landscapes and environments, the main-actors and several of their policies and actions over the regional territory require a re-thinking, re-design, and more consistent governance.
6. Study Limitations and Future Research Lines
Although this article affords us some insights on the dynamics, trends, and specificities of the land-uses changes in the Azores Region, if more studies were carried out, we would intersect more variables and critical findings to developing in this thematic domain.
Moreover, the rapid changes in regional policies and societal behaviors should consider these ultra-peripheral areas present. Specific changes, concurrently with the Portuguese mainland’s diverse administrative systems and the Autonomous Government, direct us to the requirement for close monitoring of the trends and dynamics of land-use changes and territorial management in a way that pursues the aspired sustainable development approaches.
In this research, only the last three decades were studied. To better understand the Land-Use Changes dynamics, a more robust period of the Land-Use Changes that occurred in the Azores Region should be considered. Here we should highlight that some of the study findings differ from the regional Government’s official documents, as is the COS (Carta de Ocupação de Solo) report, which could be explained in part by the differences in the used satellites i.e., the spatial resolution, or geometric.
Besides, it should be considered that the plans for the ordering of hydrographic basins in lagoons removed many pastures surrounding areas for the agricultural activity, re-qualifying these areas to the use of forests and semi-natural areas which was not considered by the actual analysis.
Moreover, due to the minimum cartographic unit of the used CLC (25 hectares), some of the land-uses that exist in the Azores archipelago could not be reflected in this study once these elements have not been identified. If new versions of the CLC program were used, namely the most recent one with a higher resolution, it probably would overcome this specific problem.
Furthermore, future studies focusing on these ultra-peripheral territories could cross cartography with the protected natural spaces, their different figures, and the land-use changes through time.


 ,
, 


