A Study on State of Charge and State of Health Estimation in Consideration of Lithium-Ion Battery Aging

Abstract
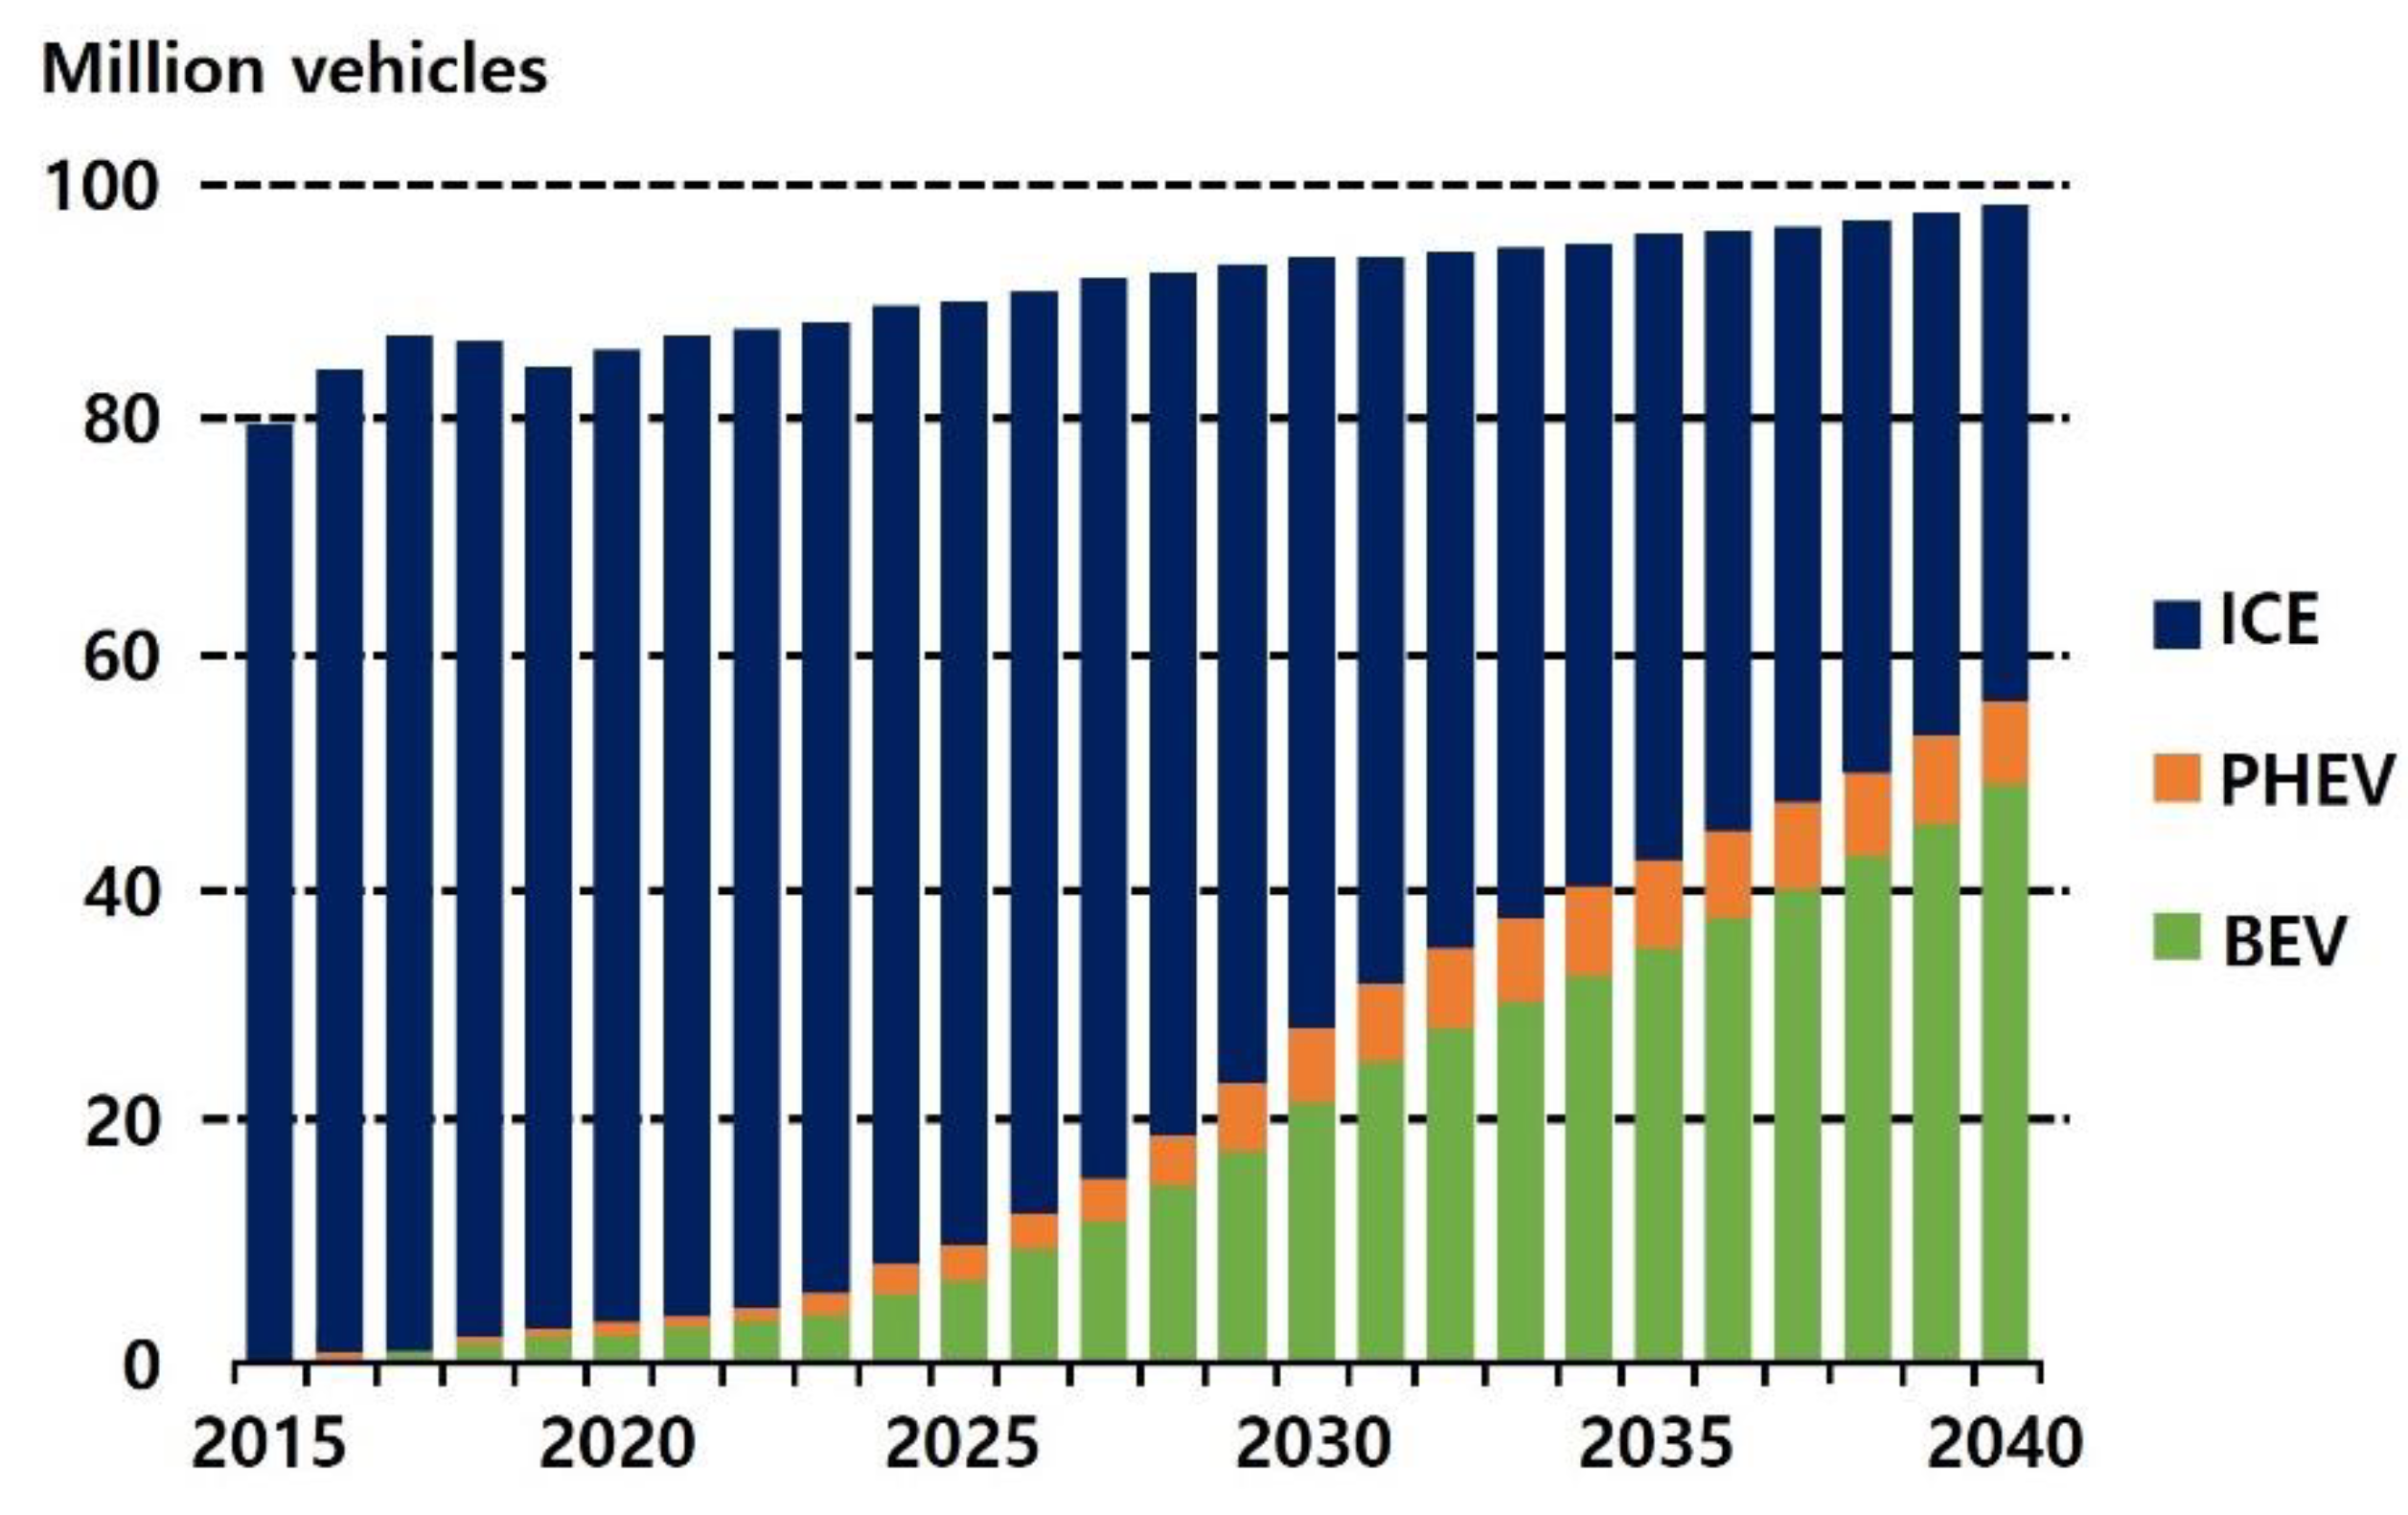
1. Introduction
2. Methodology Development
2.1. Conventional Methods for SOC Measurement
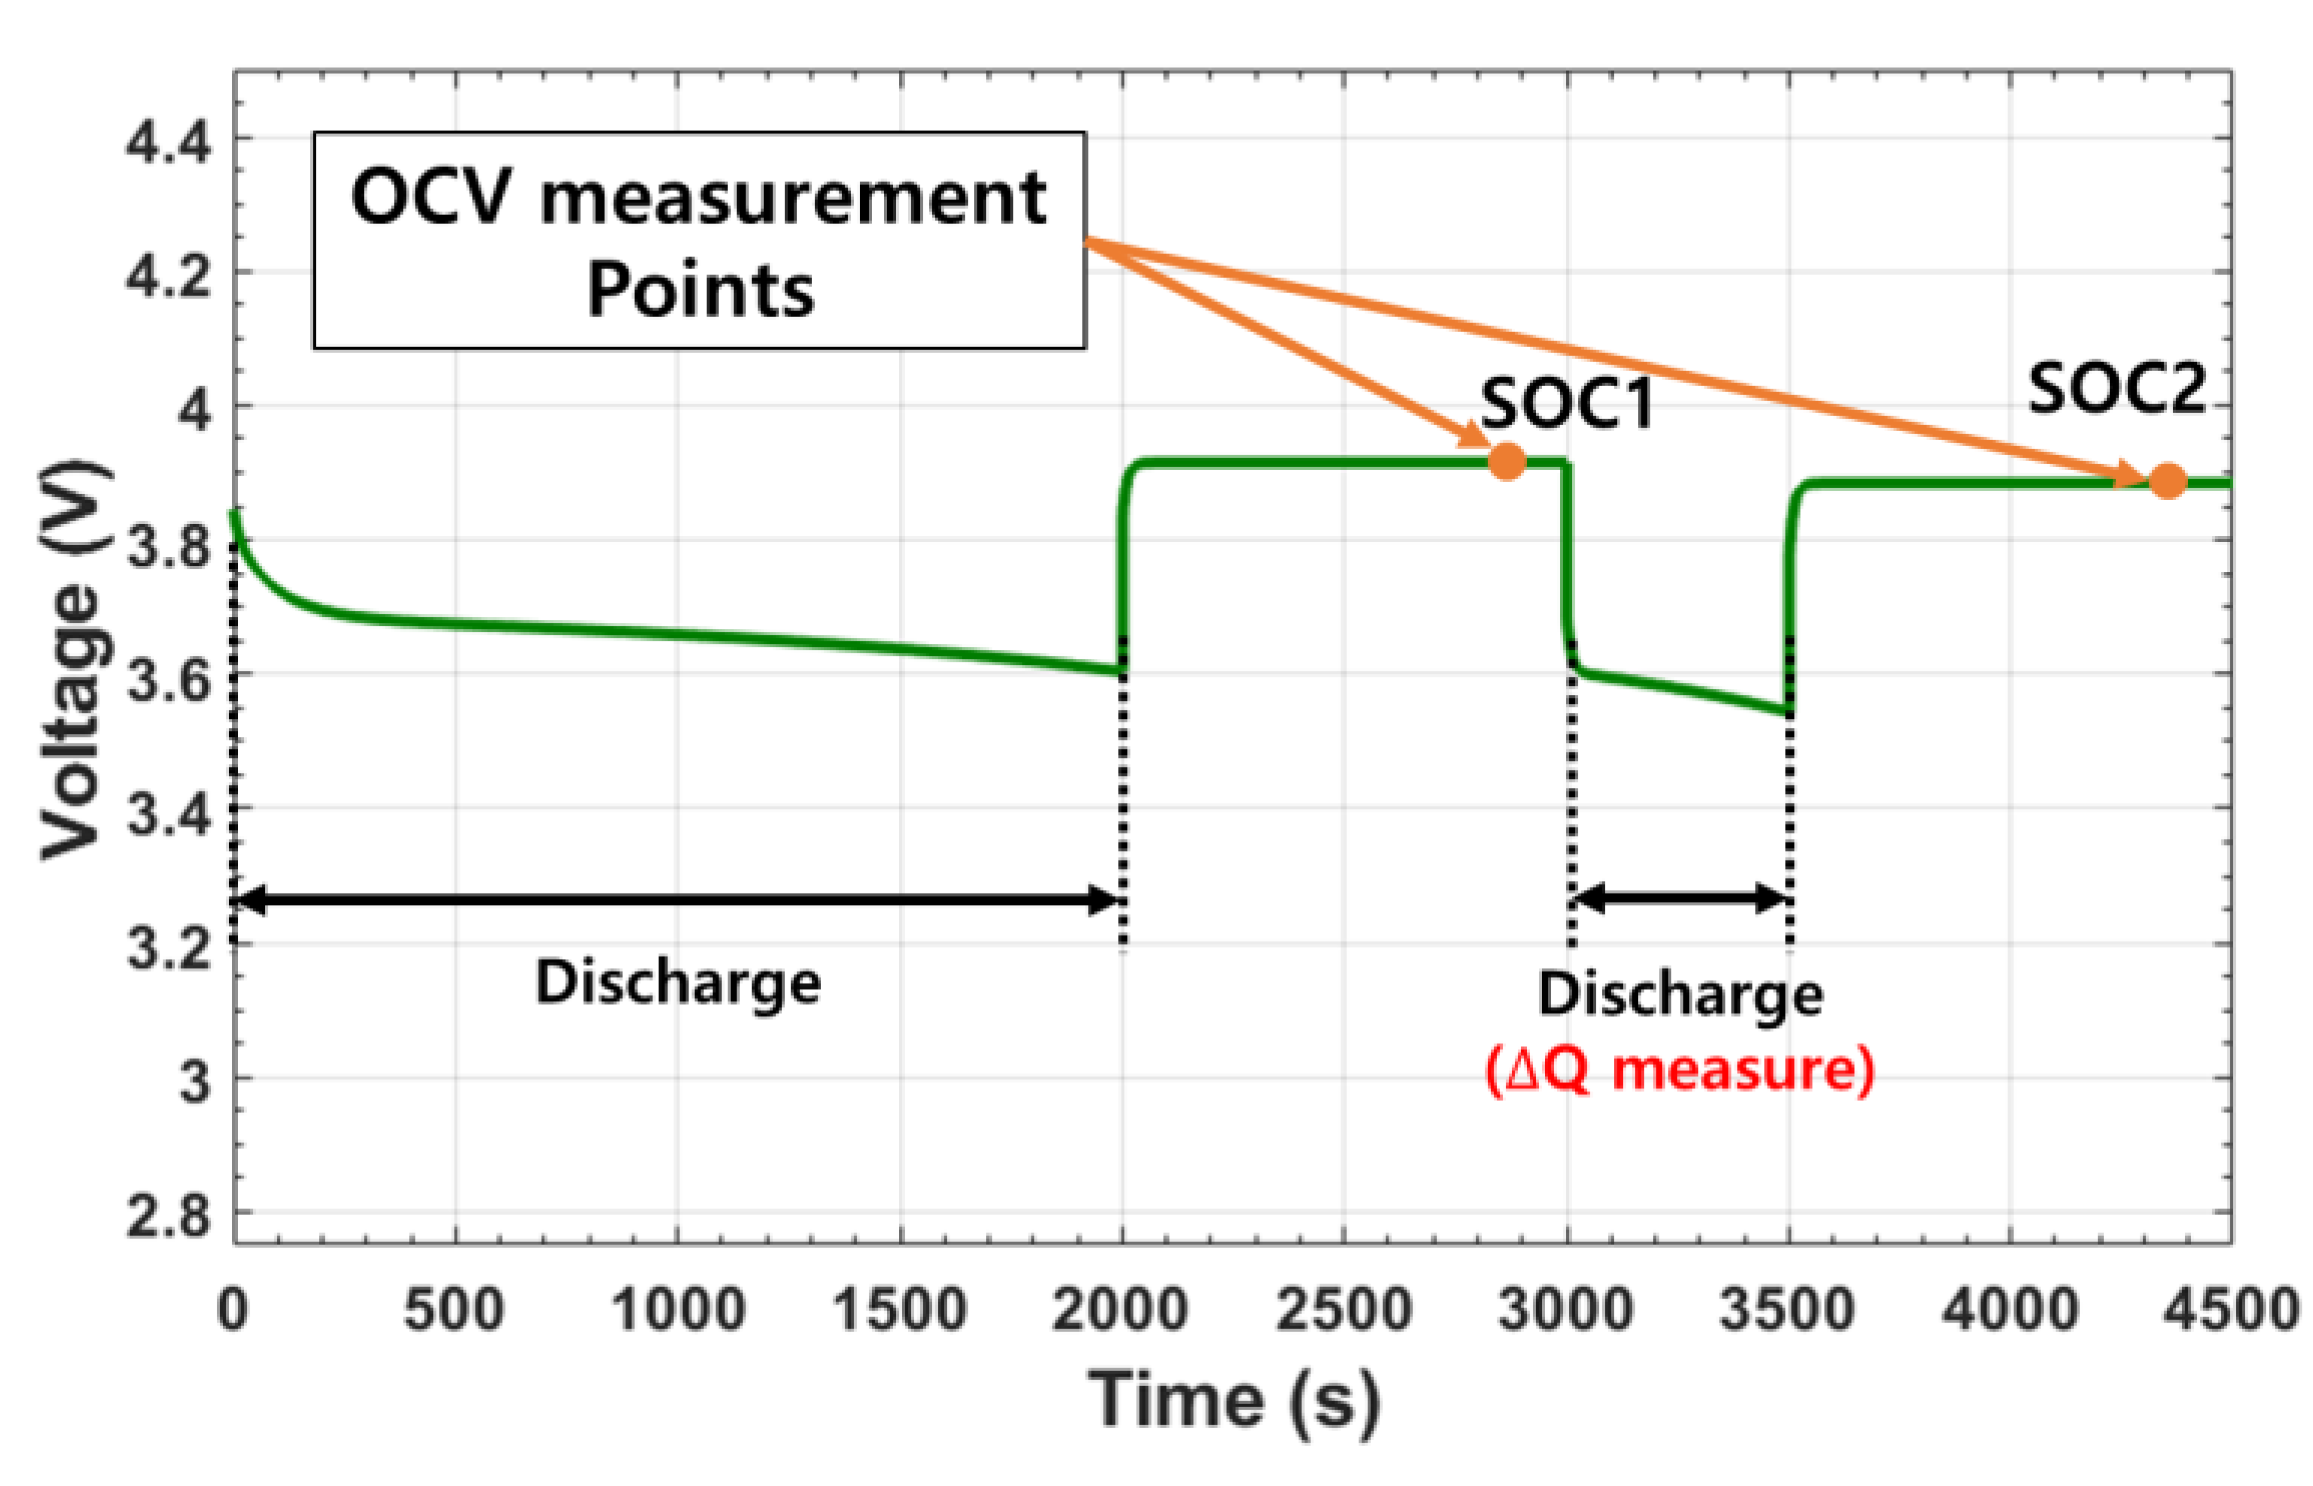
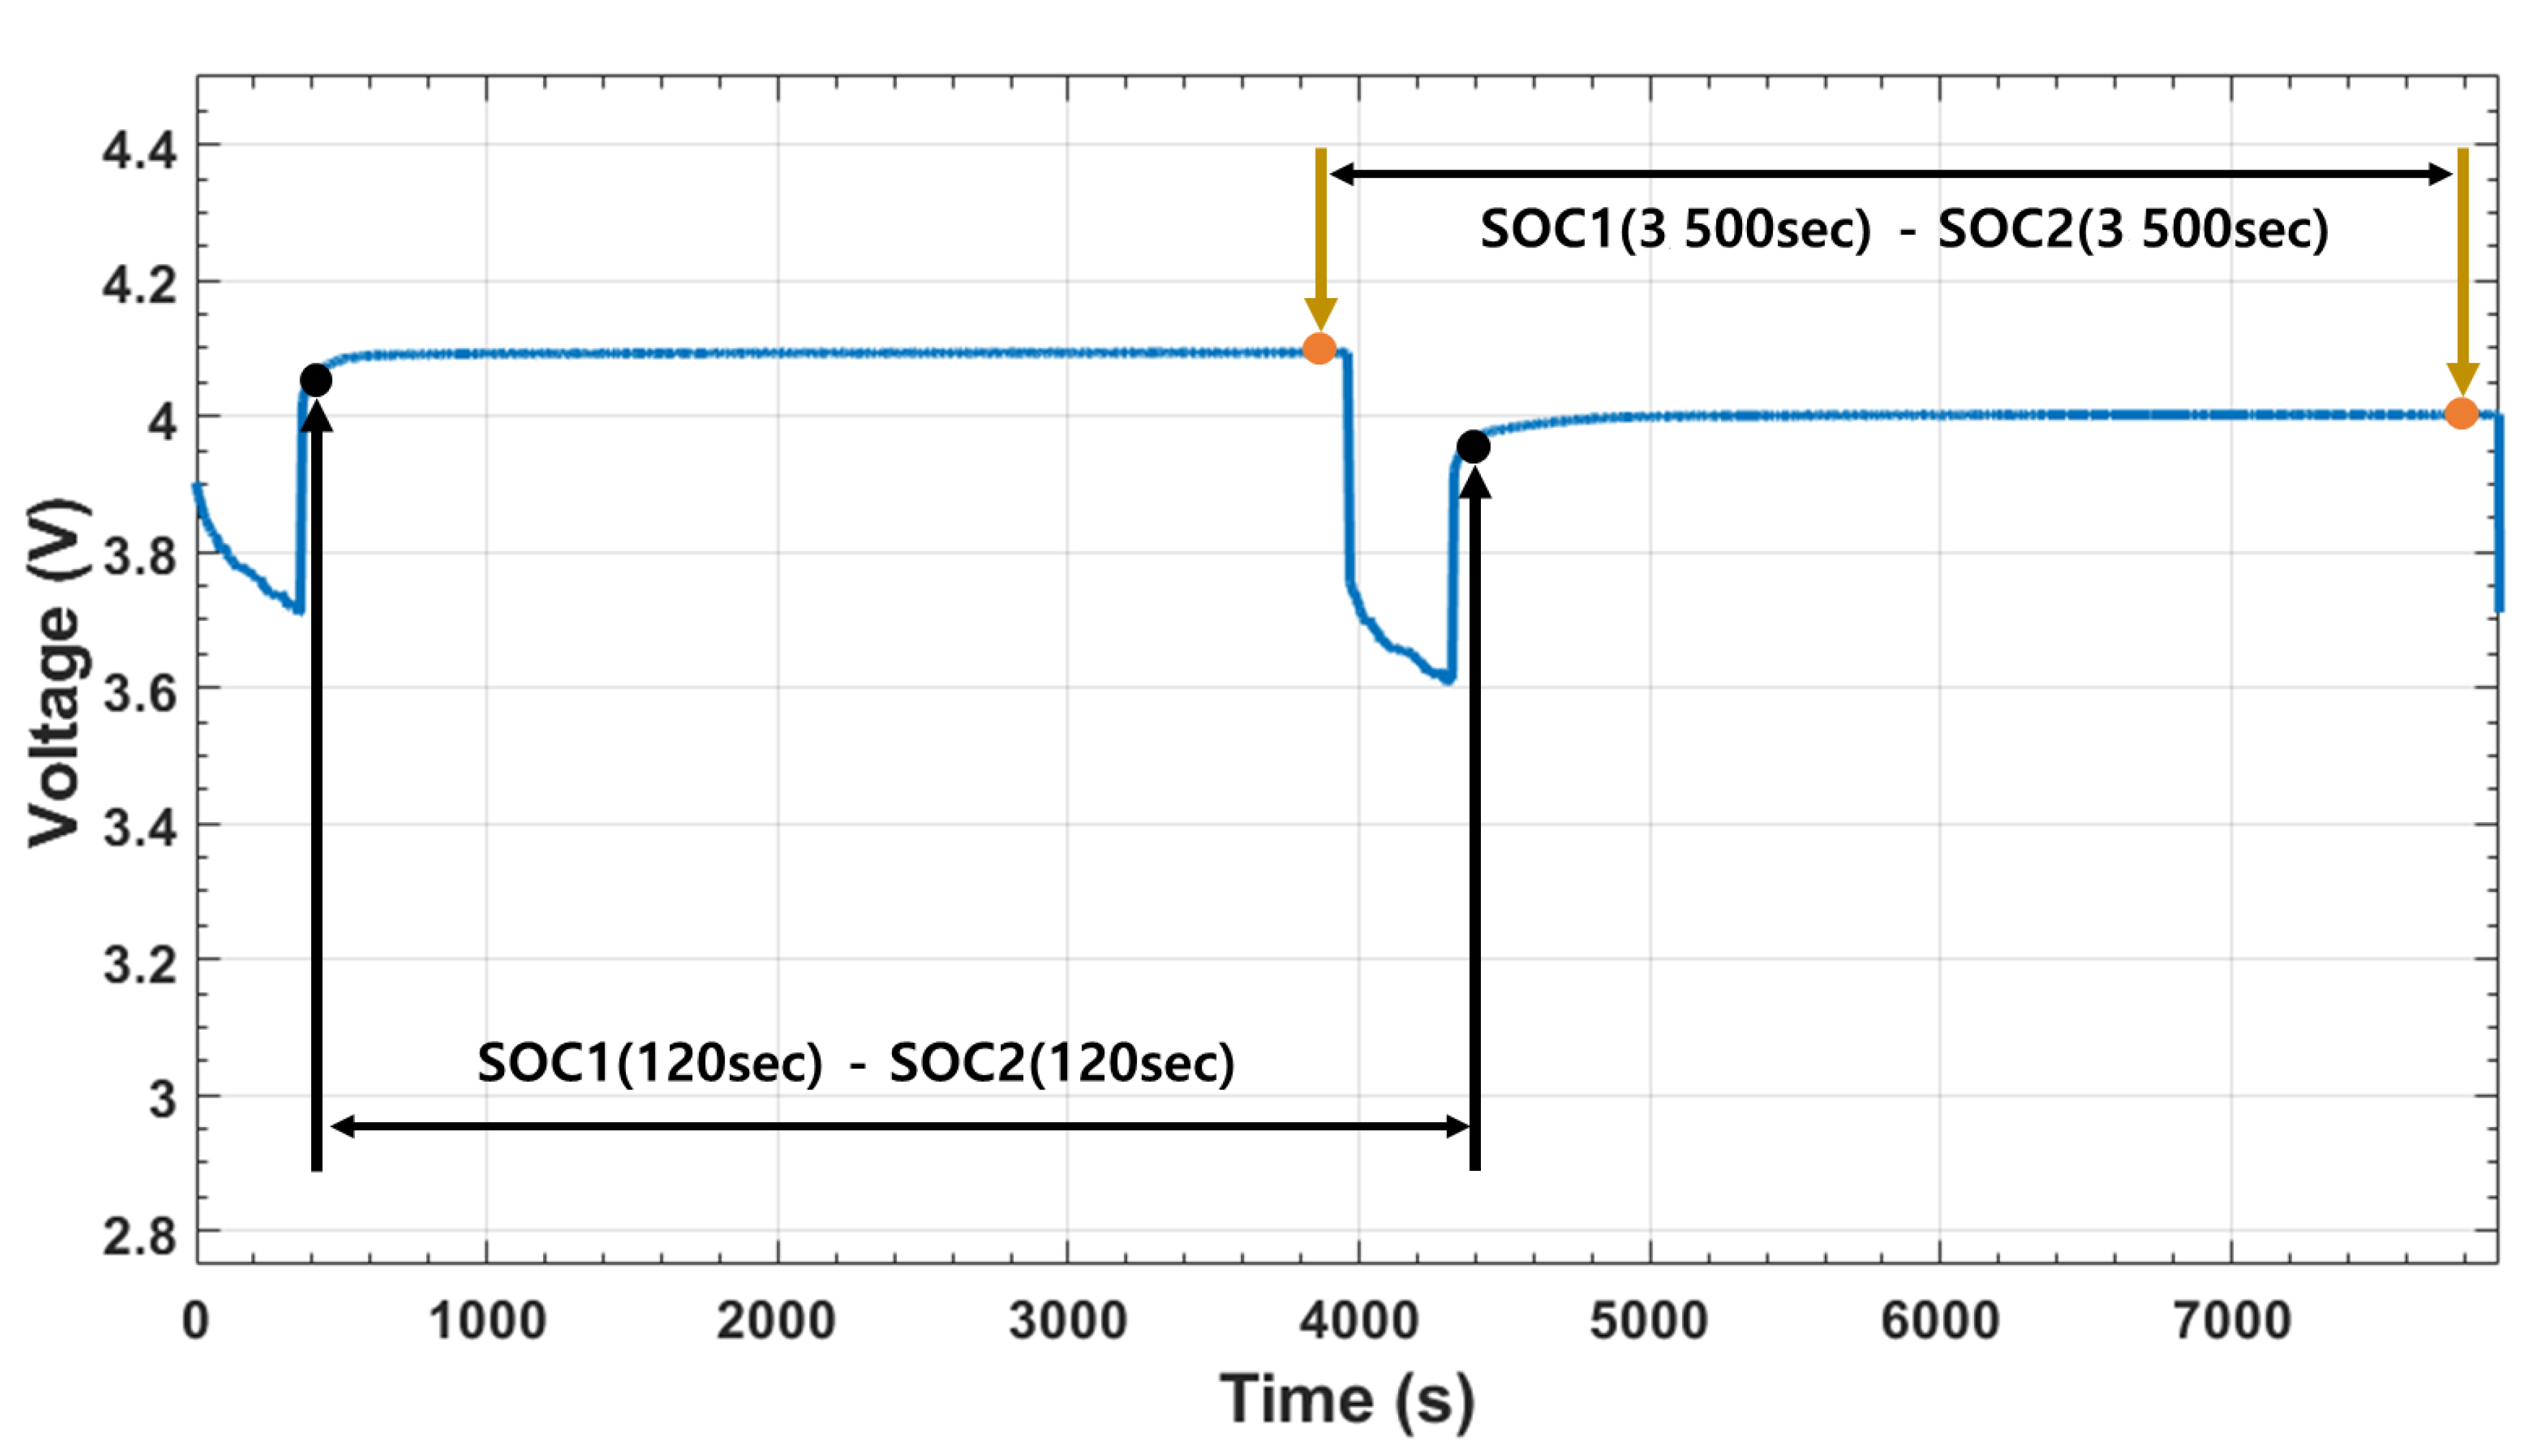
2.2. Newly Proposed Internal Resistance Tracking Method
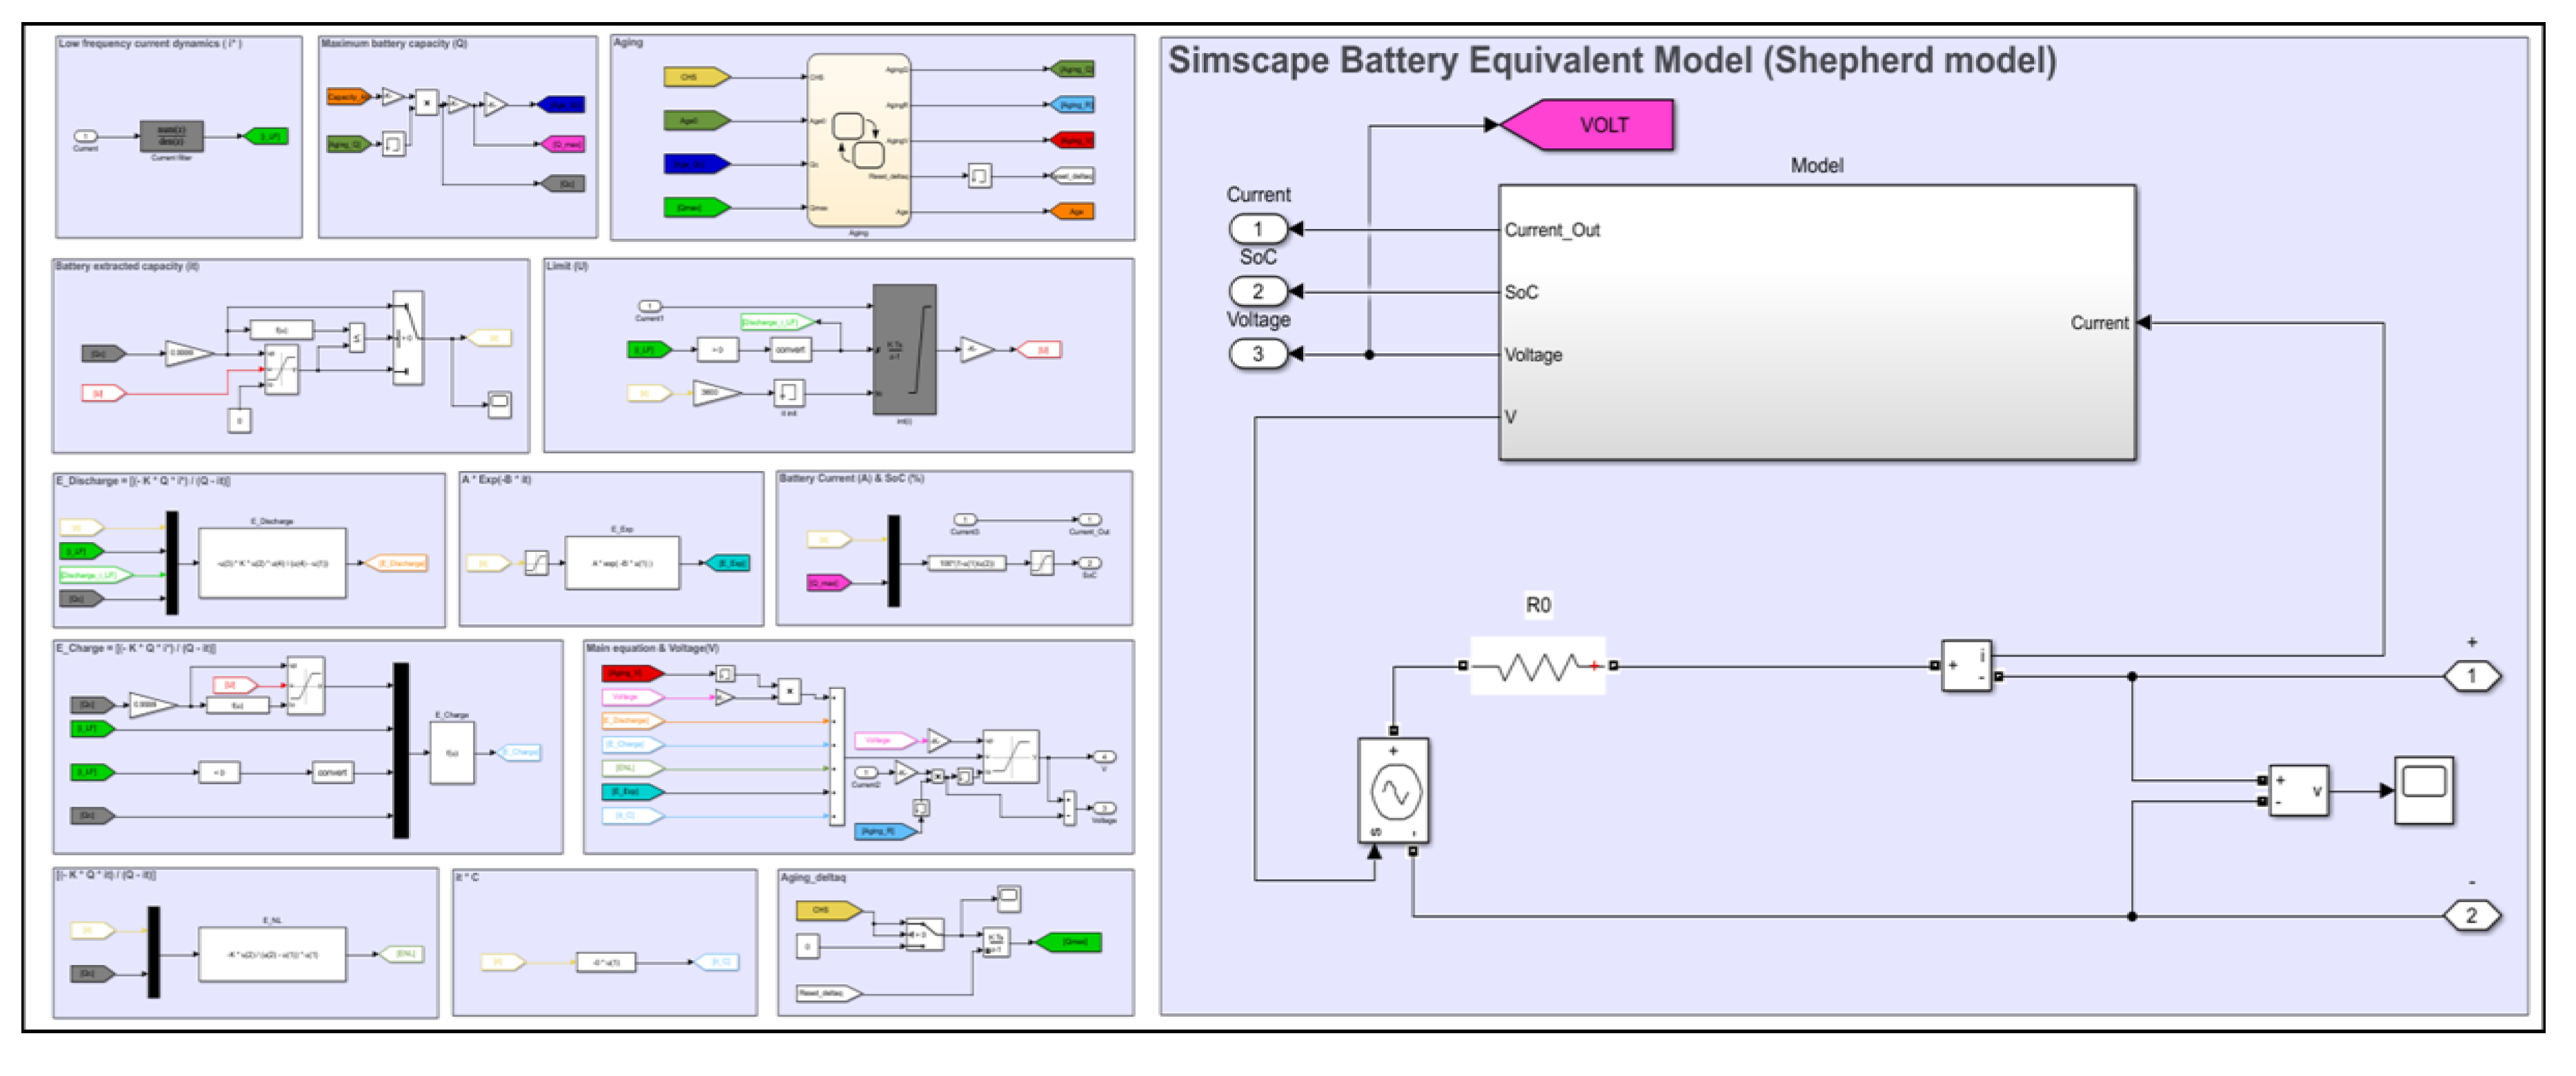
3. Battery Simulation Based on the Shepherd Model
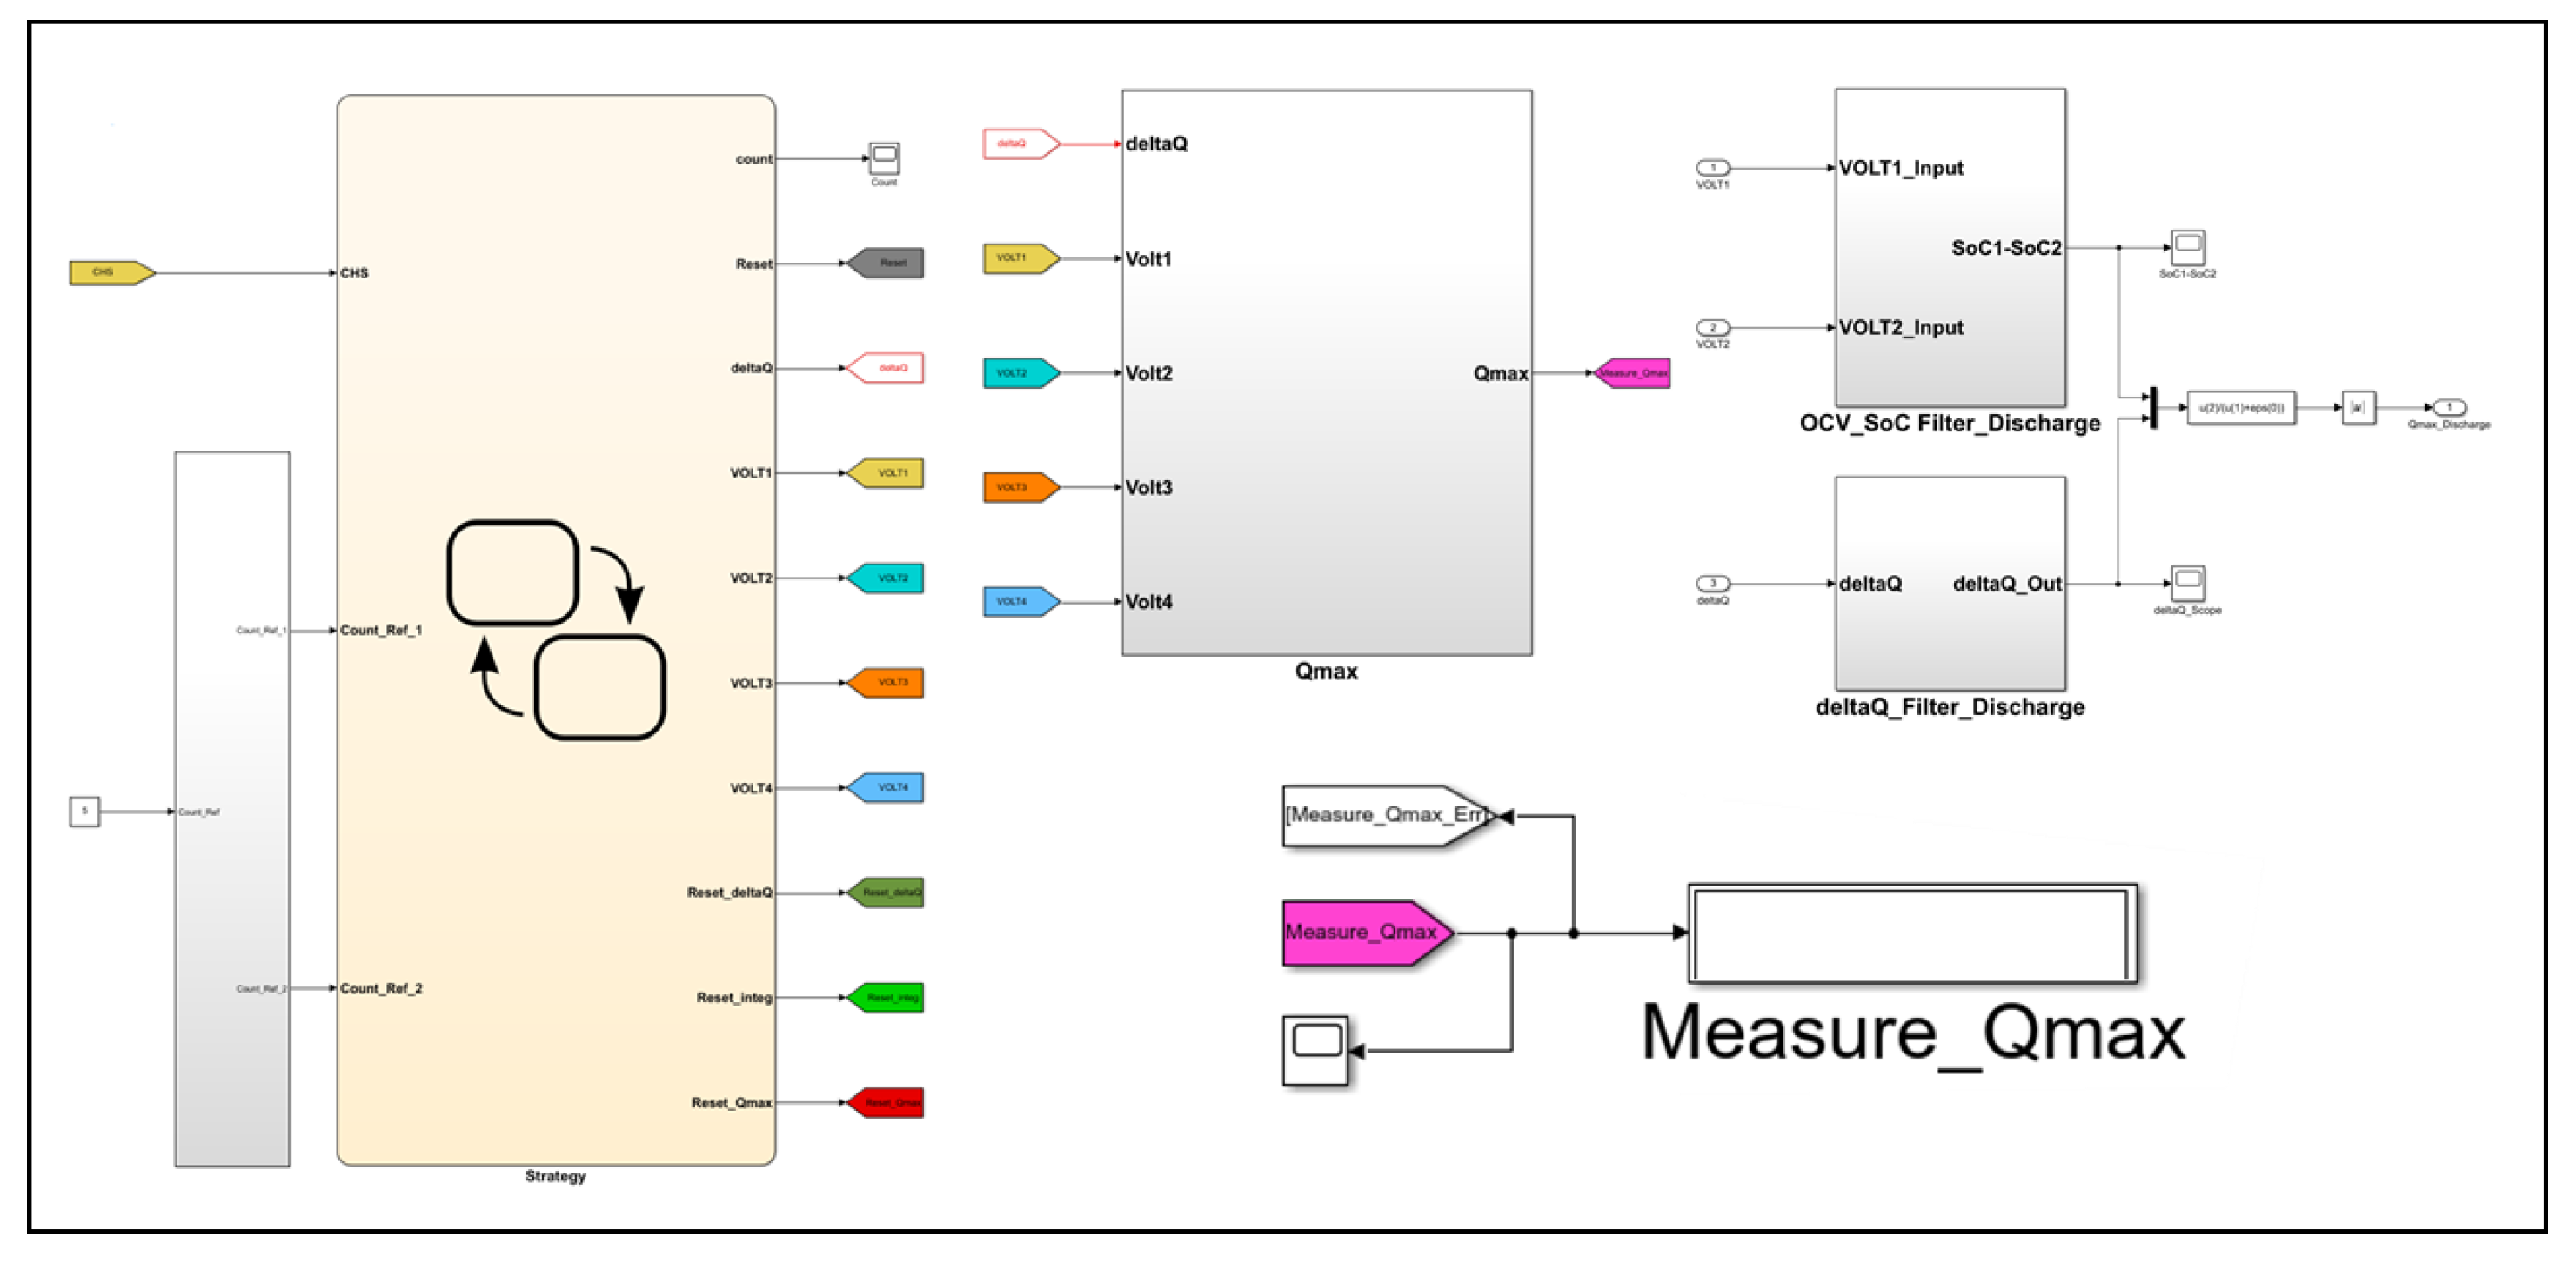
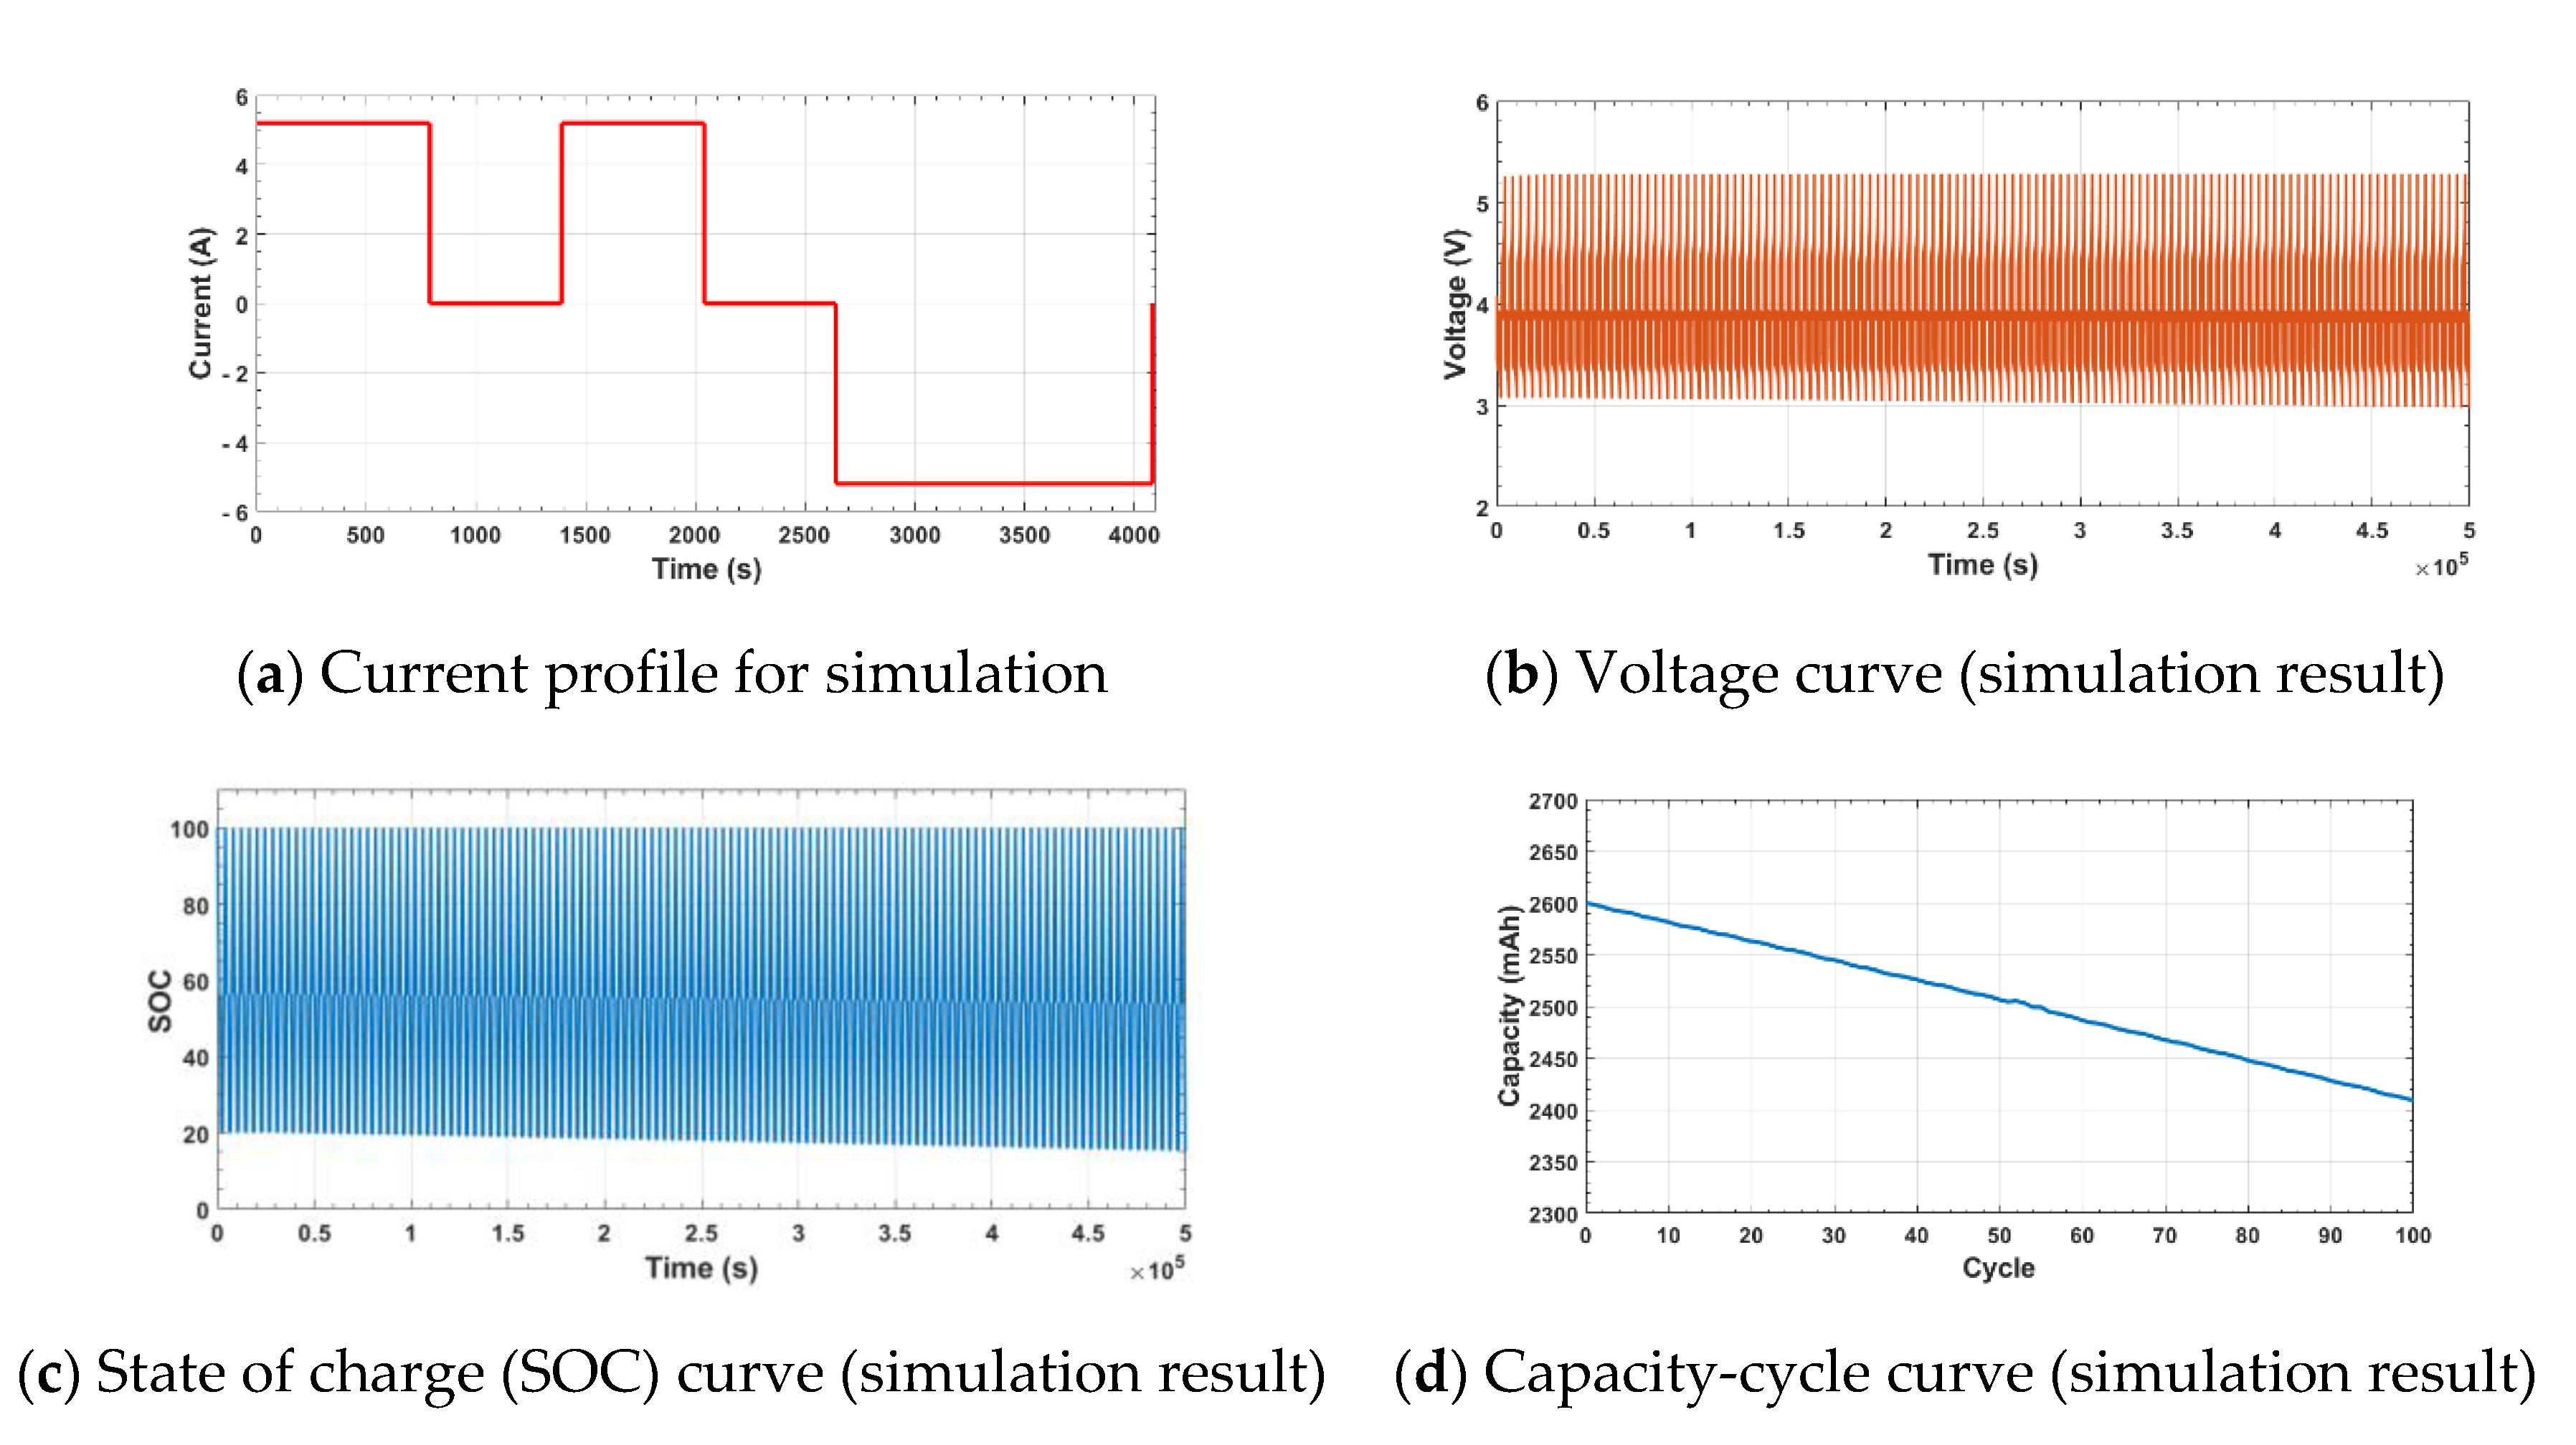
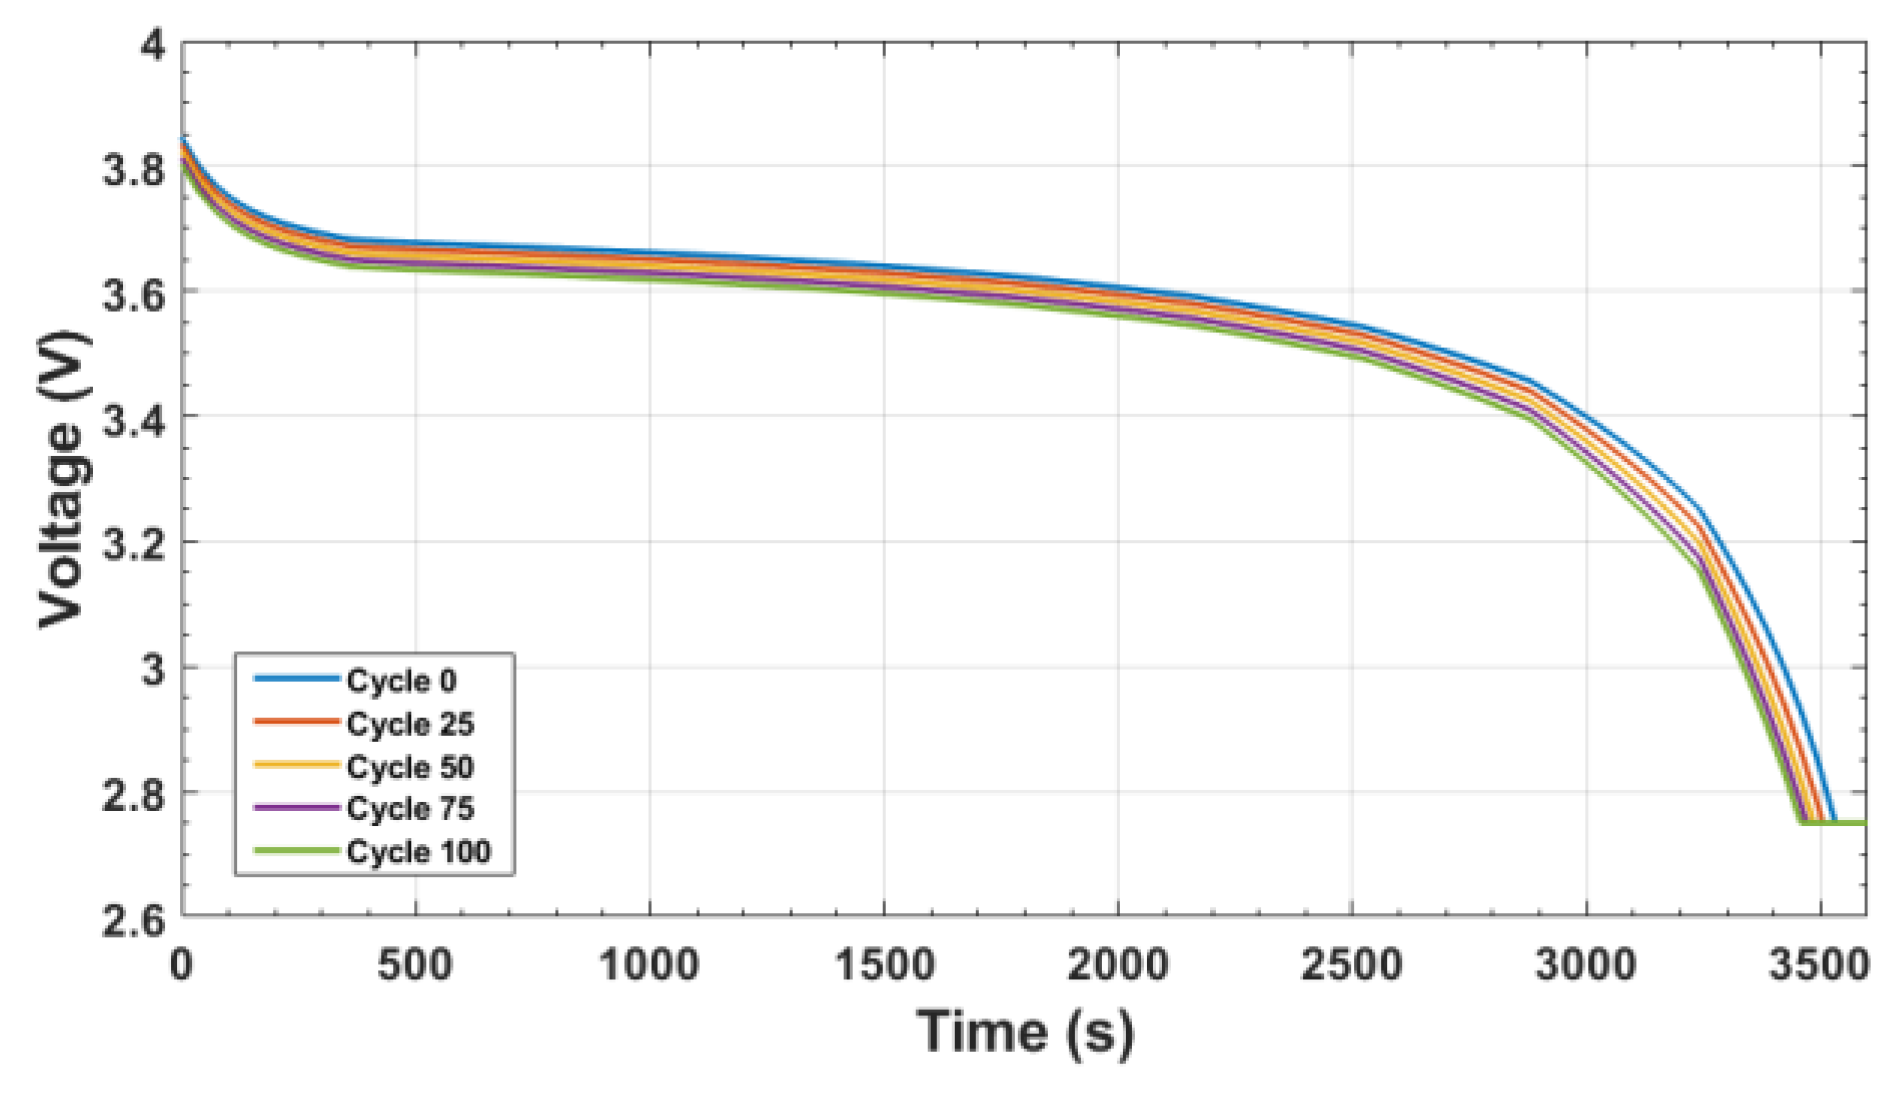
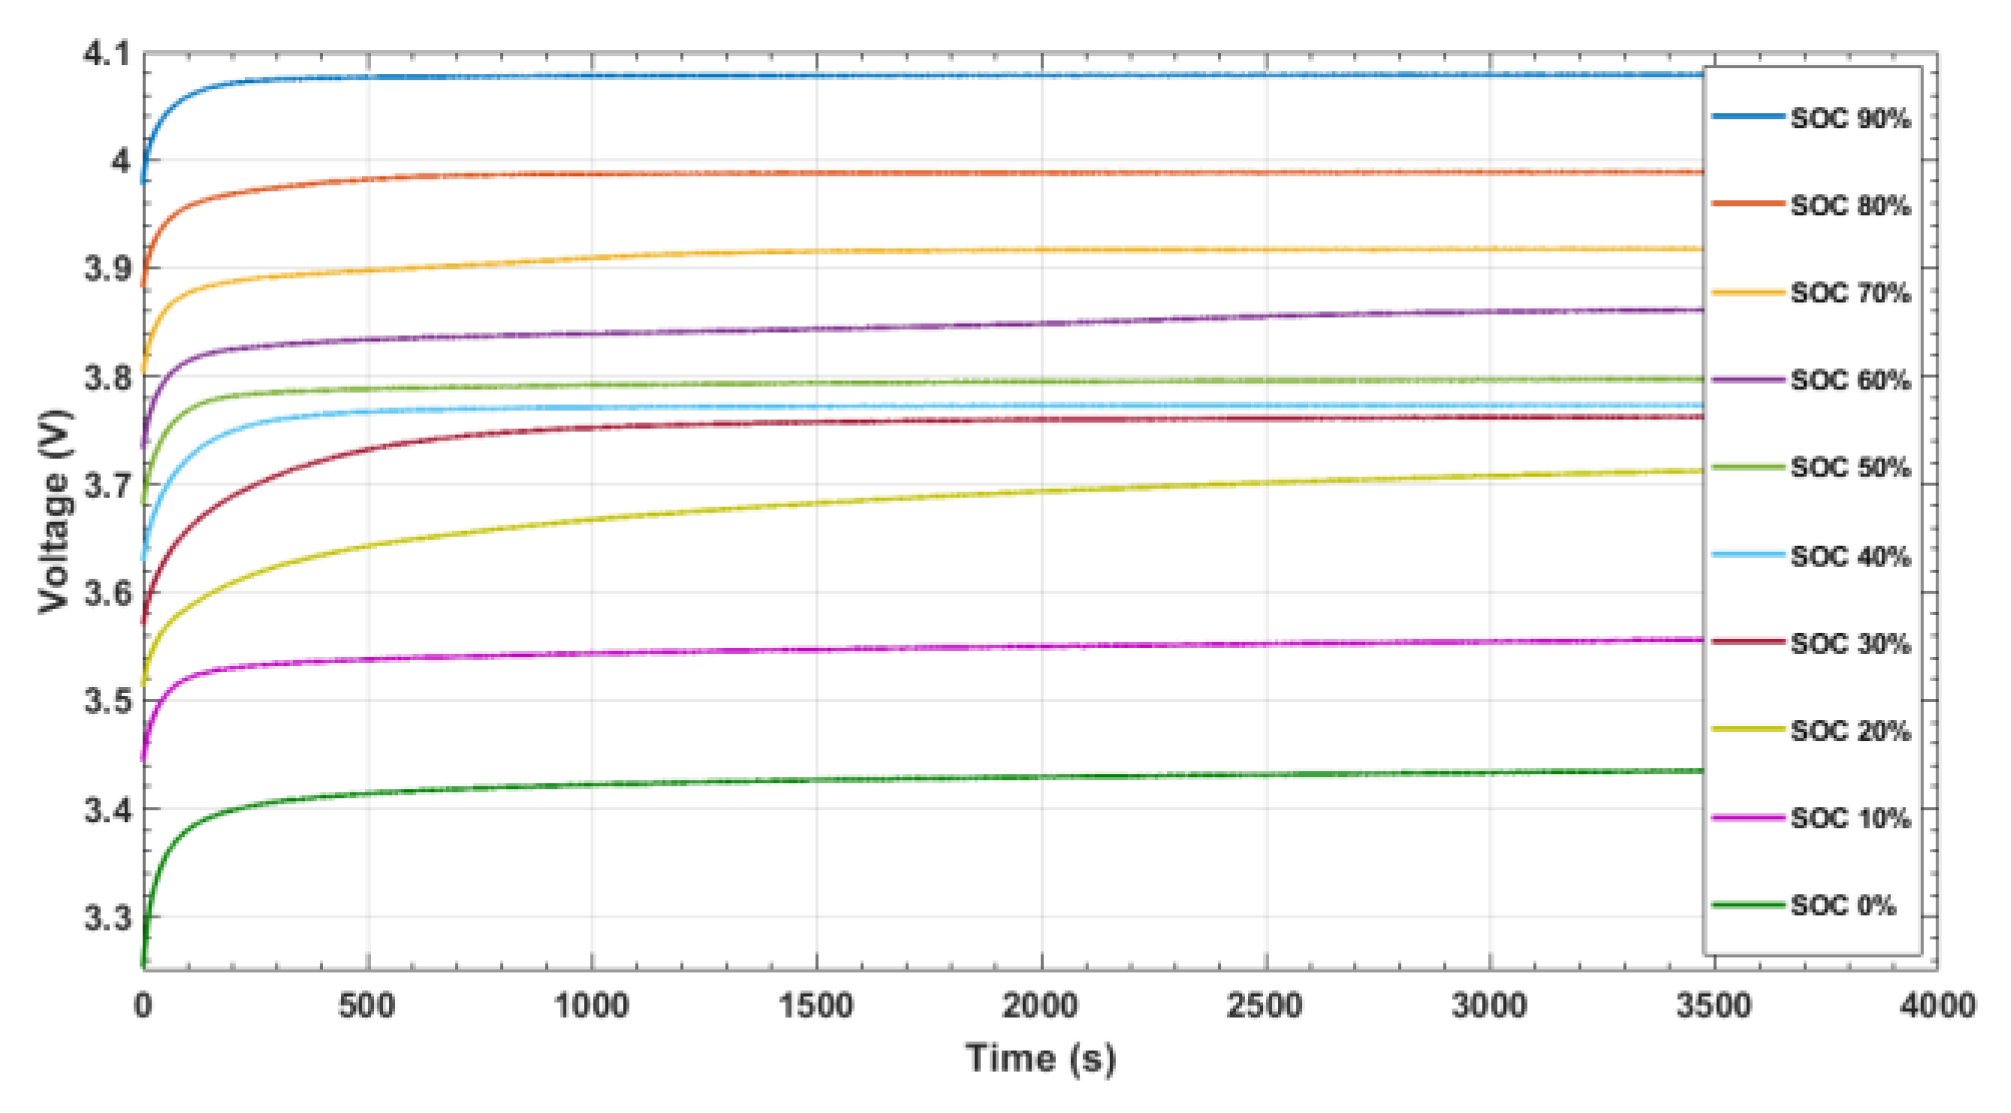
4. Implementation of the Internal Resistance Tracking Algorithm with Simulated Data
5. Implementation of the Novel Internal Resistance Tracking Algorithm with Experimental Data
6. Conclusions
Funding
Acknowledgments
Conflicts of Interest
References
- Karl, T.R.; Kevin, E.T. Modern global climate change. Science 2003, 302, 1719–1723. [Google Scholar] [CrossRef] [PubMed]
- Fuhrer, J. Agroecosystem responses to combinations of elevated CO2, ozone, and global climate change. Agric. Ecosyst. Environ. 2003, 97, 1–20. [Google Scholar] [CrossRef]
- Ken, C.; Atul, K.J.; Martin, I.H. Climate sensitivity uncertainty and the need for energy without CO2 emission. Science 2003, 299, 2052–2054. [Google Scholar]
- Hwang, H.Y.; Nam, T.W. R&D Trend and Prospect of Environment Friendly Alternative Energy Propulsion Aircraft. J. Aerosp. Ind. 2012, 76, 109–120. [Google Scholar]
- Sami, K.; Li, W. Unit process energy consumption models for material removal processes. CIRP Ann. 2011, 60, 37–40. [Google Scholar]
- Lawrence Livermore National Laboratory. Carbon Flow Charts. 2014. Available online: https://flowcharts.llnl.gov/commodities/carbon (accessed on 10 October 2020).
- Song, H.S.; Lee, B.H.; Shin, D.H.; Jeong, J.B.; Kim, B.H.; Yoo, J.Y.; Heo, H. A Study on the Development of Battery HILS for Green Cars. Korean Soc. Automot. Eng. 2011, 22, 2897–2905. [Google Scholar]
- Kang, W.S.; Lee, J.K.; Lee, J.H. Evaluation of Heat Generation Characteristics during Discharging of Prismatic Lithium-Ion Battery Module for Energy Storage System. J. KSPSE 2019, 1, 20–26. [Google Scholar] [CrossRef]
- Choi, G.H.; Yang, J.H.; Jeong, T.Y.; Jeong, S.K. Charging and Discharging Characteristics Analysis of a Battery for a Hybrid Electric Propulsion System. J. KSPSE 2018, 22, 39–46. [Google Scholar] [CrossRef]
- Xu, D.; Wang, L.; Yang, J. Research on Li-Ion Battery Management System. In Proceedings of the 2010 International Conference on Electrical and Control Engineering, Wuhan, China, 25–27 June 2010. [Google Scholar]
- Kim, J. Research Trends of Batteries and BMS in Mobile Vehicles; The Korean Institute of Power Electronics: Seoul, Korea, 2019. [Google Scholar]
- Lu, L.; Han, X.; Li, J.; Hua, J.; Ouyang, M. A review on the key issues for lithium-ion battery management in electric vehicles. J. Power Sources 2013, 226, 272–288. [Google Scholar] [CrossRef]
- Bloomberg NEF Electric Vehicle Outlook 2019; Electric Vehicle Outlook: New York, NY, USA, 2019.
- Shepherd, C.M. Design of Primary and Secondary Cells: II. An Equation Describing Battery Discharge. J. Electrochem. Soc. 1965, 112, 657–664. [Google Scholar] [CrossRef]
- Pablo, R.B.J.; Muñoz-Galeano, N.; Sarmiento-Maldonado, H.O. SOC estimation for lithium-ion batteries: Review and future challenges. Electronics 2017, 6, 102. [Google Scholar] [CrossRef]
- Bae, S.H.; Jeon, S.U.; Park, J.W. A Study on SOC Estimation Method using Battery Discharge Characteristics. In Proceedings of the Inst. Electron. Inf. Eng., Jeju-si, Jeju-do, Korea, 21–13 June 2015; pp. 1193–1195. [Google Scholar]
- Jeong, Y.; Cho, Y.; Ahn, J.; Ryu, S.; Lee, B. Enhanced coulomb counting method with adaptive SOC reset time for estimating OCV. In Proceedings of the IEEE Energy Conversion Congress and Exposition (ECCE), Pittsburgh, PA, USA, 14–18 September 2014; pp. 1313–1318. [Google Scholar]
- Cho, Y.K.; Jeong, Y.M.; Ahn, J.H.; Lee, B.K. Algorithm for Reduction Error using Statistical Error Analysis of the Coulomb Counting Method. In Proceedings of the Korean Inst. Electrical Engineers, Pyungchang-gun, Korea, 16–18 July 2014; pp. 1043–1044. [Google Scholar]
- Lim, D.J.; Cho, Y.K.; Jeong, Y.M.; Ahn, J.H.; Lee, B.K. A reset algorithm based on DCIR for improving the SOC estimation accuracy of Coulomb Counting Method. In Proceedings of the EMECS Korean Inst. Electrical Engineers, Siheung-si, Korea, 16–18 October 2014; pp. 237–239. [Google Scholar]
- Lee, S.H.; Park, M.K. Battery State of Charge Estimation Considering the Battery Aging. IKEEE 2014, 18, 298–304. [Google Scholar] [CrossRef][Green Version]
- Chen, Y.; Liu, X.; Yang, G.; Geng, H. An internal resistance estimation method of lithium-ion batteries with constant current tests considering thermal effect. In Proceedings of the IECON 2017—43rd Annual Conference of the IEEE Industrial Electronics Society, Beijing, China, 29 October–1 November 2017; pp. 7629–7634. [Google Scholar]
- Kim, S.Y.; Noh, T.W.; Lee, J.Y.; Ahn, J.H.; Lee, B.K. SOH Estimation Algorithm of Li-Ion Battery Based on Internal Resistance and Differential Voltage Curve Tracking. In Proceedings of the Korean Power Electronic Conference, Seoul, Korea, 4–6 July 2017; pp. 56–57. [Google Scholar]
- Peter, F. Impedance Track™ Based Fuel Gauging, Texas Instruments 2007. Available online: https://www.ti.com/lit/wp/slpy002/slpy002.pdf?ts=1607674509206&ref_url=https%253A%252F%252Fwww.google.com.hk%252F (accessed on 8 October 2020).
- Mark, E.O.; Bernard, T. Electrochemical Impedance Spectroscopy, 2nd ed.; John Wiley & Sons: New York, NY, USA, 2017. [Google Scholar]
- Lin, C.; Tang, A.; Wang, W. A Review of SOH Estimation Methods in Lithium-ion Batteries for Electric Vehicle Applications. Energy Procedia 2015, 75, 1920–1925. [Google Scholar] [CrossRef]
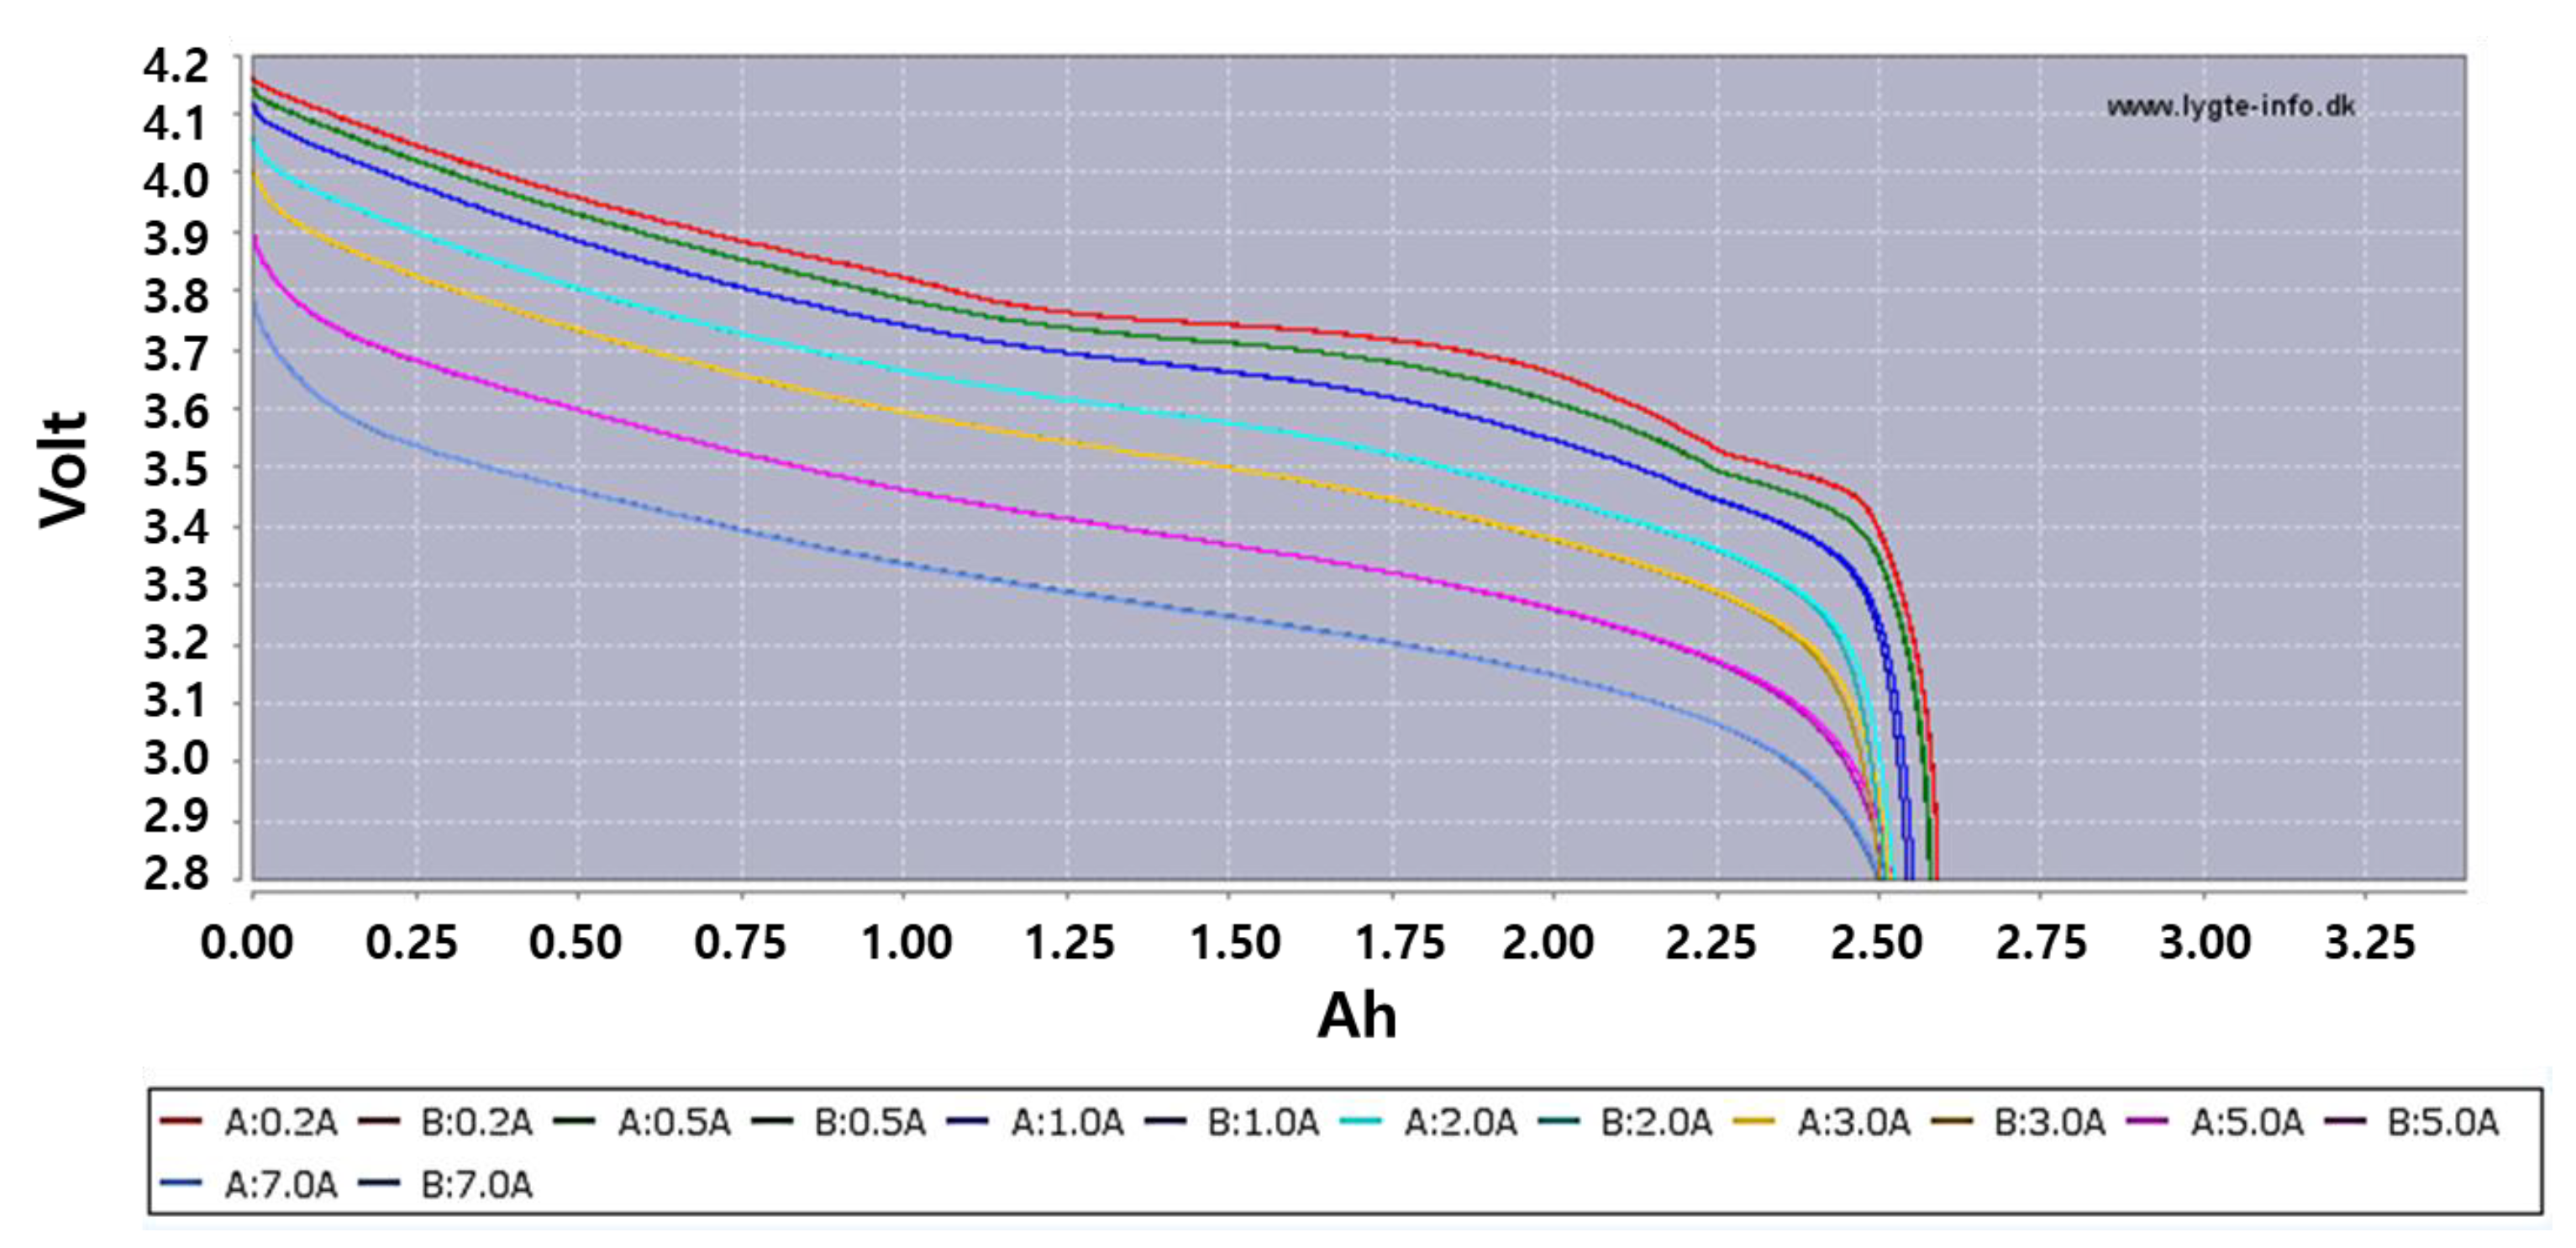
- Battery Specification. Available online: www.lygte-info.dk (accessed on 10 October 2020).


| Nominal Capacity | 2600 mAh | |
| Minimum capacity | 2550 mAh | |
| Nominal voltage | 3.7 V | |
| Discharge cut-off voltage | 2.75 V | |
| Charging voltage | 4.2 V | |
| Calculated internal resistance | 0.09 Ω | |
| Max charge and discharge current | Charge | 2600 mA |
| Discharge | 5200 mA | |
| Operating temperature | Charge | 0~45 °C |
| Discharge | −20~60 °C | |
| Cycles | Cycle 0 | Cycle 25 | Cycle 50 | Cycle 75 | Cycle 100 |
|---|---|---|---|---|---|
| Time to CEDV | 3530 s | 3504 s | 3485 s | 3469 s | 3457 s |
| Qmax | 9178 Wh | 9110 Wh | 9061 Wh | 9019 Wh | 8988 Wh |
| SOH | 100% | 99.25% | 98.72% | 98.26% | 97.92% |
| SOC Levels | 99~98% | 98~97% | 97~96% | 96~95% | 95~94% | 94~93% | 93~92% |
|---|---|---|---|---|---|---|---|
| Time for Qmax within 1.00% accuracy of converged Qmax | 114 s | 359 s | 247 s | 152 s | 79 s | 139 s | 315 s |
| Time for Qmax within 0.50% accuracy of converged Qmax | 164 s | 464 s | 394 s | 202 s | 95 s | 196 s | 375 s |
| Time for Qmax within 0.25% accuracy of converged Qmax | 228 s | 543 s | 549 s | 289 s | 108 s | 268 s | 425 s |
| Time for Qmax within 0.10% accuracy of converged Qmax | 364 s | 614 s | 691 s | 501 s | 120 s | 606 s | 472 s |
Publisher’s Note: MDPI stays neutral with regard to jurisdictional claims in published maps and institutional affiliations. |
© 2020 by the author. Licensee MDPI, Basel, Switzerland. This article is an open access article distributed under the terms and conditions of the Creative Commons Attribution (CC BY) license (http://creativecommons.org/licenses/by/4.0/).
Share and Cite
Choi, W. A Study on State of Charge and State of Health Estimation in Consideration of Lithium-Ion Battery Aging. Sustainability 2020, 12, 10451. https://doi.org/10.3390/su122410451
Choi W. A Study on State of Charge and State of Health Estimation in Consideration of Lithium-Ion Battery Aging. Sustainability. 2020; 12(24):10451. https://doi.org/10.3390/su122410451
Chicago/Turabian StyleChoi, Woongchul. 2020. "A Study on State of Charge and State of Health Estimation in Consideration of Lithium-Ion Battery Aging" Sustainability 12, no. 24: 10451. https://doi.org/10.3390/su122410451
APA StyleChoi, W. (2020). A Study on State of Charge and State of Health Estimation in Consideration of Lithium-Ion Battery Aging. Sustainability, 12(24), 10451. https://doi.org/10.3390/su122410451