Article

Heuristic-Based Journey Planner for Mobility as a Service (MaaS)

by
Panagiotis Georgakis
1,*,
Adel Almohammad
1,
Efthimios Bothos
2,
Babis Magoutas
2,
Kostantina Arnaoutaki
2 and
Gregoris Mentzas
2
1
School of Architecture and the Built Environment, University of Wolverhampton, Wolverhampton WV10 0JP, UK
2
Institute of Computer and Communication Systems, National Technical University of Athens, 157 80 Athens, Greece
*
Author to whom correspondence should be addressed.
Sustainability 2020, 12(23), 10140; https://doi.org/10.3390/su122310140
Submission received: 30 October 2020 / Revised: 26 November 2020 / Accepted: 27 November 2020 / Published: 4 December 2020
(This article belongs to the Special Issue Innovative Mobility Solutions for Sustainable Transportation)

Abstract

:
The continuing growth of urbanisation poses a real threat to the operation of transportation services in large metropolitan areas around the world. As a response, several initiatives that promote public transport and active travelling have emerged in the last few years. Mobility as a Service (MaaS) is one such initiative with the main goal being the provision of a holistic urban mobility solution through a single interface, the MaaS operator. The successful implementation of MaaS requires the support of a technology platform for travellers to fully benefit from the offered transport services. A central component of such a platform is a journey planner with the ability to provide trip options that efficiently integrate the different modes included in a MaaS scheme. This paper presents a heuristic that implements a scenario-based journey planner for users of MaaS. The proposed heuristic provides routes composed of different modes including private cars, public transport, bike-sharing, car-sharing and ride-hailing. The methodological approach for the generation of journeys is explained and its implementation using a microservices architecture is presented. The implemented system was trialled in two European cities and the analysis of user satisfaction results reveal good overall performance.

1. Introduction

The rise of urbanisation in the last few decades and forecasts [1] revealing that an increasing number of people will choose to settle in urban areas in the coming decades pose a challenging problem for future transportation systems. At the same time, the evolution of new mobility services and the upcoming penetration of autonomous vehicles in traffic streams will require technological solutions to support travellers with mobility related tasks such as journey planning, booking, ticketing and others.
Mobility as a Service (MaaS) is an emerging concept which integrates different modes and services in subscription packages with the aim of covering an individual’s travel needs through a single interface; the MaaS operator. The ultimate goal of the wide adoption of MaaS in urban environments is the shift from a car-ownership to a car-usership paradigm [2], thus reducing the over-reliance on private cars, which is the main contributor to the formulation of congested networks. Due to the novel nature, as far as mobility concepts are concerned, research has been undertaken lately for understanding better factors that may affect the deployment of MaaS. Such factors may be divided in those related to (i) user acceptance, (ii) the need for innovative business models, (iii) an understanding of policy-making necessary to stimulate such schemes and (iv) advances in technological solutions to support the provision of the required integrated services.
User adoption of MaaS is pivotal for its existence and merely its offering may not be sufficient to effect behavioural change [3]. Interestingly, this may be attributed to user uncertainty as to what this new mobility concept entails [4]. Other ambiguities that may hinder user acceptance are the narrow range of demographics of potential adopters which limit the overall user base [5], the socioeconomic qualities of users who will be willing to pay for such a service [6], a clear understanding of the real cost benefits in using MaaS [7], the motivations for behavioural change necessary to lead in the abandonment of current travel practices [8], as well as aspects related to the acceptance of the technological solutions required for the realisation of MaaS [9]. In terms of business modelling, a review of definitions of the MaaS ecosystems is presented in [10], while the dynamics between different actors of such ecosystems and their respective suitability in acting as principal operators are investigated in [11]. Furthermore, of interest are MaaS schemes where large corporations subsidise the provided mobility services to their employees for work related travels [12]. As is the case of other initiatives of the same nature, policies that remove constraints need to be in place for MaaS to become a mainstream travelling alternative. Such barriers may be attributed to highly regulated transportation services that impede innovation [13], or lack of data sharing and standardisation of interfaces to enable the required systems integration [14]. Technology is expected to play an important role when the maturity of MaaS schemes reaches a level where multiple MaaS operators and mobility service provides need to collaborate in a single city. Data fusion [15], journey planning and ticketing applications [16] and integrated multimodal information platforms [17] are some of the technologies that need to be realised as enablers of MaaS. The above-named technologies and systems are present in most conceptual and prototype MaaS architectures proposed in the literature [10].
This paper is positioned in the technological domain of MaaS and presents the implementation of a journey planner that can support MaaS schemes. Our solution was developed as part of the MaaS4EU [18] H2020 European project and it was evaluated in pilot demonstrations in the cities of Manchester (UK) and Budapest (Hungary), during which users revealed their opinions in relation to its functionality. The remaining sections of the paper are structured as follows. Section 2 includes a review of journal planning and routing approaches found in the literature, while Section 3 presents the methodological approach for journey planning of the proposed solution, together with the underpinning models. The implementation approach with the use of microservices is illustrated in Section 4 and the results of the journey planner’s user evaluation are presented in Section 5. Finally, some conclusions and recommendations for further research are discussed in Section 6.

2. Literature Review

Route planning applications have evolved considerably during the last two decades, primarily due to the extensive use of mobile devices from users of all ages. Nowadays, baseline information about routes include paths to follow, distances and travel times, prices, points of interest, number of transfers and connections with different means of transport [19,20]. Research into algorithms and models for efficient routing dates back to the late 1950s with the inception of the shortest-path algorithm by Dijkstra [21]. Since then, a number of improvements in the computational properties and efficiency of the algorithm have been proposed, including the A* heuristic which limits the search space [22] and the introduction of contraction hierarchies which simplify the graph structure for faster attainment of solutions [23]. These graph-based algorithms have been extended to accommodate the temporal nature of services operating using timetables. Time-dependent algorithms can be grouped into time-expanded in which departure times of services are modelled as distinct nodes [24], and time-dependent where timetable entries are treated as events (representing nodes) for the construction of graphs that are valid for predetermined time horizons [25]. In the last decade, non-graph techniques have posed as promising alternatives in planning journeys for public transport services. These techniques depend upon the finite number of stops that govern public transport services and the concept of a trip as a sequence of stops to generate routes [26,27]. Moreover, a hybrid approach of graph- and trip-based transit routing has been presented in [28]. Thorough surveys for different routing algorithms and techniques can be found in [29,30,31].
With the evolution of Intelligent Transport Systems (ITS), new opportunities materialised in enhancing journey planners with real-time information. Examples include the integration of real-time transit information [32], dynamic integration of user generated data [33] and real-time [34] and forecasted [35] traffic information as part of the route generation functionality.
In a MaaS implementation, different modes and mobility services may be used for reaching a destination. Some of them may be fixed in terms of paths and points of access (for example public transport and station-based bike sharing), while others may be dynamic (for example free-floating car-sharing and ride-sharing) and in the near future automated [36]. In addition, constraints such as the geographical boundaries of a particular service, the spatiotemporal limits for different services or the availability of services based on the remaining quotas on a user’s subscription package need to be taken into consideration. For example, a free-floating car-sharing service may have specific boundaries within which vehicles must be parked and a bike sharing service may allow the utilisation of a bike for up to 30 min for a single trip. Adding extra layers of complexity to the generation of travel options, these limits of services may have multifaceted properties. In the above stated example, the car-sharing service may be available within a central business district, but also allow the picking-up and dropping-off of vehicles at the airport that links with that district but is not adjacent to it. Therefore, MaaS needs to be supported by a multimodal journey planning solution that can handle the above-stated requirements. A number of researchers have reported advances to conventional routing techniques for handling multimodal journeys. An ensemble of techniques including Simulate Annealing (SA), fuzzy logic and Analytical Hierarchy Process (AHP) has been employed for multimodal planning in [37], while [38] describes a heuristic-based approach for multimodal journey planning. A genetic algorithm with chromosomes that represent routes and aims to optimise multimodal journeys has been reported in [39], while [40,41] proposed multi-modal routing methods to compute intermodal routes including car, bicycle, public transportation, car-sharing, bike-sharing and walking, such that all these modes of transport can be used within a single route. Most of the existing research efforts use multi-level, or super graphs for addressing the problem and although they may perform well when a limited number of semi-dynamic modes is considered, their effectiveness in true MaaS provisions is uncertain. In particular, the following challenges need addressing [38,42]:
-
Graph-based algorithms involve a computationally expensive pre-processing stage which cannot take into account real-time information unless it can be reasonably implemented on the fly. Therefore, many dynamic (floating car-sharing) and on-demand (ride-hailing with different ETAs based on location) services included in MaaS cannot be easily integrated.
-
Existing approaches lack flexibility in applying soft or hard constraints dynamically. As MaaS requires the generation of routes that can be realised based on the user’s subscription plan or the characteristics of a particular service, this is an important requirement. Soft constraints may be related to user preferences and as these increase, so does the computational intensity of embedding them into cost functions for a graph.
-
The integration of new requirements may necessitate significant alternations to an algorithm’s operation. For example, a requirement that was identified as part of the MaaS4EU project was the redirection of a user through a ticket collection location prior to boarding a public transport service. Although this can be encoded as a waypoint in existing techniques, it is unknown how the modes assigned to the journey’s segments before and after the waypoint may be applicable to this requirement.
The above stated limitations of current practices led to the development of our journey planning solution. Using a heuristic-based approach, journey options are constructed in a structured and progressive manner to incorporate data and apply constraints dynamically.

3. Methodology

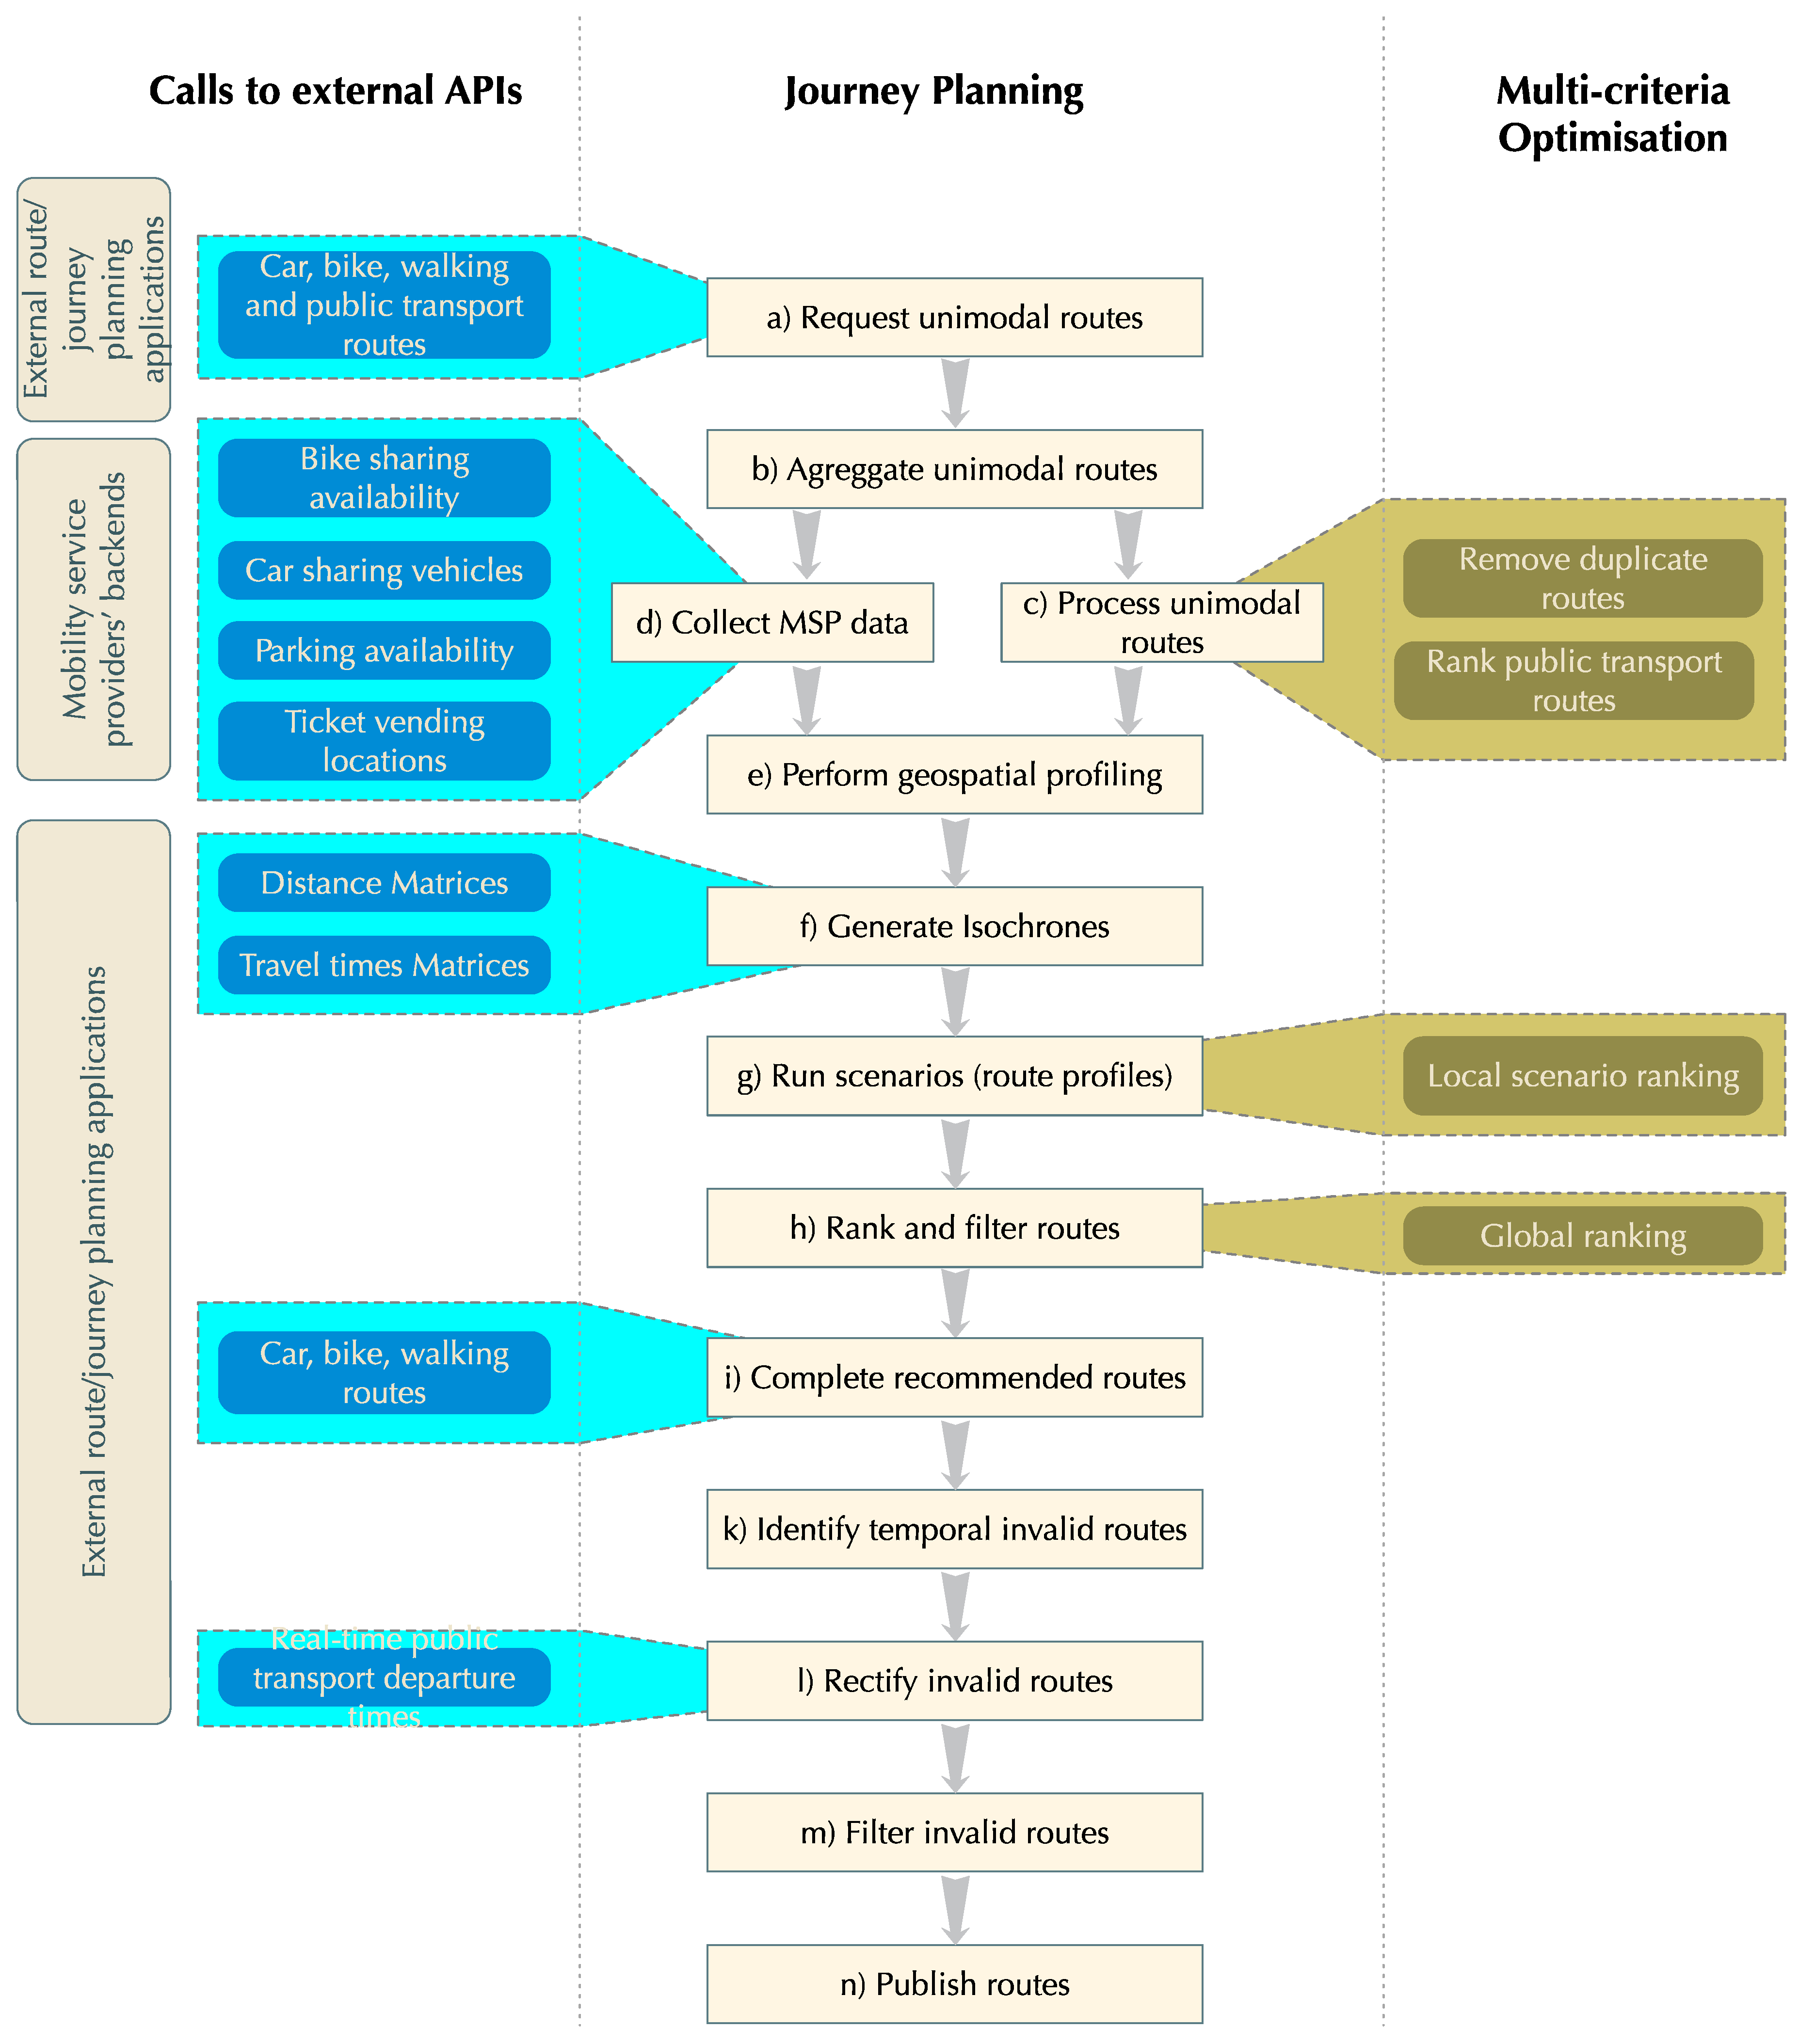
3.1. Journey Planning Approach

This section presents our proposed journey planning approach, which is composed of discreet phases dedicated to data collection, information processing and journey optimisation methods. The overall approach is depicted in Figure 1, with further elaboration on each step of the approach given below.
(a) Request unimodal routes: The planning approach commences with the generation of unimodal routes using open source and proprietary third-party routing applications. Routes for private vehicles, public transport, cycling and walking are generated using five APIs, namely; Google Directions API [43], Bing Maps Routes API [44], HERE Routing [45], Open Source Routing Machine (OSRM) [46] and Open Trip Planning (OTP) [47]. The implicit benefits for this method are the utilisation of established and widely used solutions, the integration of real-time information as part of route creation and the continuous updating of the supply information (i.e., network structure, public transport timetables, etc.). All unimodal routes generated at this stage of the process are considered by the route recommender described later in the paper. By default, a route involving the use of a private vehicle is always returned unless the user (i.e., no driving license), or routing (i.e., driving deselected as an option) preferences prohibit it.
(b) Aggregate unimodal routes: As each API uses different data structures for the representation of the route, this stage involves the transformation of the different API responses to a harmonised data format for further processing. In our system, each route is made up of legs, with each representing movement with a particular mode of transport (Figure 2). Non-fixed routes (i.e., driving, walking, cycling, etc.) are further decomposed in steps for more granular representation of the paths. Fixed routes with stops (i.e., public transport) incorporate information about the stops included in the services. In addition to legs constituting movement between locations, action legs included in the routes symbolise activities that users undertake during a modal shift. Examples include dropping off a shared car at a particular location, collection of a ticket before boarding a public transport vehicle and others.
(c) Process unimodal routes: Before the collected unimodal routes are utilised as part of the journey planning, processing to (i) remove duplicates and (ii) rank public transport routes takes place. The former filters out duplicate routes that may have resulted from the use of the different external APIs. This is a common outcome especially for public transport routes, where a small number of alternatives is available for a particular urban trip. The latter involves the ranking of public transport routes based on different criteria. This is done primarily for performance improvement purposes, as public transport routes form the backbone of several multimodal routes generated by our solution. The ranking is based on the TOPSIS (technique for order performance by similarity to ideal solution) technique, which has been applied in different transport studies to address routing related decision-making problems [48,49]. The selected technique operates by comparing alternatives against an ideal solution and offers advantages such as logic that imitates decision making of humans and low computational complexity [50], which are pertinent to our approach. For the case of public transport route ranking, the criteria used are travel time, number of changes, arrival time, waiting time and total walking distance during the trip with weights 0.25, 0.2, 0.2, 0.15 and 0.2, respectively. The aforementioned list of criteria is not exhaustive, and the selected weights represent a baseline configuration for the purposes of our initial prototype. It must be noted that cost has not been considered as one of the criteria used for the ranking. The main reason is that in the overwhelming majority of cases (including the ones investigated in the MaaS4EU project for which the solution was developed) MaaS subscriptions include unlimited use of public transport. However, the adoption of TOPSIS allows for the easy incorporation of new criteria and customisation of weights using research findings or user preferences. For example, it has been reported that users perceive accessibility to public transport differently according to their sociodemographic characteristics and mode of transport [51]. Such a finding may be used to define sets of weights for different user groups and travel modes. Furthermore, user preferences may play a pivotal role in the determination of weights and scoring of criteria. In fact, in our system the scoring of the walking distance parameter is based on its deviation from a preferred walking distance stated by each user.
(d) Collect MSP data: During this step data from Mobility Service Providers (MSPs) participating in the MaaS schemes established for the MaaS4EU project are collected. Our prototyped solution integrates MSPs’ data using the following APIs:
  • Bike sharing (MOL Bubi [52]): a data endpoint that provides information for bike sharing stations including location, available and booked bikes, free racks, station name, etc.
  • Car sharing (GreenGo [53]): data related to available vehicles of an electric car sharing fleet including vehicle location, range, license plate number, make, model, etc.
  • Ride hailing (City Taxi [54], Uber [55]): an API that retrieves the estimated time of arrival of a vehicle at a specific location.
  • Ride sharing (Motar [56]): an API that provides available rides between an origin and destination city/location with information about the cost of the trip, travel/departure/arrival times, availability of spaces in the vehicle, as well as qualitative information about the driver such as user scoring.
  • Parking spaces: a database interface that allows the collection of information regarding parking spaces that can be used as part of Park and Ride (P&R) trips.
Due to the dynamic nature of the above stated services and for reliable journey planning, this information must be collected for every new trip request.
(e) Perform geospatial profiling: Geospatial profiling takes place for discovering options that allow the integration of modes and the realisation of the trip scenarios explained later in the paper. This phase involves the reduction of the geographical search space using the origin and destination points of the journey and the identification of interchange points within that space. Such points may correspond to public transport stops, bike-sharing stations, parking spots or locations of parked vehicles belonging to a car-sharing operator.
(f) Generate isochrones: This step of our approach deals with the generation of isochrones to estimate the travel times and distances between the points identified as part of geospatial profiling. We utilise two existing APIs: OSRM’s Table service (for walking and cycling) and Mapquest’s Route Matrix service (for driving) to derive the required information. Both APIs accept a list of points and return a matrix with rows representing origins, columns representing destinations and cell values representing travel time and distances between the locations. As a minimum the following isochrones are being generated for each request:
  • walking distances from/to public transport stops and the closest bike-sharing station, car-sharing vehicle and parking station
  • driving distances from origin/to destination for each public transport stop
  • walking distances from origin/to destination for each bike-sharing station
  • walking distances from origin/to destination for each car-sharing vehicle
The above data are required for the realisation of the baseline set of scenarios explained later in the section.
(g) Run scenarios: The underlying heuristic technique is implemented in the form of scenarios that describe different route compositions. Each scenario involves the integration of services in a predefined way and incorporates decision making analysis for selecting alternative options throughout a journey. A heuristic of the same nature has been adopted for route choice modelling in [57], where the problem of choosing routes is decoupled into different levels of detail based on a hierarchical decomposition of urban spaces. Likewise, the proposed heuristic divides the journey planning into distinct tasks with emphasis on optimising the routes in segments rather as a whole. Table 1. lists the scenarios and their respective use cases included in the prototype version of the MaaS4EU journey planner, together with conditions and properties for their realisation.
An explanation on how a route is generated using scenarios is presented in the next section of the paper.
(h) Rank and filter routes: The execution of the scenarios generates a number of multimodal routes, which together with the unimodal ones create a set of multiple trip options. A filtering function removes routes that are incompatible to the user’s profile, or subscription package, while a ranking function considers different route utilities to order the generated routes. The route utilities consider optimal use of the MaaS plan the user has subscribed to, as well as the impact on the environment and related long-term effects of potential user choices. Moreover, specific goals and preferences of the MaaS operator, such as the promotion of a particular transport mode over another are also considered in the process of arranging the available routes. Fundamentally, this is a route recommendation functionality that nudges travellers so that a change in their behaviour can be achieved in the longer term. More details on the route recommendation aspects are provided in Section 3.3.
(i) Complete recommended routes: The list of recommended routes generated in the previous step is evaluated and incomplete data are populated. As the generation of isochrones provides high-level information about travel times and distances for specific segments of the route, detailed paths need to be defined. This is achieved by the use of external routing applications as in step (a).
(k) Identify temporal invalid routes: Ranked multimodal routes that involve public transport have resulted by the substitution of a part of a public transport sub-route by legs assigned to other modes. As a result, a stop that was an intermediate one in a bus leg may have become the departing stop for that leg. Therefore, the original departure time from the boarding stop must be evaluated to ensure that it is still valid. The following rules apply as part of the evaluation:
IF   R s t + i = 1 n L n t t > L n + 1 d t   OR   R s t + i = 1 n L n t t < L n + 1 d t + w t   THEN   R   is   invalid
where: R is the route being evaluated
R s t is the start time of the route (Epoch time)
i = 1 n L n t t is the total travel time of all legs preceding a public transport leg in R
L n + 1 d t is the departure time of a public transport leg in the R
w t is a waiting time limit (equal to 5 min)
(l) Rectify invalid routes: Invalid routes identified in the previous phase are rectified by updating the timetabling information of the public transport legs. This is achieved by the utilisation of the HERE Public Transit API [58], General Transit Feed Specification (GTFS) public transport timetables that are being retrieved on a regular basis from public sources [59] and real-time data feeds that report possible disruptions to services.
(m) Filter invalid routes: Although filtering of partial or completed routes takes place throughout the processing pipeline (especially in steps g and k), a final filtering procedure removes options that may lack functionality or efficiency when analysed holistically. Let us consider the following example of a route where the origin and destination are in very close proximity (i.e., less than 1000 m of walking distance). An option of a journey using bike-sharing may reach this route generation stage as it may meet all soft and hard constraints applied in previous processing steps. However, this option may include a 400 m walk to reach the bike station closest to the origin (which may bring the user further away from the destination), a 600 m cycling leg to reach the bike station closest to the destination and another 400 m walking leg to reach the destination from there. As it can be understood, the efficiency of this option is significantly lower compared to a single walking leg from origin to destination. A list of rules (applicable to different scenarios) has been embedded in our solution to filter out such dysfunctional options.
(n) Publish routes: Finally the rectified recommended routes are published to the users through the interface that was used for the request. This may be the to the MaaS4EU journey planning web application (Figure 3), the MaaS4EU mobile app (Figure 4).

3.2. Scenario-Based Heuristic

Our system produces multimodal routes using predefined scenarios which combine different modes and services to generate a valid route from an origin to a destination. Each scenario operates in a similar way and includes functionality for; loading the data necessary for implementing the scenario, applying hard constraints for eliminating invalid trip options, applying soft constraints for incorporating user preferences, ranking different alternative route segments (legs) using the TOPSIS technique and constructing routes using the highest ranked alternatives. To delve deeper into the underlying principles of the multimodal route generation, an example of a heuristic that generates routes composed of public transport and bike-sharing legs (in that order) is illustrated in Table 2.
  • Lines 1–4, load all the data necessary for the realisation of the scenario. Such data may include unimodal routes, user profiles, mobility services availability, etc., and have been retrieved before the running of the scenario. Following this, the locations of public transport stops and bike stations that can be utilised as part of the scenario are identified (Figure 5a).
  • Line 5, applies a hard-constraint based on the profile of the user, which stipulates that the walking distance from the origin to the closest bike station should be within limits set in the user’s profile. If the constraint is not met, the scenario execution is aborted without returning any routes.
  • Lines 6–8, utilise existing or generate new isochrones based on the locations of the public transport stops and bike stations to potentially be included in the routes. Walking distances between each public transport stop and its closest bike station (Figure 5b) and cycling distances and times between all bike stations (Figure 5c) are derived.
  • Line 9, defines all the possible bike-sharing legs in a simplified form and with information related to the origins, destinations, distances and travel times.
  • Lines 10–14, derive the valid bike-sharing legs based on constraints set by user preferences. These include the walking distance from the alighting public transport stop to the bike station and the cycling distance of the leg (Figure 5d).
  • Lines 15–19, construct partial routes composed of public transport and bike sharing legs. This involves substitution of parts of the original public transport route with a bike-sharing leg. All the information required for the application of TOPSIS Multi-Attribute Decision-Making (MADM) is included in the partial route.
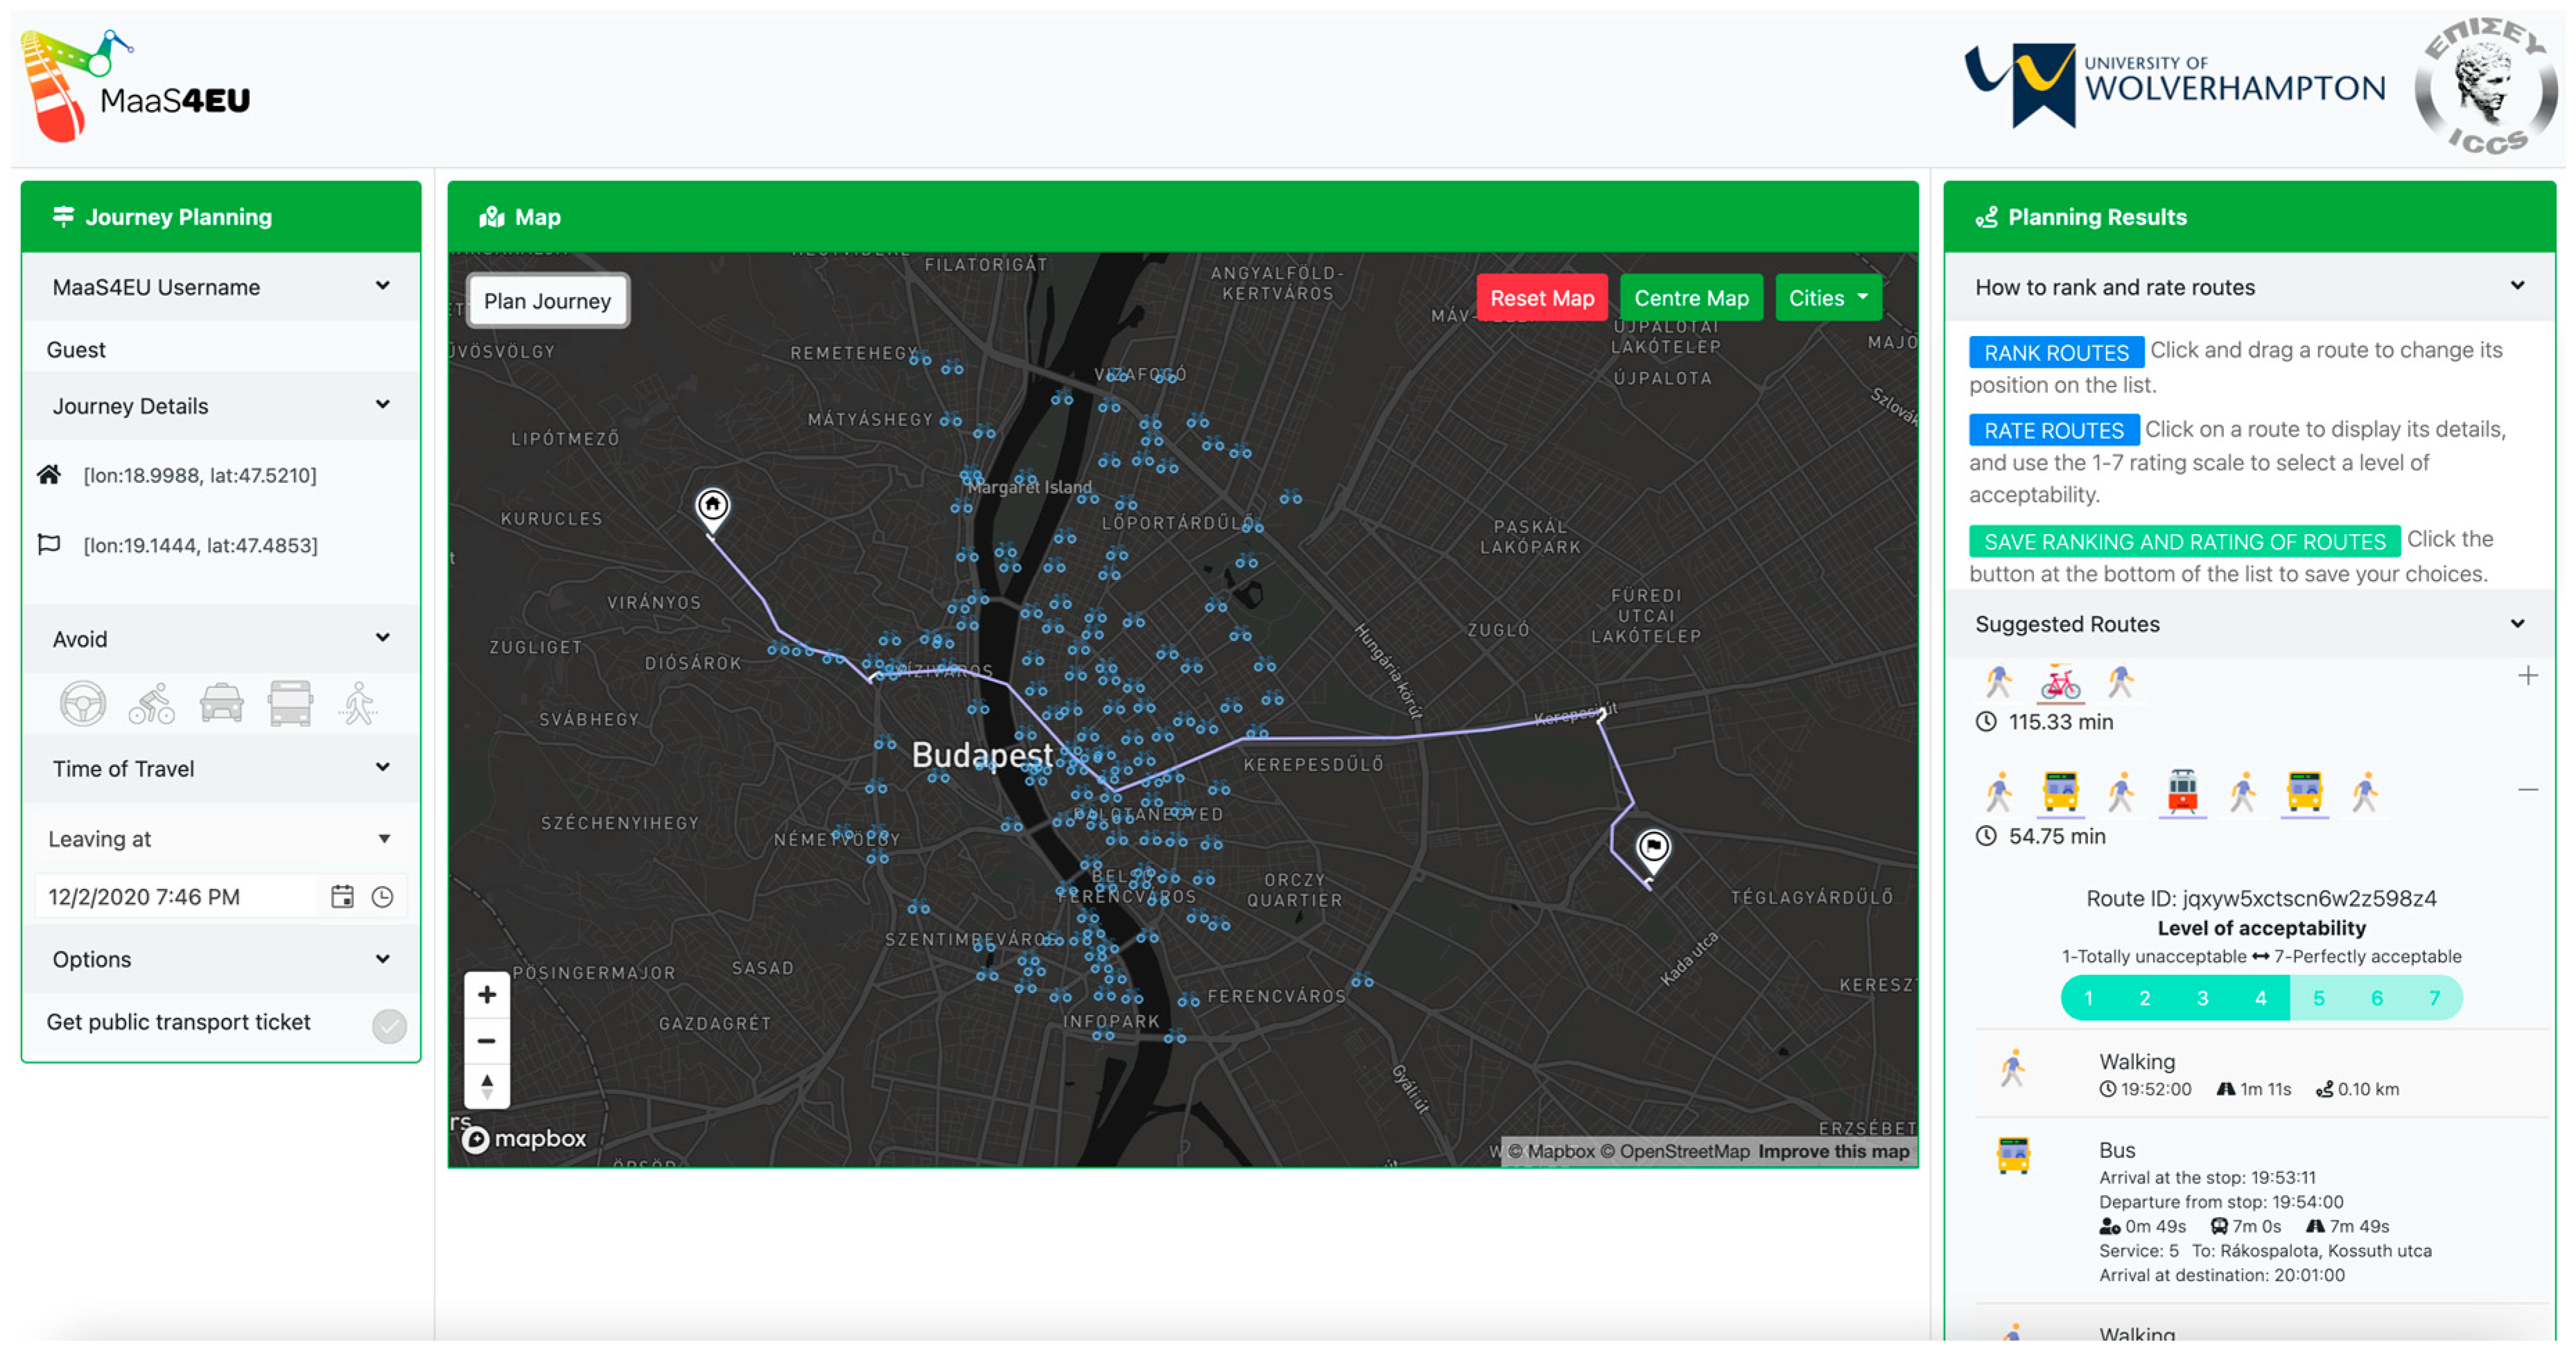
  • Lines 20–26, rank the constructed partial routes using a set of criteria with scores and weights based on empirical investigations with experts participating in the MaaS4EU project. This was achieved by a preliminary evaluation round using the web application shown in Figure 3. Experts were asked in their professional capacity to rate the level of acceptability of each route (Figure 6) and rank the presented routes in the order of preference (Figure 7). For this particular scenario, the details for the application of TOPSIS can be seen in Table 3.
  • Lines 27–30, the top-ranked sub-routes are populated with additional legs for constructing the completed route. Such legs may be ‘action’ ones for picking-up and dropping-off the bike and walking legs for (a) the transition from public transport to bike-sharing and (b) from the last bike sharing station to the destination.

3.3. Route Recommender

The aim of the route recommender is to support users in the everyday use of MaaS and more specifically their transportation decisions by providing a personalized list of routes. Given a list of alternatives for travelling from A to B, the route recommendation service logically structures the available choices through choice architecture design elements. The choice architecture approach provides default options and filters and ranks the route options according to user goals and preferences. As stated in the previous section, the service considers optimal use of the MaaS plan the user has subscribed to, the impact on the environment and related long-term effects of potential user choices, as well as specific goals and preferences of the MaaS operator. The service offers an intelligent decision system, which is tailored for route choice applications and can assist urban travellers and commuters to select transportation options that are comfortable, yet satisfying the MaaS operator’s goals and leading to an optimal use of the MaaS plans.
Filtering Rules: The aim of the filtering rules is to remove route options incompatible to the preferences or characteristics of the user. A set of rules has been implemented and each available route is compared against those rules based on its characteristics. In case the system identifies characteristics that are not relevant for the user, the route is removed from the available set. Examples are:
  • For users without a driving license, routes with modes that require driving are excluded.
  • Routes with long bicycle distances (as defined by the user) are excluded.
  • Routes with long walking distances (as defined by the user) are excluded.
  • Routes with services for which a user does not have any allowances left (i.e., minutes left for car sharing service).
Context Inference: In order to be able to acquire a broad and inclusive understanding of the concept of context in travel choices, we performed an analysis of related studies [60,61]. Our aim was to collect situational and contextual factors that are relevant for travel behaviour and travel decisions.
The aforementioned analysis resulted in a broad and inclusive understanding of the concept of context in travel choices, based on which we have selected a number of situational and contextual factors which are relevant for a MaaS route recommendation service. The variables are binary, which means that they are activated when the conditions that define them are present and depend on the characteristics of the alternative routes for the current trip, the user’s profile and recorded behaviour, and the state of the weather. More specifically, there are four groups of variables as follows:
  • Based on the users’ past behaviour, which are calculated using as input past choices the user has made in the period following the subscription to a MaaS plan and the inferred behaviour as it is logged through the usage of the subscribed MaaS plan. These context variables include: increased car-sharing usage trend; increased bike-sharing usage trend; increased taxi usage trend; increased ride-sharing usage trend.
  • Based on trip characteristics, which can be calculated using as input the available routes. These context variables are activated on a per route basis and include the walking distance and the bike distance.
  • Based on combination of users’ past behaviour and trip characteristics, which can be calculated using as input both past choices the user has made in the period following the subscription to a MaaS plan as well as the available routes.
  • Based on environmental information. In this case, we make use of information about the environment in which the route recommendation takes place. We define the variable “Nice Weather” which refers to the current status of the weather and is set to True when the temperature level exceeds a certain configurable threshold, and the precipitation level is below another configurable threshold.
  • Based on a combination of environmental information and trip characteristics. We make use of information about both the business environment in which the route recommendation takes place and the available routes.
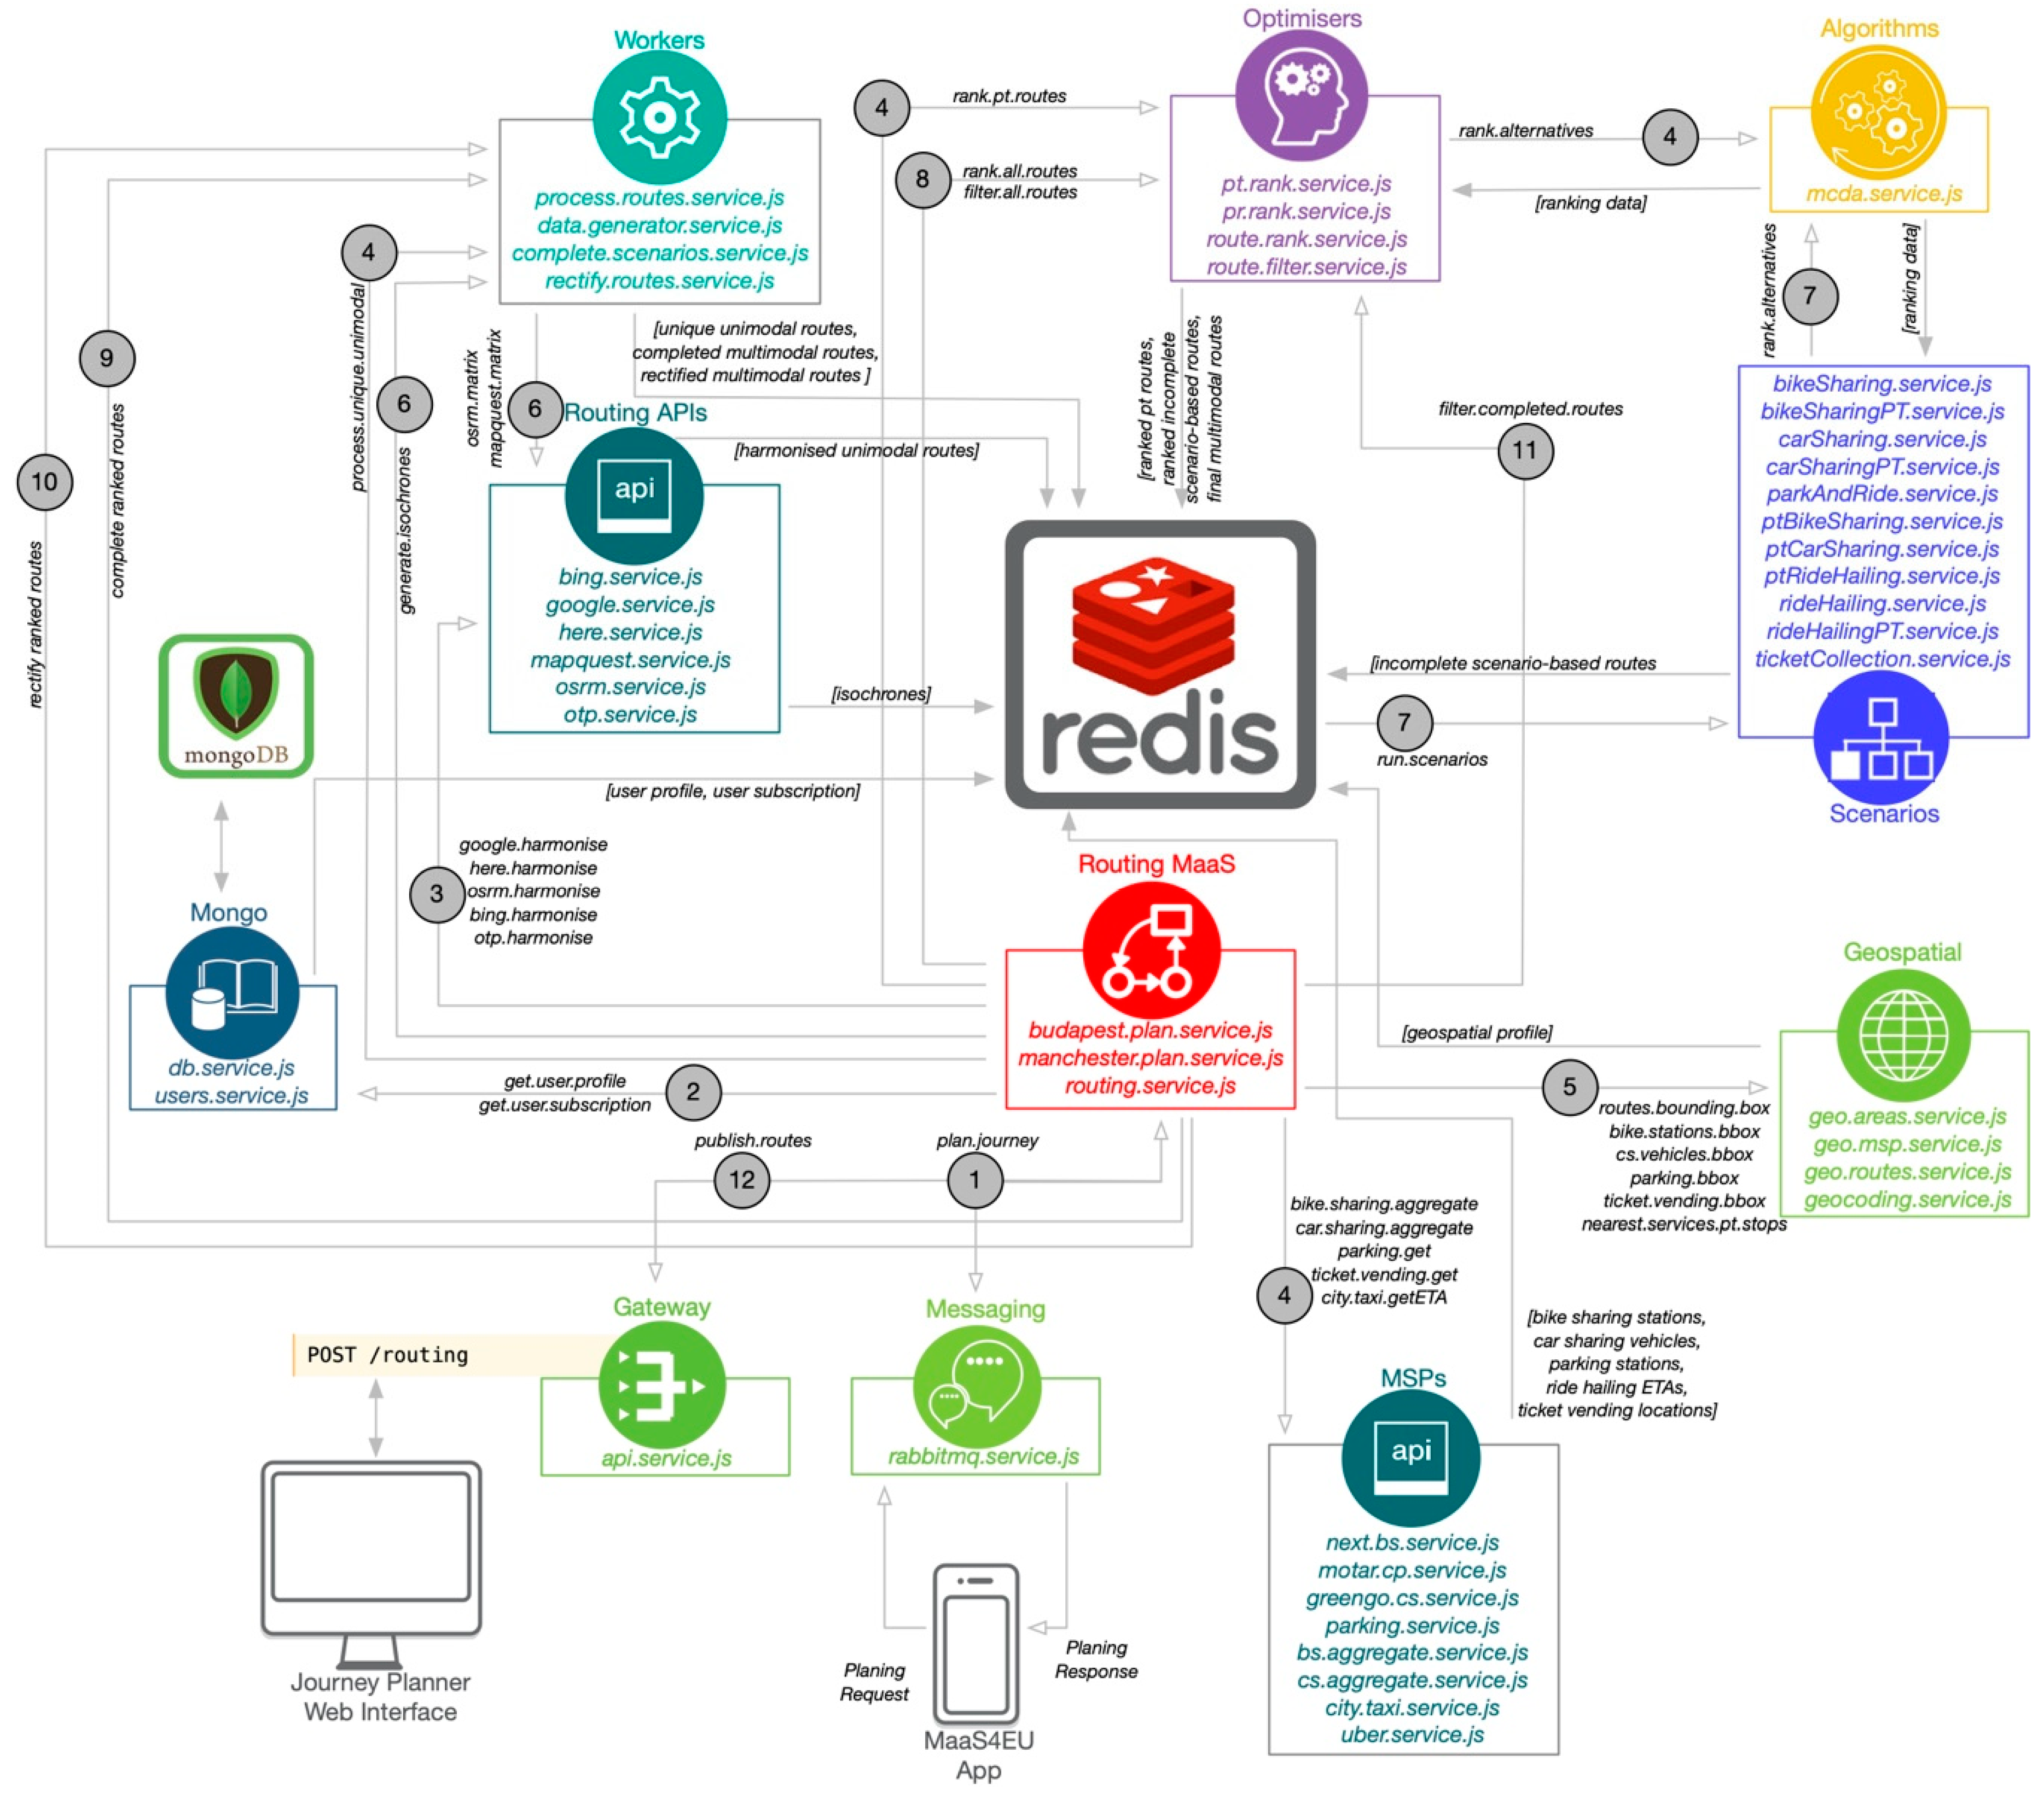
Route Utility Calculation and Ranking: The aim of the Route Utility calculation function is to process the available routes and estimate a personalised utility per route for the specific user in the current context. The utility is used for ranking the routes and presenting them such that routes which adhere to user preferences as well as the current context and contribute to the optimal use of the MaaS plan the user has subscribed to, are ranked higher. The goal is to highlight the routes that lead to the optimal use of the MaaS plan, while respecting user preferences, considering the current context and increasing their chances of being selected. Eventually, the utility calculation function supports user decisions towards a personalised and context aware MaaS experience.
The Route Utility calculation function comprises of several sub-functions (Figure 8). In more details the sub-functions provide different views of how the routes should be ordered and presented to the users, which are eventually consolidated in a single ranked list of routes that are communicated to users through the MaaS app. The sub-functions fall under two main views of how the routes should be ordered, the personal and the system view.
The personal user view that considers user preferences and their potential variations in different contexts based on past user interactions with the MaaS4EU application. The personal utility of each route for a given user is calculated as the cosine similarity between the user vector and the corresponding route vector. The length of the vector equals the number of the distinct transport modes supported by the journey planner. A user is represented as a set of feature-value pairs with features representing his/her relative past usage of the various modes of transport at that particular time of day. Each day is divided in intervals (i.e., morning, noon, afternoon, night hours in weekdays/weekends), so that past user behaviour for the specific interval that the route request is made for can be considered. In case no such past data from previous interactions with the MaaS app are available yet, the user vector is populated by considering user stated preferences about the usage of the various modes s/he has provided during the user registration process. Similarly, for the representation of each route vector, the feature-value pairs represent the relative presence of the various transport modes within the route. The relative presence of each transport mode is calculated as the norm of a sub-vector consisting of the relative duration and distance of that mode in the route. The values of all the features are normalized so that they sum to 1. The similarity between a user vector (A) and a route vector (B) is calculated as:
S i m i l a r i t y ( A ,   B ) = cos θ = i = 1 n A i B i i = 1 n ( A i ) 2 i = 1 n ( B i ) 2
where
ai and bi are the features of the vectors corresponding to the various transport modes, while
n is the number of transport modes supported.
The similarity ranges from 1 meaning exactly the same to 0 indicating independence, and in-between values indicating intermediate similarity. The routes are ranked on a descending similarity order in that list, so that the most similar routes according to the user preferences are ranked first.
The system and context view, which refers to a computational process that leads to the identification of the current context of the user and a user model that infers preferences through the analysis of past behaviour including user trips and selections of routes in a MaaS app. The ranking of the routes according to the optimal MaaS plan usage utility is done by rearranging the list generated through the personal utility. More specifically, the position of the routes that are mainly performed with a transport mode with an increased usage trend in the MaaS plan (the respective context variables are “Increased car sharing usage trend”; “Increased bike sharing usage trend”, etc.) is rearranged, so that the respective routes are placed at the bottom of the ranked list with the aim to facilitate optimal usage of the purchased MaaS plan. Similarly, in the ranked list created by considering the mode promotion utility, the routes that are mainly performed with a transportation mode (e.g., bike sharing, public transport, etc.) or a mobility service provider (e.g., a specific bike sharing provider) that the MaaS operator wants to promote, are placed at the top of the ranked list. Finally, the environmental friendliness utility is calculated by estimating the CO2 emissions of each route based on a simple linear model that has been tested in real life conditions [62]. The model takes as input the distance covered with a specific means of transportation and a set of emission coefficients per transportation mode as follows: Subway—40 g/km; train—60 g/km; Bus—50 g/km; Car—100 g/km. Note that past research has shown that exact and accurate emission values do not provide additional value when considered by end-users [63] which means that an estimate of emissions’ related information is enough for our case. The routes are ranked on an ascending order in terms of emissions, so that the most environmentally friendly routes are ranked first. In all cases, ties are broken by considering the travel time.
The different ranked route lists are consolidated using the Borda count algorithm and the sum of ranks generated by individual ranking functions to obtain the fused rank [64]. Borda count ranks the routes based on their positions in the basic rankings. If any route has a high ranking in basic rankings it is counted as a high ranking in the final ranking list. The scores of ranking routes in the final ranking list can be calculated as:
S R = [ S i 1 . . S i j . . S k n ]
F ( S i ) = i = 1 k S i
where
SR is a matrix that contains k ranked lists of n alternatives routes (Skn) in its columns (one for each defined utility function) and
F(Si) is the final score of route i based on its positions in the k ranked lists of routes.

4. Implementation

Our proposed system has been implemented using a microservices architecture that allows the decoupling of its functionalities in self-contained software modules (i.e., services). We have utilised the Moleculer [65] micro services framework for Node.js. Such implementation allows the seamless integration of new data sources and APIs, deployment of the solution in computer clusters for improved performance and operational resilience, as well as the introduction of additional routing scenarios with minimal effort. Furthermore, research has shown that microservices-based implementations are suited for MaaS approaches as they allow, amongst other, uncomplicated user customisation [66]. A diagrammatic representation of our implemented system along with the interactions (in numerical order) between services that take place during a journey planning task is depicted in Figure 9, while a brief description for the different groups of services is provided below.
Gateway/Messaging: services that allow the integration of the journey planner to external systems. In particular, a web-based interface uses a POST Rest API to retrieve routes, while a RabbitMQ messaging service has been developed for interfacing with the MaaS4EU mobile application.
Routing MaaS: This group is composed of the services that orchestrate the functionality of our solution. A root service accepts all requests and invokes location-specific services depending on the properties (location of origin and destination) of the routing request. The prototype version of the journey planner supports the generation of multimodal MaaS routes for the cities of Budapest and Manchester.
Routing APIs: These services facilitate the collection of multimodal routes and other data such as isochrones from third party providers. An aggregation service within this group harmonises the diverse proprietary data formats to the structured one being used internally in our system.
MSPs: Services responsible for the collection of data from MSPs are incorporated in this group. Depending on the location of the request, several APIs are called for collecting the necessary data. Data harmonisation functionality transforms mobility-specific data (for example, data for car-sharing vehicles) to a common format for seamless integration to the planner. Thus, new mobility schemes can be easily added with the development of a customised service that will act as an interface.
Workers: This group incorporates several services used for data generation and processing of the scenario-based multimodal routes. Examples include the generation of isochrones, the completion of routes by embedding details for specific legs, the temporal refinement of routes, etc.
Scenarios: Services in this group implement the scenarios that generate the routes by integrating the different modes and mobility services included in the users’ MaaS packages. Each scenario is implemented as a single service and embeds a number of methods for the realisation of the heuristics, an example of which is showcased in Section 3.2.
Geospatial: This group includes services that perform geospatial operations for: (i) reducing the geographical search space, (ii) defining the operational areas of the different mobility services and (iii) realising generic functionality for geospatial values (for example finding the nearest point to a polyline representing the boundaries of a mobility service, evaluating if a location is within a region and other).
Algorithms: A single service that implements the TOPSIS multi-attribute decision-making technique. It utilises the TOPSIS [67] open source nodeJS module.
Optimisers: This pool of services implements the ranking and filtering functionality of the proposed solution. This is achieved by the integration of user profile and package subscription data and is deployed in different stages of the methodological approach described in the previous section. This allows the incremental maintaining of the best candidate options from each stage of the processing pipeline.
Mongo: Services in the group implement queries for retrieving and storing data to the platform’s central database, which is a nonSQL MongoDB instantiation.
In the core of our implemented system sits an in-memory database for which the Redis [68] open source data structure store has been used. This is being used as a memory cache for storing the data generated at each processing stage. Thus, allowing services to retrieve the necessary input without complex argument passing mechanisms.
To assess the execution times of our approach, metrics for the different stages of the approach were collected. Figure 10, shows a boxplot with execution times of 40 journey planning requests and for the different stages of the route generation process. As it can be observed, average times range from 350 to 560 milliseconds with an overall average response time being 3.1 s. This is comparable to commercially available applications with similar route planning functionality such as TripGo.

5. User Acceptance Evaluation

The developed journey planner was trialled in the cities of Budapest and Manchester. The former had a more mature MaaS implementation composed of five mobility services including public transport, bike-sharing, car-sharing, ride-hailing (on-demand taxi service) and car-pooling, while the latter piloted a MaaS solution with public transport and ride-hailing (Uber). The pilot demonstrations were facilitated in two rounds, the first taking place in February 2020 and the second between August and October 2020. Three mechanisms were adopted for evaluating the journey planning results generated by our system. These were:
(i).
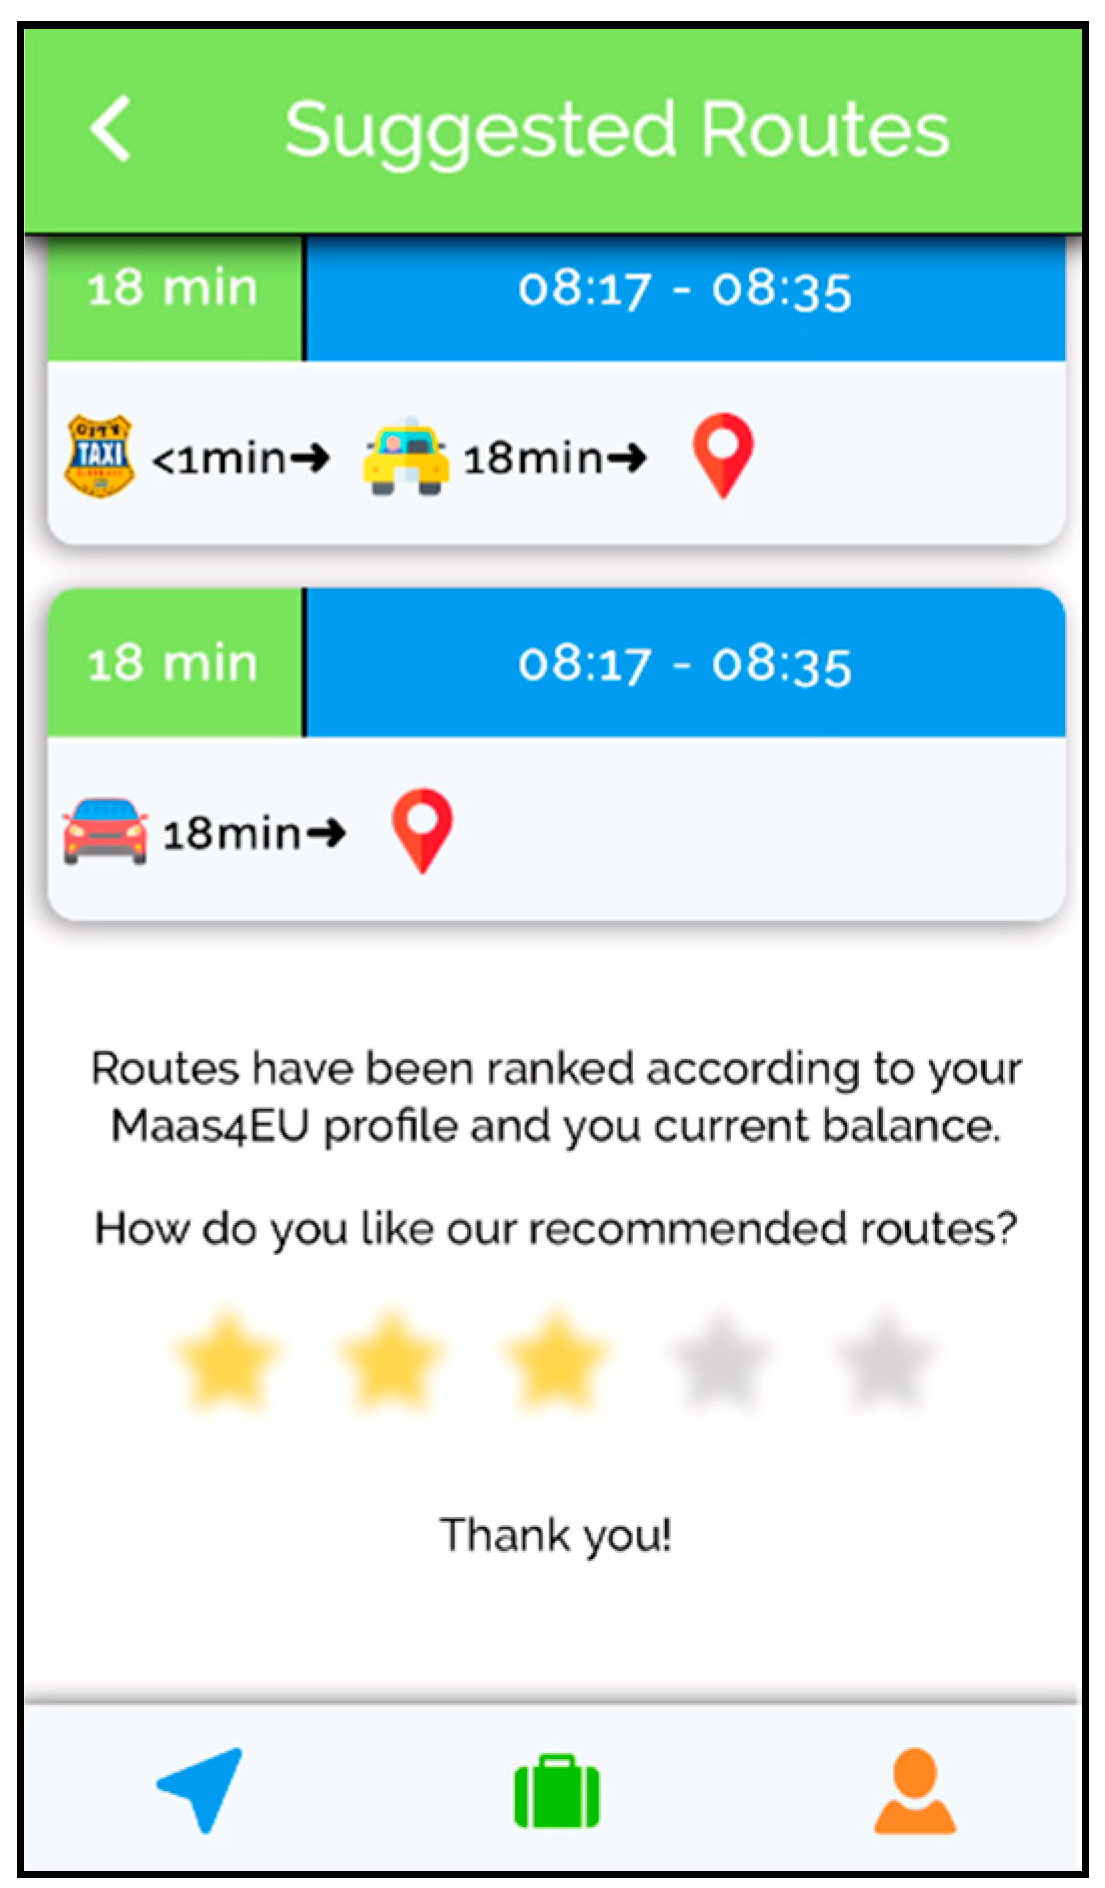
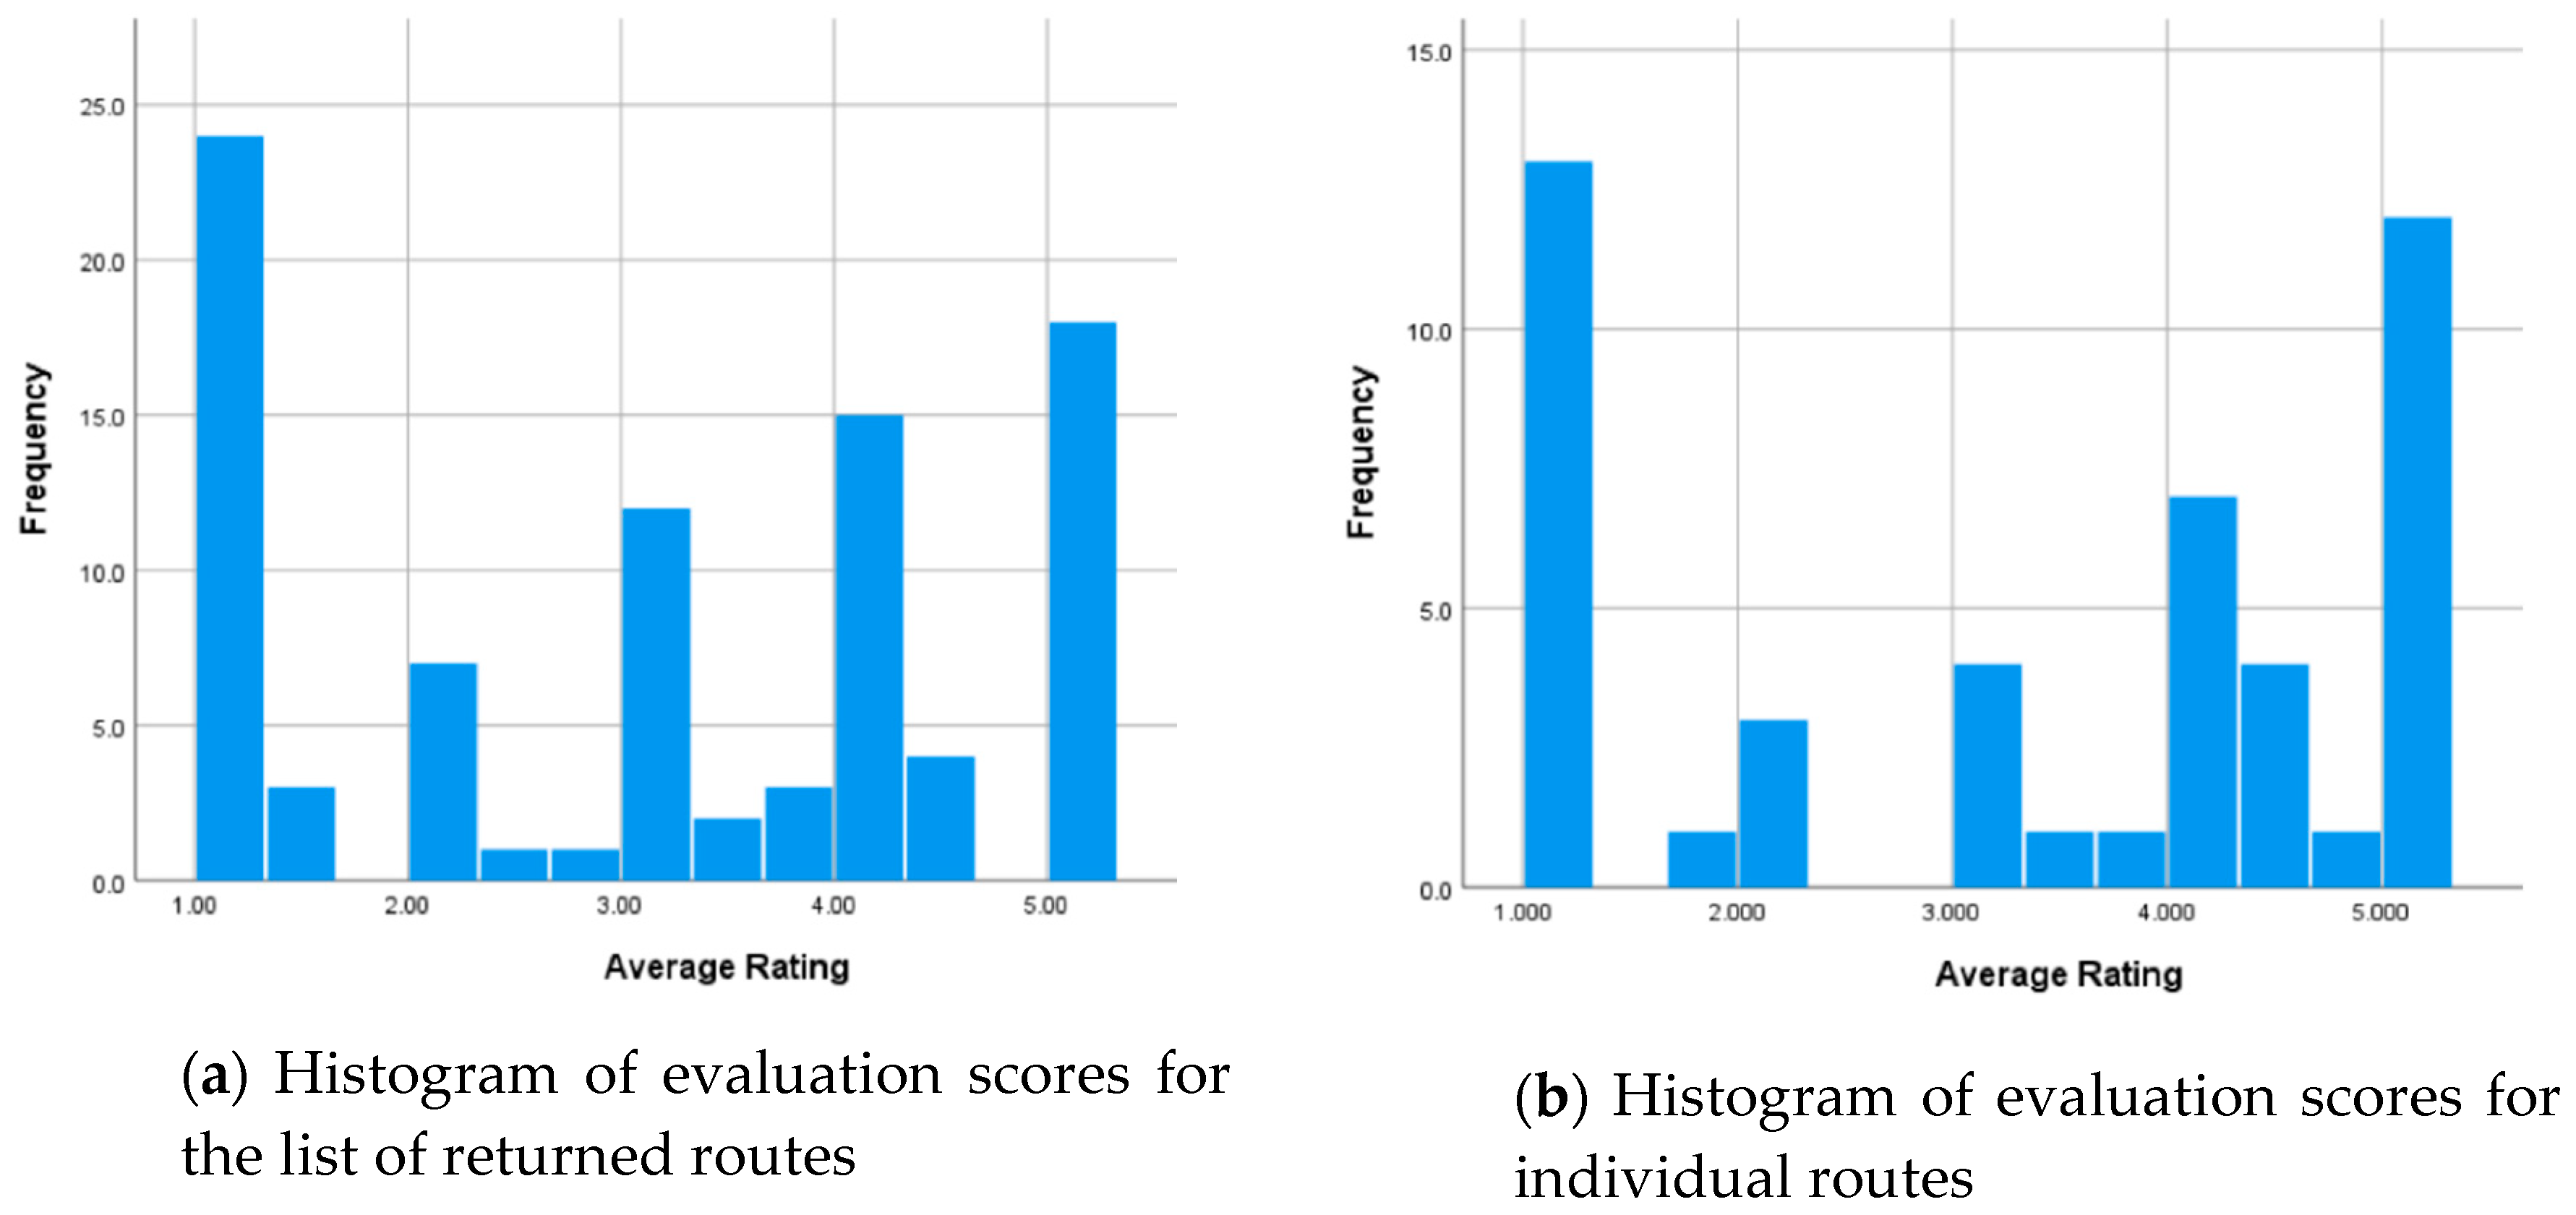
A star rating (from 1–5) evaluation for the group of recommended routes for a particular routing request (Figure 11)
(ii).
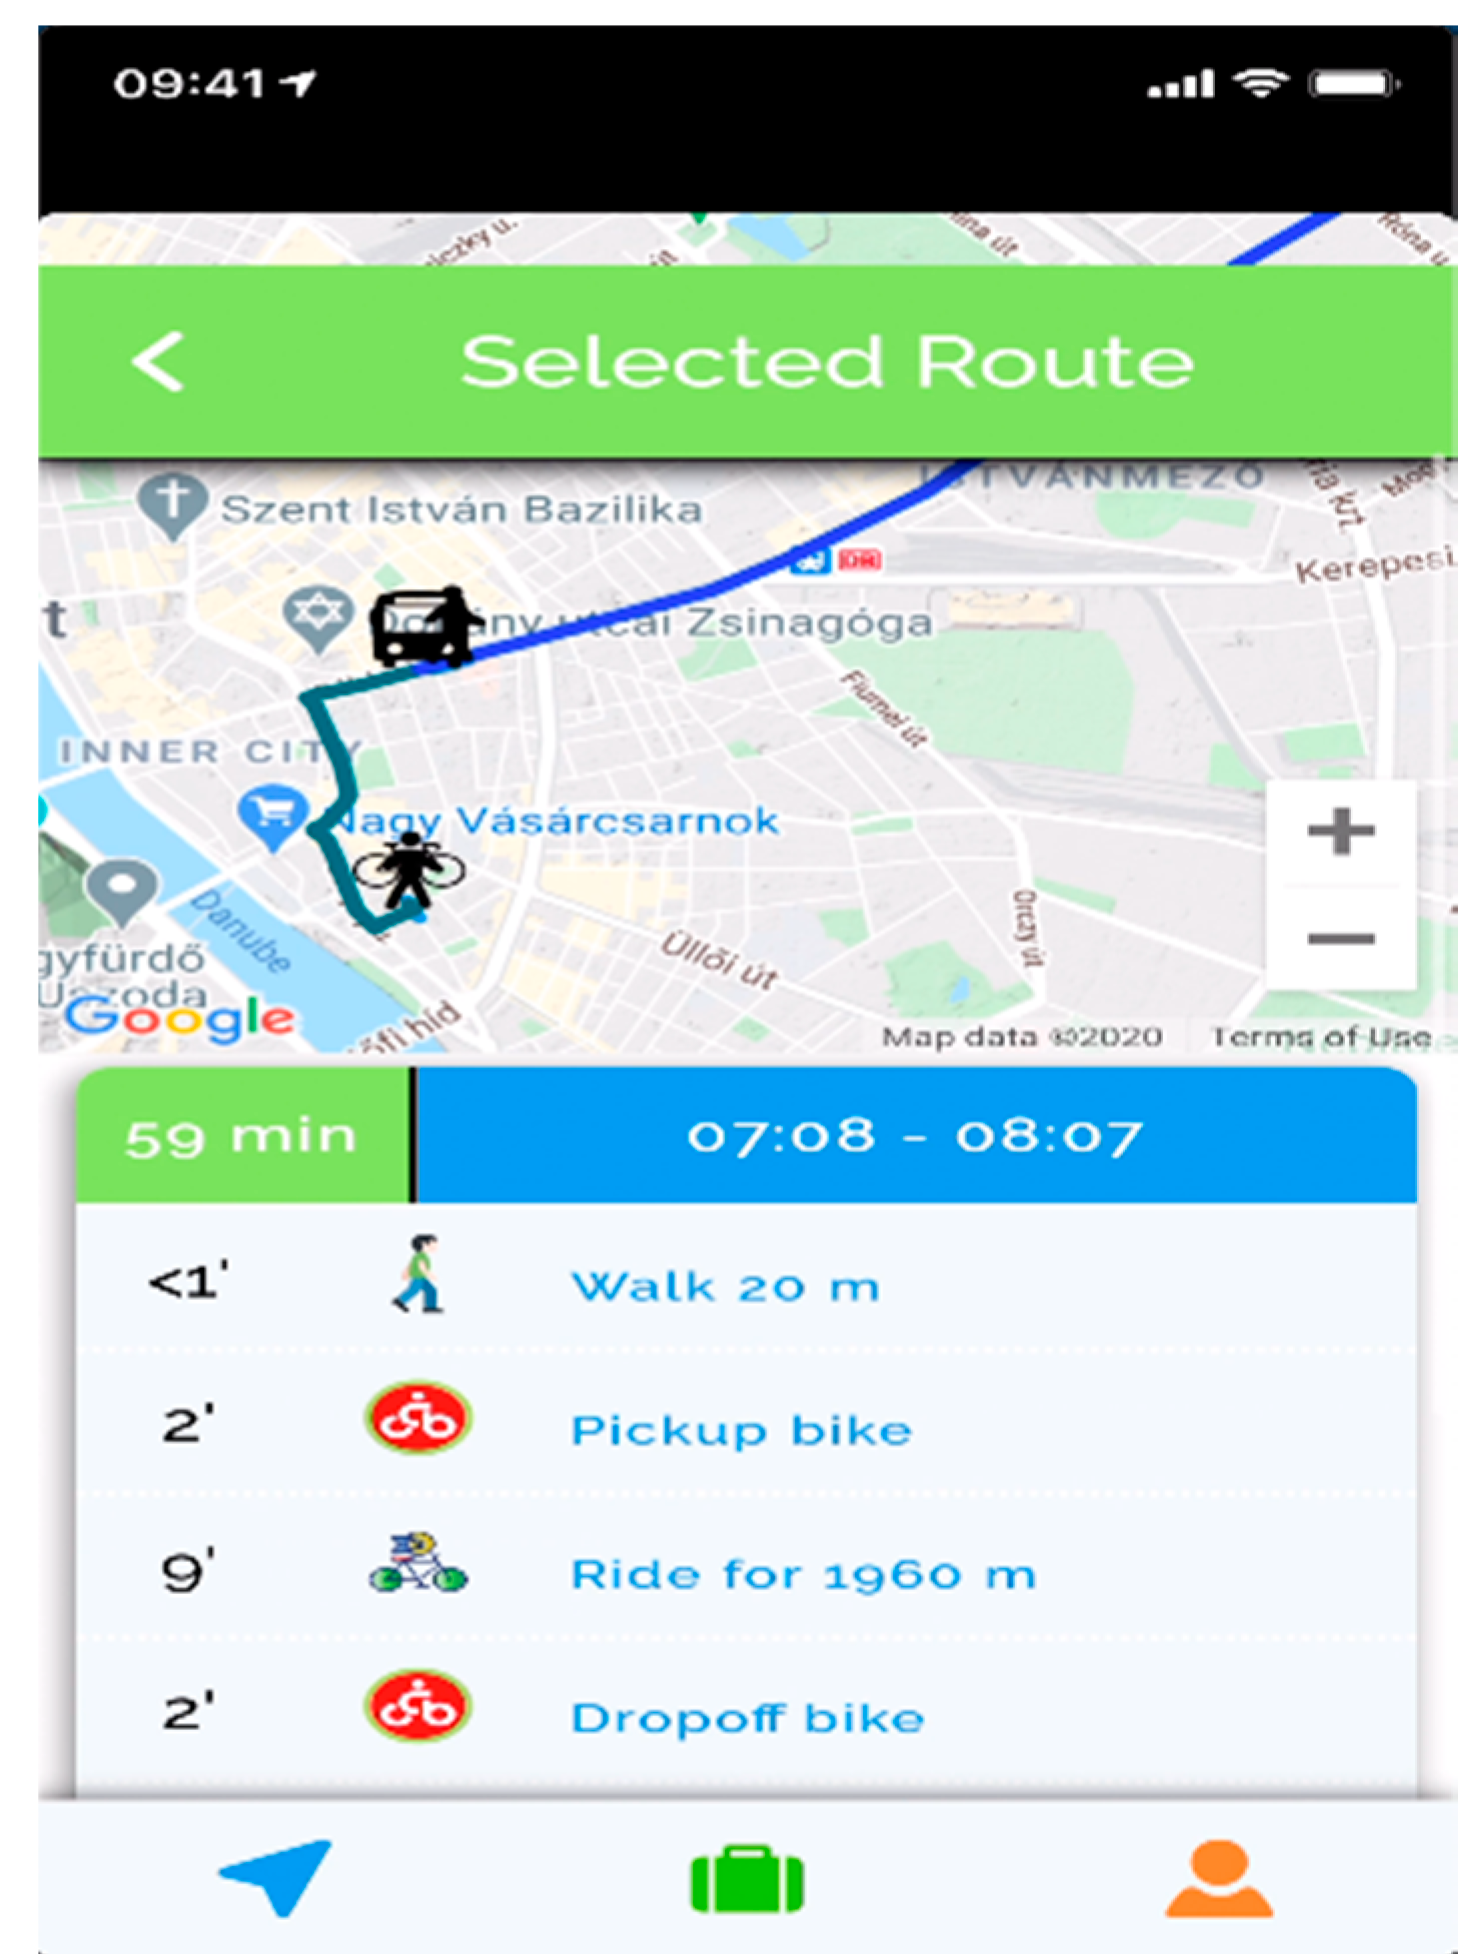
A star rating (from 1–5) for a single route, which was available to the user after selecting one of the recommended routes (Figure 12)
(iii).
A notification service which presented questions with Likert-scale response options for evaluating different properties of the presented routes (for example, fit-for-purpose based on user needs, quality of the route ranking and others, Figure 13).
It must be noted that all evaluation inputs were optional and therefore not all pilot participants’ opinions were recorded. The demographic characteristics of the users that participated in the evaluation can be seen in Figure 14.
In summary 92 users provided at least one evaluation input and the average age of the participants was ~38. The majority of participants were male (~76%), in full-time employment (~79%) and with high school or lower education level (~43%).

5.1. Star Rating Evaluation

The results from this facet of the evaluation relate to the rating that individual users assigned to the group of routes that was presented to them following a journey planning request and the rating that users provided when a single route was selected from the group. As a particular user may have provided multiple ratings, the average scores from each participant were used for each case. A range of rankings from 1 to 5 was used representing the number of stars selected at each evaluation. A frequency distribution of the average ratings is displayed in Figure 15 ([a] for grouped routes, [b] for individual routes). The majority of the ratings were above 3 with an overall average of 3.2 out of 5.
Further analysis of routes with evaluation scores of less than 3 revealed some interesting findings. Of those ratings, 39% were for routes that involved the use of private car, or public transport only (unimodal) from origin to destination. Our prototype version of the journey planner was designed to always return at least one of each of those types of routes, to allow users to compare multimodal MaaS routes with conventional unimodal routes that may be familiar with. Furthermore, 30% of the low scored options included long walking and cycling legs. Inclusion of such routes in the planner’s results was dependent upon the users’ stated preferences regarding distances that they were willing to walk or cycle. Therefore, the low evaluation scores could be attributed to a possible mismatch between stated and revealed travel preferences. With the exclusion of the above explained ratings the overall overage user evaluation reaches ~4.2 out of 5.

5.2. Notifications-Based Evaluation

This evaluation mechanism involved the presentation of notifications to the users’ screen at random intervals. The following questions were used, with each user given the opportunity to answer each question only once based on a Likert-scale (5: Strongly agree, 4: Agree, 3: Neither agree, nor disagree, 2: Disagree, 1: Strongly disagree):
  • [Q1] The routes that are being presented to me cover my needs.
  • [Q2] The routes that are being presented to me contain a good mix of all available modes in my MaaS4EU plan.
  • [Q3] The order of the routes that are being presented to me matches my travel preferences.
  • [Q4] The route ranking affected my travel decisions.
The results of the evaluation are shown in Figure 16.
As it can be seen the majority of the answers were for the Agree, or Strongly Agree option and the following averages were recorded; Q1: 4.07, Q2: 3.9, Q3: 4.08, Q4: 3.34.

6. Conclusions

This paper presents a prototype journey planner that can support the generation of trips composed of a variety of modes and mobility services that are typically included in a MaaS offering. The proposed planner is underpinned by a processing pipeline that collects data from external service providers, integrates the collected data through a scenario-based heuristic and optimises the constructed routes through a series of ranking and filtering techniques. A number of benefits can be claimed such as no pre-processing requirements, inclusion of real-time information through the use of established applications, easy expandability with the formulation of new scenarios, seamless integration of new service providers and multifaceted customisation with integration of criteria as part of the optimisation process. In contrast, as it is a heuristic-based approach, true optimal outputs by the combination of criteria in a single optimisation algorithm are not achievable. However, it has been reported that the use of multiple criteria in route generation in a computationally efficient manner is an unattainable goal [27] and that approximate solutions can be reliable enough [31]. In our study, users evaluated the functionality of the proposed solution with overall promising results. Future research directions can involve:
  • The dynamic generation of scenarios on-the-fly and based on service availability, trip purpose, user profile and other parameters. Such scenarios may include multiple services and may be constructed by the integration of existing base scenarios. For example, the combination of driving-public transport (P&R) and public transport-bike sharing scenarios may result in a route that integrates driving, public transport and bike sharing.
  • The formulation of additional heuristics to limit the need for multiple ranking/filtering rounds that may require calls to external APIs, thus negatively affecting computational times. This may involve reuse of past routes with similar characteristics (i.e., origin, destination, time of day, etc.) and utilisation of predictive analytics for approximating the condition of services based on historical data.
  • The dynamic calibration of the utility functions and optimisation attributes based on user feedback. This can be achieved by applying machine learning algorithms which can be trained based on the stated preferences of users regarding different routes.
  • The integration of the proposed solution in simulation models for assessing the impact of MaaS in urban areas based on what-if scenarios [69]. Such scenarios may describe different fleet compositions, variable locations for vehicle/bike stations, various penetration rates of services and other.
  • Finally, it is believed that a more disaggregated evaluation of users’ perceptions will lead to a better understanding of their expectations regarding a planning solution for MaaS.

Author Contributions

P.G. conceptualised the overall journey planning approach and led the implementation of the system. In addition, he instigated the writing of the original draft of the paper. E.B. and B.M. contributed to the development of the concept with emphasis on the route ranking and recommendation components. K.A. led the implementation of the route ranking and recommendation components with contributions from E.B. and B.M. Moreover, E.B. and B.M. actively participated in the writing and editing of the manuscript. P.G., E.B. and B.M. equally contributed to the evaluation approach of the journey planner and the evaluation of the collected feedback. A.A. contributed to the integration of real-time information systems as part of the solution, the analysis of the evaluation results and in the writing of the manuscript. G.M. provided guidance and supervision throughout the lifecycle of the study and supported the writing, review and editing of the final manuscript. All authors have read and agreed to the published version of the manuscript.

Funding

This research was funded by the European Union’s Horizon 2020 research and innovation programme grant number No 723176. And the APC was funded by the European Commission.

Acknowledgments

This research is part of the Project “MaaS4EU” (End-to-End Approach for Mobility-as-a-Service tools, business models, enabling framework and evidence for European seamless mobility). This project has received funding from the European Union’s Horizon 2020 research and innovation programme under grant agreement No 723176. This publication only reflects the authors’ view, and the European Union is not liable for any use that may be made of the information contained therein.

Conflicts of Interest

The authors declare no conflict of interest.

References

  1. Urbanization. Available online: https://ourworldindata.org/urbanization (accessed on 24 October 2020).
  2. Kamargianni, M.; Li, W.; Matyas, M.; Sch Afer, A. A critical review of new mobility services for urban transport. Transp. Res. Procedia 2016, 14, 3294–3303. [Google Scholar] [CrossRef] [Green Version]
  3. Lyons, G.; Hammond, P.; Mackay, K. The importance of user perspective in the evolution of MaaS. Transp. Res. Part A Policy Pract. 2019, 121, 22–36. [Google Scholar] [CrossRef]
  4. Fioreze, T.; de Gruijter, M.; Geurs, K. On the likelihood of using mobility-as-a-service: A case study on innovative mobility services among residents in the Netherlands. Case Stud. Transp. Policy 2019, 7, 790–801. [Google Scholar] [CrossRef]
  5. Alonso-González, M.J.; Hoogendoorn-Lanser, S.; van Oort, N.; Cats, O.; Hoogendoorn, S. Drivers and barriers in adopting mobility as a service (MaaS)—A latent class cluster analysis of attitudes. Transp. Res. Part A Policy Pract. 2020, 132, 378–401. [Google Scholar] [CrossRef]
  6. Ho, C.Q.; Hensher, D.A.; Mulley, C.; Wong, Y.Z. Potential uptake and willingness-to-pay for mobility as a service (MaaS): A stated choice study. Transp. Res. Part A Policy Pract. 2018, 117, 302–318. [Google Scholar] [CrossRef]
  7. Cruz, C.O.; Sarmento, J.M. “Mobility as a Service” Platforms: A critical path towards Increasing the sustainability of transportation systems. Sustainability 2020, 12, 6368. [Google Scholar] [CrossRef]
  8. Schikofsky, J.; Dannewald, T.; Kowald, M. Exploring motivational mechanisms behind the intention to adopt mobility as a service (MaaS): Insights from Germany. Transp. Res. Part A Policy Pract. 2020, 131, 296–312. [Google Scholar] [CrossRef]
  9. Mola, L.; Berger, Q.; Haavisto, K.; Soscia, I. Mobility as a service: An exploratory study of consumer mobility behaviour. Sustainability 2020, 12, 8210. [Google Scholar] [CrossRef]
  10. Reyes Garcia, J.R.; Lenz, G.; Haveman, S.P.; Bonnema, G.M. State of the art of mobility as a service (MaaS) ecosystems and architectures: An overview of, and a definition, ecosystem and system architecture for electric mobility as a service (eMaaS). World Electr. Veh. J. 2019, 11, 7. [Google Scholar] [CrossRef] [Green Version]
  11. Polydoropoulou, A.; Pagoni, I.; Tsirimpa, A.; Roumboutsos, A.; Kamargianni, M.; Tsouros, I. Prototype business models for mobility-as-a-service. Transp. Res. Part A Policy Pract. 2020, 131, 149–162. [Google Scholar] [CrossRef]
  12. Vaddadi, B.; Zhao, X.; Susilo, Y.; Pernestål, A. Measuring system-level impacts of corporate mobility as a service (CMaaS) based on empirical evidence. Sustainability 2020, 12, 7051. [Google Scholar] [CrossRef]
  13. Karlsson, I.C.M.; Mukhtar-Landgren, D.; Smith, G.; Koglin, T.; Kronsell, A.; Lund, E.; Sarasini, S.; Sochor, J. Development and implementation of mobility-as-a-service—A qualitative study of barriers and enabling factors. Transp. Res. Part A Policy Pract. 2020, 131, 283–295. [Google Scholar] [CrossRef]
  14. Matyas, M. Opportunities and barriers to multimodal cities: Lessons learned from in-depth interviews about attitudes towards mobility as a service. Eur. Transp. Res. Rev. 2020, 12. [Google Scholar] [CrossRef] [Green Version]
  15. Wu, J.; Zhou, L.; Cai, C.; Shen, J.; Lau, S.K.; Yong, J. Data fusion for MaaS: Opportunities and challenges. CSCWD 2018, 642–647. [Google Scholar] [CrossRef] [Green Version]
  16. Harrison, G.; Gühnemann, A.; Shepherd, S. The business case for a journey planning and ticketing app-Comparison between a simulation analysis and real-world data. Sustainability 2020, 12, 4005. [Google Scholar] [CrossRef]
  17. Keller, A.; Aguilar, A.; Hanss, D. Car sharers’ interest in integrated multimodal mobility platforms: A diffusion of innovations perspective. Sustainability 2018, 10, 4689. [Google Scholar] [CrossRef] [Green Version]
  18. MaaS4EU—End-to-End Approach for Mobility-as-a-Service Tools, Business Models, Enabling Framework and Evidence for European Seamless Mobility, H2020 Project. Available online: http://www.maas4eu.eu/ (accessed on 18 November 2020).
  19. Ştefănescu, P.; Mocan, M.; Ştefănescu, W.; Neculai, P.V. Trip planners used in public transportation. Case study on the city of Timişoara. Procedia Soc. Behav. Sci. 2014, 124, 142–148. [Google Scholar] [CrossRef] [Green Version]
  20. Rahaman, M.S.; Mei, Y.; Hamilton, M.; Salim, F.D. CAPRA: A contour-based accessible path routing algorithm. Inf. Sci. 2017, 385–386, 157–173. [Google Scholar] [CrossRef]
  21. Dijkstra, E.W. A note on two problems in connexion with graphs. Numerische Mathematik 1959, 1, 269–271. [Google Scholar] [CrossRef] [Green Version]
  22. Hart, P.E.; Nilsson, N.J.; Raphael, B. A Formal Basis for the Heuristic Determination of Minimum Cost Paths. IEEE Trans. Syst. Sci. Cybernet. 1968, 4, 100–107. [Google Scholar] [CrossRef]
  23. Geisberger, R.; Sanders, P.; Schultes, D.; Delling, D. Contraction Hierarchies: Faster and Simpler Hierarchical Routing in Road Networks, Experimental, Algorithms; McGeoch, C.C., Ed.; Springer: Berlin/Heidelberg, Germany, 2008; pp. 319–333. [Google Scholar]
  24. Schulz, F.; Wagner, D.; Weihe, K. Dijkstra’s algorithm on-line: An empirical case study from public railroad transport. ACM J. Exp. Algorithms 2000, 5, 12. [Google Scholar] [CrossRef]
  25. Stølting Brodal, G.; Jacob, R. Time-dependent networks as models to achieve fast exact time-table queries. Electr. Notes Theor. Comput. Sci. 2004, 92, 3–15. [Google Scholar] [CrossRef] [Green Version]
  26. Delling, D.; Pajor, T.; Werneck, R.F. Round-based public transit routing. Transp. Sci. 2015, 49, 591–604. [Google Scholar] [CrossRef] [Green Version]
  27. Delling, D.; Dibbelt, J.; Pajor, T. Fast and exact public transit routing with restricted pareto sets. In Proceedings of the Meeting on Algorithm Engineering and Experiments (ALENEX), San Diego, CA, USA, 7–8 January 2019. [Google Scholar]
  28. Witt, S. Trip-Based Public Transit Routing Using Condensed Search Trees, Schloss Dagstuhl-Leibniz-Zentrum fur Informatik; Dagstuhl Publishing: Wadern, Germany, 2016; pp. 1–12. [Google Scholar]
  29. Wang, Y.; Yuan, Y.; Ma, Y.; Wang, G. Time-dependent graphs: Definitions, applications, and algorithms. Data Sci. Eng. 2019, 4, 352–366. [Google Scholar] [CrossRef] [Green Version]
  30. Bast, H.; Delling, D.; Goldberg, A.; Müller-Hannemann, M.; Pajor, T.; Sanders, P.; Wagner, D.; Werneck, R.F. Route planning in transportation networks. In Lecture Notes in Computer Science (Including Subseries Lecture Notes in Artificial Intelligence and Lecture Notes in Bioinformatics); Springer: Cham, Switzerland, 2016; Volume 9220, pp. 19–80. [Google Scholar]
  31. Casey, B.; Bhaskar, A.; Guo, H.; Chung, E. Critical review of time-dependent shortest path algorithms: A multimodal trip planner perspective. Trans. Rev. 2014, 34, 522–539. [Google Scholar] [CrossRef] [Green Version]
  32. Giannakopoulou, K.; Paraskevopoulos, A.; Zaroliagis, C. Multimodal dynamic journey-planning. Algorithms 2019, 12, 213. [Google Scholar] [CrossRef] [Green Version]
  33. Zhu, S.; Wang, Y.; Shang, S.; Zhao, G.; Wang, J. Probabilistic routing using multimodal data. Neurocomputing 2017, 253, 49–55. [Google Scholar] [CrossRef]
  34. Yu, G.; Yang, Y. Dynamic routing with real-time traffic information. Oper. Res. 2017, 1–26. [Google Scholar] [CrossRef]
  35. Liebig, T.; Piatkowski, N.; Bockermann, C.; Morik, K. Dynamic route planning with real-time traffic predictions. Inf. Syst. 2017, 64, 258–265. [Google Scholar] [CrossRef]
  36. He, Y.; Csiszár, C. Concept of mobile application for mobility as a service based on autonomous vehicles. Sustainability 2020, 12, 6737. [Google Scholar] [CrossRef]
  37. Ghaderi, F.; Pahlavani, P. A new multimodal multi-criteria route planning model by integrating a fuzzy-AHP weighting method and a simulated annealing algorithm. ISPRS Int. Arch. Photogram. Remote Sens. Spat. Inf. Sci. 2015. [Google Scholar] [CrossRef] [Green Version]
  38. Bucher, D.; Jonietz, D.; Raubal, M. A Heuristic for multi-modal route planning. In Progress in Location-Based Services 2016. Lecture Notes in Geoinformation and Cartography; Gartner, G., Huang, H., Eds.; Springer: Cham, Switzerland, 2017. [Google Scholar]
  39. Yu, H.; Lu, F. A multi-modal route planning approach with an improved genetic algorithm. Int. Arch. Photogram. Remote Sens. Spat. Inf. Sci. 2012, 38, 344–348. [Google Scholar]
  40. Eiter, T.; Krennwallner, T.; Prandtstetter, M.; Rudloff, C.; Schneider, P.; Straub, M. Semantically enriched multi-modal routing. Int. J. Intell. Transp. Syst. Res. 2016, 14. [Google Scholar] [CrossRef]
  41. Prandtstetter, M.; Straub, M.; Puchinger, J. On the way to a multi-modal energy-efficient route. In Proceedings of the IECON 2013—39th Annual Conference of the IEEE Industrial Electronics Society, Vienna, Austria, 10–13 November 2013; pp. 4779–4784. [Google Scholar]
  42. Georgakis, P.; Almohammad, A.; Bothos, E.; Magoutas, B.; Arnaoutaki, K.; Mentzas, G. MultiModal route planning in mobility as a service. In Proceedings of the 2019 IEEE/WIC/ACM International Conference on Web Intelligence (WI 2019), Thessaloniki, Greece, 14–17 October 2019; Volume 2019, pp. 283–291. [Google Scholar]
  43. Google Directions API. Available online: https://developers.google.com/maps/documentation/directions/start (accessed on 18 November 2020).
  44. Bing Maps Routes. API. Available online: https://docs.microsoft.com/en-us/bingmaps/rest-services/routes/ (accessed on 18 November 2020).
  45. HERE Routing. Available online: https://developer.here.com/documentation/routing/dev_guide/topics/resources.html (accessed on 18 November 2020).
  46. Open Source Routing Machine. Available online: http://project-osrm.org/ (accessed on 18 November 2020).
  47. Open Trip Planning. Available online: https://www.opentripplanner.org/ (accessed on 18 November 2020).
  48. Hamurcu, M.; Eren, T. An application of multicriteria decision-making for the evaluation of alternative monorail routes. Mathematics 2018, 7, 16. [Google Scholar] [CrossRef] [Green Version]
  49. Güner, S. Measuring the quality of public transportation systems and ranking the bus transit routes using multi-criteria decision making techniques. Case Stud. Trans. Policy 2018, 6, 214–224. [Google Scholar] [CrossRef]
  50. Shih, H.; Shyur, H.; Lee, E.S. An extension of TOPSIS for group decision making. Math. Comput. Model. 2007, 45, 801–813. [Google Scholar] [CrossRef]
  51. Daniels, R.; Mulley, C. Explaining walking distance to public transport: The dominance of public transport supply. J. Trans. Land Use 2013, 6, 5–20. [Google Scholar] [CrossRef]
  52. MOL Bubi. Bike Sharing. Available online: https://molbubi.hu (accessed on 18 November 2020).
  53. GreenGo. Car Sharing. Available online: https://greengo.com (accessed on 18 November 2020).
  54. City Taxi. Ride Hailing. Available online: https://www.citytaxi.hu (accessed on 18 November 2020).
  55. Uber. Ride Hailing. Available online: https://developer.uber.com (accessed on 18 November 2020).
  56. Motar. Ride Sharing. Available online: https://www.motar.eu (accessed on 18 November 2020).
  57. Manley, E.J.; Orr, S.W.; Cheng, T. A heuristic model of bounded route choice in urban areas. Transp. Res. Part C Emerg. Technol. 2015, 56, 195–209. [Google Scholar] [CrossRef] [Green Version]
  58. HERE Public Transit API. Available online: https://developer.here.com/documentation/public-transit/dev_guide/index.html (accessed on 18 November 2020).
  59. OpenMobilityData. Available online: https://transitfeeds.com/ (accessed on 18 November 2020).
  60. Lamsfus, C.; Wang, D.; Alzua-Sorzabal, A.; Xiang, Z. Going mobile: Defining context for on-the-go travelers. J. Travel Res. 2015, 54, 691–701. [Google Scholar] [CrossRef]
  61. Ulrike, G.; Hwang, Y.-H.; Fesenmaier, D.R. Informing destination recommender systems design and evaluation through quantitative research. Int. J. Cult. Tour. Hosp. Res. 2012, 6, 297–315. [Google Scholar] [CrossRef] [Green Version]
  62. Anagnostopoulou, E.; Urbančič, J.; Bothos, E.; Magoutas, B.; Bradesko, L.; Schrammel, J.; Mentzas, G. From mobility patterns to behavioural change: Leveraging travel behaviour and personality profiles to nudge for sustainable transportation. J. Intell. Inf. Syst. 2020, 54, 157–178. [Google Scholar] [CrossRef] [Green Version]
  63. Brazil, W.; Caulfield, B.; Bothos, E. Transport emissions information: Lessons from the PEACOX project. In Proceedings of the Irish Transport Research Network (ITRN), Dublin, Ireland, 27–28 August 2015. [Google Scholar]
  64. Benediktsson, J.A.; Kanellopoulos, I. Classification of multisource and hyperspectral data based on decision fusion. IEEE Trans. Geosci. Remote Sens. 1999, 37, 1367–1377. [Google Scholar] [CrossRef] [Green Version]
  65. Moleculer–Progressive Microservices Framework for Node.js. Available online: https://moleculer.services/ (accessed on 18 November 2020).
  66. Melis, A.; Mirri, S.; Prandi, C.; Prandini, M.; Salomoni, P.; Callegati, F. Integrating personalized and accessible itineraries in MaaS ecosystems through microservices. Mob. Netw. Appl. 2018, 23, 167–176. [Google Scholar] [CrossRef]
  67. TOPSIS–npm Package. Available online: https://www.npmjs.com/package/topsis (accessed on 18 November 2020).
  68. Redis–In-Memory Data Structure Store. Available online: https://redis.io/ (accessed on 18 November 2020).
  69. Kostrzewski, M. Implementation of distribution model of an international company with use of simulation method. Procedia Eng. 2017, 192, 445–450. [Google Scholar] [CrossRef]
Figure 1. Journey Planning Approach.
Sustainability 12 10140 g001
Figure 2. Harmonised route structure.
Sustainability 12 10140 g002
Figure 3. MaaS4EU Journey Planning Web Application.
Sustainability 12 10140 g003
Figure 4. MaaS4EU Mobile Application.
Sustainability 12 10140 g004
Figure 5. Scenario-based route generation.
Sustainability 12 10140 g005
Figure 6. Level of route acceptability interface.
Sustainability 12 10140 g006
Figure 7. Route ranking interface.
Sustainability 12 10140 g007
Figure 8. Overview of the route lists consolidation process. Route lists are created by considering different utilities and are consolidated in a single to be presented to the user with the Borda count algorithm.
Sustainability 12 10140 g008
Figure 9. Microservices Implementation Diagram (Note: Invocation of a number of helper services has been omitted from the graph to improve its legibility).
Sustainability 12 10140 g009
Figure 10. Execution times metrics (in milliseconds).
Sustainability 12 10140 g010
Figure 11. Route recommendations rating.
Sustainability 12 10140 g011
Figure 12. Single route rating.
Sustainability 12 10140 g012
Figure 13. Notification for evaluation.
Sustainability 12 10140 g013
Figure 14. Demographics of users who participated in the evaluation of the solution.
Sustainability 12 10140 g014
Figure 15. Star rating evaluation results.
Sustainability 12 10140 g015
Figure 16. Notifications evaluation results.
Sustainability 12 10140 g016
Table 1. Description of MaaS travelling scenarios.
Scenario (Modes Order as in the Route)Use CaseConditions and Properties
(1) Bike-sharing from origin to destinationShort distance urban trips with active travellingBike stations within walking distance from origin/destination, cycling leg distance matching user preferences, cycling leg travel time within service limit duration set by the provider.
(2a) Bike-sharing to public transport 1
(2b) Public transport to bike sharing
Trips where the destination scenario 2a/origin2b are far away from a bike station and active travelling is favourableBike station within walking distance from the origin2a/destination2b, cycling leg distance matching user preferences, cycling leg travel time within service limit duration set by the provider.
(3) Car-sharing from origin to destinationMedium distance urban trips without active travellingOrigin and destination within the boundaries of the operating area of the service. A vehicle must be present within walking distance from the origin
(3a) Car-sharing to public transport
(3b) Public transport to car-sharing
Medium to long distance urban trips with origin3b/destination3a outside the operating area of the car-sharing service. Facilitation of first/last mile inner city travelling with car sharing.Origin3a/destination3b within the boundaries of the operating area of the service. A vehicle must be present within walking distance from the origin3a
(4) Ride-hailing from origin to destinationMedium to long distance urban tripsRide-hailing distance to exceed the minimum distance set by the service provider
(5a) Ride-hailing to public transport
(5b) Public transport to ride hailing
Medium to long distance urban trips that limit the use of ride hailing. Facilitate first5b/last5a mile inner city travelling with public transport.Ride-hailing distance to exceed the minimum distance set by the service provider
Note: In additional to the above scenarios, customary routes (for example public transport, private car, Park and Ride (P&R) etc.) are included.
Table 2. Public Transport/Bike Sharing Scenario-based heuristic.
1READ user profile FROM cache
2READ unimodal routes FROM cache
3READ bike sharing data FROM cache
4READ public transport stops data FRON cache
5IF closest bike station to destination distance < user preferred walking distance THEN
6  validBikes ← findBikesCloseToStops (publicTransportStops, bikeSharing)
7  walkingDistances ← findWalkingDistances (publicTransportStops, validBikes)
8  cyclingDistances ← findCyclingDistances (validBikeStations)
9  bikeSharingLegs ← defineBikeSharingLegs (validBikeStations, cyclingDistances)
10  validBikeSharingLegs ← Empty Array
11  FOR EACH bikeSharingLeg IN bikeSharingLegs
12   IF (cycling distance of leg < user preferred cycling distance) AND
   (walking distance between public transport stop and pick-up bike location < user preferred walking distance)
13   THEN
14    add bikeSharingLeg to validBikeSharingLegs
15   partialBikeSharingRoutes ← Empty Array
16  FOR EACH bikeSharingLeg IN validBikeSharingLegs
17   partialPublicTransportRoute ← findPartialPTRoute(unimodalRoutes, bikeSharingLeg)
18   partialBikeSharingRoutes ← appendLegs(partialPublicTransportRoute, bikeSharingLeg)
19  mcdaOptions ← loadOptions(criteria, weights, criteriaTypes)
20  criteriaScoresOfAlternatives ← Empty Array
21  FOR EACH partialBikeSharingRoute IN partialBikeSharingRoutes
22   criteriaScoresOfAlternative ← scoreRoute(partialBikeSharingRoute)
23   add criteriaScoresOfAlternative to criteriaScoresOfAlternatives
24  add criteriaScoresOfAlternatives to mcdaOptions
25  rankedPartialBikeSharingRoutes ← runMCDA(mcdaOptions)
26  incompleteScenarioRoutes ← Empty Array
27  FOR EACH rankedPartialBikeSharingRoute IN rankedPartialBikeSharingRoutes
28   incompleteScenarioRoute ← constructRoute(rankedPartialBikeSharingRoute)
29   add incompleteScenarioRoute to incompleteScenarioRoutes
30  RETURN incompleteScenarioRoutes
RETURN Empty Array
Table 3. TOPSIS application for public transport—bike sharing scenario.
Ranking CriteriaWeightsDescriptionScoring
Cycling Distance
[min] 1
0.3The degree of similarity of the distance of the bike sharing leg with the user’s preferred cycling distance | u c c d |
where:
u c is the user’s preferred cycling distance,
c d is the distance of the bike sharing leg
Cycling/overall route distance ratio
[min]
0.3The appropriateness of the ratio of the cycling distance over to the overall distance of the route. An optimal value of 0.5 has been used. This is to avoid routes that have a very short public transport segment compared to that of bike sharing | o r c d r d |
where:
o r is the optimal ration,
c d is the total cycling distance in the route,
r d is the distance of the bike sharing leg
Public transport modal changes
[min]
0.15The number of public transport modes used to reach the bike pick-up location n = 1 l { 1   i f   n   i s   P T   l e g 0   o t h e r w i s e
where:
l is the number of legs that precede the bike sharing segment of the route
Public transport modal speed
[max]
0.25The average speed (in qualitative manner 2) of the public transport modes used prior to the bike sharing leg n = 1 l { n u   i f   n   i s   P T   l e g 0   o t h e r w i s e n = 1 l { 1   i f   n   i s   P T   l e g 0   o t h e r w i s e
where:
l is the number of legs that precede the bike sharing segment of the route,
u is the qualitative speed of the mode
1 The type of the criterion, [min] if the lower the score the better, [max] otherwise. 2 Bus = 1, train = 3, metro = 2, underground = 3, tram = 2.
Publisher’s Note: MDPI stays neutral with regard to jurisdictional claims in published maps and institutional affiliations.

