Sustainable Evolution of China’s Regional Energy Efficiency Based on a Weighted SBM Model with Energy Substitutability

Abstract
1. Introduction
2. Literature Review
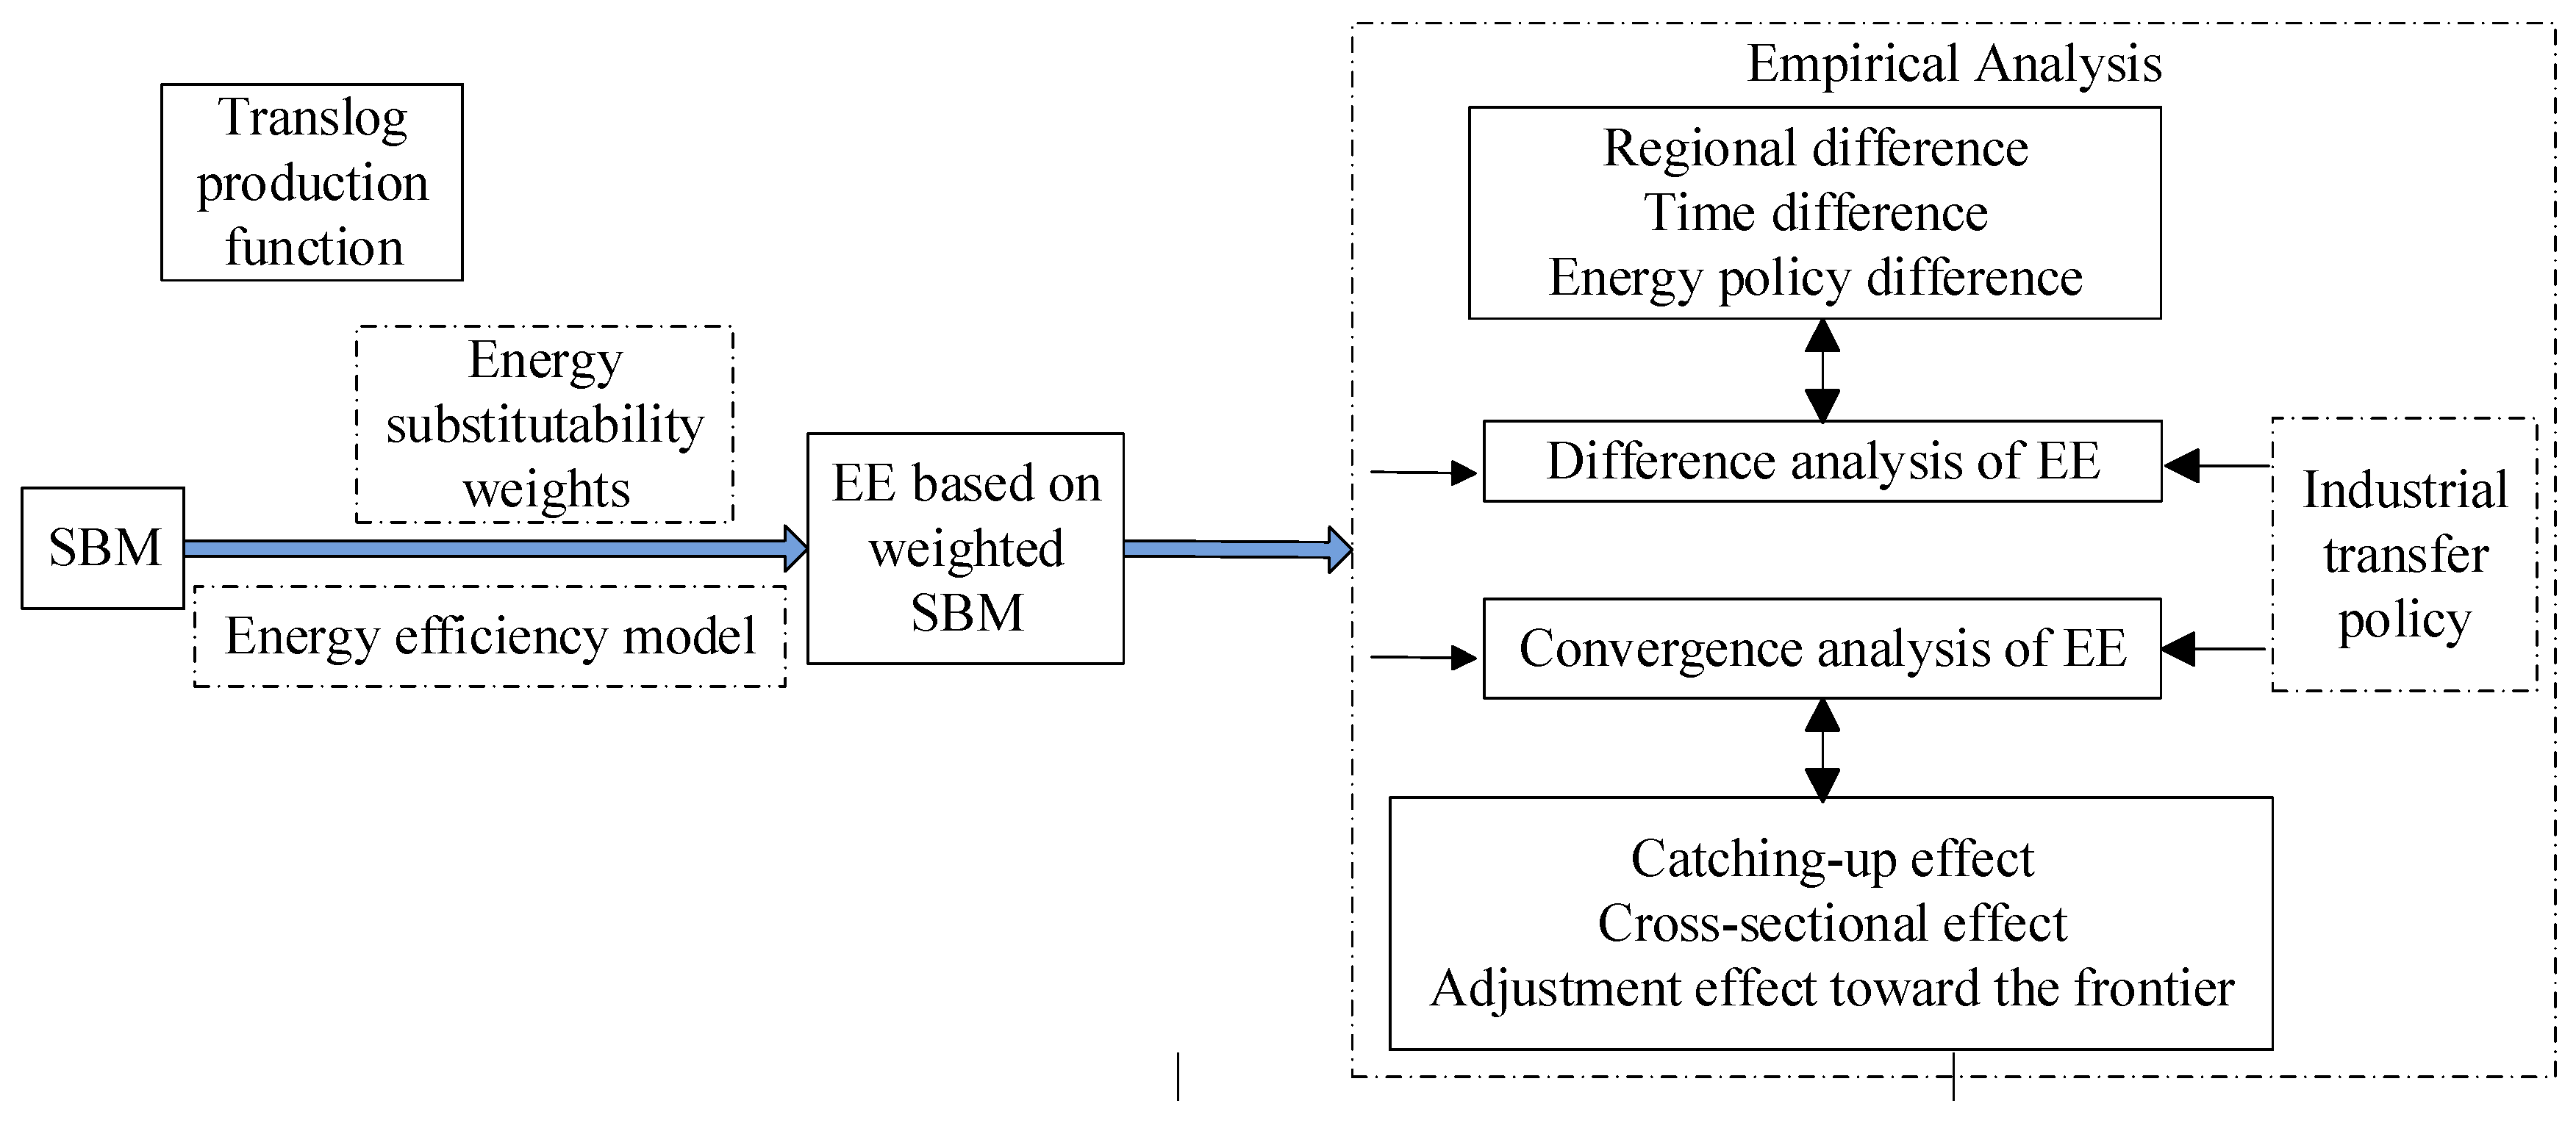
3. Methodology
3.1. The Weighted SBM Model
3.2. Modeling the Sustainable Evolution Based on Efficiency Convergence Analysis
4. Empirical Analysis of Regional Energy Efficiency in China
4.1. Modeling the Sustainable Evolution Based on Efficiency Convergence Analysis
4.2. The Input–Output Data for Regional Energy Efficiency and Regional Divisions in Mainland China
4.3. Provincial Energy Efficiency Results and Tendency Analysis
4.4. Energy Efficiency Results and Tendency Analysis of the Three Areas
4.5. Energy Efficiency Results and Tendency Analysis of the Seven Economic Zones
4.6. Analysis of Regional Energy Efficiency over Different Five-Year Plans
5. Convergence Analysis of Chinese Regional Energy Efficiency
5.1. Convergence Analysis of Energy Efficiency in the Whole Period
5.2. Convergence Analysis of Energy Efficiency during Different Time Intervals
6. Conclusions and Policy Implications
Author Contributions
Funding
Conflicts of Interest
References
- Li, Y.; Oberheitmann, A. Challenges of rapid economic growth in China: Reconciling sustainable energy use, environmental stewardship and social development. Energy Policy 2009, 37, 1412–1422. [Google Scholar] [CrossRef]
- Rao, X.; Wu, J.; Zhang, Z.Y.; Liu, B. Energy efficiency and energy saving potential in China: An analysis based on slacks-based measure model. Comput. Ind. Eng. 2012, 63, 578–584. [Google Scholar] [CrossRef]
- Noel, U.D. A reconsideration of effect of energy scarcity on economic growth. Energy 1995, 20, 1–12. [Google Scholar]
- Boyd, G.A. Estimating plant level energy efficiency with a stochastic frontier. Energy 2008, 29, 23–43. [Google Scholar] [CrossRef]
- Lin, B.Q.; Du, K.R. Technology gap and China’s regional energy efficiency: A parametric metafrontier approach. Energ. Econ. 2013, 40, 529–536. [Google Scholar] [CrossRef]
- Wang, H.; Ang, B.W.; Wang, Q.Q.; Zhou, P. Measuring energy performance with sectoral heterogeneity: A non-parametric frontier approach. Energ. Econ. 2017, 62, 70–78. [Google Scholar] [CrossRef]
- Filippini, M.; Zhang, L. Estimation of the energy efficiency in Chinese provinces. Energ. Effic. 2016, 9, 1315–1328. [Google Scholar] [CrossRef]
- Colombi, R.; Kumbhakar, S.C.; Martini, G.; Vittadini, G. Closed-skew normality in stochastic frontiers with individual effects and long/short-run efficiency. J. Prod. Anal. 2014, 42, 123–136. [Google Scholar] [CrossRef]
- Belotti, F.; Ilardi, G. Consistent inference in fixed-effects stochastic frontier models. J. Econom. 2018, 202, 161–177. [Google Scholar] [CrossRef]
- Charnes, A.; Cooper, W.; Rhodes, E. Measuring the efficiency of decision making units. Eur. J. Oper. Res. 1978, 2, 429–444. [Google Scholar] [CrossRef]
- Liu, J.S.; Lu, L.Y.; Lu, W.; Lin, B.J. A survey of DEA applications. Omega 2013, 41, 893–902. [Google Scholar] [CrossRef]
- Meng, F.; Su, B.; Thomson, E.; Zhou, D.; Zhou, P. Measuring China’s regional energy and carbon emission efficiency with DEA models: A survey. Appl. Energ. 2016, 183, 1–21. [Google Scholar] [CrossRef]
- Wu, F.; Fan, L.W.; Zhou, P.; Zhou, D.Q. Industrial energy efficiency with CO2 emissions in China: A nonparametric analysis. Energy Policy 2012, 49, 164–172. [Google Scholar] [CrossRef]
- Feng, C.; Wang, M. Analysis of energy efficiency in China’s transportation sector. Renew. Sustain. Energ. Rev. 2018, 94, 565–575. [Google Scholar] [CrossRef]
- Yang, W.; Shi, J.F.; Qiao, H.; Shao, Y.M.; Wang, S.Y. Regional technical efficiency of Chinese iron and steel industry based on bootstrap network data envelopment analysis. SocioEcon. Plan. Sci. 2017, 57, 14–24. [Google Scholar] [CrossRef]
- Feng, C.; Wang, M. The economy-wide energy efficiency in China’s regional building industry. Energy 2017, 141, 1869–1879. [Google Scholar] [CrossRef]
- Xu, S.; Li, Y.; Tao, Y.; Wang, Y.; Li, Y.-F. Regional Differences in the Spatial Characteristics and Dynamic Convergence of Environmental Efficiency in China. Sustainability 2020, 12, 7423. [Google Scholar] [CrossRef]
- Wang, Q.; Zhou, P.; Zhao, Z.; Shen, N. Energy Efficiency and Energy Saving Potential in China: A Directional Meta-Frontier DEA Approach. Sustainability 2014, 6, 5476–5492. [Google Scholar] [CrossRef]
- Färe, F.; Grosskopf, S. Network DEA. SocioEcon. Plan. Sci. 2000, 34, 35–49. [Google Scholar] [CrossRef]
- Tone, K. A slacks-based measure of efficiency in data envelopment analysis. Eur. J. Oper. Res. 2001, 130, 498–509. [Google Scholar] [CrossRef]
- Li, H.; Shi, J.F. Energy efficiency analysis on Chinese industrial sectors: An improved Super-SBM model with undesirable outputs. J. Clean. Prod. 2014, 65, 97–107. [Google Scholar] [CrossRef]
- Du, H.B.; Matisoff, D.C.; Wang, Y.Y.; Liu, X. Understanding drivers of energy efficiency changes in China. Appl. Energ. 2016, 184, 1196–1206. [Google Scholar] [CrossRef]
- Bian, Y.W.; Hu, M.; Wang, Y.S.; Xu, H. Energy efficiency analysis of the economic system in China during 1986–2012: A parallel slacks-based measure approach. Renew. Sustain. Energ. Rev. 2016, 55, 990–998. [Google Scholar] [CrossRef]
- Shao, Y.; Han, S. The Synergy in the Economic Production System: An Empirical Study with Chinese Industry. Sustainability 2019, 11, 980. [Google Scholar] [CrossRef]
- Cai, H.; Fan, R. Regional Total Factor Energy Efficiency Evaluation of China: The Perspective of Social Welfare. Sustainability 2019, 11, 4093. [Google Scholar] [CrossRef]
- Du, J.; Zhao, M.; Zeng, M.; Han, K.; Sun, H.-P. Spatial Effects of Urban Agglomeration on Energy Efficiency: Evidence from China. Sustainability 2020, 12, 3338. [Google Scholar] [CrossRef]
- Lin, B.Q.; Zhang, G.L. Energy efficiency of Chinese service sector and its regional differences. J. Clean. Prod. 2017, 168, 614–625. [Google Scholar] [CrossRef]
- Yang, T.; Chen, W.; Zhou, K.; Ren, M. Regional energy efficiency evaluation in China: A super efficiencyslack-based measure model with undesirable outputs. J. Clean. Prod. 2018, 198, 859–866. [Google Scholar] [CrossRef]
- Zhu, L.; Wang, Y.; Shang, P.; Qi, L.; Yang, G.; Wang, Y. Improvement path, the improvement potential and the dynamic evolution of regional energy efficiency in China: Based on an improved nonradial multidirectional efficiency analysis. Energy Policy 2019, 133, 110883. [Google Scholar] [CrossRef]
- Liu, H.; Zhang, Z.; Zhang, T.; Wang, L. Revisiting China’s provincial energy efficiency and its influencing factors. Energy 2020, 208, 118361. [Google Scholar] [CrossRef]
- Cheng, Z.; Liu, J.; Li, L.; Gu, X. Research on meta-frontier total-factor energy efficiency and its spatial convergence in Chinese provinces. Energ. Econ. 2020, 86, 104702. [Google Scholar] [CrossRef]
- Zhou, Y.; Liang, D.P.; Xing, X.P. Environmental efficiency of industrial sectors in China: An improved weighted SBM model. Math. Comput. Model. 2013, 58, 990–999. [Google Scholar] [CrossRef]
- Zhou, Y.; Xing, X.P.; Fang, K.N.; Liang, D.P.; Xu, C.L. Environmental efficiency analysis of power industry in China based on an entropy SBM model. Energy Policy 2013, 57, 68–75. [Google Scholar] [CrossRef]
- Xiong, S.; Tian, Y.; Ji, J.; Ma, X. Allocation of Energy Consumption among Provinces in China: A Weighted ZSG-DEA Model. Sustainability 2017, 9, 2115. [Google Scholar] [CrossRef]
- Baumol, W.J. Productivity growth, convergence, and welfare: What the long-run data show. Am. Econ. Rev. 1986, 76, 1072–1085. [Google Scholar]
- Arcelus, F.J.; Arocena, P. Convergence and productive efficiency in fourteen OECD countries: A non-parametric frontier approach. Int. J. Prod. Econ. 2000, 66, 105–117. [Google Scholar] [CrossRef]
- Li, K.; Lin, B.Q. Metafrontier energy efficiency with CO2 emissions and its convergence analysis for China. Energ. Econ. 2015, 48, 230–241. [Google Scholar] [CrossRef]
- Zhang, W.; Pan, X.F.; Yan, Y.B.; Pan, X.Y. Convergence analysis of regional energy efficiency in China based on large-dimensional panel data model. J. Clean. Prod. 2017, 142, 801–808. [Google Scholar] [CrossRef]
- Han, L.; Han, B.; Shi, X.; Su, B.; Lv, X.; Lei, X. Energy efficiency convergence across countries in the context of China’s Belt and Road initiative. Appl. Energ. 2018, 213, 112–122. [Google Scholar] [CrossRef]
- Pan, X.F.; Liu, Q.; Peng, X.X. Spatial club convergence of regional energy efficiency in China. Ecol. Indic. 2015, 51, 25–30. [Google Scholar] [CrossRef]
- Smyth, R.; Narayan, P.K.; Shi, H.L. Substitution between energy and classical factor inputs in the Chinese steel sector. Appl. Energ. 2011, 88, 361–367. [Google Scholar] [CrossRef]
- Barro, R.J.; Sala-i-Martin, X.X. Convergence. J. Polit. Econ. 1992, 100, 223–251. [Google Scholar] [CrossRef]
- Flannery, M.J.; Ranga, K.P. Partial adjustment toward target capital structures. J. Financ. Econ. 2006, 79, 469–506. [Google Scholar] [CrossRef]
- Hoerl, A.E.; Kennard, R.W. Ridge regression: Biased estimation for nonorthogonal problems. Technometrics 1970, 42, 80–86. [Google Scholar] [CrossRef]
- China Statistical Yearbook; State Statistical Bureau (SSB), China Statistical Publishing House: Beijing, China, 1991–2015. (In Chinese)
- Yeh, T.; Chen, T.; Lai, P. A comparative study of energy utilization efficiency between Taiwan and China. Energy Policy 2010, 38, 2386–2394. [Google Scholar] [CrossRef]


| 1.0000 | |||||||||
| 0.6097 | 1.0000 | ||||||||
| 0.9286 | 0.7775 | 1.0000 | |||||||
| 0.9999 | 0.6047 | 0.9262 | 1.0000 | ||||||
| 0.9943 | 0.5338 | 0.8876 | 0.9949 | 1.0000 | |||||
| 0.9249 | 0.7957 | 0.9994 | 0.9224 | 0.8821 | 1.0000 | ||||
| 0.9535 | 0.4364 | 0.7800 | 0.9553 | 0.9752 | 0.7749 | 1.0000 | |||
| 0.6440 | 0.9976 | 0.8089 | 0.6391 | 0.5684 | 0.8264 | 0.4676 | 1.0000 | ||
| 0.9705 | 0.6672 | 0.9823 | 0.9692 | 0.9478 | 0.9778 | 0.8581 | 0.7031 | 1.0000 |
| Variables | Tolerance | VIF | Variables | Tolerance | VIF | Variables | Tolerance | VIF |
|---|---|---|---|---|---|---|---|---|
| LnK | 0.002 | >100 | LnK×LnL | <0.001 | >100 | LnK×LnK | 0.001 | >100 |
| LnL | 0.064 | 16 | LnK×LnE | <0.001 | >100 | LnL×LnL | <0.002 | >100 |
| LnE | <0.001 | >100 | LnL×LnE | <0.001 | >100 | LnE×LnE | 0.015 | 67 |
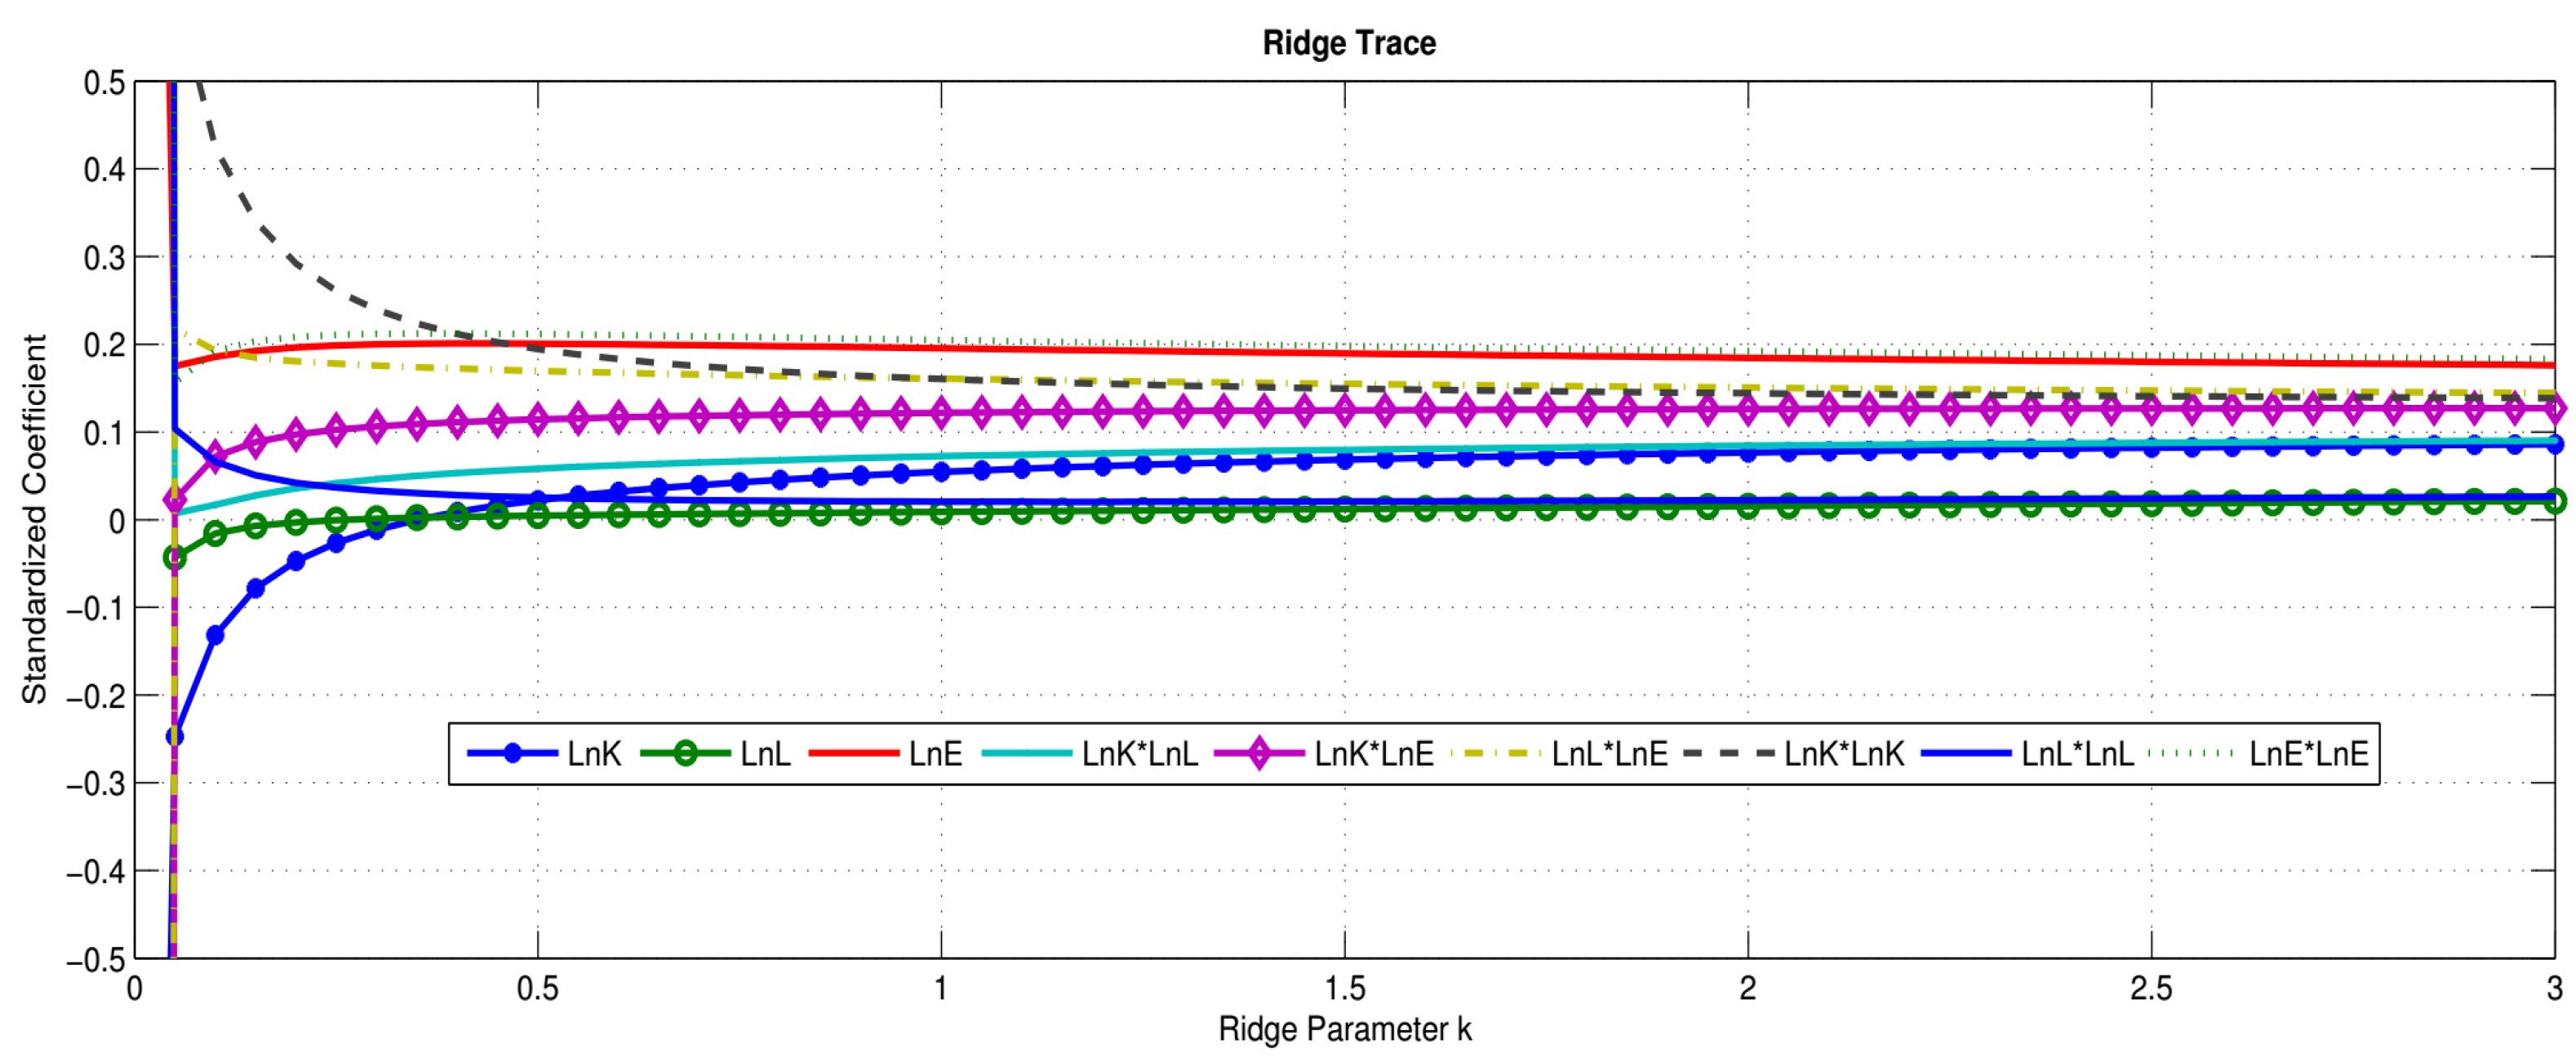
| Variable | Standardized Coeff. | Coeff. | t-Statistic | p-Value | VIF |
|---|---|---|---|---|---|
| 0.0890 | 0.0539 * | 1.8323 | 0.0776 | 0.0149 | |
| 0.0241 | 0.1119 | 0.5628 | 0.5781 | 0.0216 | |
| 0.1727 | 0.2667 *** | 3.6613 | 0.0010 | 0.0148 | |
| 0.0921 | 0.0046 * | 1.8666 | 0.0725 | 0.0093 | |
| 0.1271 | 0.0049 ** | 2.5613 | 0.0161 | 0.0051 | |
| 0.1421 | 0.0150 *** | 2.8777 | 0.0076 | 0.0080 | |
| 0.1367 | 0.0041 *** | 2.7923 | 0.0093 | 0.0102 | |
| 0.0286 | 0.0061 | 0.6669 | 0.5103 | 0.0215 | |
| 0.1792 | 0.0116 *** | 3.8533 | 0.0006 | 0.0165 |
| Region Name (Notation) | The Provinces in the Corresponding Division Region | |
|---|---|---|
| Eastern area (E) | Liaoning, Beijing, Tianjin, Hebei, Shanghai, Jiangsu, Zhejiang, Fujian, Shandong, Guangdong, Hainan | |
| Three Areas | Central area (C) | Jilin, Heilongjiang, Shanxi, Anhui, Jiangxi, Henan, Hubei, Hunan |
| Western area (W) | Inner Mongolia, Guangxi, Guizhou, Yunnan, Shaanxi, Gansu, Xinjiang, Sichuan, Qinghai, Ningxia | |
| Central Bohai (CB) | Beijing, Tianjin, Hebei, Shandong | |
| Yangtze River Delta (CD) | Shanghai, Jiangsu, Zhejiang | |
| Pearl River Delta (PD) | Fujian, Guangdong, Hainan | |
| Seven Economic Zones | Northeast (N) | Liaoning, Jilin, Heilongjiang |
| Central Provinces (CP) | Anhui, Jiangxi, Henan, Hubei, Hunan, Shanxi | |
| Great Southwest (GS) | Guangxi, Guizhou, Yunnan, Sichuan | |
| Great Northwest (GN) | Shaanxi, Gansu, Xinjiang, Inner Mongolia, Qinghai, Ningxia |
| Panel A: Energy Efficiency Across Years | ||||||||
| Year | Mean | Std. dev. | Year | Mean | Std. dev. | Year | Mean | Std. dev. |
| 1991 | 0.4776 | 0.2144 | 2000 | 0.3807 | 0.0758 | 2009 | 0.3675 | 0.1305 |
| 1992 | 0.3602 | 0.0915 | 2001 | 0.3817 | 0.0857 | 2010 | 0.3982 | 0.1433 |
| 1993 | 0.3020 | 0.0491 | 2002 | 0.3739 | 0.0895 | 2011 | 0.4257 | 0.1561 |
| 1994 | 0.3194 | 0.0512 | 2003 | 0.3547 | 0.0874 | 2012 | 0.4340 | 0.1719 |
| 1995 | 0.3488 | 0.0598 | 2004 | 0.3581 | 0.0925 | 2013 | 0.4475 | 0.1784 |
| 1996 | 0.3804 | 0.1003 | 2005 | 0.3578 | 0.0985 | 2014 | 0.4534 | 0.1817 |
| 1997 | 0.4191 | 0.1394 | 2006 | 0.3589 | 0.1085 | 2015 | 0.4628 | 0.1902 |
| 1998 | 0.3805 | 0.0934 | 2007 | 0.3707 | 0.1159 | - | - | - |
| 1999 | 0.3832 | 0.0807 | 2008 | 0.4273 | 0.1941 | Average | 0.3890 | 0.0843 |
| Panel B: Energy Efficiency Across Provinces | ||||||||
| Provinces | Mean | Std. dev. | Provinces | Mean | Std. dev. | Provinces | Mean | Std. dev. |
| Beijing | 0.5195 | 0.2358 | Zhejiang | 0.4513 | 0.0883 | Hainan | 0.3866 | 0.0459 |
| Tianjin | 0.4609 | 0.1417 | Anhui | 0.3544 | 0.0540 | Sichuan | 0.3442 | 0.0653 |
| Hebei | 0.3358 | 0.0355 | Fujian | 0.4662 | 0.0438 | Guizhou | 0.2899 | 0.0724 |
| Shanxi | 0.3196 | 0.0470 | Jiangxi | 0.4621 | 0.1720 | Yunnan | 0.3363 | 0.0956 |
| Inner Mongolia | 0.3620 | 0.0789 | Shandong | 0.4141 | 0.0491 | Shaanxi | 0.3482 | 0.0486 |
| Liaoning | 0.3743 | 0.0554 | Henan | 0.3660 | 0.0313 | Gansu | 0.2901 | 0.0371 |
| Jilin | 0.3709 | 0.0542 | Hubei | 0.3851 | 0.1382 | Qinghai | 0.2509 | 0.0325 |
| Heilongjiang | 0.4157 | 0.0558 | Hunan | 0.4468 | 0.1593 | Ningxia | 0.2372 | 0.0402 |
| Shanghai | 0.5865 | 0.2535 | Guangdong | 0.5470 | 0.1542 | Xinjiang | 0.2931 | 0.0408 |
| Jiangsu | 0.4554 | 0.0920 | Guangxi | 0.4101 | 0.1339 | Average | 0.3890 | 0.0442 |
| Three Areas | Years | ||||||||
| 1991 | 1992 | 1993 | 1994 | 1995 | 1996 | 1997 | 1998 | 1999 | |
| Eastern Area | 0.4180 | 0.3344 | 0.3002 | 0.3152 | 0.3362 | 0.3668 | 0.3915 | 0.4014 | 0.4150 |
| Central Area | 0.5856 | 0.4059 | 0.3308 | 0.3485 | 0.3960 | 0.4582 | 0.5084 | 0.4228 | 0.4154 |
| Western Area | 0.4566 | 0.3519 | 0.2811 | 0.3007 | 0.3251 | 0.3331 | 0.3779 | 0.3238 | 0.3226 |
| Overall Area | 0.4868 | 0.3641 | 0.3040 | 0.3215 | 0.3524 | 0.3860 | 0.4259 | 0.3827 | 0.3843 |
| Three Areas | Years | ||||||||
| 2000 | 2001 | 2002 | 2003 | 2004 | 2005 | 2006 | 2007 | 2008 | |
| Eastern Area | 0.4274 | 0.4451 | 0.4476 | 0.4265 | 0.4363 | 0.4445 | 0.4582 | 0.4772 | 0.5333 |
| Central Area | 0.3985 | 0.3901 | 0.3758 | 0.3548 | 0.3521 | 0.3424 | 0.3334 | 0.3361 | 0.4224 |
| Western Area | 0.3151 | 0.3053 | 0.2911 | 0.2757 | 0.2769 | 0.2748 | 0.2702 | 0.2812 | 0.3145 |
| Overall Area | 0.3803 | 0.3802 | 0.3715 | 0.3523 | 0.3551 | 0.3539 | 0.3539 | 0.3649 | 0.4234 |
| Three Areas | Years | ||||||||
| 2009 | 2010 | 2011 | 2012 | 2013 | 2014 | 2015 | Total Average | ||
| Eastern Area | 0.4871 | 0.5280 | 0.5610 | 0.5783 | 0.5980 | 0.6072 | 0.6234 | 0.4543 | |
| Central Area | 0.3159 | 0.3417 | 0.3727 | 0.3720 | 0.3850 | 0.3928 | 0.3947 | 0.3901 | |
| Western Area | 0.2773 | 0.3006 | 0.3192 | 0.3249 | 0.3321 | 0.3326 | 0.3406 | 0.3162 | |
| Overall Area | 0.3601 | 0.3901 | 0.4176 | 0.4250 | 0.4384 | 0.4442 | 0.4529 | 0.3869 | |
| Economic Zones | Years | ||||||||
| 1991 | 1992 | 1993 | 1994 | 1995 | 1996 | 1997 | 1998 | 1999 | |
| Central Bohai | 0.3990 | 0.3129 | 0.2890 | 0.3033 | 0.3184 | 0.3426 | 0.3511 | 0.3591 | 0.3701 |
| Yangtze River Delta | 0.4446 | 0.3490 | 0.3107 | 0.3217 | 0.3235 | 0.3540 | 0.3879 | 0.4044 | 0.4293 |
| Pearl River Delta | 0.4396 | 0.3518 | 0.3093 | 0.3322 | 0.3726 | 0.4086 | 0.4491 | 0.4523 | 0.4579 |
| Northeast | 0.4102 | 0.3429 | 0.3041 | 0.3371 | 0.3603 | 0.4634 | 0.4537 | 0.3977 | 0.4034 |
| Central Provinces | 0.6340 | 0.4238 | 0.3367 | 0.3449 | 0.4038 | 0.4420 | 0.5163 | 0.4331 | 0.4227 |
| Great Southwest | 0.6935 | 0.4624 | 0.3368 | 0.3463 | 0.3570 | 0.3625 | 0.3878 | 0.3545 | 0.3598 |
| Great Northwest | 0.2986 | 0.2782 | 0.2440 | 0.2702 | 0.3038 | 0.3135 | 0.3712 | 0.3033 | 0.2978 |
| Economic Zones | Years | ||||||||
| 2000 | 2001 | 2002 | 2003 | 2004 | 2005 | 2006 | 2007 | 2008 | |
| Central Bohai | 0.3883 | 0.4118 | 0.4121 | 0.3939 | 0.4137 | 0.4321 | 0.4411 | 0.4642 | 0.4933 |
| Yangtze River Delta | 0.4459 | 0.4591 | 0.4580 | 0.4437 | 0.4587 | 0.4738 | 0.5042 | 0.5330 | 0.5651 |
| Pearl River Delta | 0.4639 | 0.4854 | 0.4958 | 0.4682 | 0.4806 | 0.4721 | 0.4818 | 0.4902 | 0.6200 |
| Northeast | 0.4077 | 0.3995 | 0.3958 | 0.3856 | 0.3691 | 0.3624 | 0.3488 | 0.3478 | 0.3559 |
| Central Provinces | 0.3974 | 0.3898 | 0.3723 | 0.3436 | 0.3393 | 0.3293 | 0.3231 | 0.3281 | 0.4417 |
| Great Southwest | 0.3547 | 0.3459 | 0.3362 | 0.3151 | 0.3108 | 0.2982 | 0.2689 | 0.2757 | 0.3235 |
| Great Northwest | 0.2886 | 0.2782 | 0.2611 | 0.2494 | 0.2543 | 0.2592 | 0.2710 | 0.2849 | 0.3086 |
| Economic Zones | Years | ||||||||
| 2009 | 2010 | 2011 | 2012 | 2013 | 2014 | 2015 | Total Average | ||
| Central Bohai | 0.4741 | 0.5143 | 0.5430 | 0.5607 | 0.5929 | 0.6121 | 0.6209 | 0.4326 | |
| Yangtze River Delta | 0.5678 | 0.6261 | 0.6787 | 0.7121 | 0.7240 | 0.7228 | 0.7459 | 0.4978 | |
| Pearl River Delta | 0.4745 | 0.5040 | 0.5210 | 0.5239 | 0.5336 | 0.5363 | 0.5402 | 0.4666 | |
| Northeast | 0.3374 | 0.3593 | 0.4024 | 0.4022 | 0.4225 | 0.4425 | 0.4620 | 0.3869 | |
| Central Provinces | 0.3084 | 0.3360 | 0.3623 | 0.3633 | 0.3743 | 0.3781 | 0.3812 | 0.3890 | |
| Great Southwest | 0.2593 | 0.2720 | 0.3007 | 0.3060 | 0.3219 | 0.3279 | 0.3505 | 0.3451 | |
| Great Northwest | 0.2893 | 0.3196 | 0.3315 | 0.3375 | 0.3389 | 0.3358 | 0.3340 | 0.2969 | |
| Areas | 1991–1995 Eighth-Five | 1996–2000 Ninth-Five | 2001–2005 Tenth-Five | 2006–2010 Eleventh-Five | 2011–2015 Twelfth-Five |
| Eastern Area | 0.3408 | 0.4004 | 0.4400 | 0.4968 | 0.5936 |
| Central Area | 0.4133 | 0.4407 | 0.3631 | 0.3499 | 0.3834 |
| Western Area | 0.3431 | 0.3345 | 0.2848 | 0.2888 | 0.3299 |
| Overall Area | 0.3657 | 0.3919 | 0.3626 | 0.3785 | 0.4356 |
| Economic zones | 1991–1995 Eighth-Five | 1996–2000 Ninth-Five | 2001–2005 Tenth-Five | 2006–2010 Eleventh-Five | 2011–2015 Twelfth-Five |
| Central Bohai | 0.3245 | 0.3622 | 0.4127 | 0.4774 | 0.5859 |
| Yangtze River Delta | 0.3499 | 0.4043 | 0.4587 | 0.5592 | 0.7167 |
| Pearl River Delta | 0.3611 | 0.4464 | 0.4804 | 0.5141 | 0.5310 |
| Northeast | 0.3509 | 0.4252 | 0.3825 | 0.3499 | 0.4263 |
| Central Provinces | 0.4286 | 0.4423 | 0.3548 | 0.3475 | 0.3718 |
| Great Southwest | 0.4392 | 0.3639 | 0.3212 | 0.2799 | 0.3214 |
| Great Northwest | 0.2790 | 0.3149 | 0.2605 | 0.2947 | 0.3355 |
| Parameter | |||||
|---|---|---|---|---|---|
| Pooled OLS | SYS-GMM Two Step | Pooled OLS | SYS-GMM Two Step | SYS-GMM Two Step | |
| −0.0615 *** (−3.55) | - | −0.0037 (−0.91) | |||
| −0.0705 *** (−4.24) | −0.0697 *** (−15.56) | - | - | - | |
| - | - | −0.0554 *** (−3.74) | −0.4834 *** (−12.55) | - | |
| −0.2275 *** (−48.34) | - | −0.1215 *** (−22.10) | - | ||
| - | - | - | - | 0.9440 *** (94.80) | |
| R2 | 0.0263 | - | 0.0206 | - | - |
| Sargan test | - | 1.0000 | - | 1.0000 | 1.000 |
| Sargan Test | Pooled OLS-R2 | Sargan Test | Pooled OLS-R2 | Sargan Test | |||||
|---|---|---|---|---|---|---|---|---|---|
| Three Areas | Eastern | −0.0456 *** (−3.97) | 1.00 | - | −0.4541 ** (−2.41) | 1.00 | - | 0.9376 *** (26.72) | 1.00 |
| Central | −0.0325 (−1.20) | 1.00 | - | −0.4904 *** (−5.35) | 1.00 | - | 0.8858 *** (10.33) | 1.00 | |
| Western | −0.0390 ** (−2.47) | 1.00 | - | −0.3944 *** (−5.49) | 1.00 | - | 0.8981 *** (7.70) | 1.00 | |
| Seven Economic Zones | Central Bohai | −0.0950 (−1.04) | 1.00 | - | −0.8983 * (−1.87) | 1.00 | 0.5817 (0.84) | 1.00 | |
| Yangtze River Delta | 0.0180 (0.02) | 1.00 | - | 1.6322 (0.48) | 1.00 | - | 0.9402 ** (2014) | 1.00 | |
| Pearl River Delta | −0.1203 ** (−2.21) | - | 0.07 | −0.0993 ** (−2.01) | - | 0.06 | 0.7648 ** (2.33) | 1.00 | |
| Northeast | −0.2710 *** (−3.03) | - | 0.12 | −0.3141 *** (−3.49) | - | 0.15 | −0.1130 (−0.16) | 1.00 | |
| Central Provinces | −0.3734 *** (−5.79) | 0.20 | −0.7471 *** (−3.37) | 1.00 | - | 0.8842 *** (6.16) | 1.00 | ||
| Great Southwest | −0.3028 *** (−4.71) | - | 0.20 | −0.1758 *** (−3.95) | - | 0.15 | 1.1225 *** (3.20) | 1.00 | |
| Great Northwest | −0.7528 ** (−2.13) | 1.00 | - | −0.4538 ** (−2.45) | 1.00 | - | 0.8328 *** (5.15) | 1.00 | |
| Sargan Test | Sargan Test | Sargan Test | ||||
|---|---|---|---|---|---|---|
| 1991–2005 | −0.0579 *** (−26.45) | 1.00 | −0.5424 *** (−28.23) | 1.00 | 0.9610 *** (523.41) | 1.00 |
| 2006–2015 | −0.0732 *** (−67.49) | 0.9704 | −0.7908 *** (−43.64) | 0.9742 | 0.9254 *** (4528.73) | 0.9627 |
| Sargan Test | Sargan Test | Sargan Test | |||||
|---|---|---|---|---|---|---|---|
| 1991–2005 | Eastern | −0.0366 *** (−4.68) | 1.00 | −0.1271 ** (−2.28) | 1.00 | 0.9340 *** (98.04) | 1.00 |
| Central | −0.0407 ** (−2.11) | 1.00 | −0.4872 ** (−8.94) | 1.00 | 0.9944 *** (14.84) | 1.00 | |
| Western | −0.0039 (−0.230) | 1.00 | −0.4227 *** (−4.84) | 1.00 | 0.9892 *** (15.82) | 1.00 | |
| 2006–2015 | Eastern | −0.0931 *** (−29.36) | 1.00 | −0.4098 *** (−4.73) | 1.00 | 0.8917 *** (37.76) | 1.00 |
| Central | −0.0640 *** (−61.40) | 1.00 | −0.8678 *** (−18.67) | 1.00 | 0.9012 *** (39.65) | 1.00 | |
| Western | −0.0580 *** (−67.85) | 1.00 | −0.5782 *** (−12.33) | 1.00 | 0.9690 *** (56.41) | 1.00 | |
| Sargan Test | Sargan Test | Sargan Test | |||||
|---|---|---|---|---|---|---|---|
| 1991–2005 | Central Bohai | −0.4724 (−1.48) | 1.00 | −1.3168 (−1.19) | 1.00 | 1.1067 *** (2.78) | 1.00 |
| Yangtze River Delta | −0.2243 (−1.15) | 1.00 | −0.3208 (−0.60) | 1.00 | 0.6585 (0.99) | 1.00 | |
| Pearl River Delta | −0.5165 * (−1.94) | 1.00 | −4.9890 (−1.15) | 1.00 | 0.5969 * (1.85) | 1.00 | |
| Northeast | −0.2602 (−1.24) | 1.00 | −1.9425 (−1.32) | 1.00 | −0.1133 (−0.16) | 1.00 | |
| Central Provinces | −0.0299 (−1.00) | 1.00 | −0.5219 *** (−3.67) | 1.00 | 1.0233 *** (10.78) | 1.00 | |
| Great Southwest | −0.0250 (−0.47) | 1.00 | 1.0528 (1.38) | 1.00 | 0.6773 * (1.65) | 1.00 | |
| Great Northwest | −0.0489 ** (−2.29) | 1.00 | −0.4949 *** (−2.79) | 1.00 | 0.8001 *** (4.77) | 1.00 | |
| 2006–2015 | Central Bohai | −0.0546 *** (−3.00) | 1.00 | 0.0627 (0.45) | 1.00 | 0.9741 *** (8.62) | 1.00 |
| Yangtze River Delta | −0.3679 ** (−2.00) | 1.00 | 0.4717 (0.22) | 1.00 | 0.9419 *** (10.79) | 1.00 | |
| Pearl River Delta | −0.0691 (−0.28) | 1.00 | −0.2203 *** (−5.82) | 1.00 | 0.9711 *** (2.57) | 1.00 | |
| Northeast | −0.0690 (−0.13) | 1.00 | −0.0313 (−0.02) | 1.00 | 0.6240 (1.56) | 1.00 | |
| Central Provinces | −0.0651 *** (−5.90) | 1.00 | −0.7551 *** (−9.60) | 1.00 | 0.8689 *** (22.25) | 1.00 | |
| Great Southwest | −0.0627 *** (−20.31) | 1.00 | −0.2481 *** (−8.37) | 1.00 | 0.9575 *** (−41.02) | 1.00 | |
| Great Northwest | −0.0451 *** (−3.34) | 1.00 | 0.0836 (0.82) | 1.00 | 0.9747 *** (10.37) | 1.00 | |
Publisher’s Note: MDPI stays neutral with regard to jurisdictional claims in published maps and institutional affiliations. |
© 2020 by the authors. Licensee MDPI, Basel, Switzerland. This article is an open access article distributed under the terms and conditions of the Creative Commons Attribution (CC BY) license (http://creativecommons.org/licenses/by/4.0/).
Share and Cite
Yang, W.; Lu, Z.; Wang, D.; Shao, Y.; Shi, J. Sustainable Evolution of China’s Regional Energy Efficiency Based on a Weighted SBM Model with Energy Substitutability. Sustainability 2020, 12, 10073. https://doi.org/10.3390/su122310073
Yang W, Lu Z, Wang D, Shao Y, Shi J. Sustainable Evolution of China’s Regional Energy Efficiency Based on a Weighted SBM Model with Energy Substitutability. Sustainability. 2020; 12(23):10073. https://doi.org/10.3390/su122310073
Chicago/Turabian StyleYang, Wei, Zudi Lu, Di Wang, Yanmin Shao, and Jinfeng Shi. 2020. "Sustainable Evolution of China’s Regional Energy Efficiency Based on a Weighted SBM Model with Energy Substitutability" Sustainability 12, no. 23: 10073. https://doi.org/10.3390/su122310073
APA StyleYang, W., Lu, Z., Wang, D., Shao, Y., & Shi, J. (2020). Sustainable Evolution of China’s Regional Energy Efficiency Based on a Weighted SBM Model with Energy Substitutability. Sustainability, 12(23), 10073. https://doi.org/10.3390/su122310073