A Vector Map of Carbon Emission Based on Point-Line-Area Carbon Emission Classified Allocation Method


Abstract
1. Introduction
2. Materials and Methods
2.1. Study Area
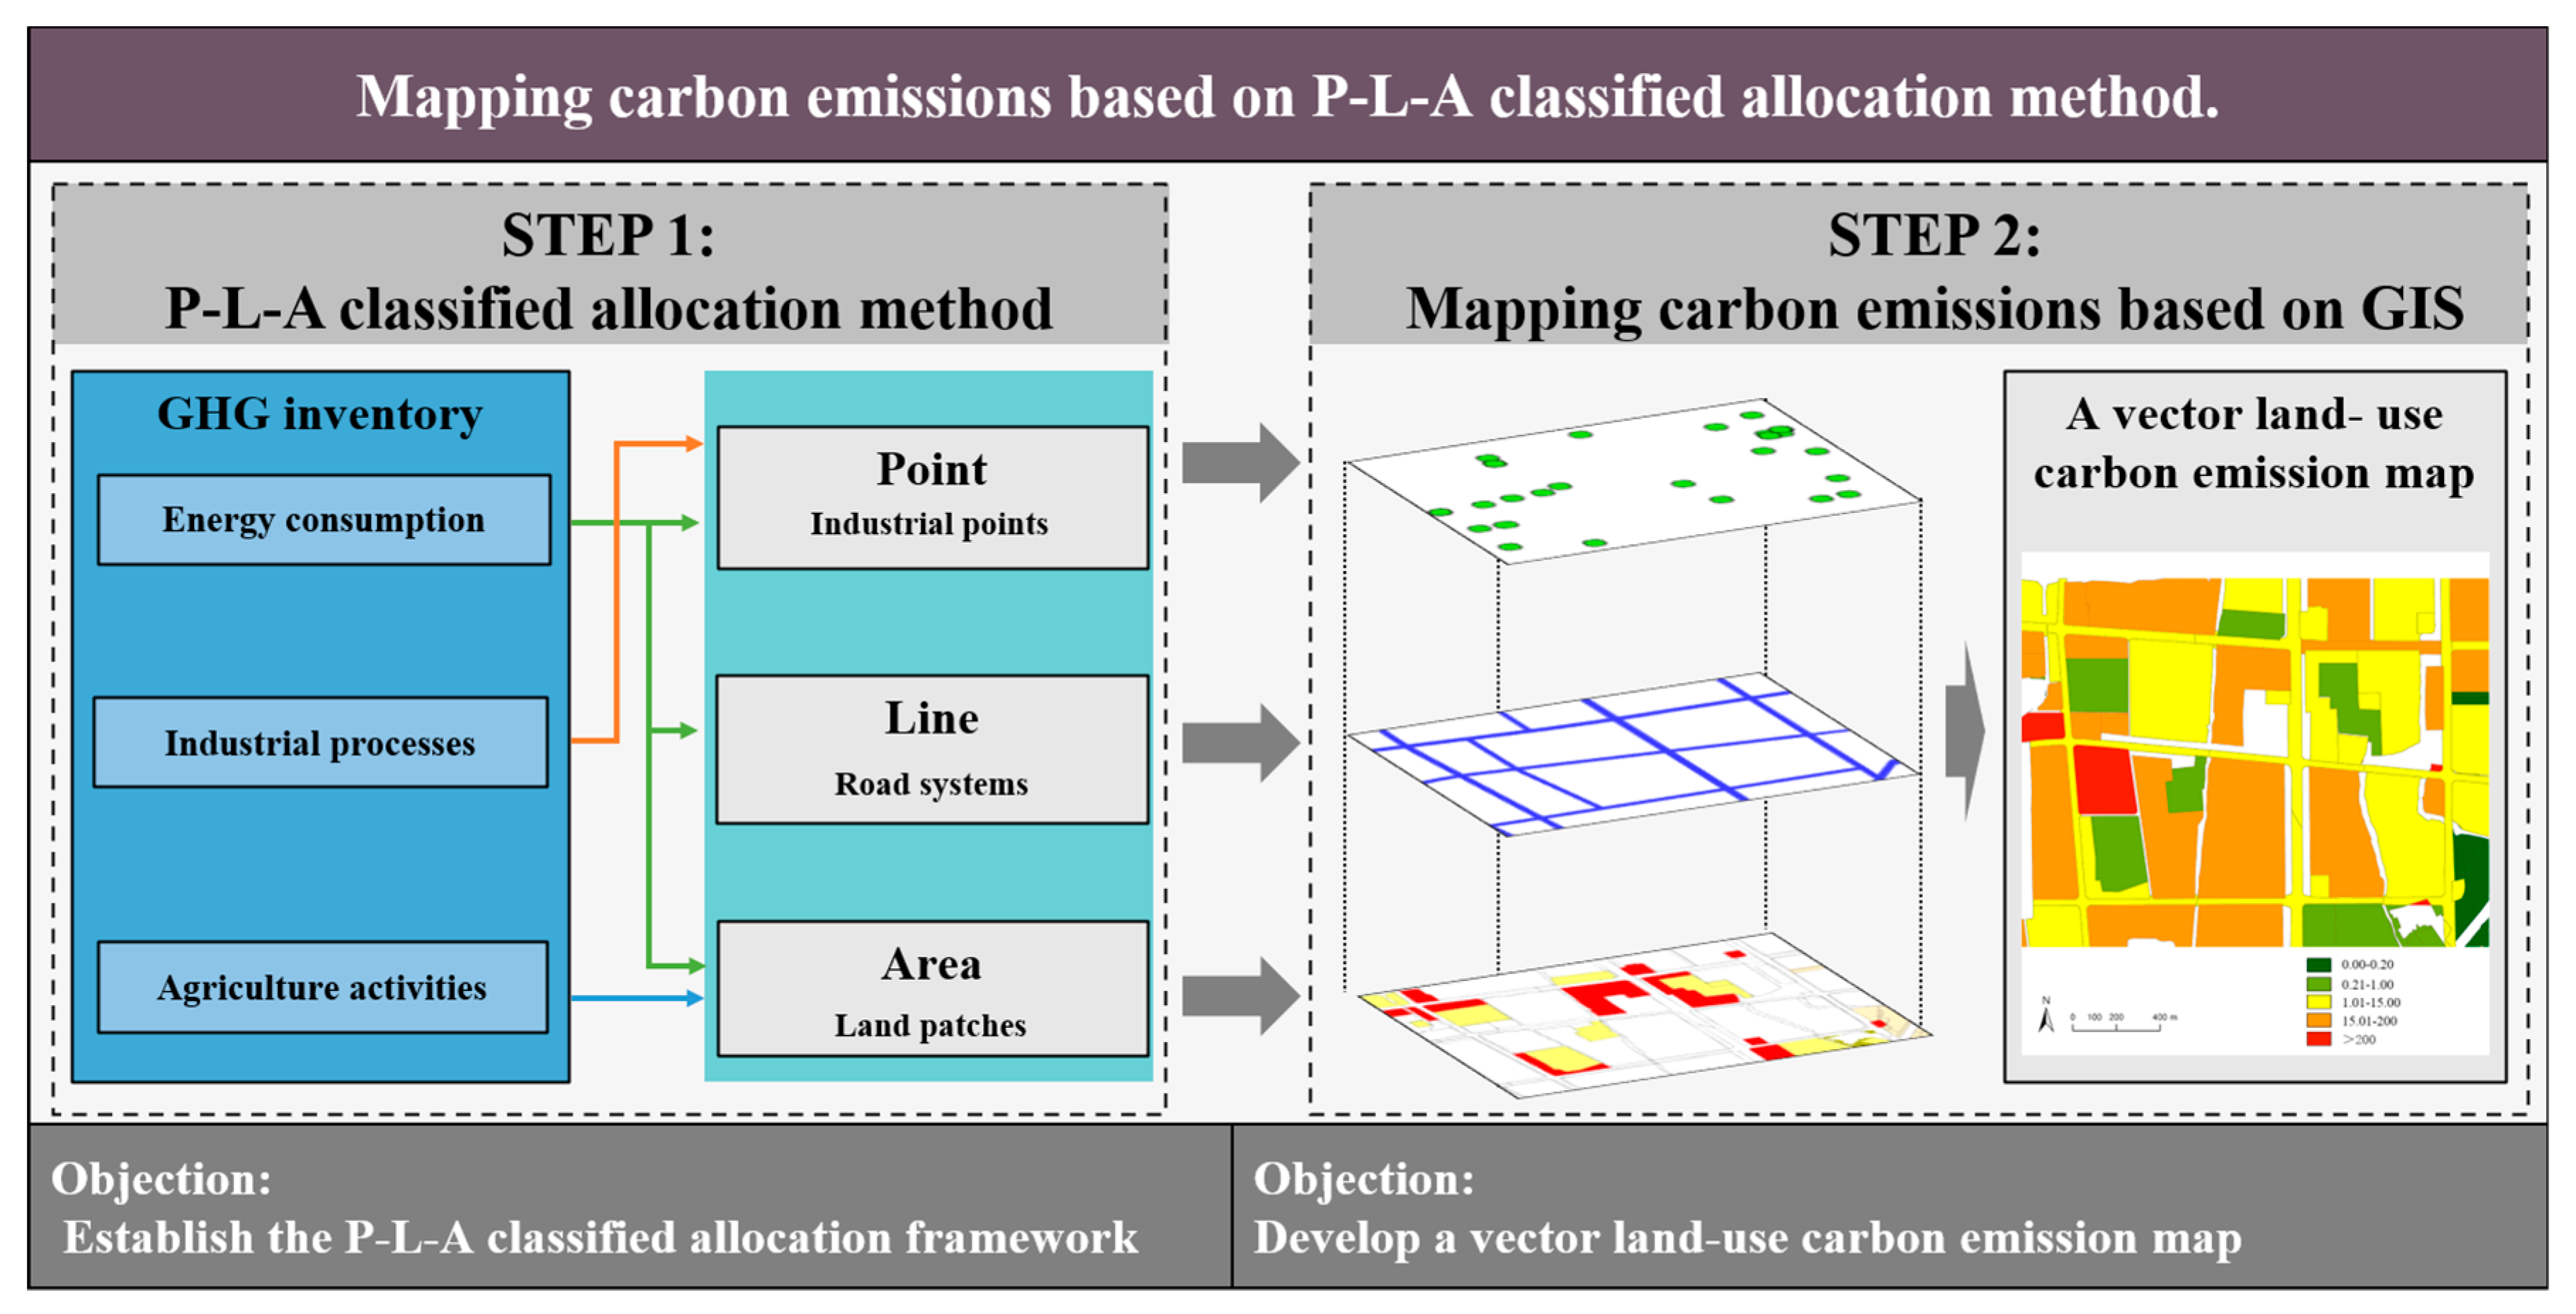
2.2. Methods
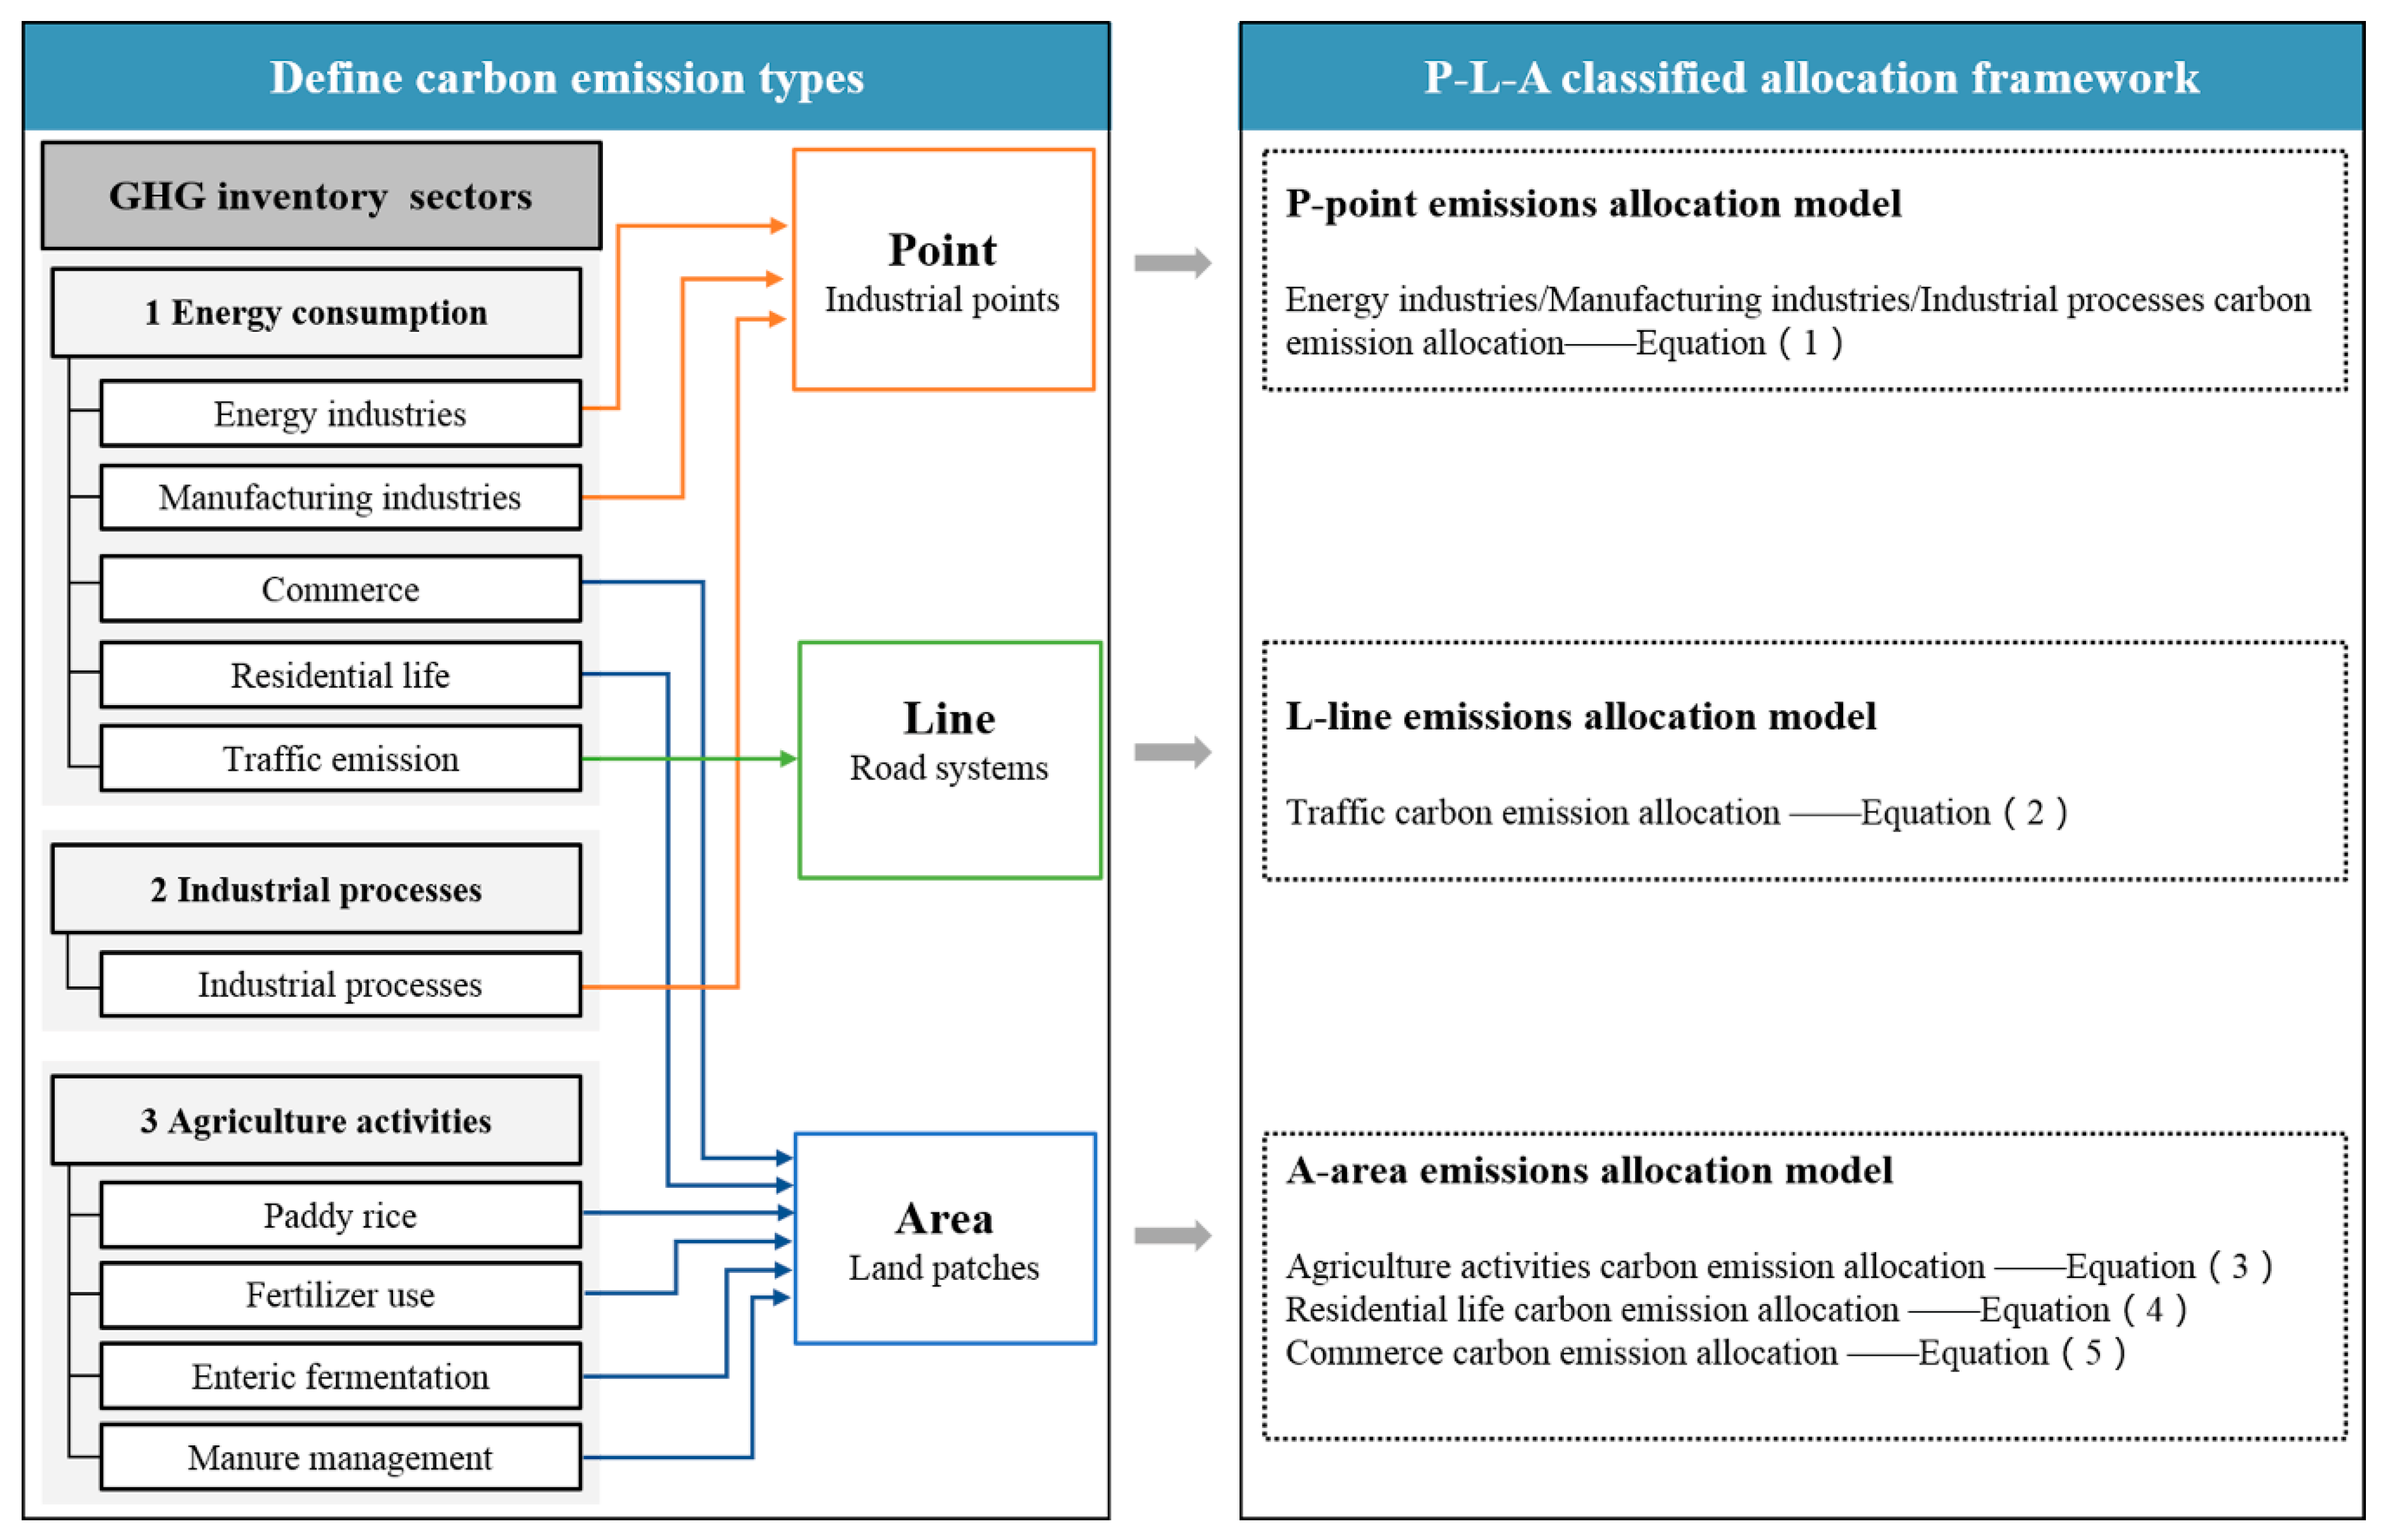
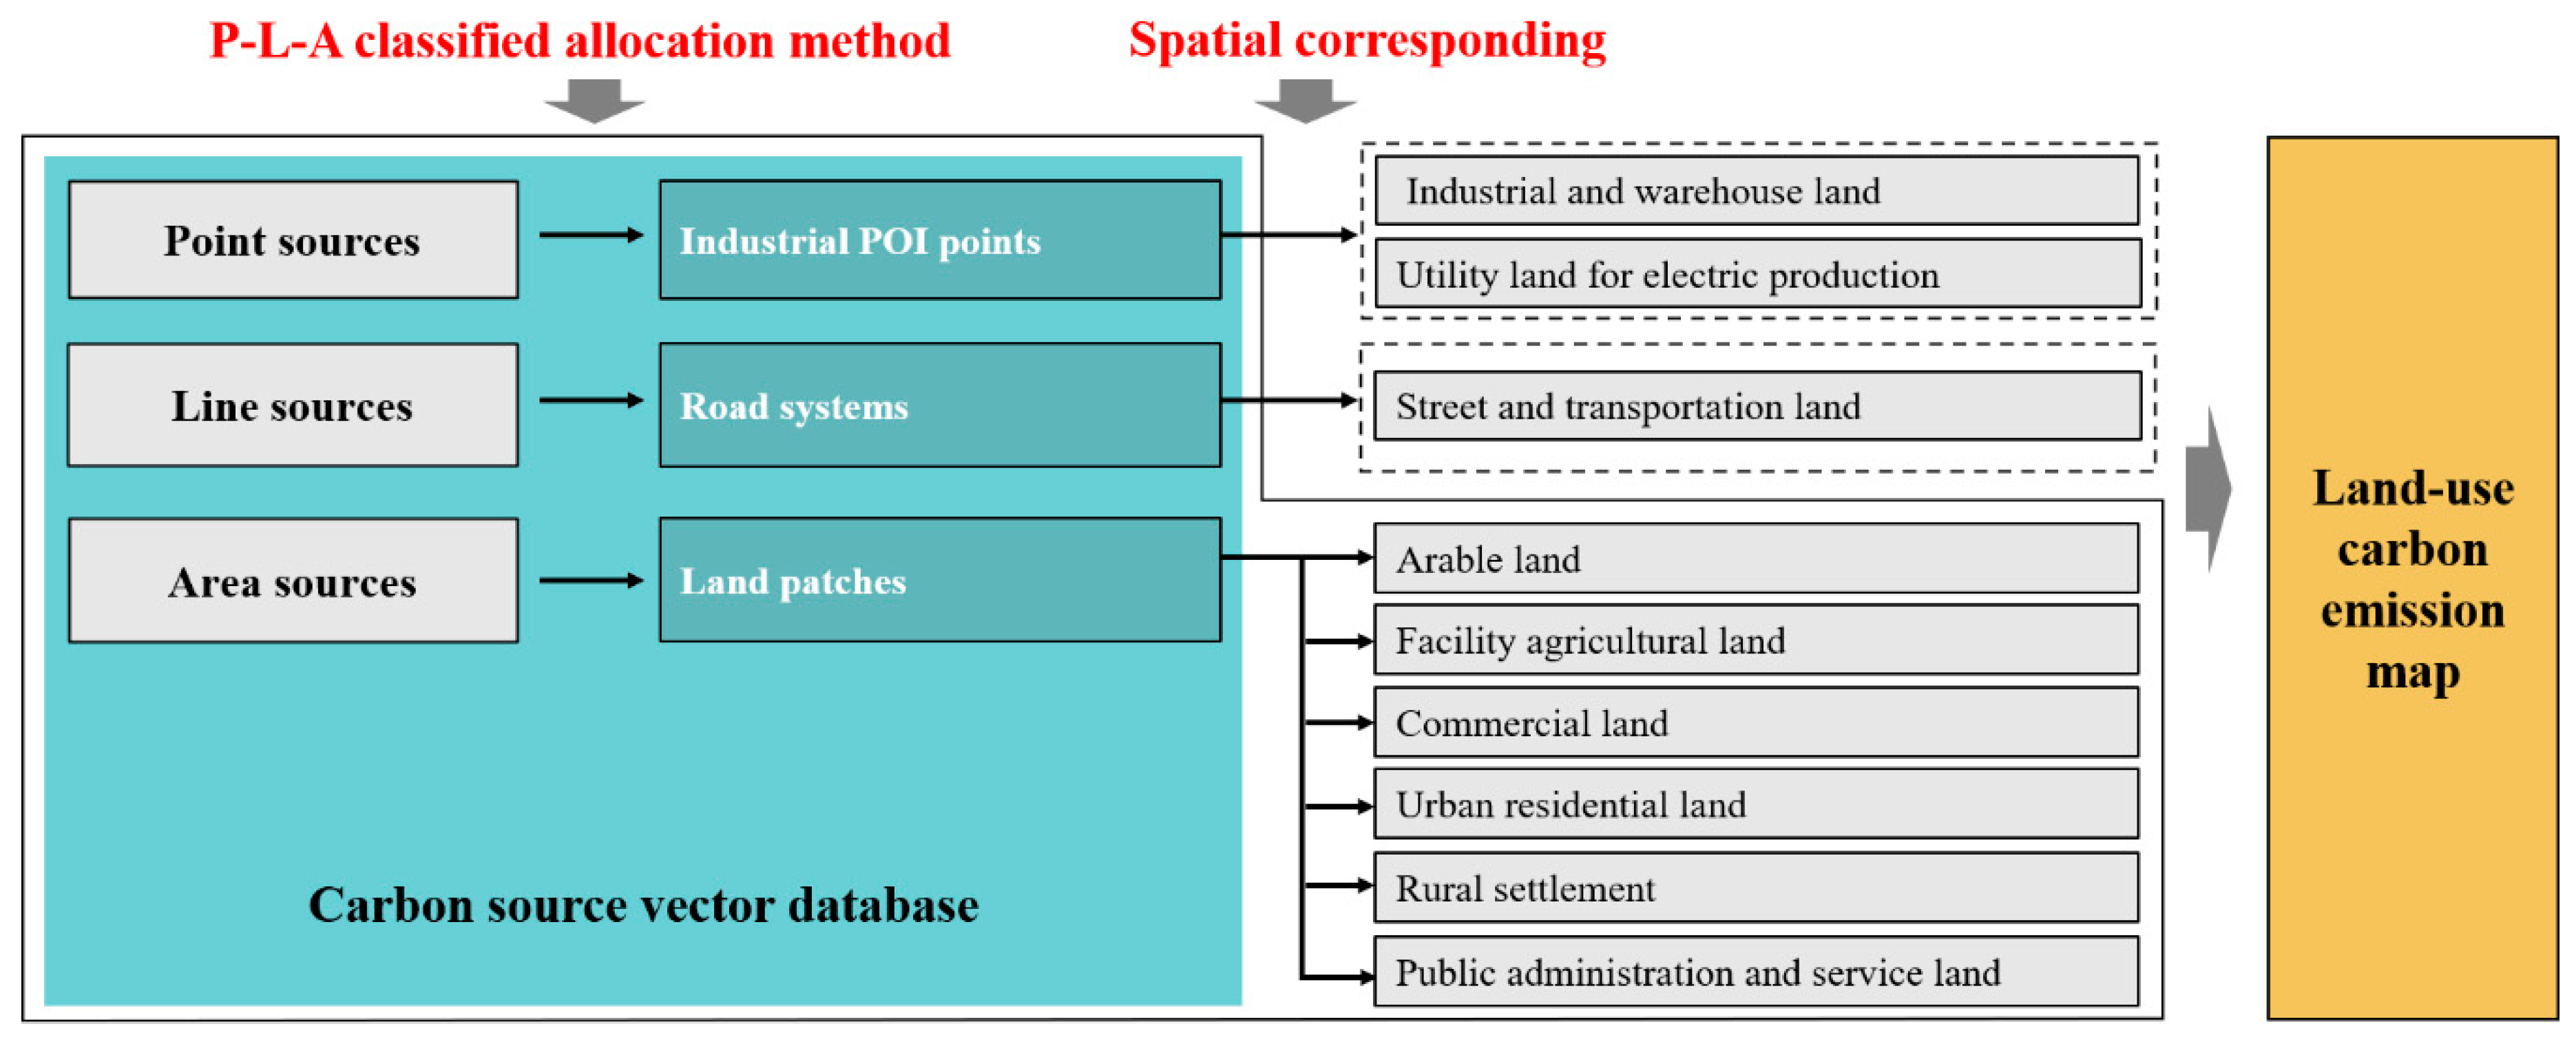
2.2.1. Step 1: P-L-A Carbon Emission Classified Allocation Method
Point Emissions Allocation Model
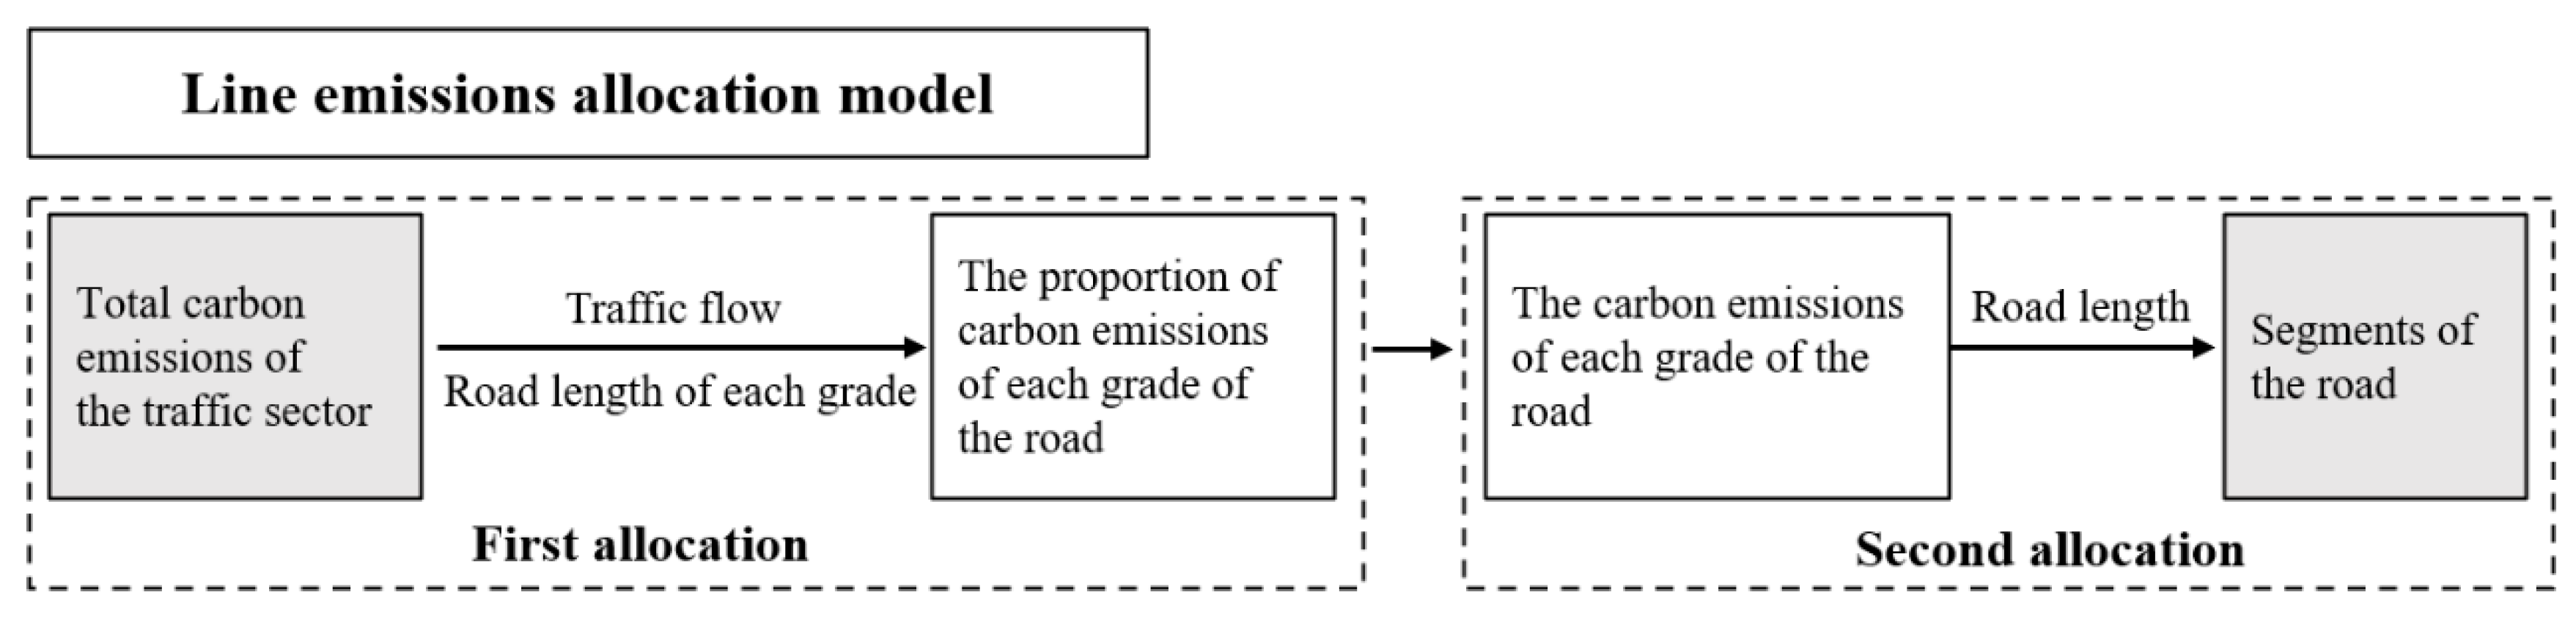
Line Emissions Allocation Model
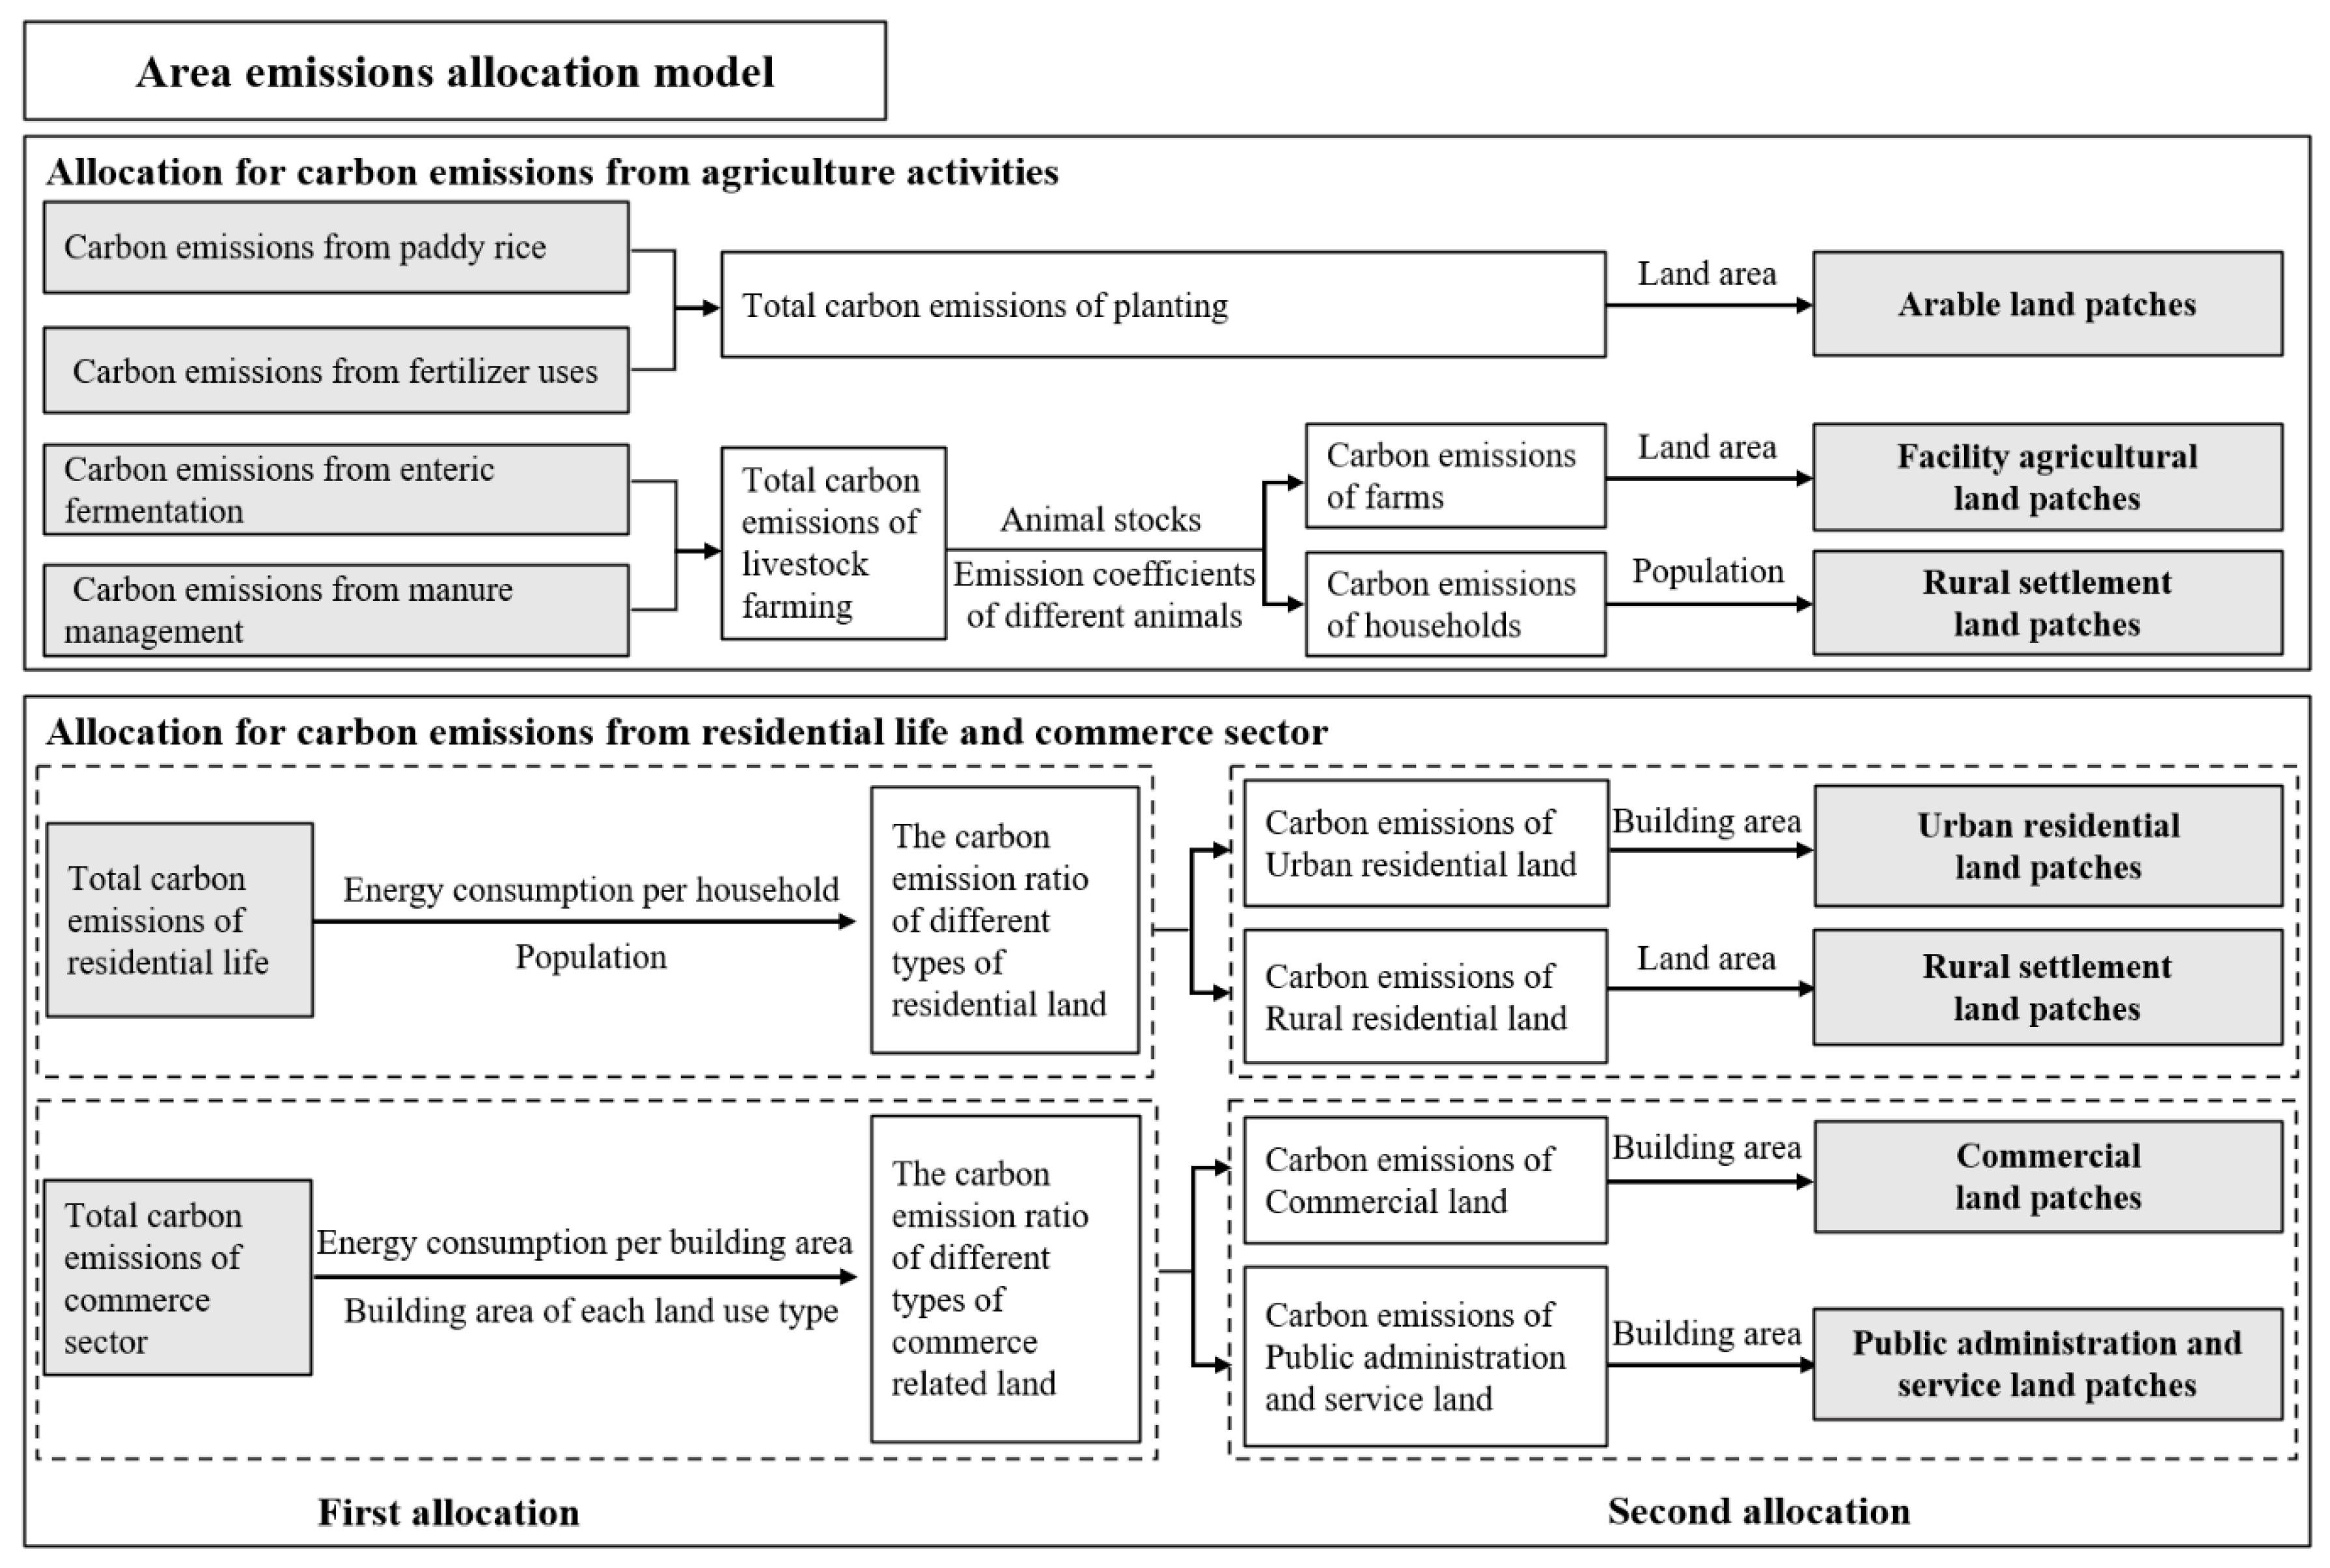
Area Emissions Allocation Model
2.2.2. Step 2: Mapping Carbon Emissions Based on GIS
3. Results
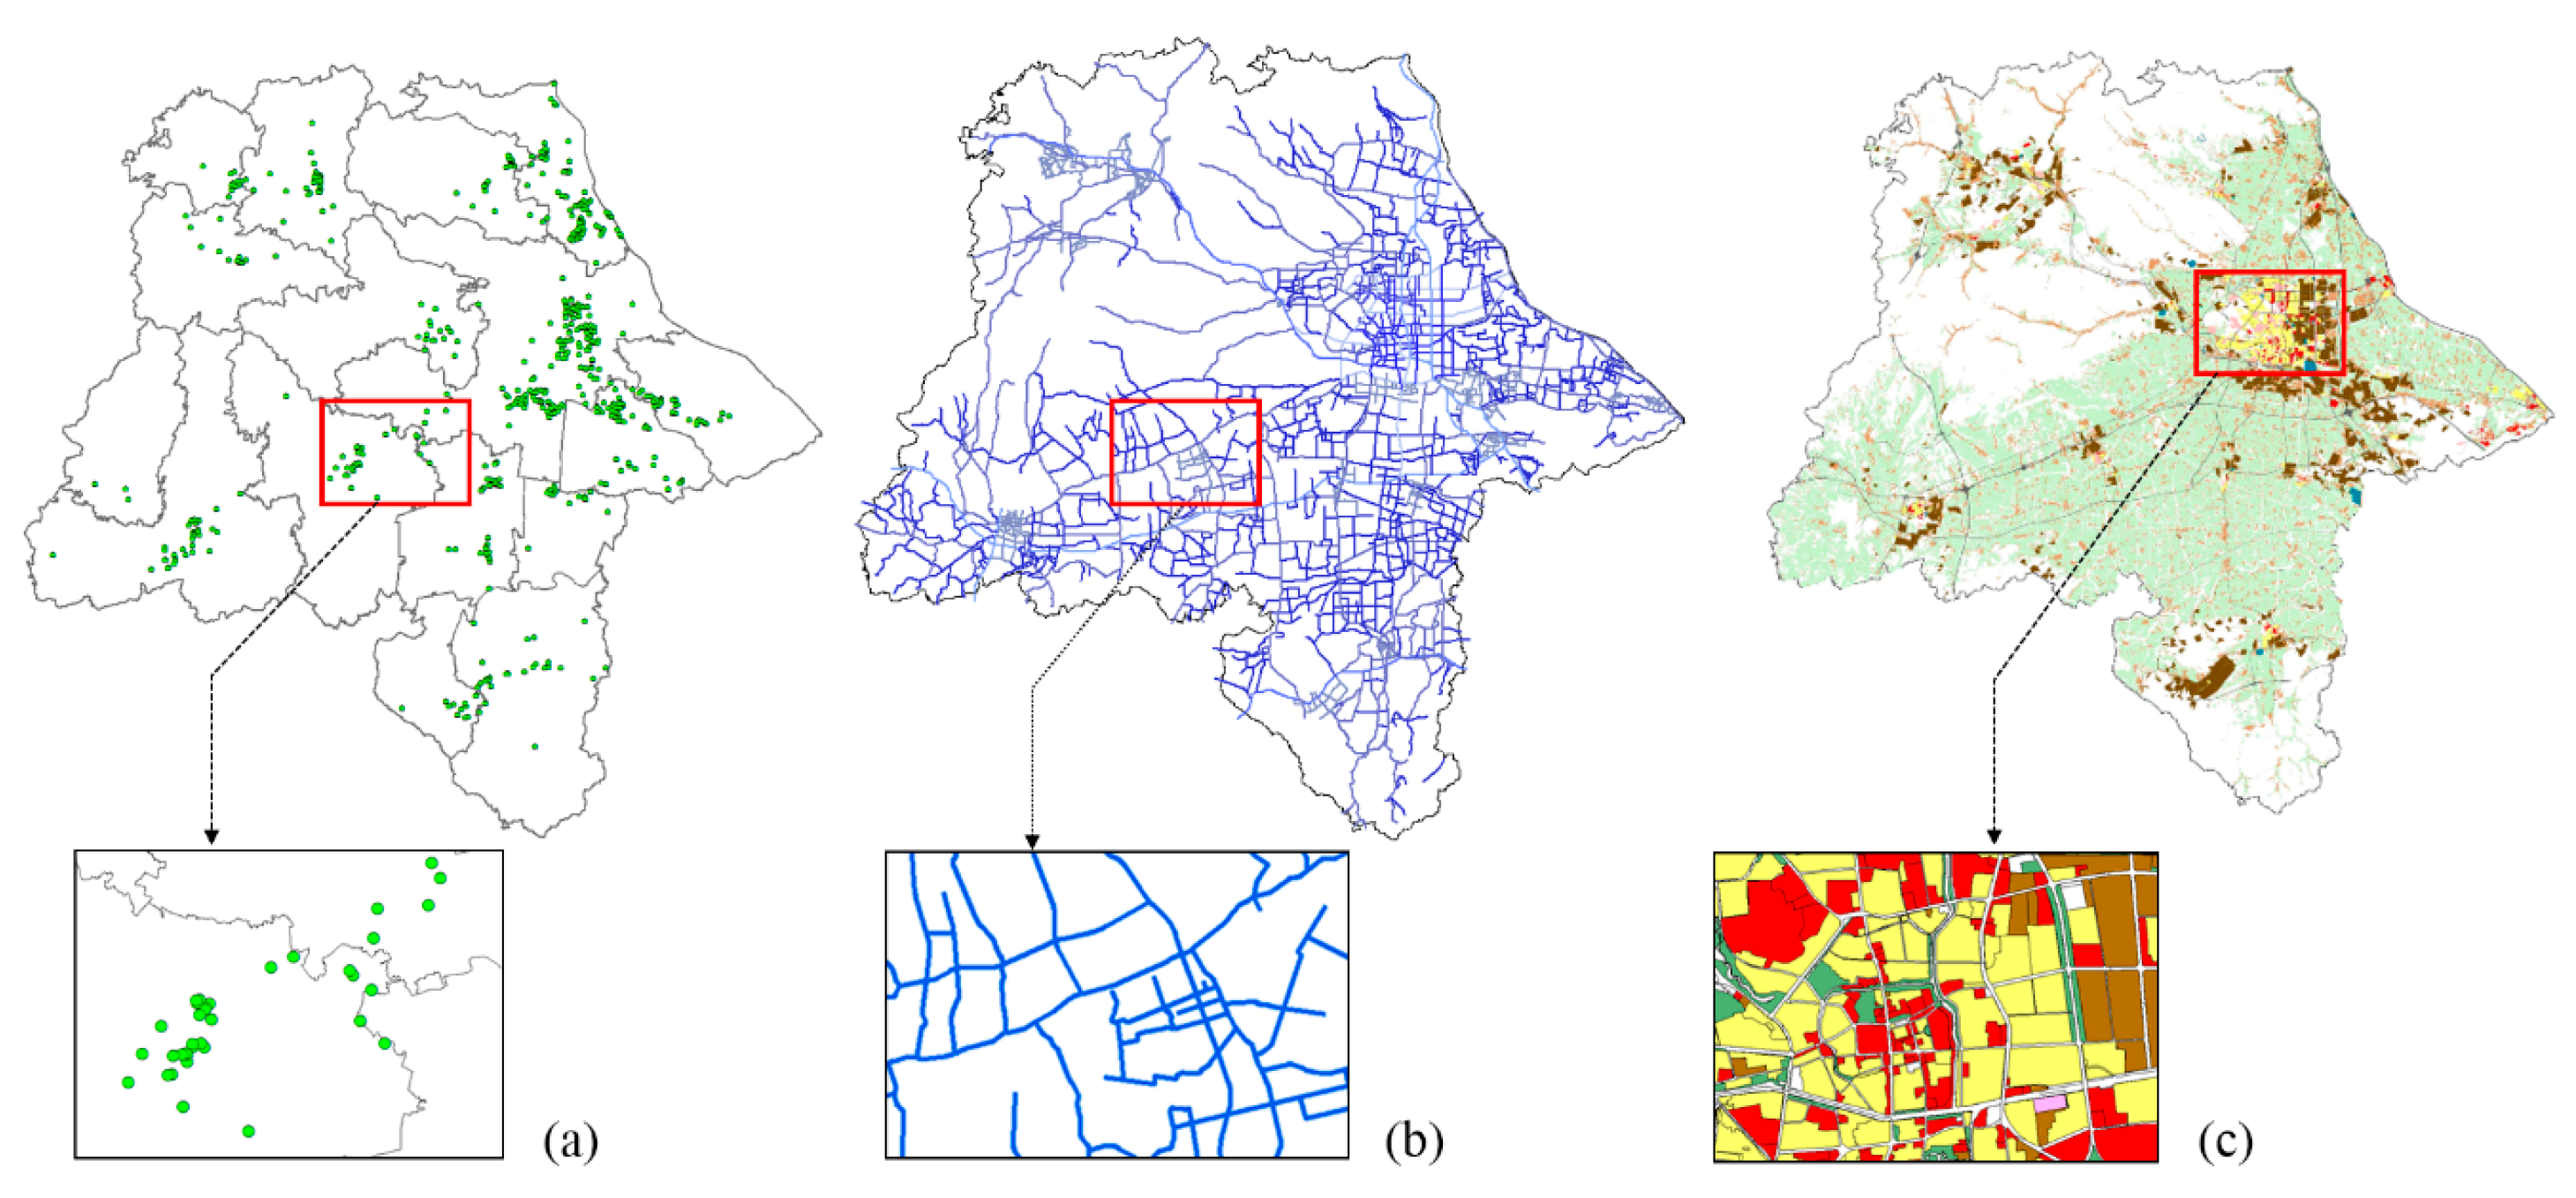
3.1. Carbon Source Vector Database
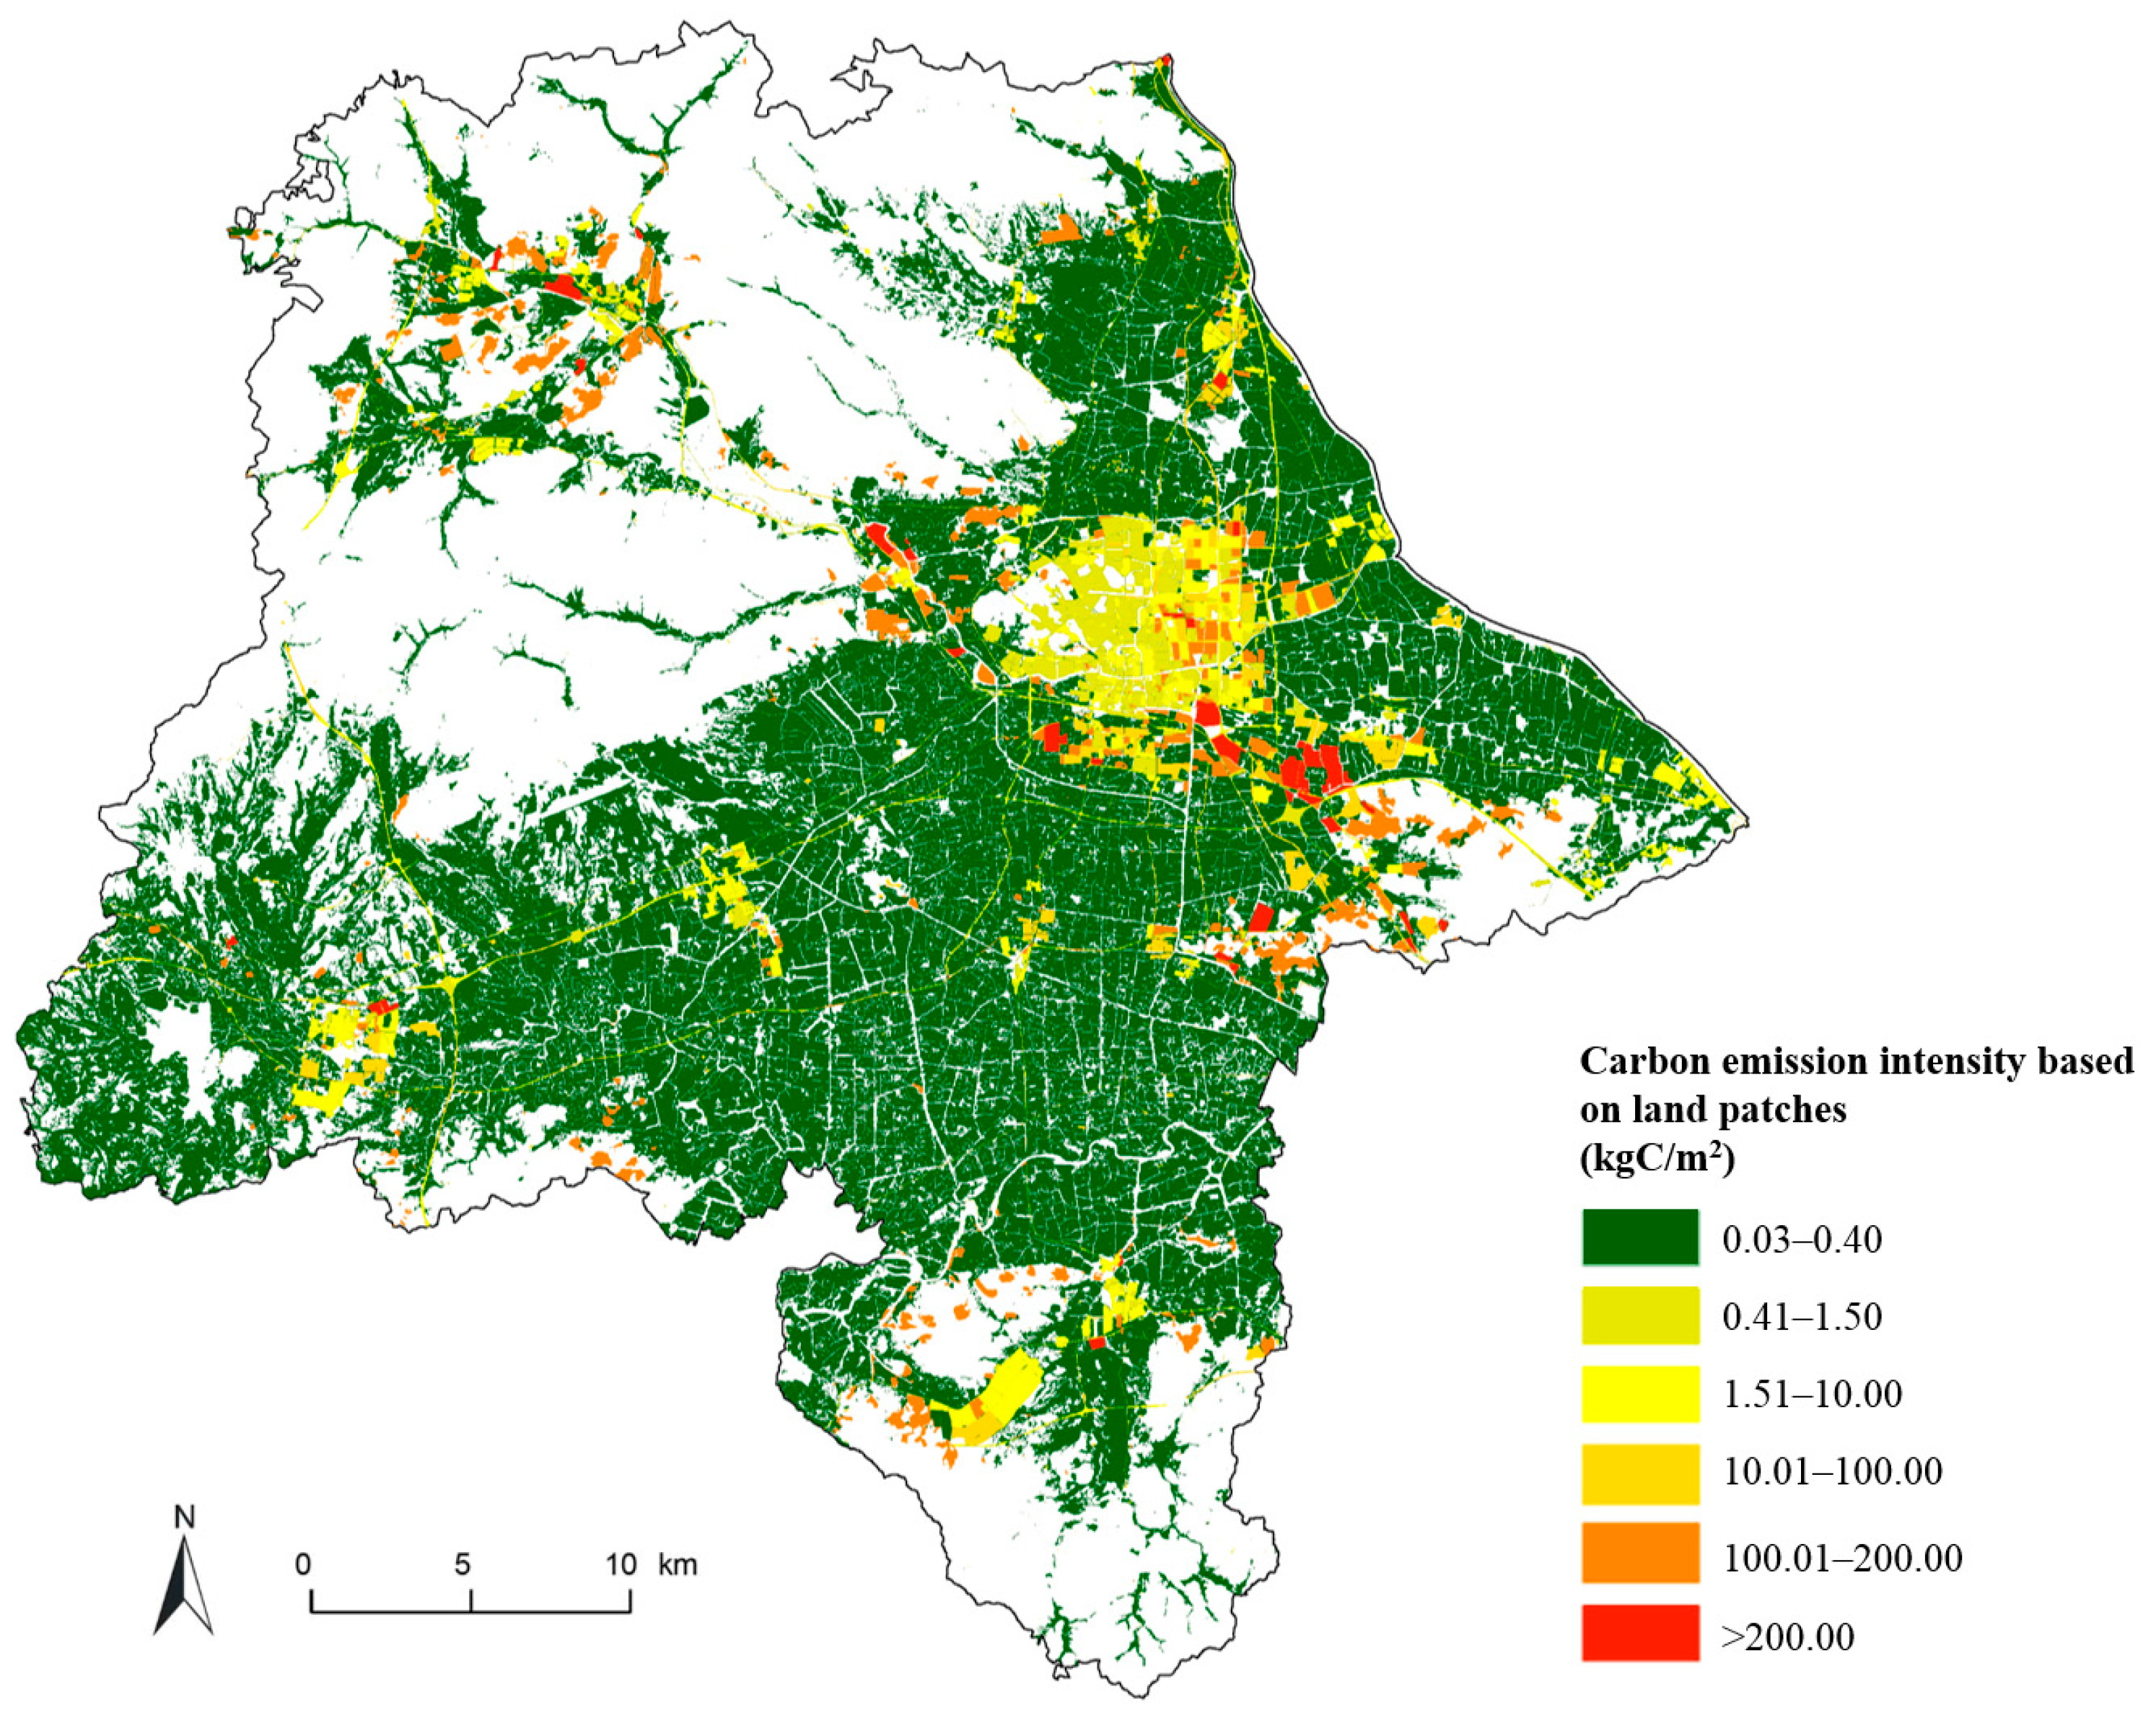
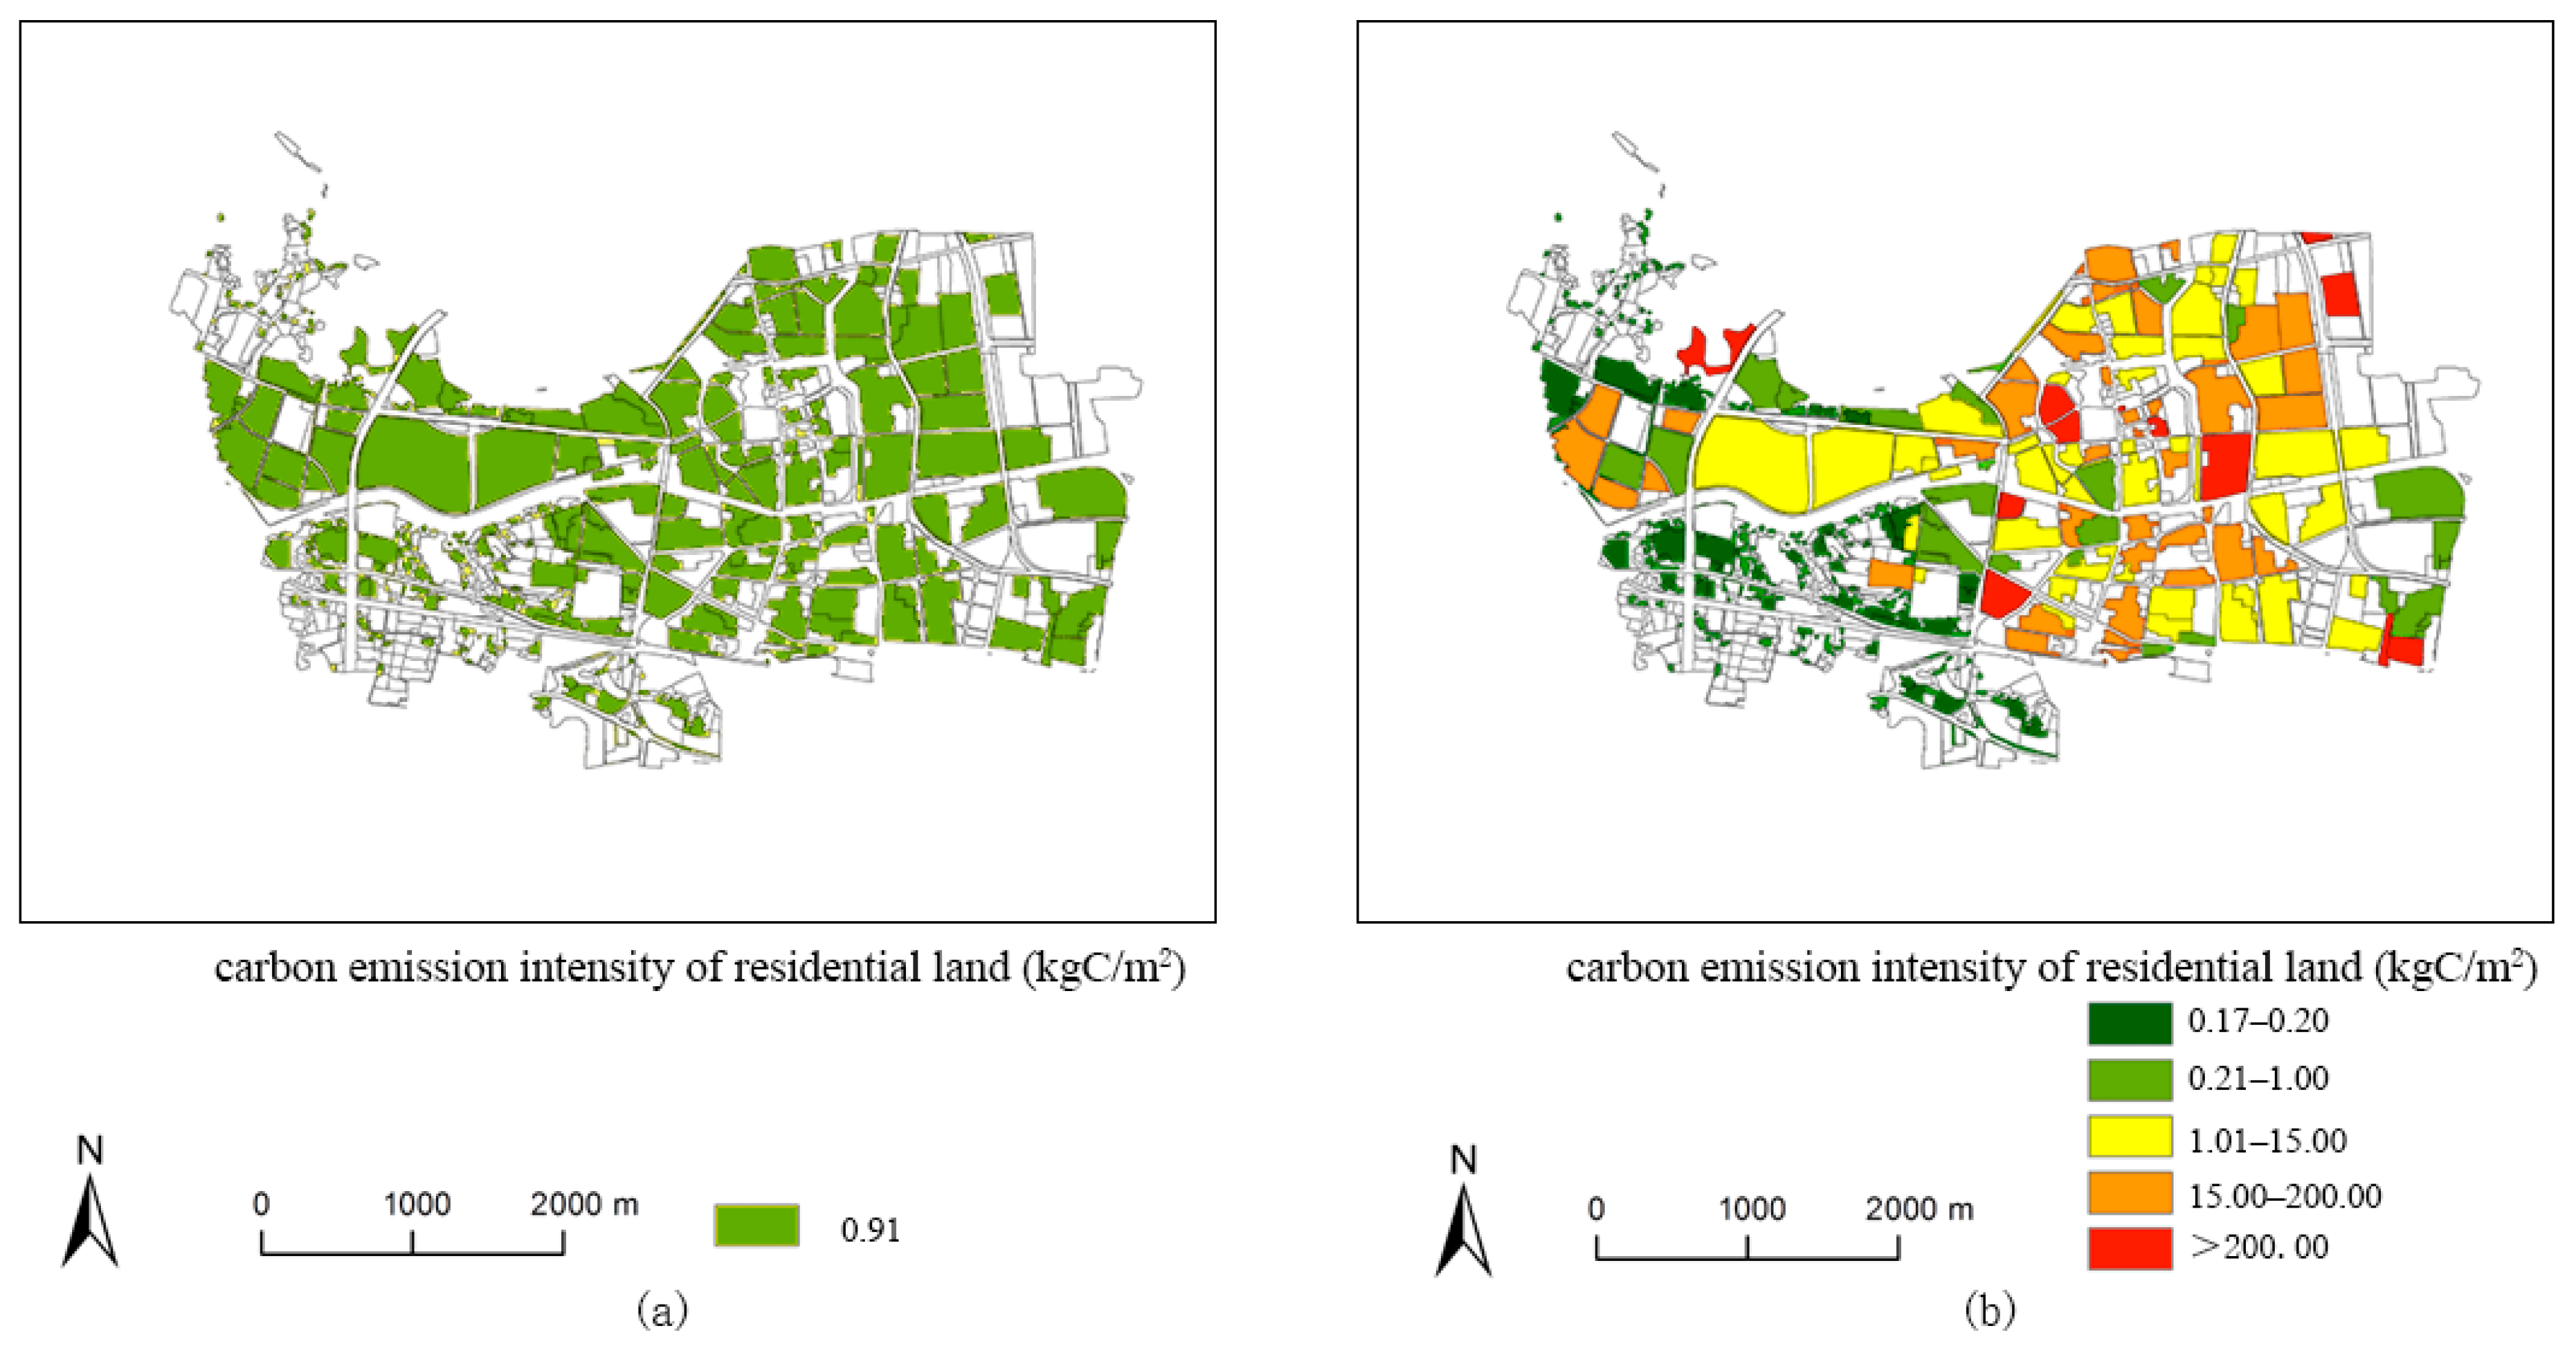
3.2. Vector Carbon Emission Map Based on Land Patches
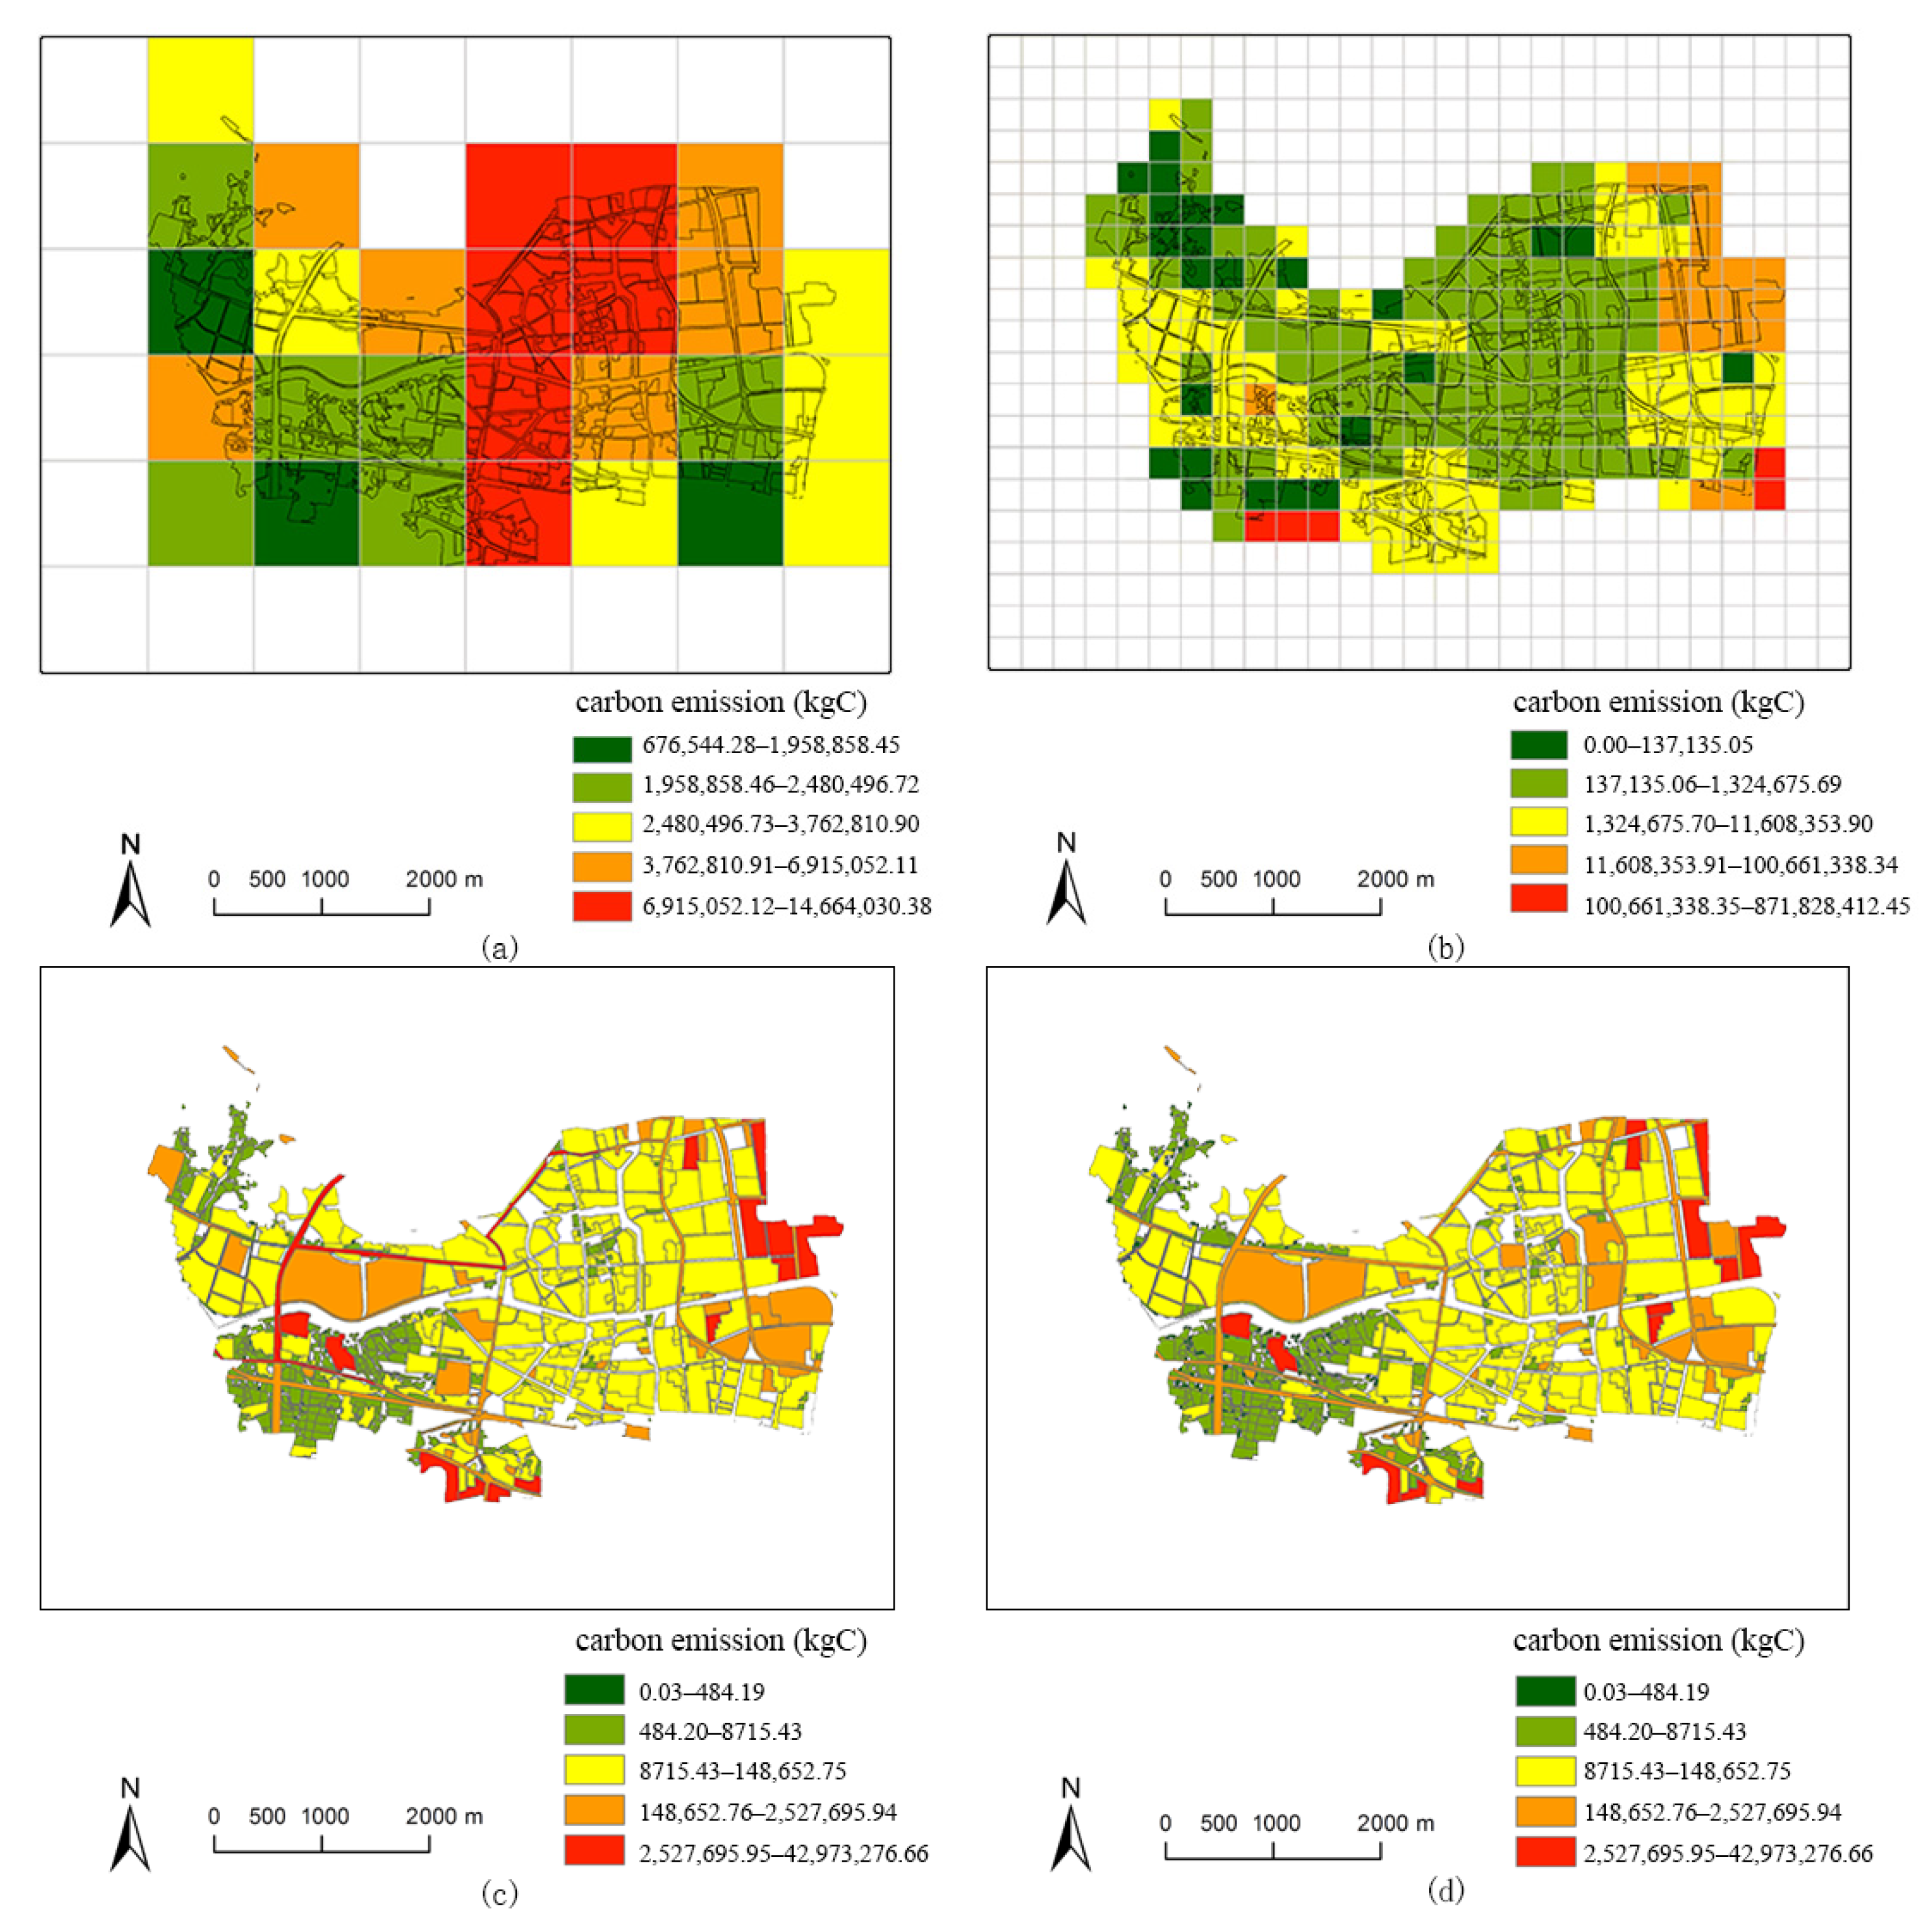
3.3. Cross Comparison with Existing Methods
4. Discussion
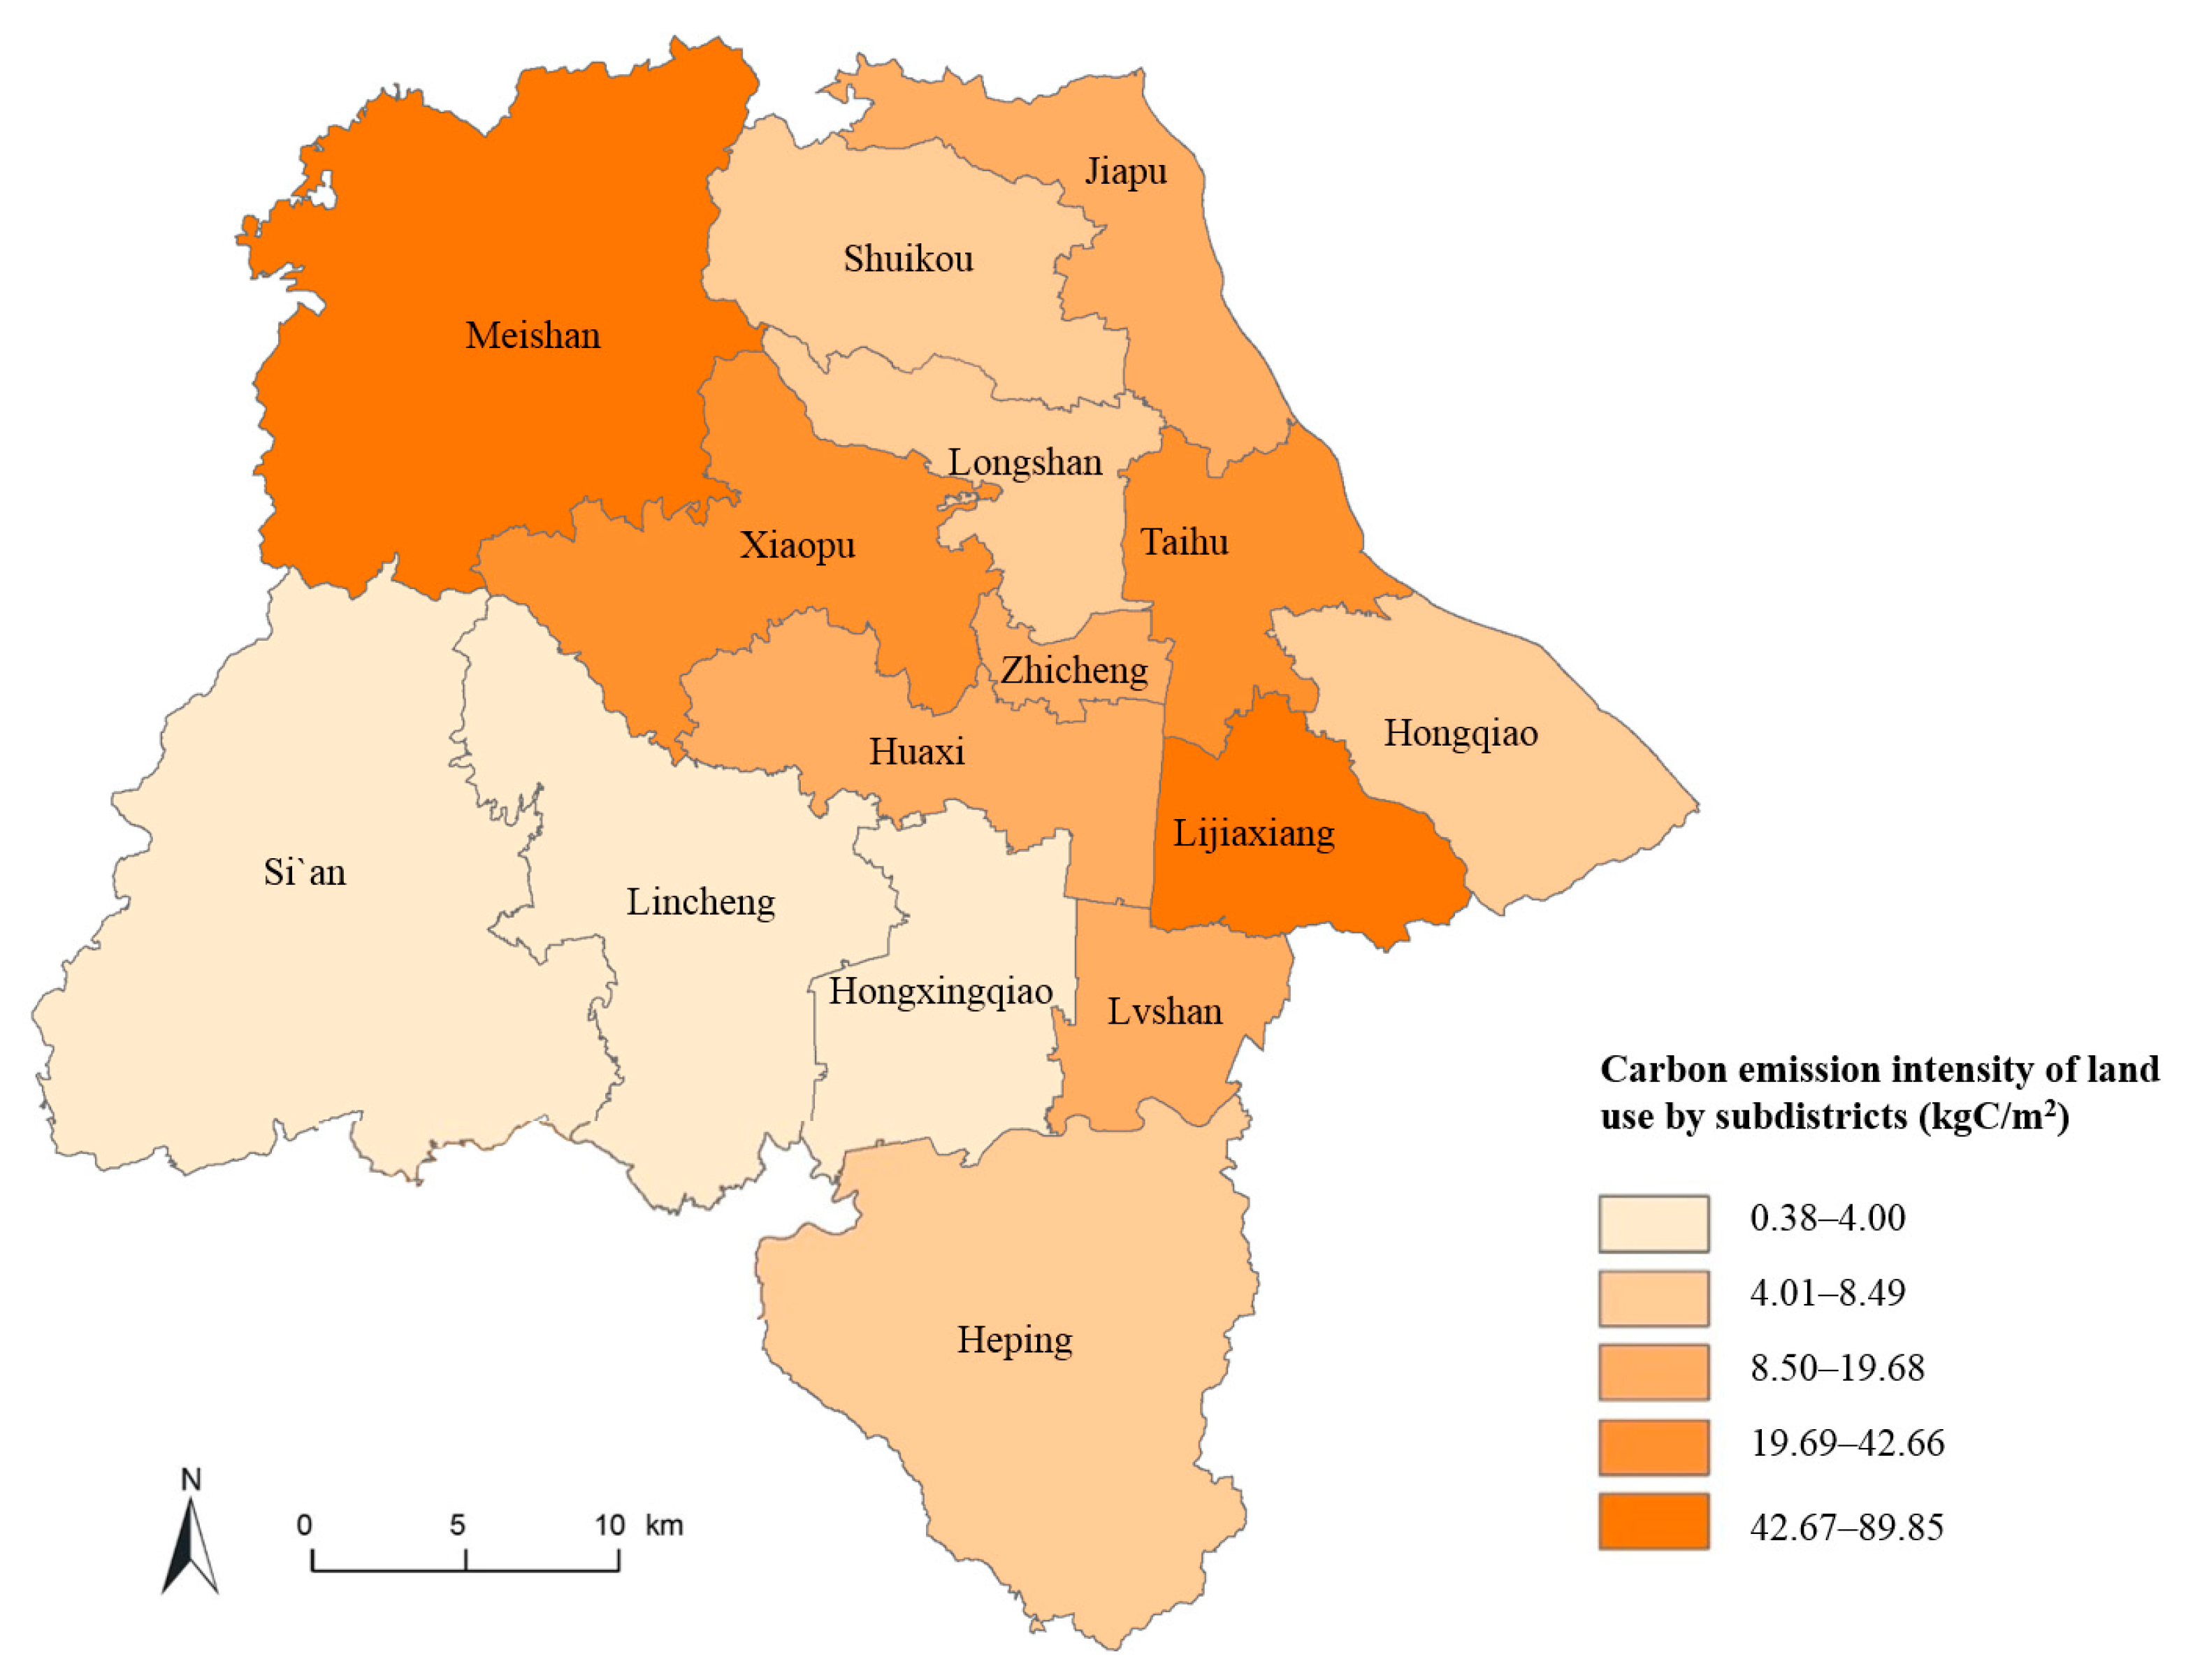
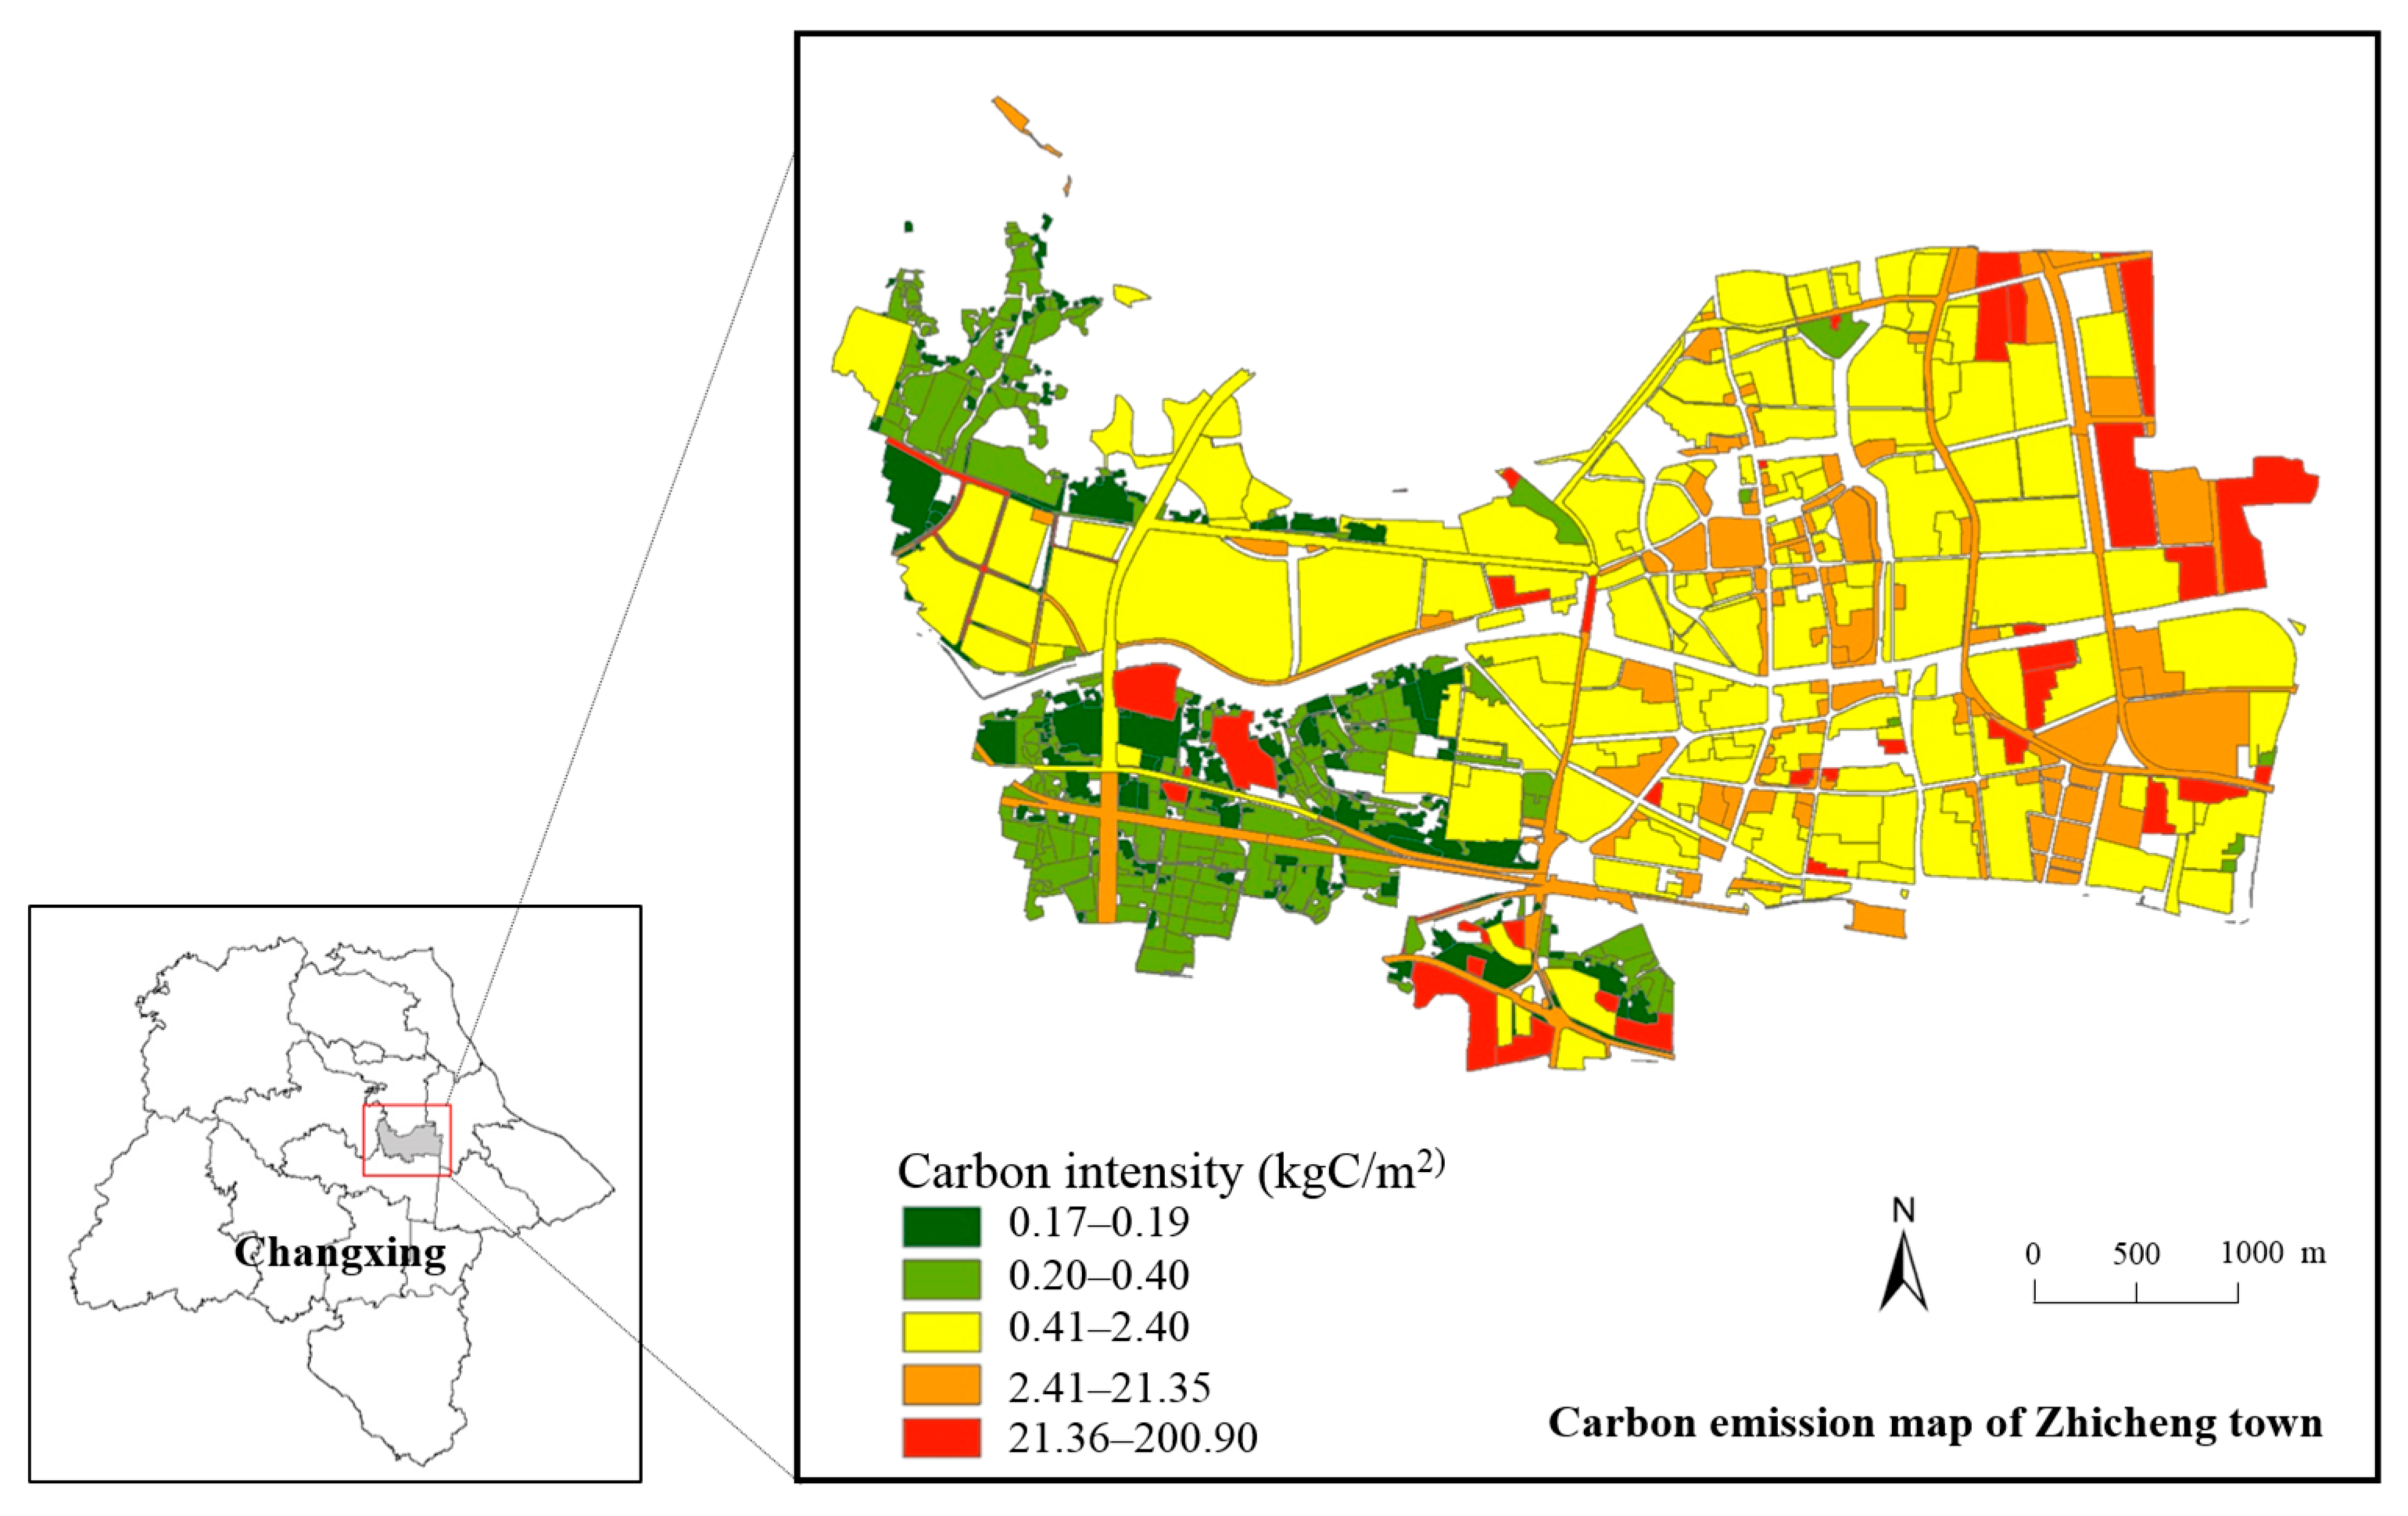
4.1. Application of the Map at the City Scale and Land Patch Scale
4.2. Limitations and Further Improvements
5. Conclusions
Supplementary Materials
Author Contributions
Funding
Acknowledgments
Conflicts of Interest
Appendix A

| GHG Emission Sectors | CO2 (104t) | CH4 (104t) | N2O (104t) | Total Carbon Emissions (104t Carbon Dioxide Equivalence) |
|---|---|---|---|---|
| Energy consumption | 1570.81 | 0.08 | 0.03 | 1581.52 |
| 1. Fossil fuels | 1570.81 | 0.005 | 0.03 | 1579.45 |
| Electric industries | 1052.43 | 0 | 0.02 | 1059.45 |
| Manufacturing industries | 430.39 | 0 | 0 | 430.39 |
| Commerce | 4.53 | 0 | 0 | 4.53 |
| Residential life | 4.28 | 0 | 0 | 4.28 |
| Traffic emission | 78.95 | 0.005 | 0.004 | 80.37 |
| Agriculture | 0.22 | 0 | 0 | 0.22 |
| 2. Biomass combustion | 0 | 0.02 | 0.002 | 1.01 |
| 3. Gas escape | 0 | 0.05 | 0 | 1.06 |
| Industrial process | 578.89 | 0 | 0 | 578.89 |
| Cement industry | 538.23 | 0 | 0 | 538.23 |
| Lime industry | 40.66 | 0 | 0 | 40.66 |
| Agriculture activities | 0 | 0.5537 | 0.0367 | 22.99 |
| Paddy rice | 0 | 0.43 | 0 | 9.08 |
| Fertilizer use | 0 | 0 | 0.03 | 10.47 |
| Enteric fermentation | 0 | 0.10 | 0 | 2.04 |
| Manure management | 0 | 0.02 | 0.003 | 1.40 |
| Waste disposal | 6.69 | 0.33 | 0.002 | 14.29 |
| Land use change and forestry | −8.42 | 0.0031 | 0.000043 | −8.35 |
| Total | 2147.95 | 0.41 | 0.03 | 2189.34 |
| GHG Emission Types | Carbon Emissions (Carbon Dioxide Equivalence) | Percentage |
|---|---|---|
| CO2 | 2147.95 | 98.11% |
| CH4 | 20.2 | 0.92% |
| N2O | 21.19 | 0.97% |
| Total | 2189.34 | 100.00% |
References
- Bulkeley, H. A changing climate for spatial planning. Plan. Theory Pract. 2006, 7, 203–214. [Google Scholar] [CrossRef]
- Marcotullio, P.J.; Sarzynski, A.; Albrecht, J.; Schulz, N.; Garcia, J. Assessing Urban Greenhouse Gas Emissions in European Medium and Large Cities: Methodological Considerations. In Sustainable Cities: Assessing the Performance and Practice of Urban Environments; I.B. Tauris & Co. Ltd.: London, UK, 2016; pp. 83–101. [Google Scholar]
- Khan, F.; Pinter, L. Scaling indicator and planning plane: An indicator and a visual tool for exploring the relationship between urban form, energy efficiency and carbon emissions. Ecol. Indic. 2016, 7, 183–192. [Google Scholar] [CrossRef]
- Wang, S.H.; Huang, S.L.; Huang, P.J. Can spatial planning really mitigate carbon dioxide emissions in urban areas? A case study in Taipei, Taiwan. Landsc. Urban Plan. 2018, 1696, 22–36. [Google Scholar] [CrossRef]
- Hargreaves, A.; Cheng, V.; Deshmukh, S.; Leach, M.; Steemers, K. Forecasting how residential urban form affects the regional carbon savings and costs of retrofitting and decentralized energy supply. Appl. Energy 2017, 186, 549–561. [Google Scholar] [CrossRef]
- Zhao, J.; Thinh, N.X.; Li, C. Investigation of the impacts of urban land use patterns on energy consumption in China: A case study of 20 provincial capital cities. Sustainability 2017, 9, 1383. [Google Scholar] [CrossRef]
- Gately, C.K.; Hutyra, L.R.; Wing, I.S.; Brondfield, M.N. A bottom up approach to on-road CO2 emissions estimates: Improved spatial accuracy and applications for regional planning. Environ. Sci. Technol. 2013, 47, 2423–2430. [Google Scholar] [CrossRef]
- Chuai, X.; Huang, X.; Wang, W.; Zhao, R.; Zhang, M.; Wu, C. Land use, total carbon emissions change and low carbon land management in Coastal Jiangsu, China. J. Clean. Prod. 2015, 103, 77–86. [Google Scholar] [CrossRef]
- Zhang, G.; Ge, R.; Lin, T.; Ye, H.; Li, X.; Huang, N. Spatial apportionment of urban greenhouse gas emission inventory and its implications for urban planning: A case study of Xiamen, China. Ecol. Indic. 2018, 85, 644–656. [Google Scholar] [CrossRef]
- Chang, C.T.; Yang, C.H.; Lin, T.P. Carbon dioxide emissions evaluations and mitigations in the building and traffic sectors in Taichung metropolitan area, Taiwan. J. Clean. Prod. 2019, 230, 1241–1255. [Google Scholar] [CrossRef]
- Geertman, S.; Stillwell, J. Planning support systems: An inventory of current practice. Comput. Environ. Urban Syst. 2004, 28, 291–310. [Google Scholar] [CrossRef]
- Gurney, K.R.; Romero-Lankao, P.; Seto, K.C.; Hutyra, L.R.; Duren, R.; Kennedy, C.; Grimm, N.B.; Ehleringer, J.R.; Marcotullio, P.; Hughes, S.; et al. Climate change: Track urban emissions on a human scale. Nature 2015, 525, 179–181. [Google Scholar] [CrossRef]
- Yamagata, Y.; Yoshida, T.; Murakami, D.; Matsui, T.; Akiyama, Y. Seasonal urban carbon emission estimation using spatial micro Big Data. Sustainability 2018, 10, 4472. [Google Scholar] [CrossRef]
- Laine, J.; Heinonen, J.; Junnila, S. Pathways to carbon-neutral cities prior to a national policy. Sustainability 2020, 12, 2445. [Google Scholar] [CrossRef]
- Wang, G.; Han, Q.; de Vries, B. A geographic carbon emission estimating framework on the city scale. J. Clean. Prod. 2020, 244, 1187963. [Google Scholar] [CrossRef]
- Muntean, M.; Janssens-Maenhout, G.; Song, S.; Selin, N.E.; Olivier, J.G.J.; Guizzardi, D.; Maas, R.; Dentener, F. Trend analysis from 1970 to 2008 and model evaluation of EDGARv4 global gridded anthropogenic mercury emissions. Sci. Total Environ. 2014, 494, 337–350. [Google Scholar] [CrossRef]
- Sharifi, A.; Wu, Y.; Khamchiangta, D.; Yoshida, T.; Yamagata, Y. Urban carbon mapping: Towards a standardized framework. Energy Procedia 2018, 152, 799–808. [Google Scholar] [CrossRef]
- Wu, Y.; Sharifi, A.; Yang, P.; Borjigin, H.; Murakami, D.; Yamagata, Y. Mapping building carbon emissions within local climate zones in Shanghai. Energy Procedia 2018, 152, 815–822. [Google Scholar] [CrossRef]
- Horabik, J.; Nahorski, Z. Improving resolution of a spatial air pollution inventory with a statistical inference approach. Clim. Chang. 2014. [Google Scholar] [CrossRef]
- Wang, J.; Cai, B.; Zhang, L.; Cao, D.; Liu, L.; Zhou, Y.; Zhang, Z.; Xue, W. High resolution carbon dioxide emission gridded data for China derived from point sources. Environ. Sci. Technol. 2014, 48, 7085–7093. [Google Scholar] [CrossRef]
- Andres, R.J.; Boden, T.A.; Higdon, D.M. Gridded uncertainty in fossil fuel carbon dioxide emission maps, a CDIAC example. Atmos. Chem. Phys. 2016, 16. [Google Scholar] [CrossRef]
- Andres, R.J.; Marland, G.; Fung, I.; Matthews, E. A 1°× 1°distribution of carbon dioxide emissions from fossil fuel consumption and cement manufacture, 1950–1990. Glob. Biogeochem. Cycles 1996, 10, 419–429. [Google Scholar] [CrossRef]
- Doll, C.N.H.; Muller, J.P.; Elvidge, C.D. Night-time imagery as a tool for global mapping of socioeconomic parameters and greenhouse gas emissions. Ambio 2000, 29, 157–162. [Google Scholar] [CrossRef]
- Ghosh, T.; Elvidge, C.D.; Sutton, P.C.; Baugh, K.E.; Ziskin, D.; Tuttle, B.T. Creating a global grid of distributed fossil fuel CO2 emissions from nighttime satellite imagery. Energies 2010, 3, 1895–1913. [Google Scholar] [CrossRef]
- Oda, T.; Maksyutov, S. A very high-resolution (1km × 1 km) global fossil fuel CO2 emission inventory derived using a point source database and satellite observations of nighttime lights. Atmos. Chem. Phys. 2011, 11, 543. [Google Scholar] [CrossRef]
- Wang, Y. Multi-scale spatial allocation method of Chinese fossil fuel carbon dioxide emission statistics data. Cent. China Norm. Univ. China 2017, 3, 20–27. (In Chinese) [Google Scholar]
- Olivier, J.G.J.; Van Aardenne, J.A.; Dentener, F.J.; Pagliari, V.; Ganzeveld, L.N.; Peters, J.A.H.W. Recent trends in global greenhouse gas emissions:regional trends 1970–2000 and spatial distributionof key sources in 2000. Environ. Sci. 2005, 2, 81–99. [Google Scholar] [CrossRef]
- Bun, R.; Nahorski, Z.; Horabik-Pyzel, J.; Danylo, O.; See, L.; Charkovska, N.; Topylko, P.; Halushchak, M.; Lesiv, M.; Valakh, M.; et al. Development of a high-resolution spatial inventory of greenhouse gas emissions for Poland from stationary and mobile sources. Mitig. Adapt. Strateg. Glob. Chang. 2019, 24, 853–880. [Google Scholar] [CrossRef]
- Wang, R.; Tao, S.; Ciais, P.; Shen, H.Z.; Huang, Y.; Chen, H.; Shen, G.F.; Wang, B.; Li, W.; Zhang, Y.Y.; et al. High-resolution mapping of combustion processes and implications for CO2 emissions. Atmos. Chem. Phys. 2013, 13, 5189–5203. [Google Scholar] [CrossRef]
- Heiple, S.; Sailor, D.J. Using building energy simulation and geospatial modeling techniques to determine high resolution building sector energy consumption profiles. Energy Build. 2008, 40, 1426–1436. [Google Scholar] [CrossRef]
- Cai, B.; Li, W.; Dhakal, S.; Wang, J. Source data supported high resolution carbon emissions inventory for urban areas of the Beijing-Tianjin-Hebei region: Spatial patterns, decomposition and policy implications. J. Environ. Manag. 2018, 206, 786–799. [Google Scholar] [CrossRef]
- Chuai, X.; Feng, J. High resolution carbon emissions simulation and spatial heterogeneity analysis based on big data in Nanjing City, China. Sci. Total Environ. 2019, 686, 828–837. [Google Scholar] [CrossRef]
- Lorenzo-Sáez, E.; Oliver-Villanueva, J.V.; Coll-Aliaga, E.; Lemus-Zúñiga, L.G.; Lerma-Arce, V.; Reig-Fabado, A. Energy efficiency and GHG emissions mapping of buildings for decision-making processes against climate change at the local level. Sustainability 2020, 12, 2982. [Google Scholar] [CrossRef]
- Akiyama, Y. Applications of micro geodata for urban monitoring. In Proceedings of the 16th International Conference on Geographic Information Systems: Spatial Big Data Technologies and Applications for Future Society, Soul, Korea, 16 August 2014; pp. 103–116. [Google Scholar]
- Akiyama, Y.; Nishimoto, Y.; Shibasaki, R. Projecting future distributions of facility deserts for smart regionalplanning: A micro geodata approach in Japan. In Proceedings of the 15th International Conference on Computers in Urban Planning and Urban Management, Adelaide, Australia, 11–14 July 2017; p. 35081. [Google Scholar]
- Dai, S.; Zuo, S.; Ren, Y. A spatial database of CO2 emissions, urban form fragmentation and city-scale effect related impact factors for the low carbon urban system in Jinjiang city, China. Data Br. 2020, 29, 105274. [Google Scholar] [CrossRef]
- Yamagata, Y.; Murakami, D.; Yoshida, T. Urban carbon mapping with spatial Big Data. Energy Procedia 2017, 142, 2461–2466. [Google Scholar] [CrossRef]
- Liu, C.; Wang, T. Identifying and mapping local contributions of carbon emissions from urban motor and metro transports: A weighted multiproxy allocating approach. Comput. Environ. Urban Syst. 2017, 64, 132–143. [Google Scholar] [CrossRef]
- Makido, Y.; Yamagata, Y.; Dhakal, S. Effect of urban forms: Towards the reduction of CO2 emissions. In Proceedings of the American Society for Photogrammetry and Remote Sensing Annual Conference 2010: Opportunities for Emerging Geospatial Technologies, Reno, NV, USA, 23–24 February 2010. [Google Scholar]
- Ma, J.; Liu, Z.; Chai, Y. The impact of urban form on CO2 emission from work and non-work trips: The case of Beijing, China. Habitat Int. 2015, 47, 1–10. [Google Scholar] [CrossRef]
- Fang, C.; Wang, S.; Li, G. Changing urban forms and carbon dioxide emissions in China: A case study of 30 provincial capital cities. Appl. Energy 2015, 158, 519–531. [Google Scholar] [CrossRef]
- China County Economic Development Report (2017); Guangdong Economic Publishing House: Guangdong, China, 2017.
- Xu, S. Carbon Accounting and Space Distribution for the Cities in China-a Case of Nanjing City; Nanjing University: Nanjing, China, 2011; pp. 37–44. (In Chinese) [Google Scholar]
- Tang, X.; Hutyra, L.R.; Arévalo, P.; Baccini, A.; Woodcock, C.E.; Olofsson, P. Spatiotemporal tracking of carbon emissions and uptake using time series analysis of Landsat data: A spatially explicit carbon bookkeeping model. Sci. Total Environ. 2020, 720, 1374096. [Google Scholar] [CrossRef]
- ED. Available online: http://www.trustexporter.com/changxing/ (accessed on 9 May 2017).
- Jing, Y. Carbon Accounting and Spatial Distribution in Nanning Metropolitan Region Based on Land Cover; Guangxi University: Guangxi, China, 2015; pp. 64–65. (In Chinese) [Google Scholar]
- Wang, Y.; Zhao, P. Survey Research on Residential Building Energy Consumption in Urban and Rural Area of China. Beijing Daxue Xuebao (Ziran Kexue Ban)/Acta Sci. Nat. Univ. Pekin. 2018, 1, 162–170. [Google Scholar] [CrossRef]
- Standard for Energy Consumption of Building (GB/T 51161-2016). Available online: http://www.jianbiaoku.com/webarbs/book/87540/2707023.shtml (accessed on 1 December 2020).
- Current Land Use Classification (GB/T 21010-2017). Available online: http://www.tdzyw.com/2017/1113/45597.html (accessed on 1 December 2020).
- Code for Classification of Urban Land Use and Planning Standards of Development LAND (GB/T 50137-2011). Available online: http://max.book118.com/html/2017/0407/99167799.shtm (accessed on 1 December 2020).
- Carbon Dioxide Information Analysis Center (CDIAC). Available online: http://cdiac.ornl.gov/ (accessed on 14 October 2018).
- Abeydeera, L.H.U.W.; Mesthrige, J.W.; Samarasinghalage, T.I. Global research on carbon emissions: A scientometric review. Sustainability 2019, 11, 3972. [Google Scholar] [CrossRef]
- Peters, G.P. Carbon footprints and embodied carbon at multiple scales. Curr. Opin. Environ. Sustain. 2010, 2, 245–250. [Google Scholar] [CrossRef]
- Yang, J.; Zhan, Y.; Xiao, X.; Xia, J.C.; Sun, W.; Li, X. Investigating the diversity of land surface temperature characteristics in different scale cities based on local climate zones. Urban Clim. 2020, 34, 100700. [Google Scholar] [CrossRef]
- Ewing, R.; Rong, F. The impact of urban form on U.S. residential energy use. Hous. Policy Debate 2008, 19, 1–30. [Google Scholar] [CrossRef]
- Qin, B.; Qi, B. The Impact of Urban Form on Household Building Carbon Emission: A Case Study of Beijing. Urban Plan. Int. 2013, 28, 42–46. [Google Scholar]
- Yang, J.; Su, J.; Xia, J.C.; Jin, C.; Li, X.; Ge, Q. The Impact of Spatial Form of Urban Architecture on the Urban Thermal Environment: A Case Study of the Zhongshan District, Dalian. IEEE J. Sel. Top. Appl. Earth Obs. Remote Sens. 2018, 11, 2709–2716. [Google Scholar] [CrossRef]
- Qiao, Z.; Tian, G.; Xiao, L. Diurnal and seasonal impacts of urbanization on the urban thermal environment: A case study of Beijing using MODIS data. ISPRS J. Photogramm. Remote Sens. 2013, 85, 93–101. [Google Scholar] [CrossRef]
- Yang, J.; Jin, S.; Xiao, X.; Jin, C.; Xia, J.; Li, X.; Wang, S. Local climate zone ventilation and urban land surface temperatures: Towards a performance-based and wind-sensitive planning proposal in megacities. Sustain. Cities Soc. 2019, 47, 101487. [Google Scholar] [CrossRef]
- Qiao, Z.; Liu, L.; Qin, Y.; Xu, X.; Wang, B.; Liu, Z. The impact of urban renewal on land surface temperature changes: A case study in the main city of Guangzhou, China. Remote Sens. 2020, 12, 794. [Google Scholar] [CrossRef]


| Road Grade | National Road | Provincial Road | County Road | Township Road | Village Road | Urban Main Road | Urban Secondary Road | Urban Branch Road |
|---|---|---|---|---|---|---|---|---|
| Traffic Flow (Standard vehicles per hour) | 4500 | 1500 | 1000 | 1100 | 500 | 2800 | 2600 | 1100 |
| Building Types | Reference Values of Energy Consumption | Data Sources |
|---|---|---|
| Urban housing | 2848.53 kWh/household | The reference values of household energy consumption [47] |
| Rural housing | 2160.36 kWh/household | |
| Commercial Office | 70 kWh/m2 | The standard for the energy consumption of building (GB/T 51161-2016). China. 2016. [48] |
| Hotel | 115 kWh/m2 | |
| Shopping mall | 130 kWh/m2 | |
| Public office | 55 kWh/m2 |
| Raw Data | Sources | Data Type |
|---|---|---|
| Land use map of Changxing county in 2017 | Planning Bureau of Changxing | Vector |
| Topographic map of Changxing county | Land and Resources Bureau of Changxing | Vector |
| Industrial POI data | Baidu Map, X-geocoding | Vector |
| Road systems of Changxing county | Transportation Bureau of Changxing | Raster |
| The town-level population of Changxing, including the number of households, urban population, rural population, and total population | Public Security Bureau of Changxing | Statistical |
| Value increased of industrial GDP (10 thousand yuan), energy consumption per industrial increased value (standard coal/10 thousand yuan), emission factors of standard coal (2.773), industrial output data, and industrial energy consumption data | 2018 Changxing Statistical Yearbook, The Development and Reform Commission of Changxing | Statistical |
| Animal stocks data (provided separately by farms and households) | The Agriculture Bureau of Changxing | Statistical |
| GHG Inventory Sector | Source Type | Basic Objects | Corresponding Land Use Types |
|---|---|---|---|
| Energy Consumption | |||
| Electric industries | Point source | 13 POI points of electric industries | Utility land for electric production |
| Manufacturing industries | Point source | 605 POI points of different industries | Industrial and warehouse land |
| Commerce | Area source | Commercial land patches, public administration, and service land patches | Commercial land, public administration, and service land |
| Residential life | Area source | Residential land patches | Urban residential land, Rural settlement |
| Traffic emission | Line source | Road systems | Street and transportation land |
| Industrial Process | |||
| Cement industry | Point source | 8 POI points of cement industries | Industrial and warehouse land |
| Lime industry | Point source | 3 POI points of lime industries | Industrial and warehouse land |
| Agriculture Activities | |||
| Paddy rice | Area source | Arable land patches | Arable land |
| Fertilizer use | Area source | Arable land patches | Arable land |
| Enteric fermentation | Area source | Facility agricultural land patches, rural settlement land patches | Facility agricultural land, Rural settlement |
| Manure management | Area source | Facility agricultural land patches, rural settlement land patches | Facility agricultural land, Rural settlement |
| Method | Allocation Weight | Basic Objects | Map Type | Method Source |
|---|---|---|---|---|
| I | Single-weight: population density | 1 km × 1 km grid | Gridded map | CDIAC [51] |
| II | Multiweight: land area, GDP, population, building area, industry categories, etc. | 300 m × 300 m grid | Gridded map | Chuai et al. [32] |
| III | Single-weight: land use type | Land patches | Vector map | Zhang et al. [9] |
| IV | Multiweight: energy consumption data, land area, population, building area, traffic flow, road length, industry categories, industry output, etc. | P: Industrial POI points L: Road systems A: Land patches | Vector map | P-L-A classified allocation method proposed by this study |
| Land Use Type | Method I | Method II | Method III | Method IV |
|---|---|---|---|---|
| Urban residential land | 27.20% | 23.28% | 3.03% | 3.40% |
| Rural settlement | 12.59% | 11.16% | 0.44% | 0.08% |
| Commercial land | 19.08% | 5.58% | 2.09% | 3.28% |
| Administration and service land | 11.39% | 3.18% | 1.99% | 0.79% |
| Industrial and warehouse land | 4.98% | 17.11% | 82.82% | 82.82% |
| Street and transportation land | 6.04% | 10.48% | 9.26% | 9.26% |
| Arable land | 18.72% | 29.20% | 0.36% | 0.36% |
| Total carbon emissions (kgC) | 180.13 × 10⁶ | 180.13 × 10⁶ | 180.13 × 10⁶ | 180.13 × 10⁶ |
Publisher’s Note: MDPI stays neutral with regard to jurisdictional claims in published maps and institutional affiliations. |
© 2020 by the authors. Licensee MDPI, Basel, Switzerland. This article is an open access article distributed under the terms and conditions of the Creative Commons Attribution (CC BY) license (http://creativecommons.org/licenses/by/4.0/).
Share and Cite
Liu, H.; Yan, F.; Tian, H. A Vector Map of Carbon Emission Based on Point-Line-Area Carbon Emission Classified Allocation Method. Sustainability 2020, 12, 10058. https://doi.org/10.3390/su122310058
Liu H, Yan F, Tian H. A Vector Map of Carbon Emission Based on Point-Line-Area Carbon Emission Classified Allocation Method. Sustainability. 2020; 12(23):10058. https://doi.org/10.3390/su122310058
Chicago/Turabian StyleLiu, Hongjiang, Fengying Yan, and Hua Tian. 2020. "A Vector Map of Carbon Emission Based on Point-Line-Area Carbon Emission Classified Allocation Method" Sustainability 12, no. 23: 10058. https://doi.org/10.3390/su122310058
APA StyleLiu, H., Yan, F., & Tian, H. (2020). A Vector Map of Carbon Emission Based on Point-Line-Area Carbon Emission Classified Allocation Method. Sustainability, 12(23), 10058. https://doi.org/10.3390/su122310058