Impact of Land Use/Cover Changes on Soil Erosion in Western Kenya


Abstract
:1. Introduction
2. Materials and Methods
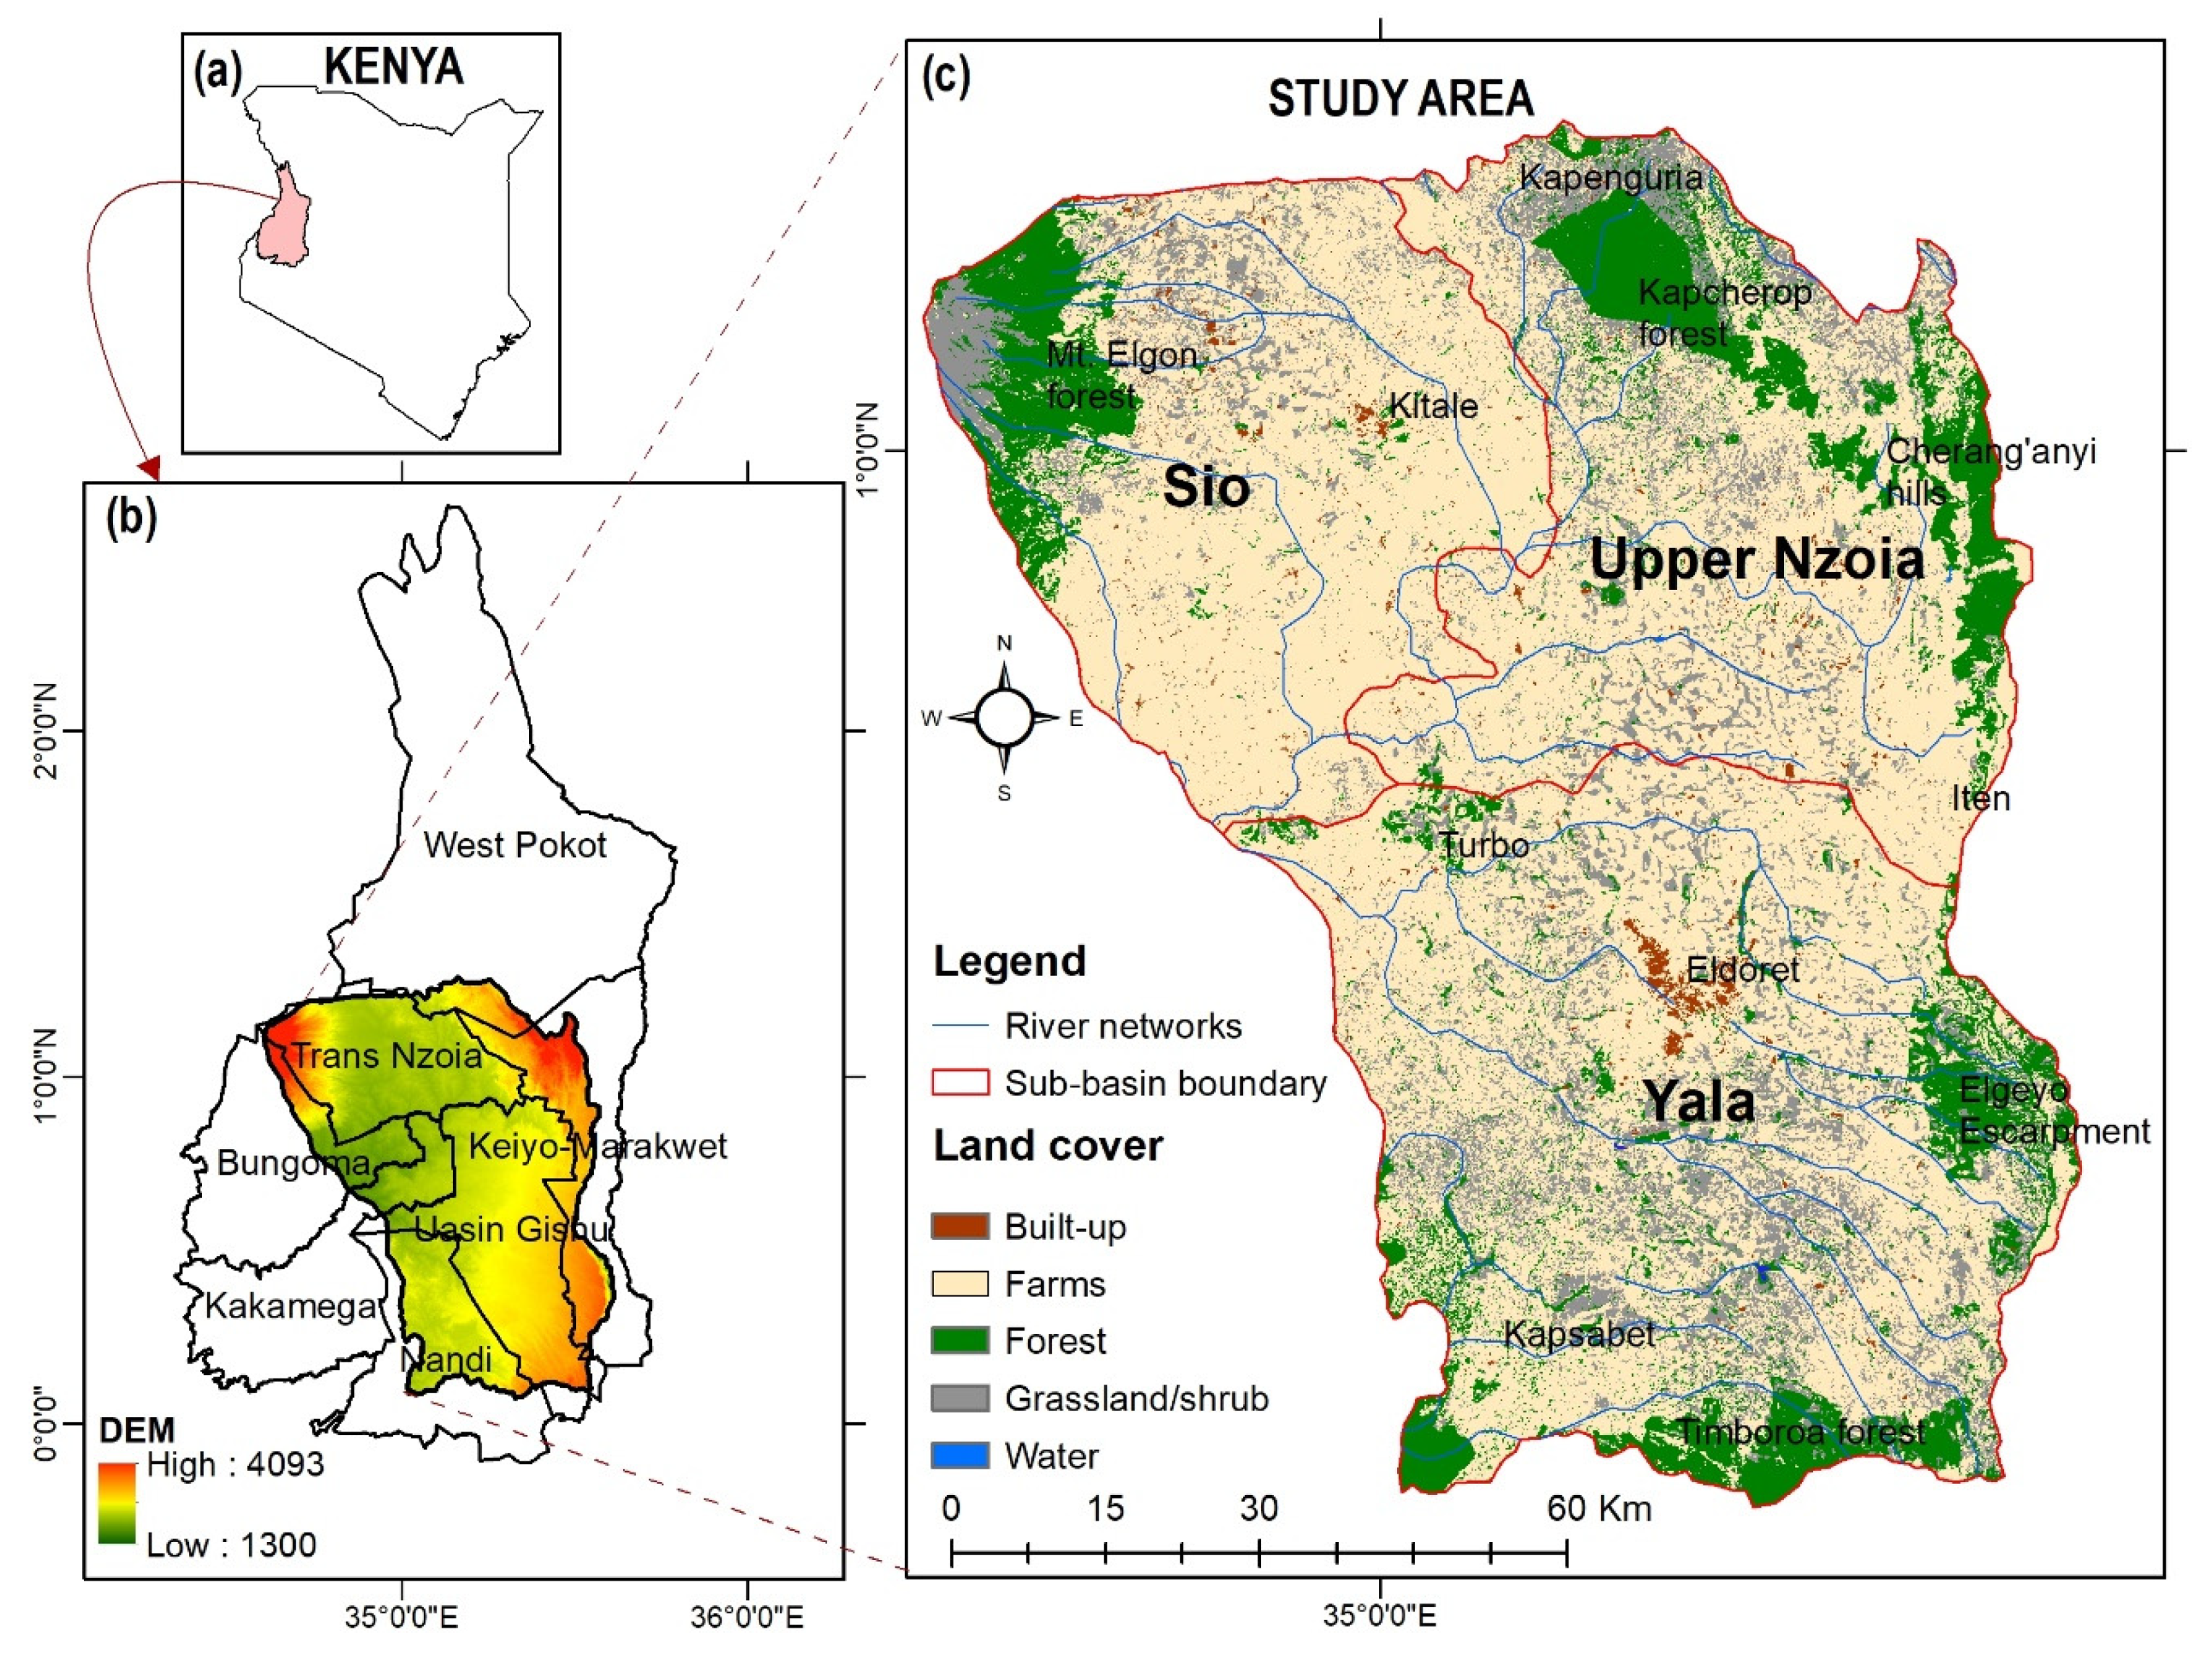
2.1. Study Area
2.2. Methodology
- A = computed amount of the average annual soil loss per unit area (t/ha/y),
- R = Rainfall erosivity factor (MJ mm/ha/h/year),
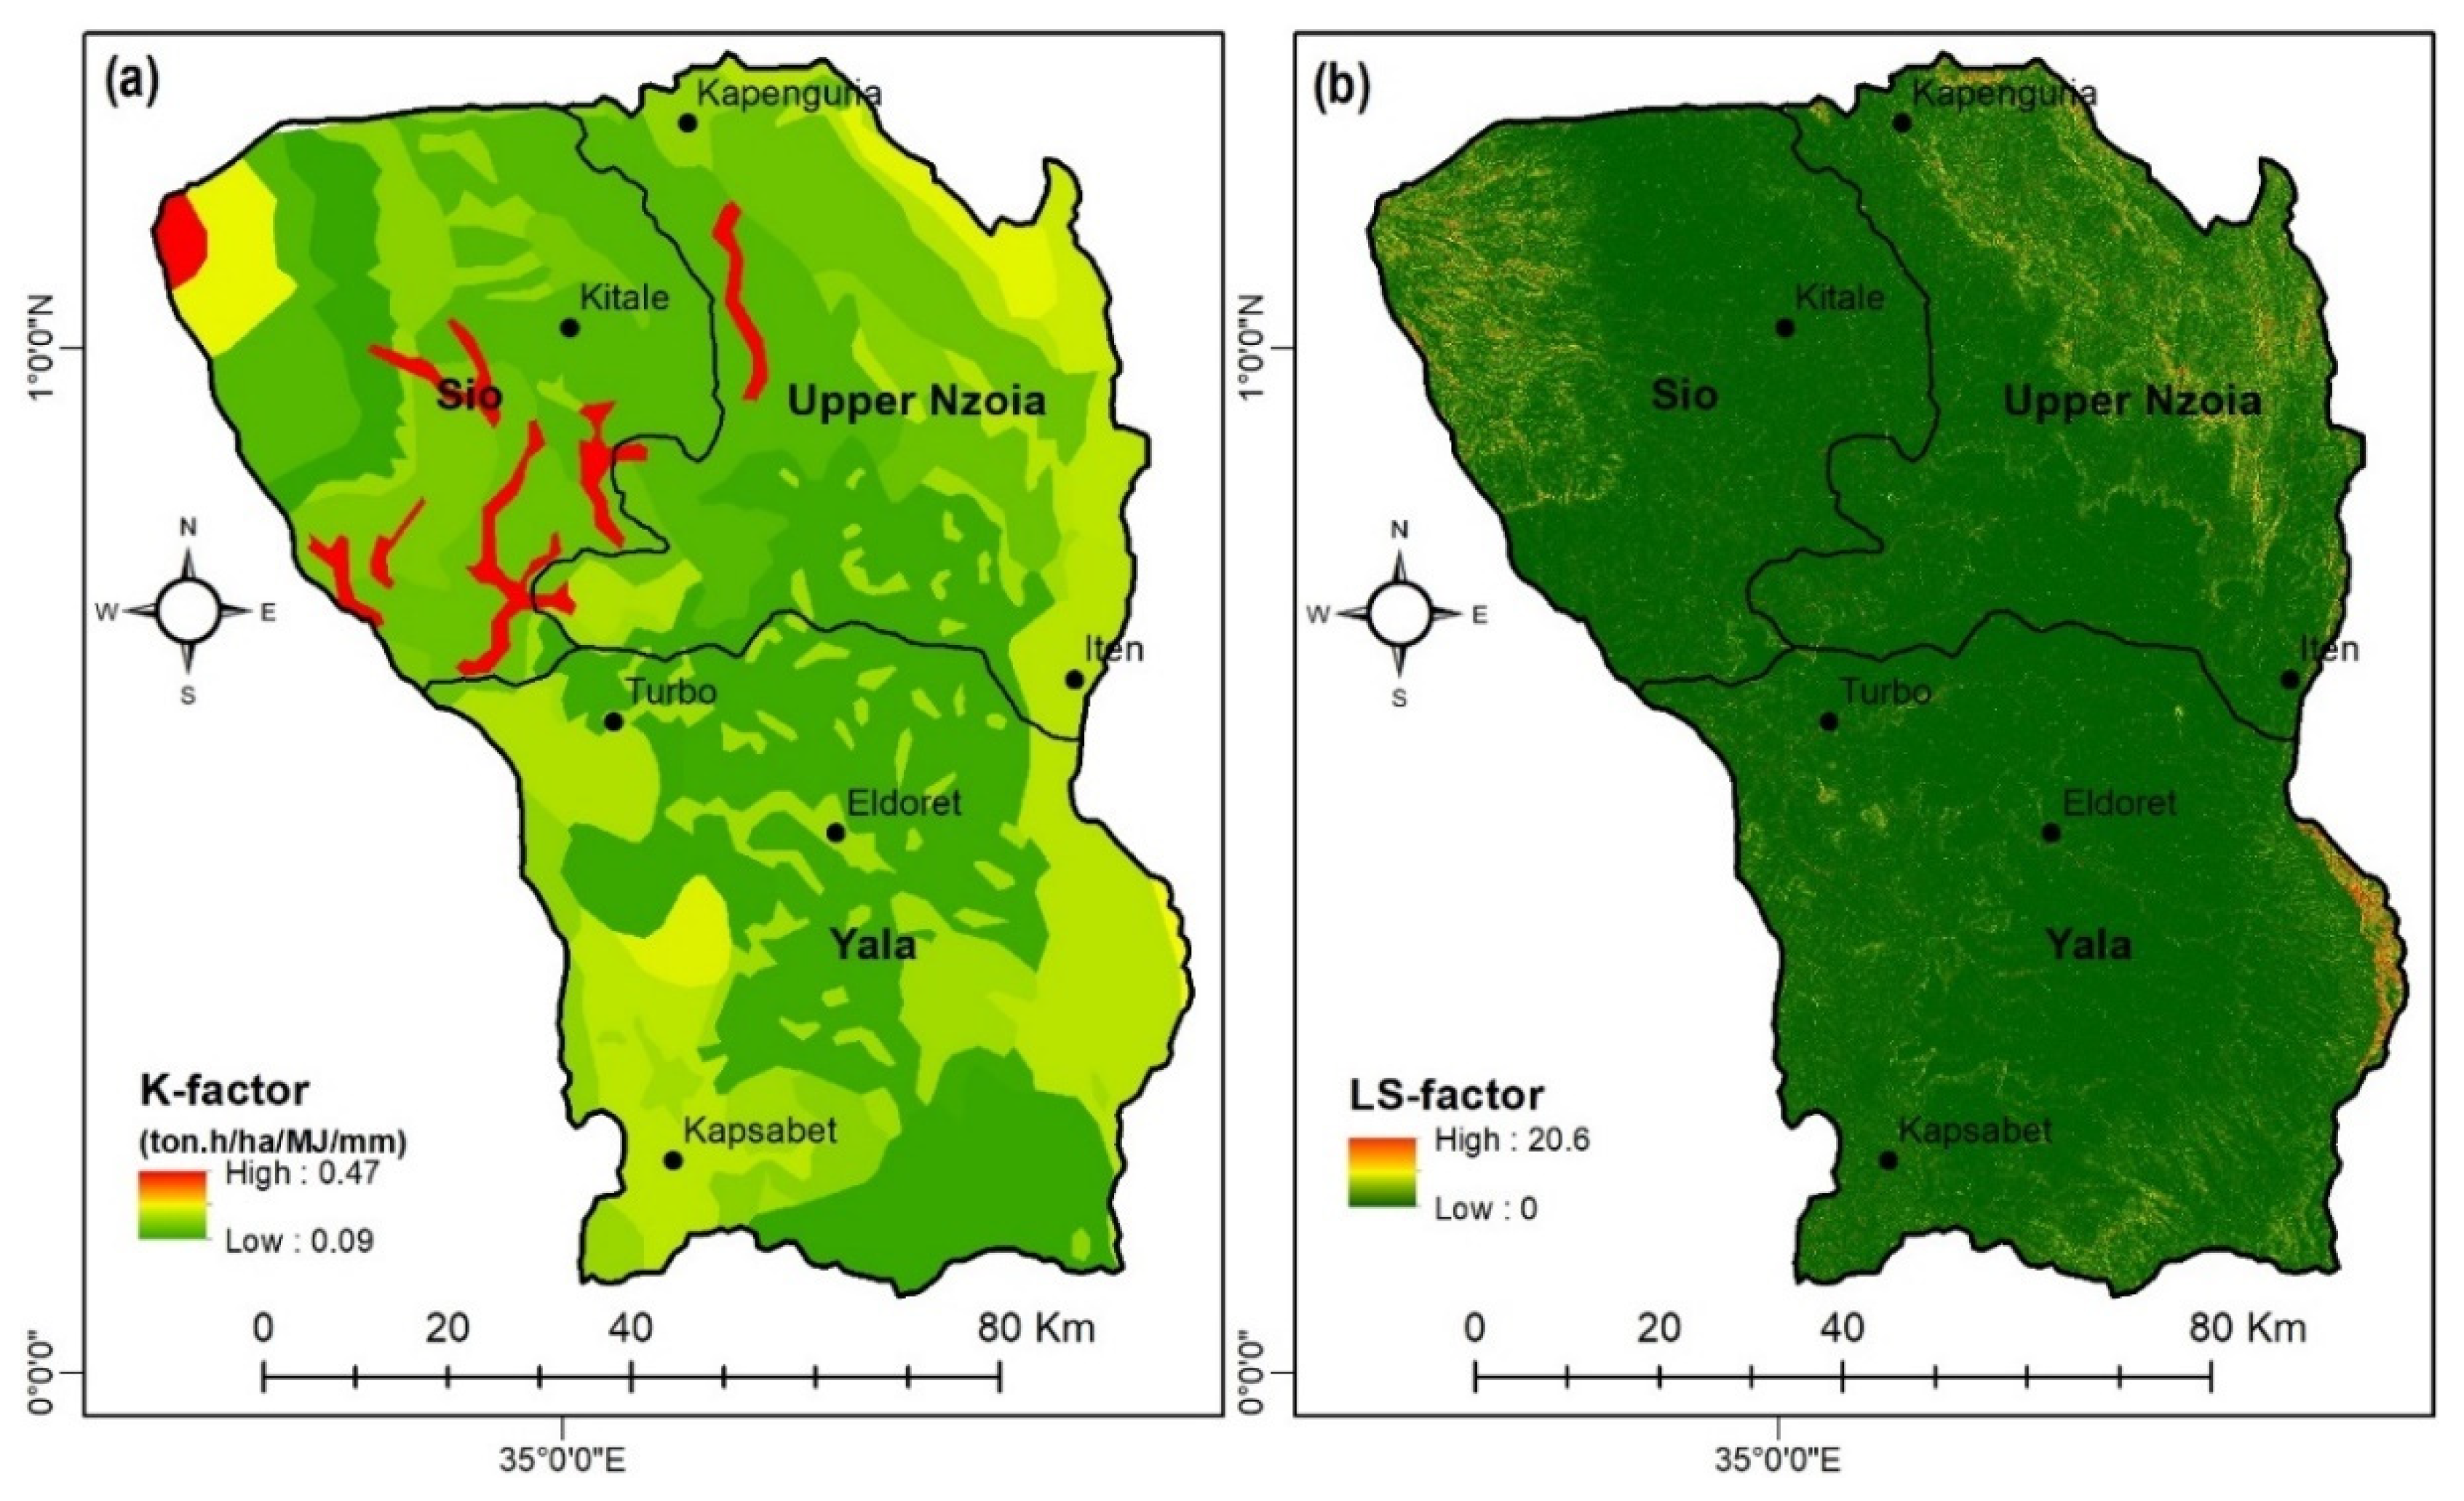
- K = soil erodibility factor (ton h/MJ/mm),
- LS = Slope length and slope steepness factor (dimensionless),
- C = ground cover factor (dimensionless),
- P = soil conservation supporting practice factor (dimensionless).
2.2.1. Determination of Rainfall-Runoff Erosivity Factor (R)
2.2.2. Determination of Soil Erodibility Factor (K)
2.2.3. Determination of Topographic Factor (LS)
2.2.4. Determination of Conservation Practice Factor (P)
2.2.5. Determination of Cover Management Factor (C)
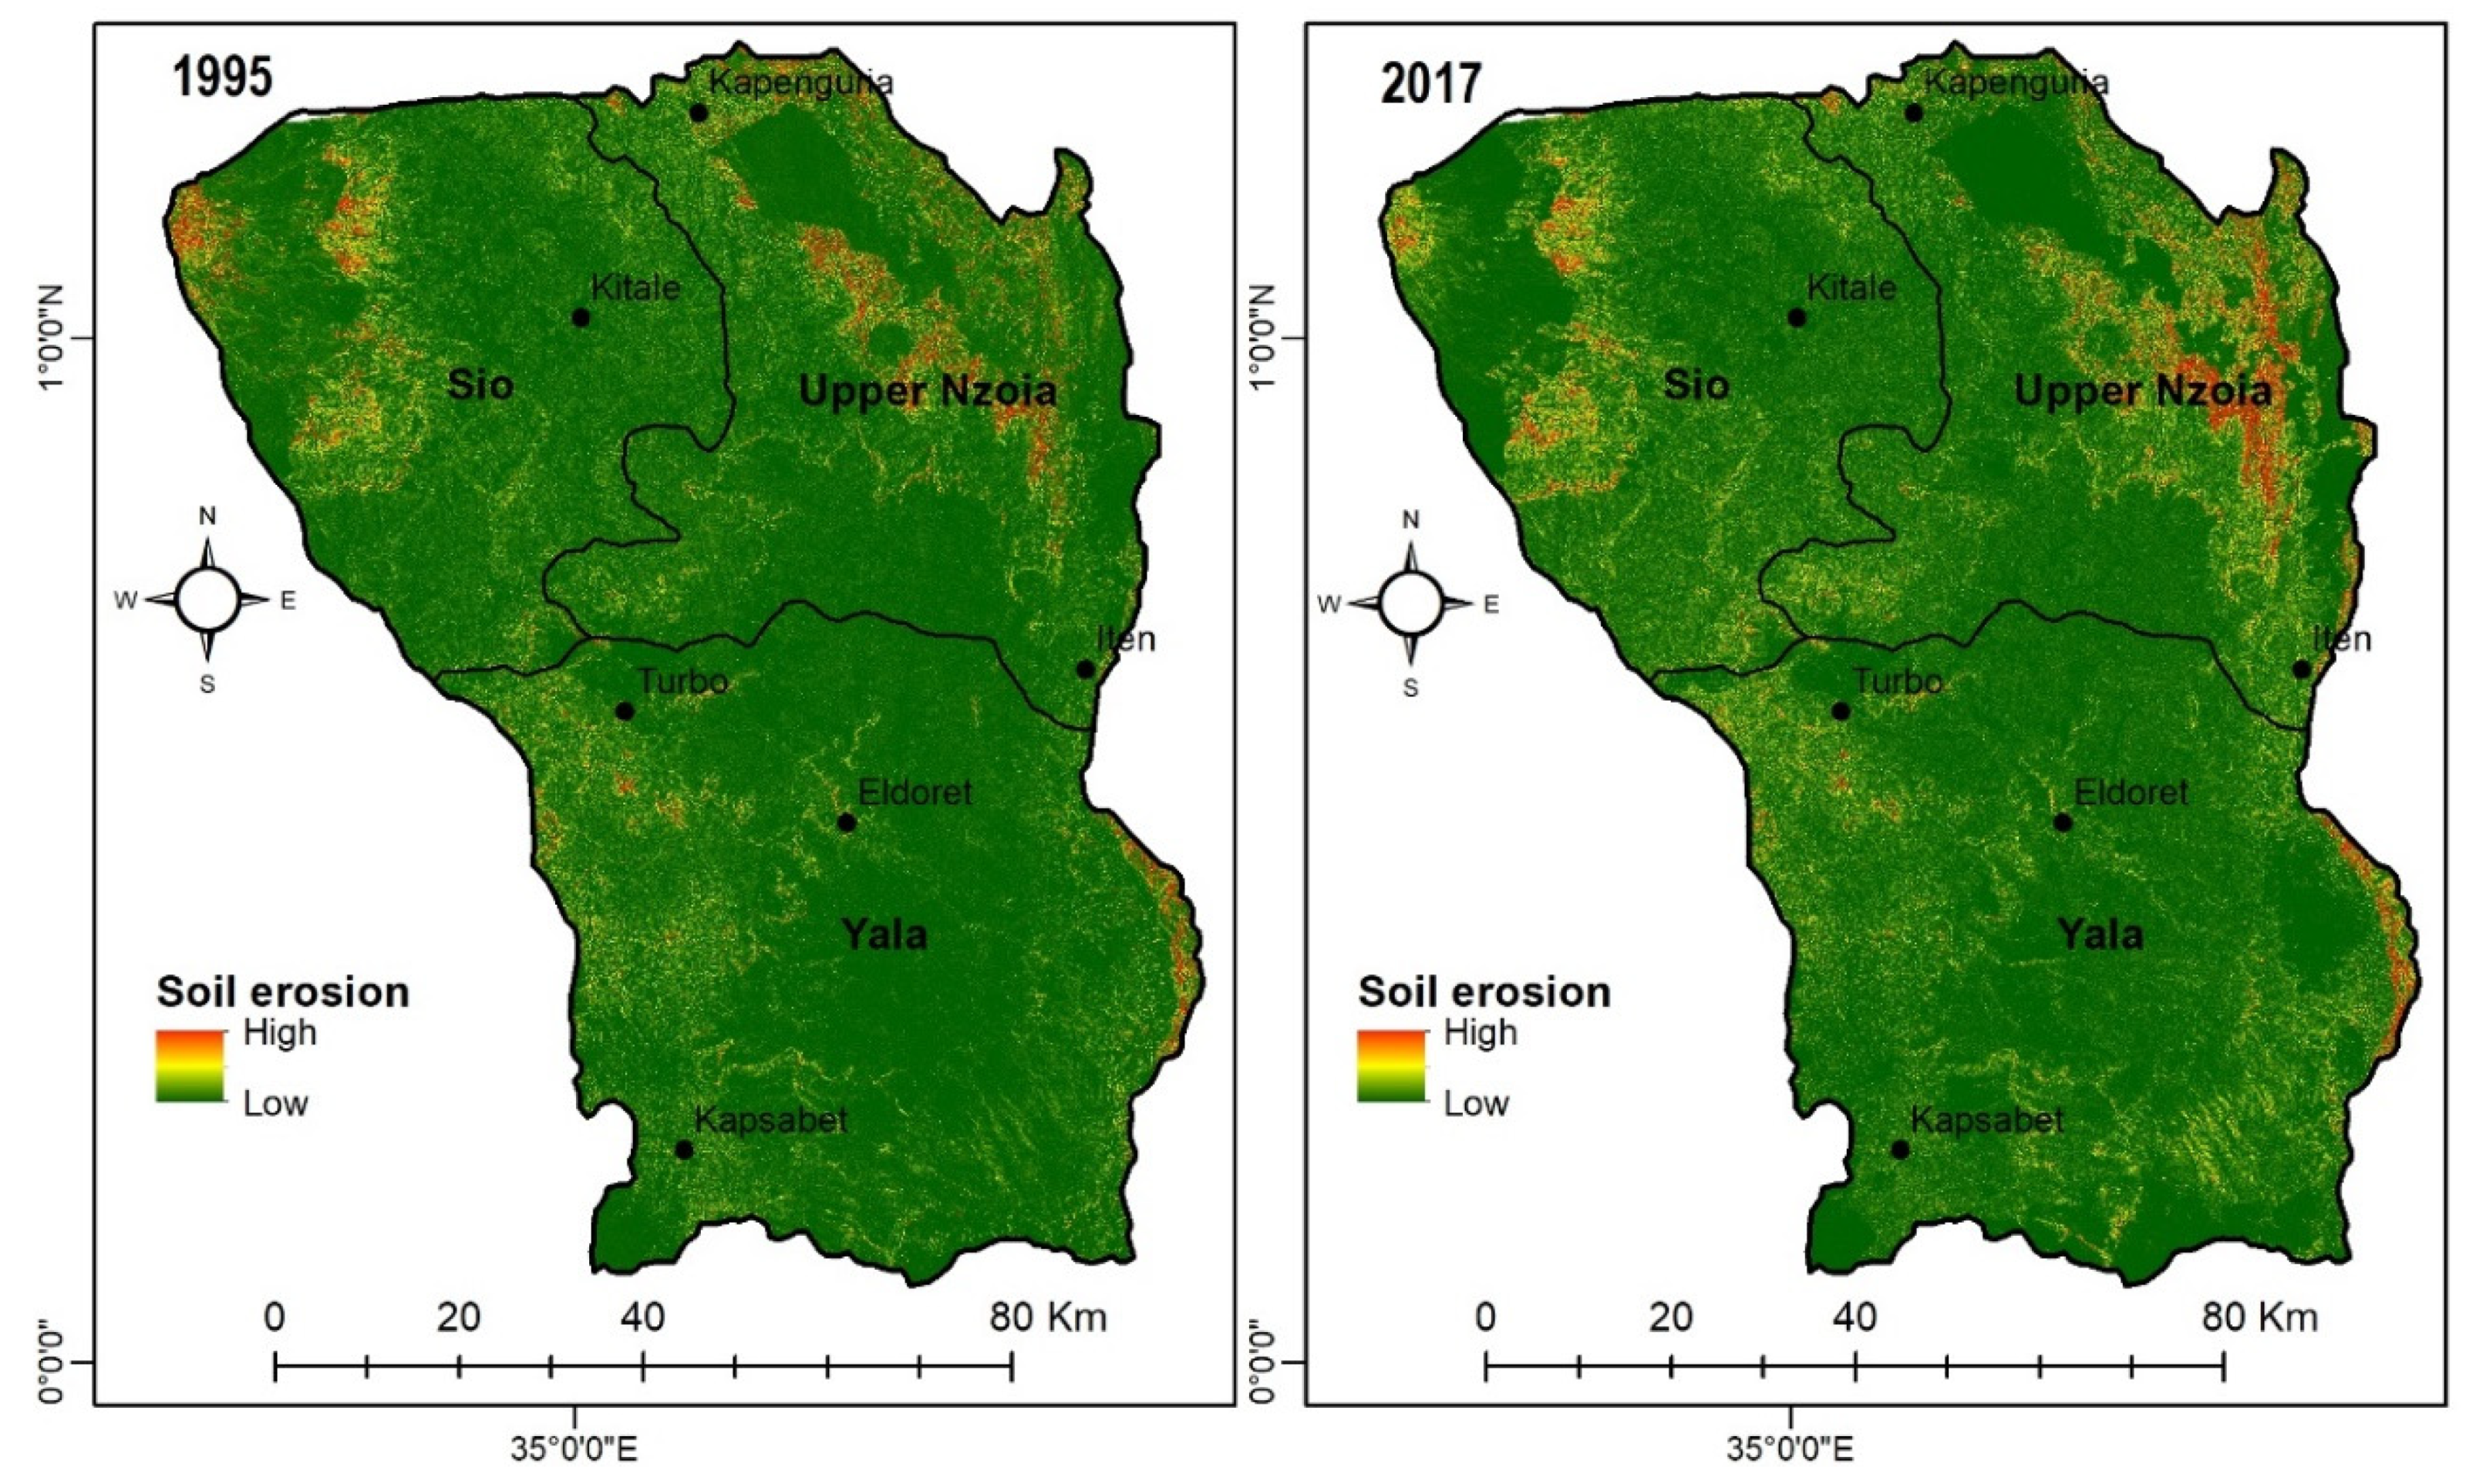
2.2.6. Spatial Distribution of Soil Loss
3. Results
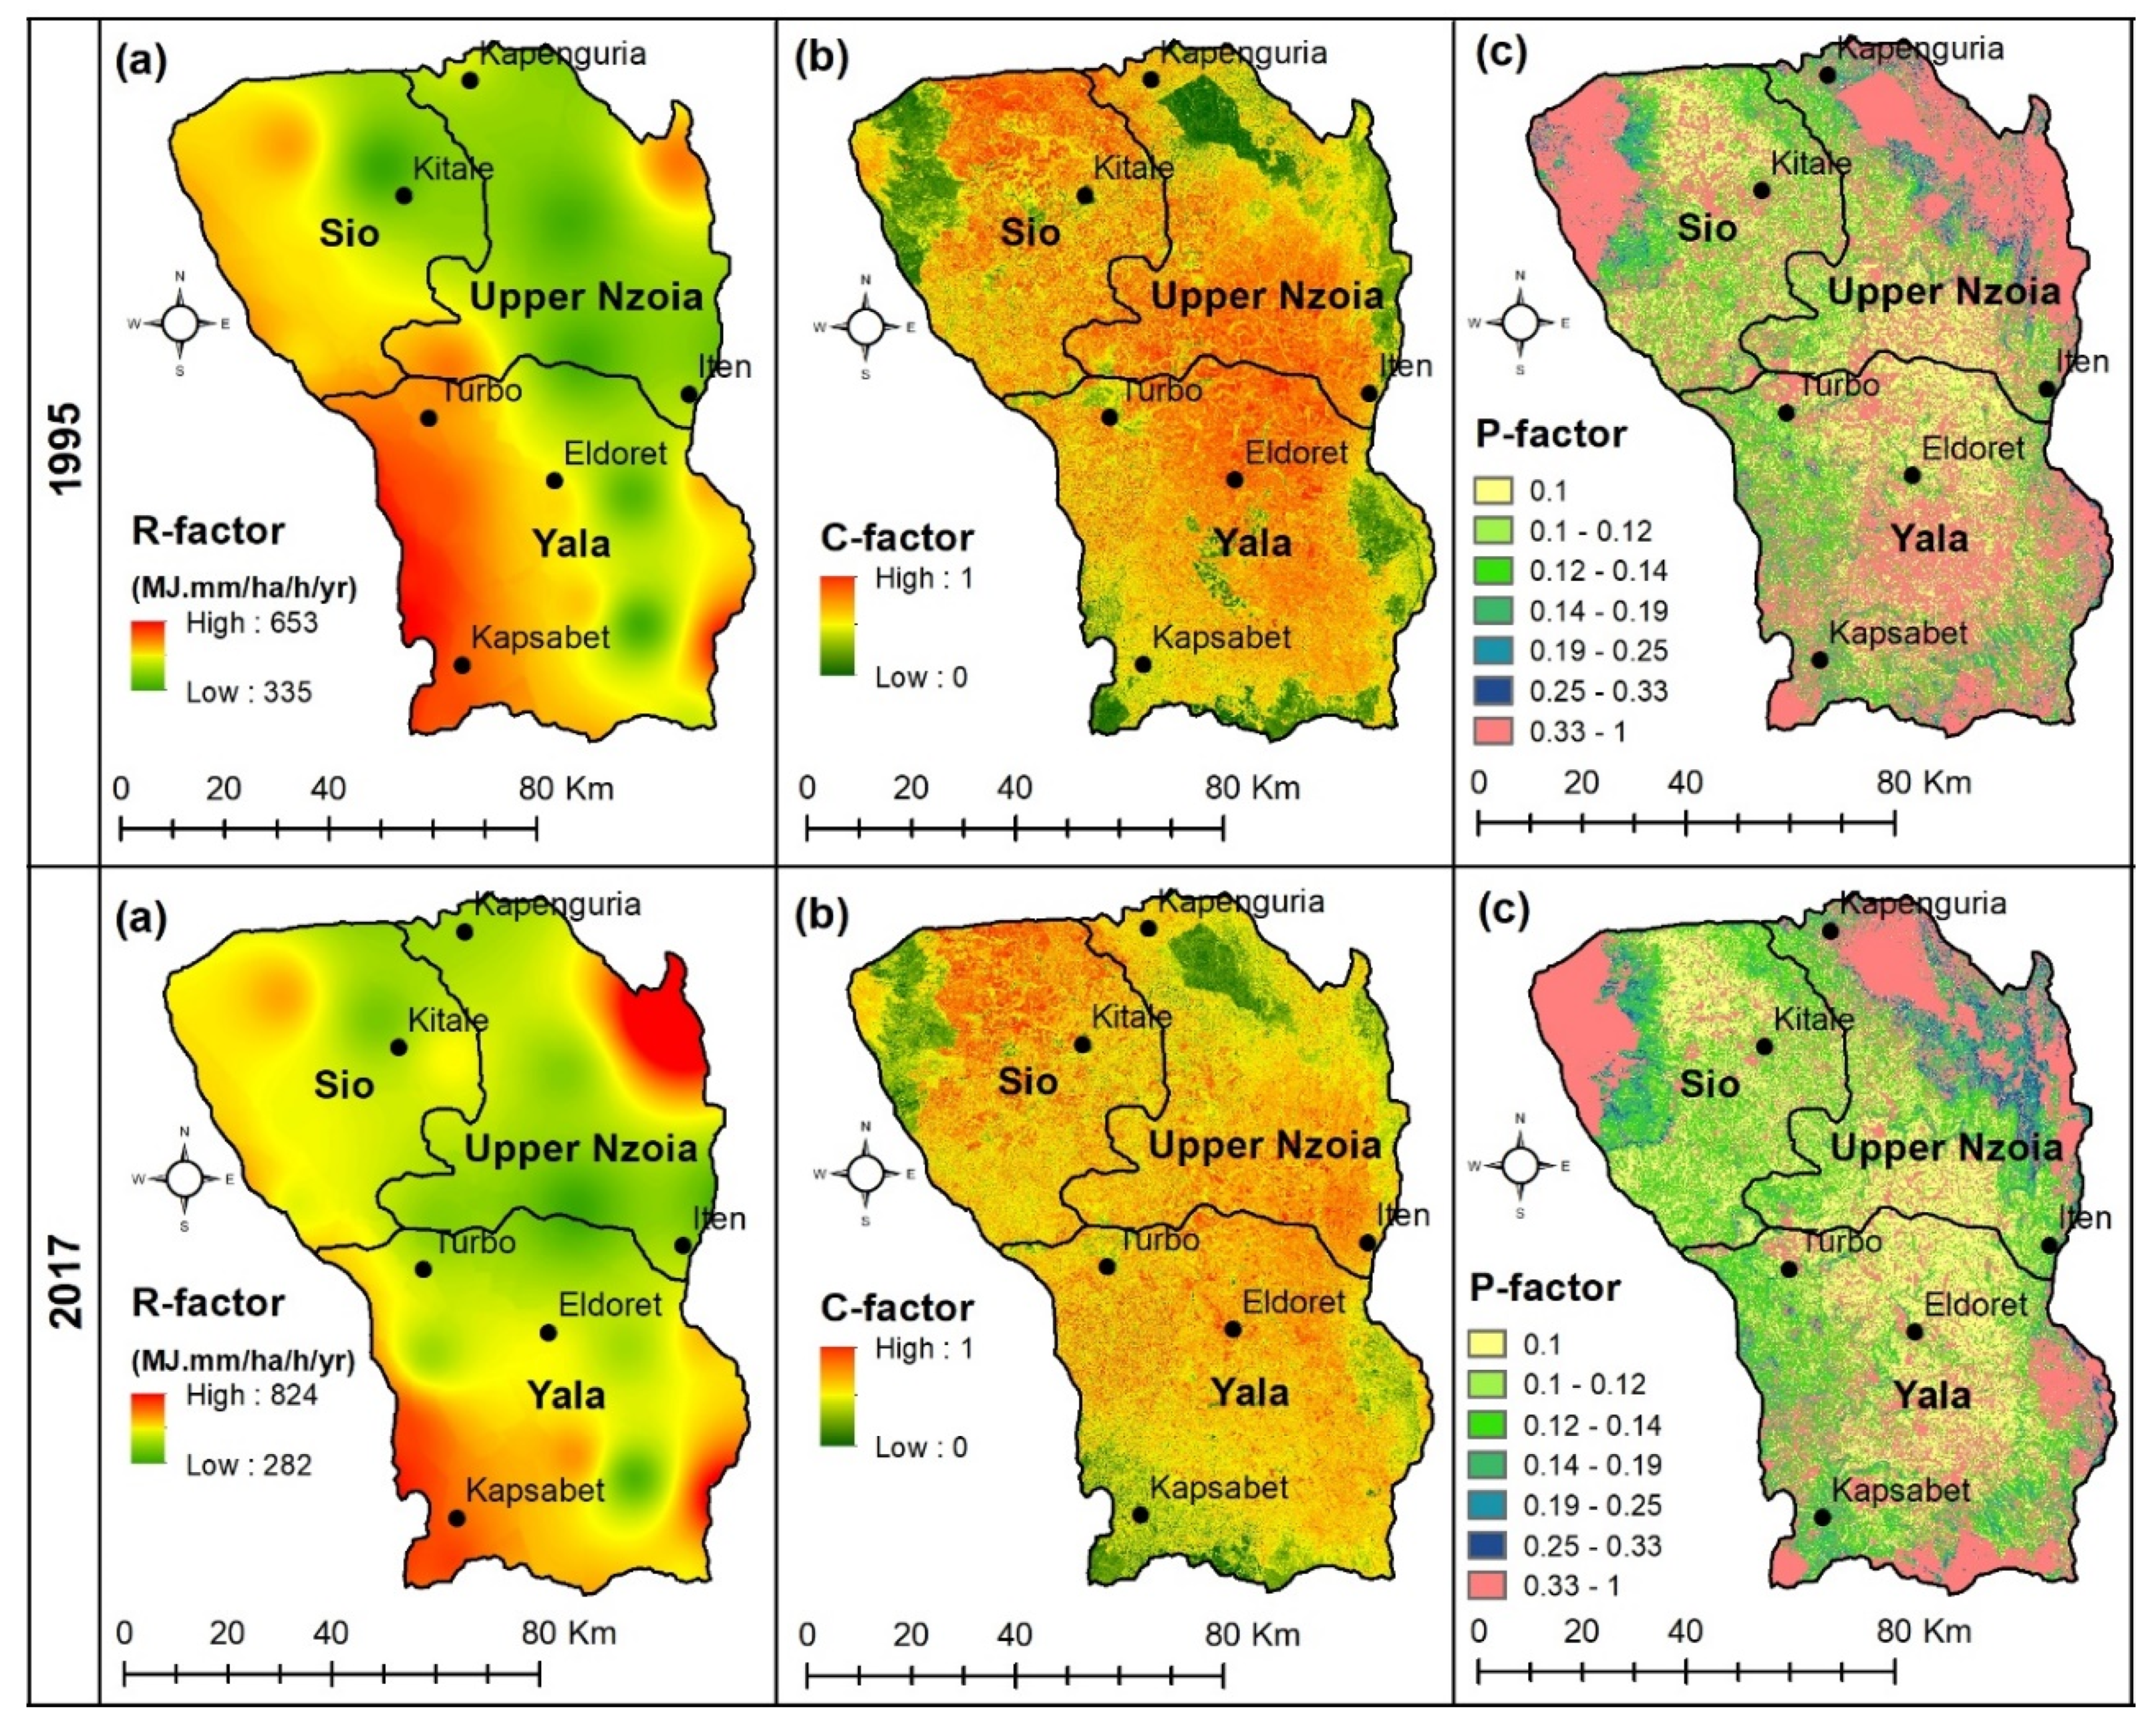
3.1. RUSLE Factors
3.2. Spatial and Temporal Soil Losses
3.3. Effect of Elevation and Slope on Soil Erosion
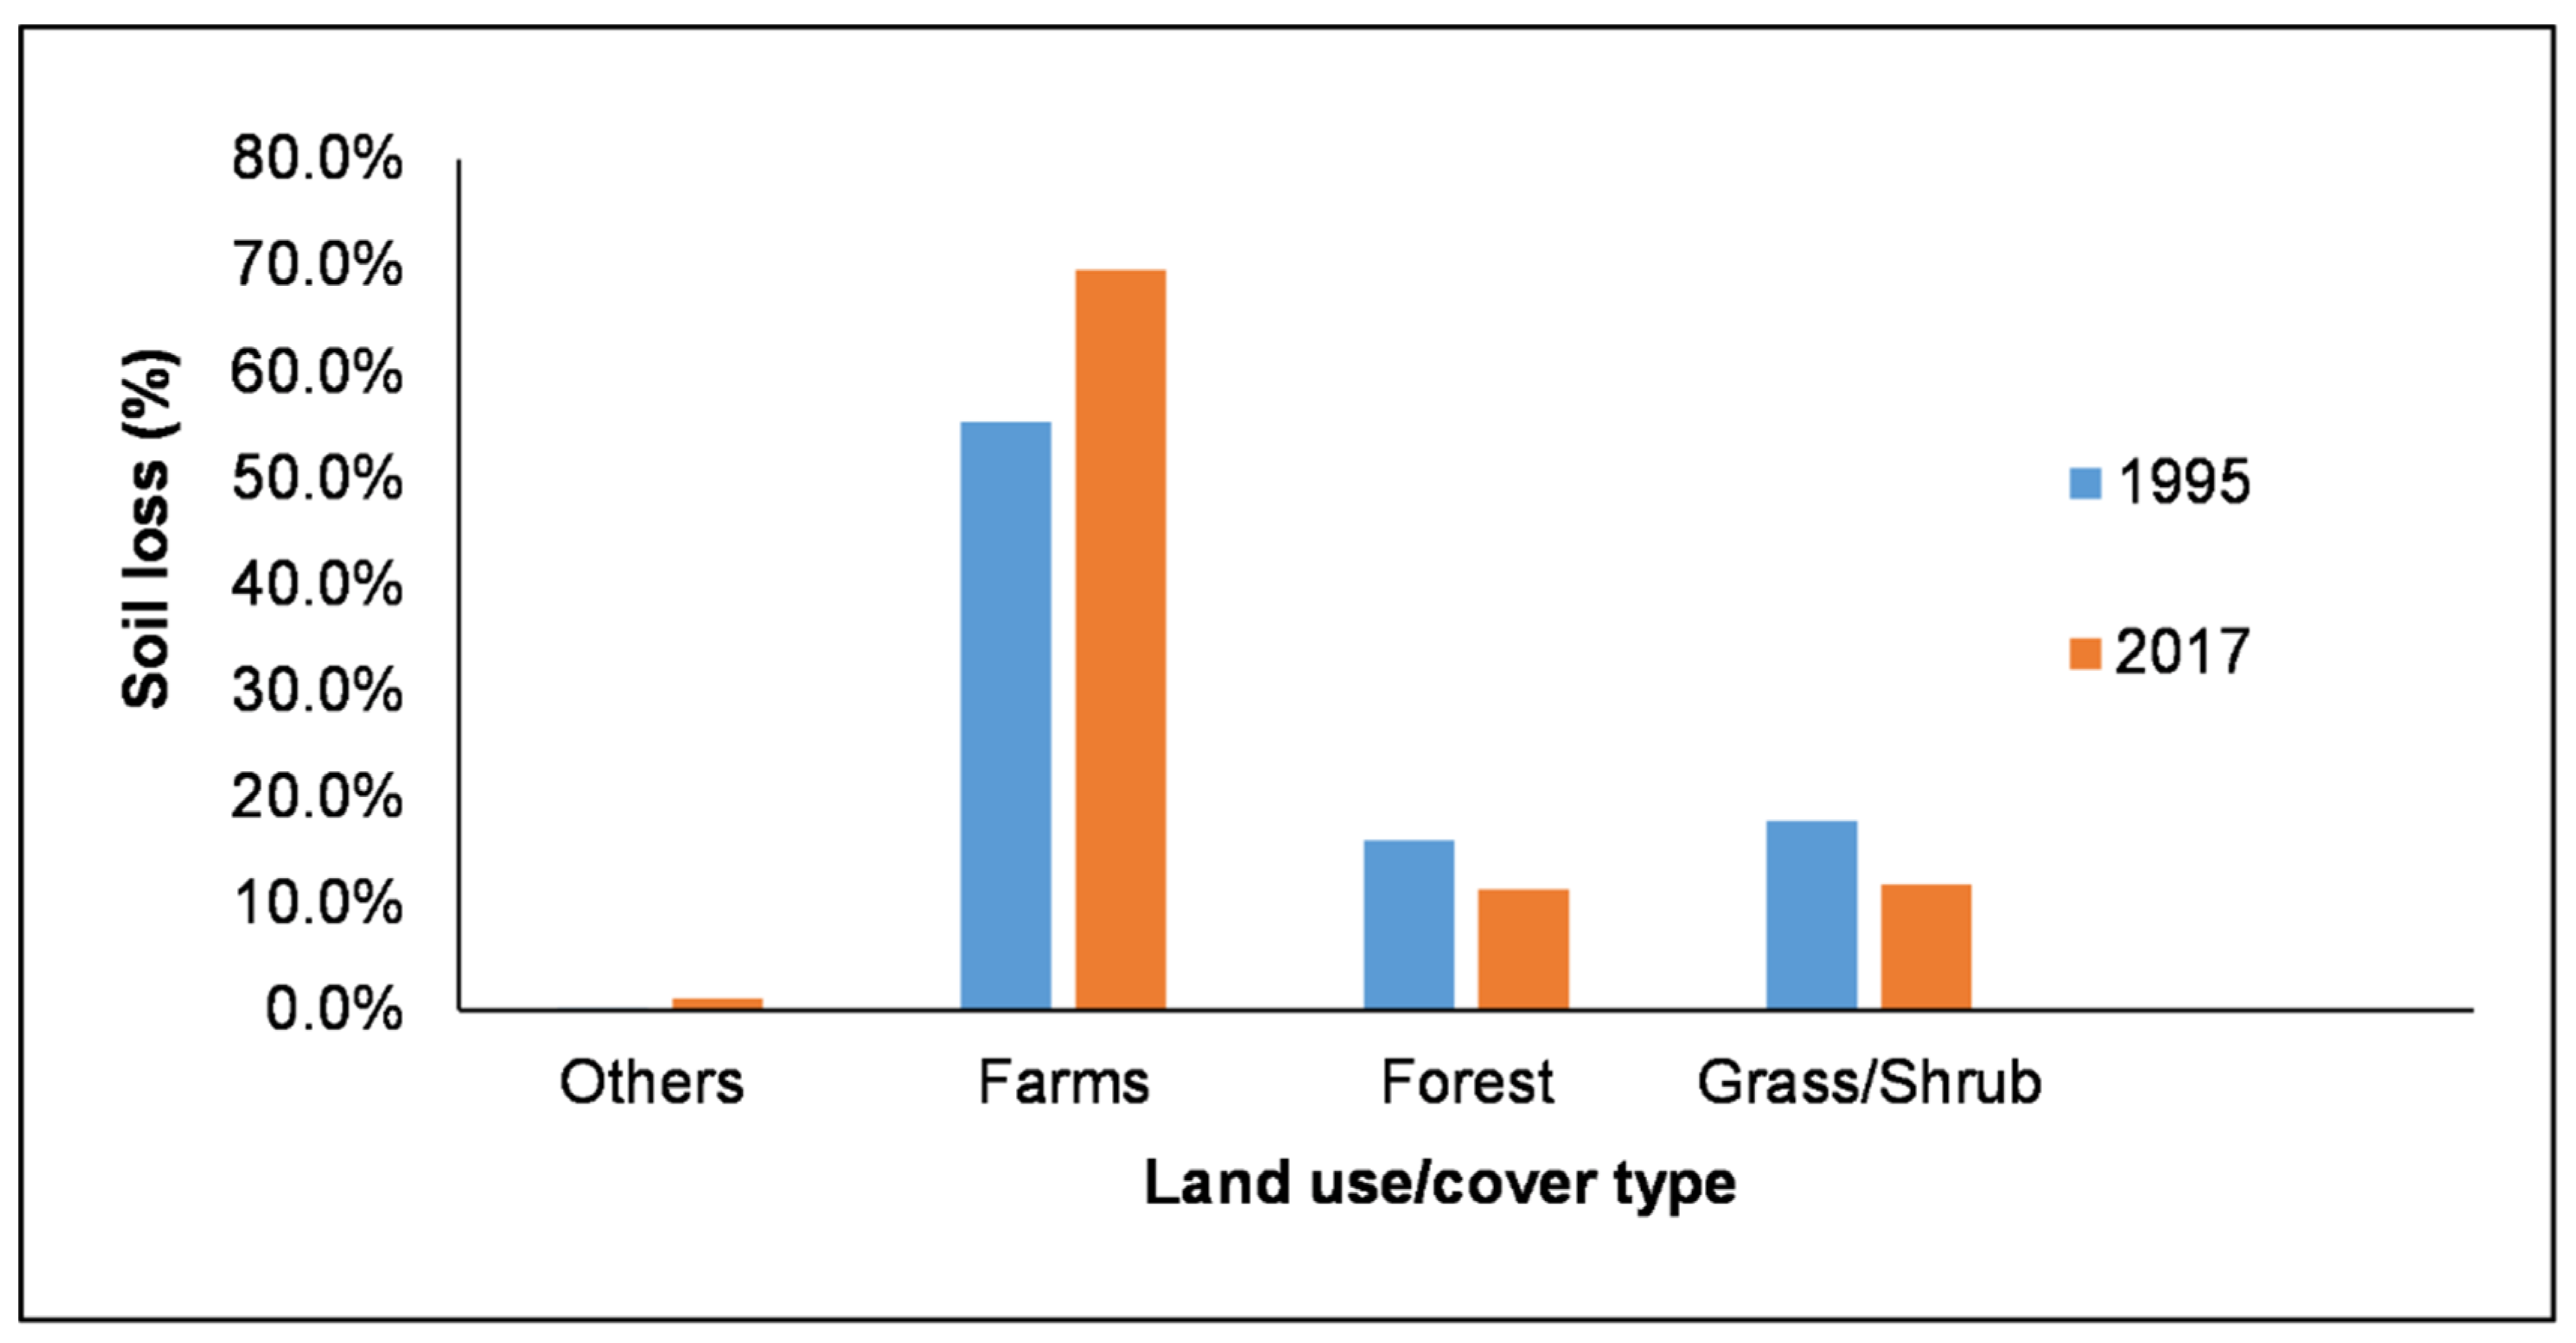
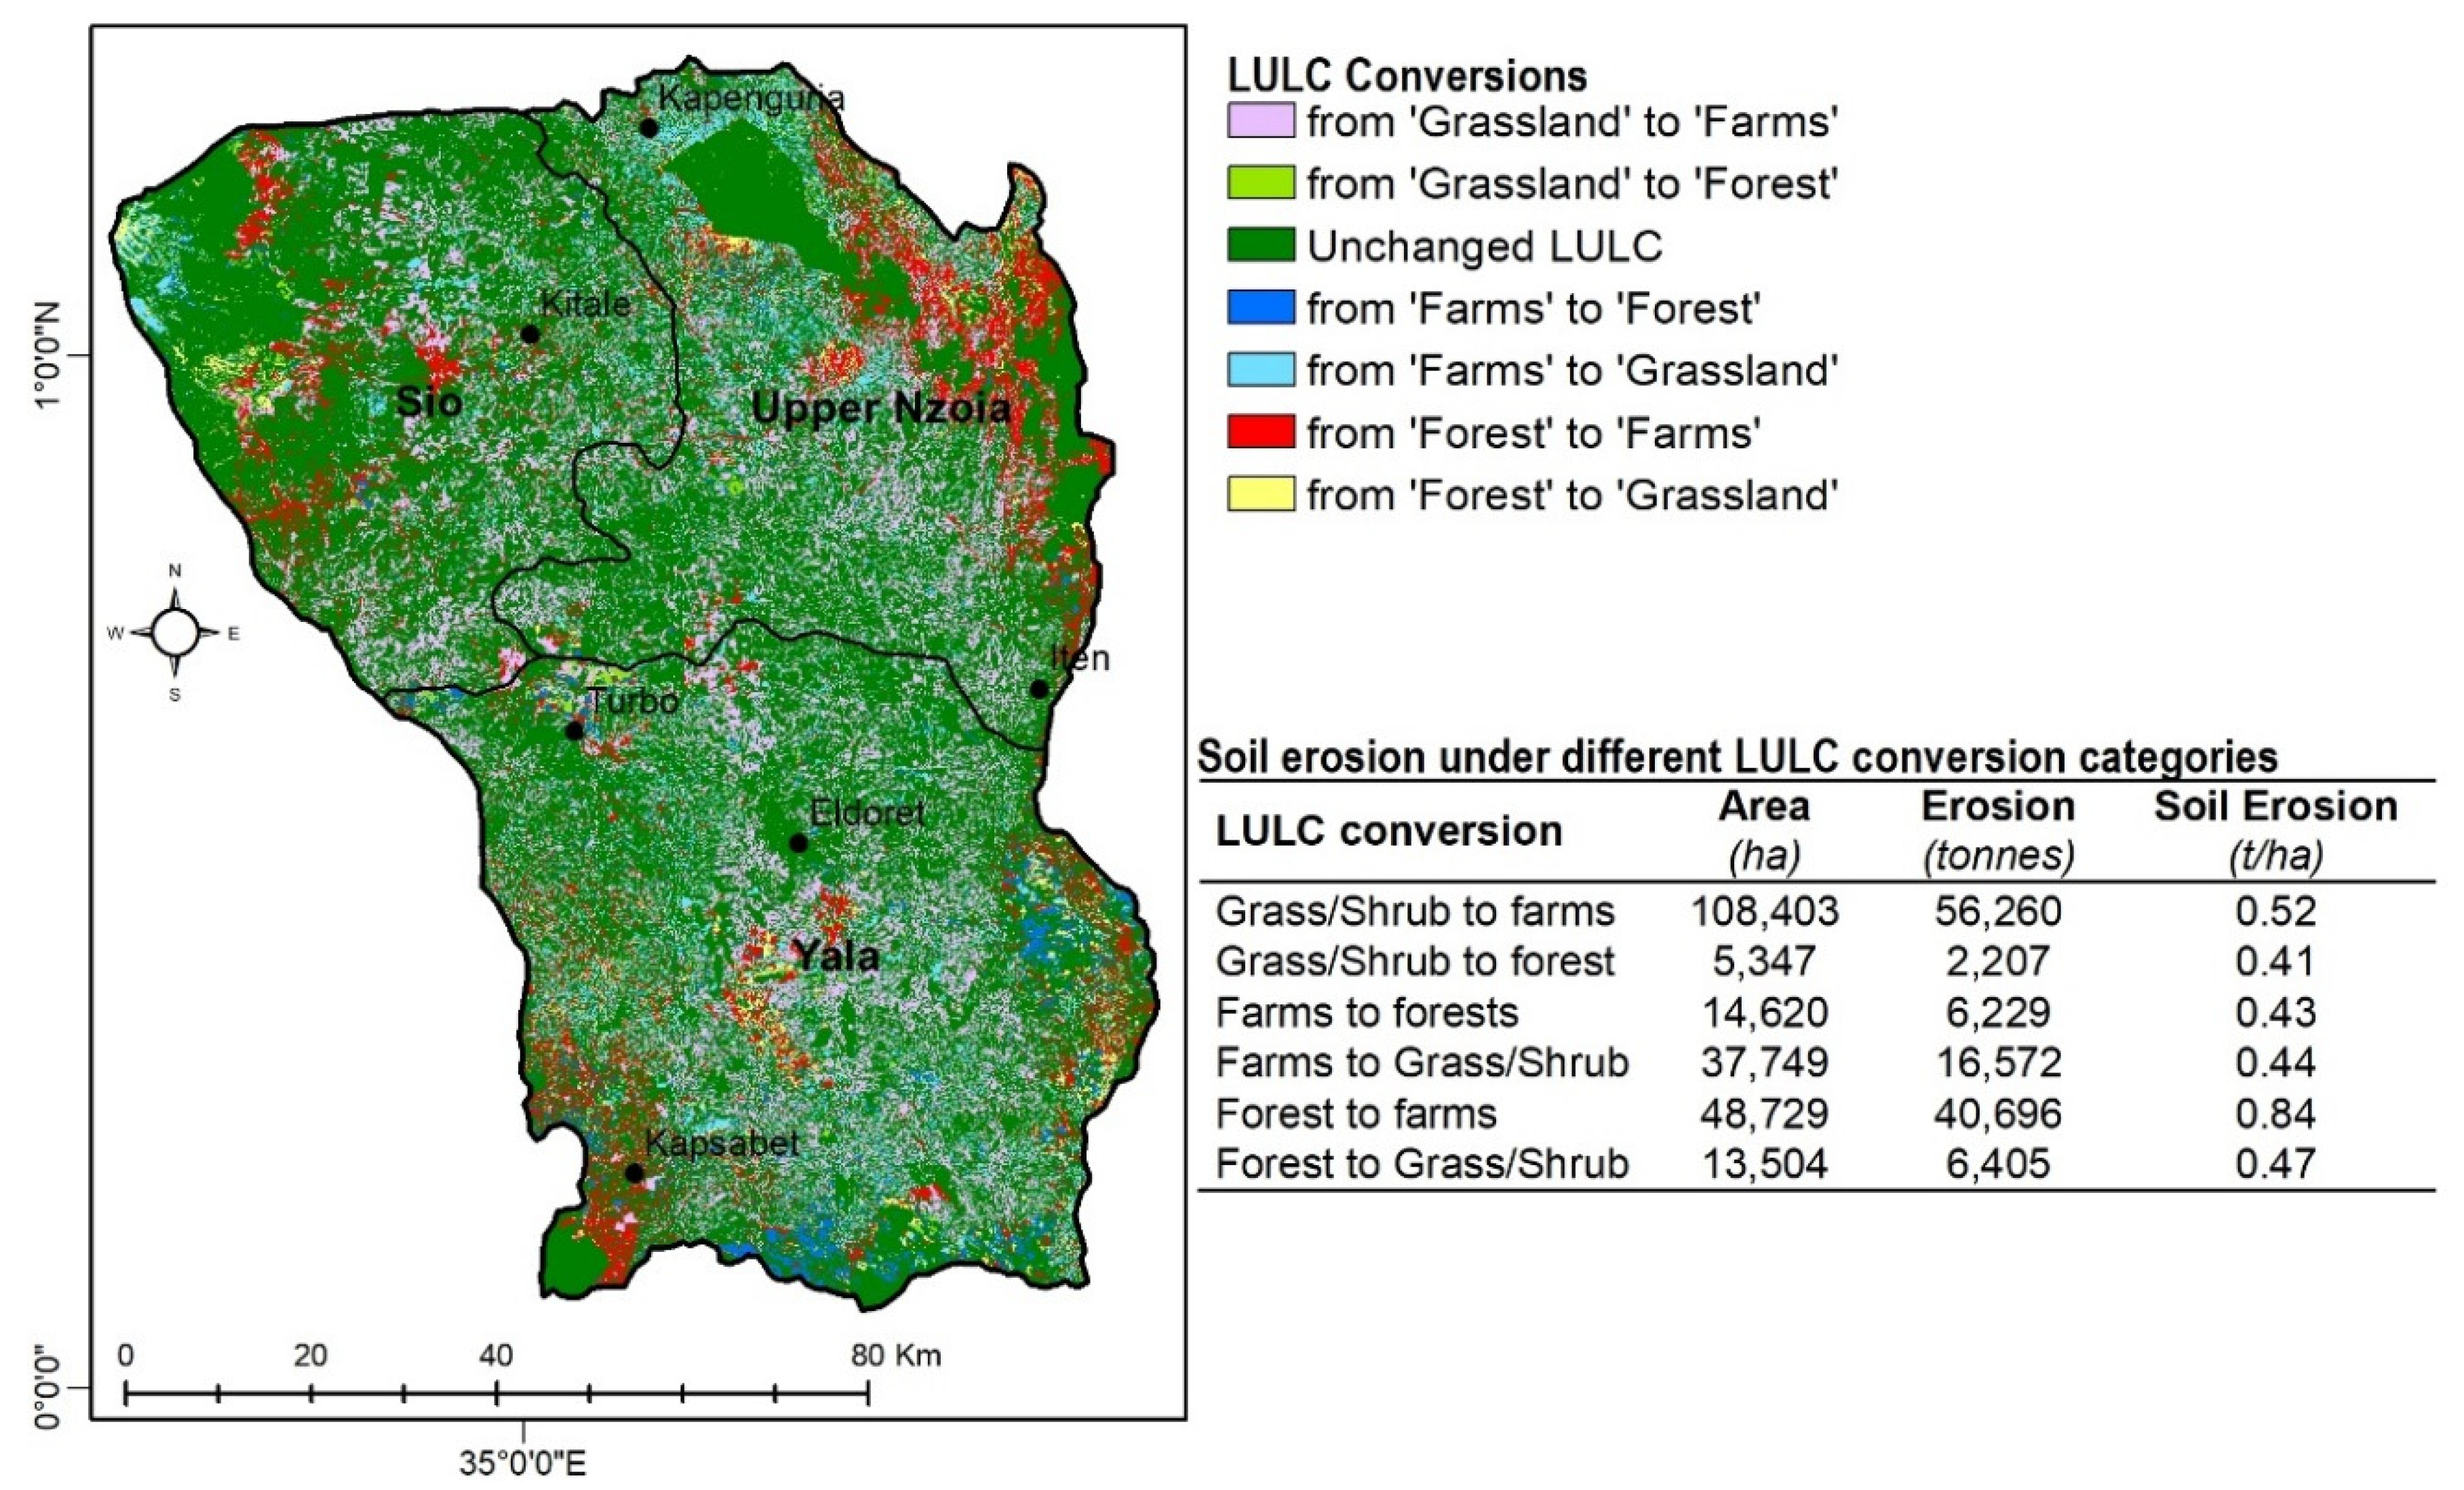
3.4. Contribution of Land Use/Cover Types and Conversions to Soil Erosion
4. Discussion
5. Conclusions
Author Contributions
Funding
Acknowledgments
Conflicts of Interest
References
- Bai, Z.G.; Dent, D.L.; Olsson, L.; Schaepman, M.E. Proxy global assessment of land degradation. Soil Use Manag. 2008, 24, 223–234. [Google Scholar] [CrossRef]
- Wischmeier, W.H.; Smith, D.D. Predicting Rainfall Erosion Losses: A Guide to Conservation Planning; Department of Agriculture, Science and Education Administration: Washington, DC, USA, 1978. [Google Scholar]
- Kouli, M.; Soupios, P.; Vallianatos, F. Soil erosion prediction using the Revised Universal Soil Loss Equation (RUSLE) in a GIS framework, Chania, Northwestern Crete, Greece. Environ. Earth Sci. 2009, 57, 483–497. [Google Scholar] [CrossRef]
- Bonilla, C.A.; Reyes, J.L.; Magri, A. Water Erosion Prediction Using the Revised Universal Soil Loss Equation (RUSLE) in a GIS Framework, Central Chile. Chil. J. Agric. Res. 2010, 70, 159–169. [Google Scholar] [CrossRef] [Green Version]
- Chan, K.Y.; Heenan, D.P.; So, H.B. Sequestration of carbon and changes in soil quality under conservation tillage on light-textured soils in Australia: A review. Aust. J. Exp. Agric. 2003, 43, 325–334. [Google Scholar] [CrossRef]
- Gopalakrishnan, T.; Hasan, K.; Haque, A.T.M.S.; Jayasinghe, S.L.; Kumar, L. Sustainability of Coastal Agriculture under Climate Change. Sustainability 2019, 11, 7200. [Google Scholar] [CrossRef] [Green Version]
- Hui, L.; Xiaoling, C.; Lim, K.J.; Xiaobin, C.; Sagong, M. Assessment of soil erosion and sediment yield in Liao watershed, Jiangxi Province, China, Using USLE, GIS, and RS. J. Earth Sci. 2010, 21, 941–953. [Google Scholar] [CrossRef]
- Yang, X. Deriving RUSLE cover factor from time-series fractional vegetation cover for hillslope erosion modelling in New South Wales. Soil Res. 2014, 52, 253–261. [Google Scholar] [CrossRef]
- Lal, R. Soil degradation by erosion. Land Degrad. Dev. 2001, 12, 519–539. [Google Scholar] [CrossRef]
- Panagopoulos, Y.; Dimitriou, E.; Skoulikidis, N.T. Vulnerability of a Northeast Mediterranean Island to Soil Loss. Can Grazing Management Mitigate Erosion? Water 2019, 11, 1491. [Google Scholar] [CrossRef] [Green Version]
- Kiage, L. Perspectives on the assumed causes of land degradation in the rangelands of Sub-Saharan Africa. Prog. Phys. Geogr. Earth Environ. 2013, 37, 664–684. [Google Scholar] [CrossRef]
- Sanchez, P.A.; Palm, C.A.; Buol, S.W. Fertility capability soil classification: A tool to help assess soil quality in the tropics. Geoderma 2003, 114, 157–185. [Google Scholar] [CrossRef]
- Ringius, L.; Downing, T.; Hulme, M.; Waughray, D.; Selrod, R. Climate change in Africa: Issues and challenges in agriculture and water for sustainable development. Cicero Rep. 1996, 8, 84–96. [Google Scholar]
- Mulinge, W.; Gicheru, P.; Murithi, F.; Maingi, P.; Kihiu, E.; Kirui, O.K.; Mirzabaev, A. Economics of Land Degradation and Improvement in Kenya. In Economics of Land Degradation and Improvement—A Global Assessment for Sustainable Development; Springer: Cham, Switzerland, 2016; pp. 471–498. [Google Scholar]
- Bai, Z.; Dent, D. Global assessment of land degradation and improvement: Pilot study in Kenya. ISRIC Rep. 2006, 1, 3–16. [Google Scholar]
- Kogo, B.K.; Kumar, L.; Koech, R. Forest cover dynamics and underlying driving forces affecting ecosystem services in western Kenya. Remote Sens. Appl. Soc. Environ. 2019, 14, 75–83. [Google Scholar] [CrossRef]
- Waswa, B.S. Assessment of Land Degradation Patterns in Western Kenya: Implications for Restoration and Rehabilitation. Ph.D. Thesis, Universitäts-und Landesbibliothek Bonn, Bonn, Germany, 2012. [Google Scholar]
- Ngome, A.F.; Becker, M.; Mtei, K.M.; Mussgnug, F. Fertility management for maize cultivation in some soils of Western Kenya. Soil Tillage Res. 2011, 117, 69–75. [Google Scholar] [CrossRef]
- Tittonell, P.; Vanlauwe, B.; De Ridder, N.; Giller, K. Heterogeneity of crop productivity and resource use efficiency within smallholder Kenyan farms: Soil fertility gradients or management intensity gradients? Agric. Syst. 2007, 94, 376–390. [Google Scholar] [CrossRef]
- Borrelli, P.; Robinson, D.A.; Panagos, P.; Lugato, E.; Yang, J.E.; Alewell, C.; Wuepper, D.; Montanarella, L.; Ballabio, C. Land use and climate change impacts on global soil erosion by water (2015–2070). Proc. Natl. Acad. Sci. USA 2020, 117, 21994–22001. [Google Scholar] [CrossRef]
- Chen, T.; Niu, R.-Q.; Li, P.-X.; Zhang, L.; Du, B. Regional soil erosion risk mapping using RUSLE, GIS, and remote sensing: A case study in Miyun Watershed, North China. Environ. Earth Sci. 2010, 63, 533–541. [Google Scholar] [CrossRef]
- Wang, G.; Gertner, G.; Fang, S.; Anderson, A.B. Mapping Multiple Variables for Predicting Soil Loss by Geostatistical Methods with TM Images and a Slope Map. Photogramm. Eng. Remote Sens. 2003, 69, 889–898. [Google Scholar] [CrossRef]
- Bartsch, K.P.; Van Miegroet, H.; Boettinger, J.; Dobrowolski, J.P. Using empirical erosion models and GIS to determine erosion risk at Camp Williams, Utah. J. Soil Water Conserv. 2002, 57, 29–37. [Google Scholar]
- Evans, R. An alternative way to assess water erosion of cultivated land–field-based measurements: And analysis of some results. Appl. Geogr. 2002, 22, 187–207. [Google Scholar] [CrossRef]
- Evans, R.; Brazier, R. Evaluation of modelled spatially distributed predictions of soil erosion by water versus field-based assessments. Environ. Sci. Policy 2005, 8, 493–501. [Google Scholar] [CrossRef] [Green Version]
- Renschler, C.S.; Harbor, J. Soil erosion assessment tools from point to regional scales—The role of geomorphologists in land management research and implementation. Geomorphology 2002, 47, 189–209. [Google Scholar] [CrossRef]
- Karydas, C.G.; Panagos, P.; Gitas, I.Z. A classification of water erosion models according to their geospatial characteristics. Int. J. Digit. Earth 2012, 7, 229–250. [Google Scholar] [CrossRef]
- Renard, K.G. Predicting Soil Erosion by Water: A Guide to Conservation Planning with the Revised Universal Soil Loss Equation (RUSLE); United States Government Printing: Washington, DC, USA, 1997.
- Kinnell, P. Event soil loss, runoff and the Universal Soil Loss Equation family of models: A review. J. Hydrol. 2010, 385, 384–397. [Google Scholar] [CrossRef]
- Diodato, N.; Borrelli, P.; Fiener, P.; Bellocchi, G.; Romano, N. Discovering historical rainfall erosivity with a parsimonious approach: A case study in Western Germany. J. Hydrol. 2017, 544, 1–9. [Google Scholar] [CrossRef]
- Mustefa, M.; Fufa, F.; Takala, W. GIS estimation of annual average soil loss rate from Hangar River watershed using RUSLE. J. Water Clim. Chang. 2019, 11, 529–539. [Google Scholar] [CrossRef] [Green Version]
- Panagos, P.; Borrelli, P.; Poesen, J.; Ballabio, C.; Lugato, E.; Meusburger, K.; Montanarella, L.; Alewell, C. The new assessment of soil loss by water erosion in Europe. Environ. Sci. Policy 2015, 54, 438–447. [Google Scholar] [CrossRef]
- Naqvi, H.R.; Mallick, J.; Devi, L.M.; Siddiqui, M.A. Multi-temporal annual soil loss risk mapping employing Revised Universal Soil Loss Equation (RUSLE) model in Nun Nadi Watershed, Uttrakhand (India). Arab. J. Geosci. 2012, 6, 4045–4056. [Google Scholar] [CrossRef]
- Angima, S.; Stott, D.; O’Neill, M.; Ong, C.; Weesies, G. Soil erosion prediction using RUSLE for central Kenyan highland conditions. Agric. Ecosyst. Environ. 2003, 97, 295–308. [Google Scholar] [CrossRef]
- Shi, Z.; Cai, C.; Ding, S.; Wang, T.; Chow, T. Soil conservation planning at the small watershed level using RUSLE with GIS: A case study in the Three Gorge Area of China. Catena 2004, 55, 33–48. [Google Scholar] [CrossRef]
- Nasir, A.; Uchida, K.; Ashraf, M. Estimation of soil erosion by using RUSLE and GIS for small mountainous watersheds in Pakistan. Pak. J. Water Resour. Pak. 2006, 10, 11–21. [Google Scholar]
- Lu, D.; Li, G.; Valladares, G.S.; Batistella, M. Mapping soil erosion risk in Rondônia, Brazilian Amazonia: Using RUSLE, remote sensing and GIS. Land Degrad. Dev. 2004, 15, 499–512. [Google Scholar] [CrossRef]
- Onyando, J.O.; Kisoyan, P.; Chemelil, M.C. Estimation of Potential Soil Erosion for River Perkerra Catchment in Kenya. Water Resour. Manag. 2005, 19, 133–143. [Google Scholar] [CrossRef]
- Mutua, B.; Klik, A.; Loiskandl, W. Modelling soil erosion and sediment yield at a catchment scale: The case of Masinga catchment, Kenya. Land Degrad. Dev. 2006, 17, 557–570. [Google Scholar] [CrossRef]
- Pandey, A.; Chowdary, V.M.; Mal, B.C. Identification of critical erosion prone areas in the small agricultural watershed using USLE, GIS and remote sensing. Water Resour. Manag. 2006, 21, 729–746. [Google Scholar] [CrossRef]
- Mora, B.; Tsendbazar, N.-E.; Herold, M.; Hagolle, O. Global Land Cover Mapping: Current Status and Future Trends. In Land Use and Land Cover Mapping in Europe; Springer: Berlin/Heidelberg, Germany, 2014; pp. 11–30. [Google Scholar]
- Yang, D.; Kanae, S.; Oki, T.; Koike, T.; Musiake, K. Global potential soil erosion with reference to land use and climate changes. Hydrol. Process. 2003, 17, 2913–2928. [Google Scholar] [CrossRef]
- Jaetzold, R.; Schmidt, H. Farm Management Handbook of Kenya; Ministry of Agriculture: Nairobi, Kenya, 1982.
- Omuto, C.T. Kenya: A Natural Outlook: Chapter 11. Major Soil and Data Types in Kenya; Elsevier Inc.: Amsterdam, The Netherlands, 2013; Volume 16. [Google Scholar]
- Kogo, B.K.; Kumar, L.; Koech, R. Analysis of spatio-temporal dynamics of land use and cover changes in Western Kenya. Geocarto Int. 2019, 1–16. [Google Scholar] [CrossRef]
- Renard, K.G.; Foster, G.R.; Weesies, G.A.; Porter, J.P. RUSLE: Revised universal soil loss equation. J. Soil Water Conserv. 1991, 46, 30–33. [Google Scholar]
- Lu, G.Y.; Wong, D.W. An adaptive inverse-distance weighting spatial interpolation technique. Comput. Geosci. 2008, 34, 1044–1055. [Google Scholar] [CrossRef]
- Pokhrel, R.M.; Kuwano, J.; Tachibana, S. A kriging method of interpolation used to map liquefaction potential over alluvial ground. Eng. Geol. 2013, 152, 26–37. [Google Scholar] [CrossRef]
- Shahbeik, S.; Afzal, P.; Maarefvand, P.; Qumarsy, M. Comparison between ordinary kriging (OK) and inverse distance weighted (IDW) based on estimation error. Case study: Dardevey iron ore deposit, NE Iran. Arab. J. Geosci. 2013, 7, 3693–3704. [Google Scholar] [CrossRef]
- KENSOTER Home Page. Available online: https://research.wur.nl/en/datasets/soter-based-soil-parameter-estimates-sotwis-for-kenya-version-10 (accessed on 12 May 2020).
- Sharpley, A.N.; Williams, J.R. EPIC-Erosion/Productivity Impact Calculator. I: Model Documentation. II: User Manual; Technical Bulletin; United States Department of Agriculture: Washington, DC, USA, 1990; p. 1768.
- Morgan, R.P.C. Soil Erosion and Conservation; John Wiley & Sons: Hoboken, NJ, USA, 2009. [Google Scholar]
- Singh, G.; Chandra, S.; Babu, R. Soil loss and prediction research in India, Central Soil and Water Conservation Research Training Institute. Bulletin No T-12 D 1981, 9, 1981. [Google Scholar]
- Van der Knijff, J.; Jones, R.; Montanarella, L. Soil Erosion Risk Assessment in Europe, EUR 19044 EN; Office for Official Publications of the European Communities: Luxembourg, 2000; p. 34. [Google Scholar]
- Gitas, I.Z.; Douros, K.; Minakou, C.; Silleos, G.N.; Karydas, C.G. Multi-temporal soil erosion risk assessment in N. Chalkidiki using a modified USLE raster model. EARSeL Proc. 2009, 8, 40–52. [Google Scholar]
- Mugalavai, E.M.; Kipkorir, E.C.; Raes, D.; Rao, M.S. Analysis of rainfall onset, cessation and length of growing season for western Kenya. Agric. For. Meteorol. 2008, 148, 1123–1135. [Google Scholar] [CrossRef]
- Yang, X.; Gao, W.; Shi, Q.; Chen, F.; Chu, Q. Impact of climate change on the water requirement of summer maize in the Huang-Huai-Hai farming region. Agric. Water Manag. 2013, 124, 20–27. [Google Scholar] [CrossRef]
- Hategekimana, Y.; Allam, M.; Meng, Q.; Nie, Y.; Elhag, M. Quantification of Soil Losses along the Coastal Protected Areas in Kenya. Land 2020, 9, 137. [Google Scholar] [CrossRef]
- Mati, B.M.; Morgan, R.P.; Gichuki, F.N.; Quinton, J.N.; Brewer, T.R.; Liniger, H.P. Assessment of erosion hazard with the USLE and GIS: A case study of the Upper Ewaso Ng’iro North basin of Kenya. Int. J. Appl. Earth Obs. Geoinf. 2000, 2, 78–86. [Google Scholar] [CrossRef]
- Dulo, S.; Odira, P.; Nyadwa, M.; Okelloh, B. Integrated flood and drought management for sustainable development in the Nzoia River Basin. Nile Basin Water Sci. Eng. J. 2010, 3, 39–51. [Google Scholar]
- Ziadat, F.M.; Taimeh, A.Y. Effect of rainfall intensity, slope, land use and antecedent soil moisture on soil erosion in an arid environment. Land Degrad. Dev. 2013, 24, 582–590. [Google Scholar] [CrossRef]
- Ali, S.A.; Hagos, H. Estimation of soil erosion using USLE and GIS in Awassa Catchment, Rift valley, Central Ethiopia. Geoderma Reg. 2016, 7, 159–166. [Google Scholar] [CrossRef]
- Gabarrón-Galeote, M.A.; Martínez-Murillo, J.F.; Ruiz-Sinoga, J.D. Relevant effects of vegetal cover and litter on the soil hydrological response of two contrasting Mediterranean hillslopes at the end of the dry season (south of Spain). Hydrol. Process. 2011, 26, 1729–1738. [Google Scholar]
- Barbera, V.; Poma, I.; Gristina, L.; Novara, A.; Egli, M. Long-term cropping systems and tillage management effects on soil organic carbon stock and steady state level of C sequestration rates in a semiarid environment. Land Degrad. Dev. 2010, 23, 82–91. [Google Scholar] [CrossRef] [Green Version]
- Koirala, P.; Thakuri, S.; Joshi, S.; Chauhan, R. Estimation of Soil Erosion in Nepal Using a RUSLE Modeling and Geospatial Tool. Geosciences 2019, 9, 147. [Google Scholar] [CrossRef] [Green Version]
- Borrelli, P.; Robinson, D.A.; Fleischer, L.R.; Lugato, E.; Ballabio, C.; Alewell, C.; Meusburger, K.; Modugno, S.; Schütt, B.; Ferro, V.; et al. An assessment of the global impact of 21st century land use change on soil erosion. Nat. Commun. 2017, 8, 1–13. [Google Scholar] [CrossRef] [PubMed] [Green Version]


| Sub-Basin | Surface Area (104 ha) | Temperature (°C) | Rainfall (mm) | Average Slope (Degrees) | Altitude (m a.m.s.l) |
|---|---|---|---|---|---|
| Sio | 3.3 | 10–30 | 400–1800 | 5.5 | 1.543–4.093 |
| Upper Nzoia | 36.6 | 10–29 | 600–2214 | 7.2 | 1.561–3.202 |
| Yala | 54.9 | 15–29 | 624–1560 | 4.6 | 1.300–2.803 |
| Land Use Type | Slope (%) | P-factor |
|---|---|---|
| Farms | 0–5 | 0.1 |
| 5–10 | 0.12 | |
| 10–20 | 0.14 | |
| 20–30 | 0.19 | |
| 30–50 | 0.25 | |
| 50–100 | 0.33 | |
| Others (built-up, forest, water, grass/shrub land) | All | 1.0 |
| Sub-Basin | Soil Loss (1995) | Soil Loss (2017) | ||
|---|---|---|---|---|
| t/y | Percent | t/y | Percent | |
| Yala | 6.4 | 38.3 | 12.3 | 38.4 |
| Sio | 4.7 | 28.4 | 7.5 | 23.5 |
| Upper Nzoia | 5.6 | 33.4 | 12.2 | 38.1 |
| Total for the region | 16.8 | 32.0 | ||
| Class of Severity | Soil Loss (t/ha/y) | Year 1995 | Year 2017 | Net Change (t/ha/y) | ||
|---|---|---|---|---|---|---|
| Area (ha) | Soil Loss (t/ha/y) | Area (ha) | Soil Loss (t/ha/y) | |||
| Low | <5 | 614,756 | 0.2 | 611,581 | 0.4 | 0.2 |
| Moderate | 5–10 | 2788 | 6.8 | 5188 | 6.7 | −0.1 |
| High | 10–20 | 1031 | 13.5 | 1697 | 13.4 | −0.1 |
| Very High | >20 | 385 | 31.5 | 493 | 35.8 | 4.3 |
| Elevation | Area (104 ha) | Erosion (t/ha/y) | Net Change (t/ha/y) | |
|---|---|---|---|---|
| 1995 | 2017 | |||
| <2000 | 28.50 | 0.2 | 0.4 | 0.2 |
| 2000–2500 | 26.43 | 0.3 | 0.6 | 0.3 |
| 2500–3000 | 6.02 | 0.3 | 0.7 | 0.4 |
| 3000–3500 | 0.78 | 0.8 | 0.5 | −0.3 |
| >3500 | 0.16 | 4.4 | 0.9 | −3.5 |
| Slope | Area (104 ha) | Erosion (t/ha/y) | Net Change (t/ha/y) | |
|---|---|---|---|---|
| 1995 | 2017 | |||
| <5° | 38.7 | 0.2 | 0.3 | 0.1 |
| 5–10° | 13.8 | 0.3 | 0.4 | 0.1 |
| 10–20° | 7.7 | 0.4 | 0.7 | 0.3 |
| 20–30° | 1.4 | 1.4 | 2.4 | 1.0 |
| >30° | 0.3 | 3.2 | 4.9 | 1.7 |
| LULC Conversion | Area Conversions under Different Slopes | Total Area (ha) | ||||
|---|---|---|---|---|---|---|
| <5° | 5–10° | 10–20° | 20–30° | >30° | ||
| Grass/Shrub to farms | 82,526 | 18,830 | 6242 | 723 | 82 | 108,321 |
| Grass/Shrub to forest | 3398 | 1030 | 750 | 145 | 25 | 5322 |
| Farms to forests | 6956 | 4546 | 2367 | 505 | 246 | 14,374 |
| Farms to Grass/Shrub | 21,873 | 9378 | 5550 | 796 | 152 | 37,597 |
| Forest to farms | 20,049 | 14,478 | 11,157 | 2582 | 463 | 48,266 |
| Forest to Grass/Shrub | 4662 | 3742 | 3918 | 1010 | 173 | 13,332 |
| LULC Conversion | Soil Erosion (Tons) | Total (Tons) | Rate (t/ha) | ||||
|---|---|---|---|---|---|---|---|
| <5° | 5–10° | 10–20° | 20–30° | >30° | |||
| Grass/Shrub to farms | 42,831 | 9772 | 3239 | 375 | 43 | 56,260 | 0.52 |
| Grass/Shrub to forest | 1402 | 425 | 309 | 60 | 10 | 2207 | 0.41 |
| Farms to forests | 2964 | 1937 | 1008 | 215 | 105 | 6229 | 0.43 |
| Farms to Grass/Shrub | 9602 | 4117 | 2436 | 350 | 67 | 16,572 | 0.44 |
| Forest to farms | 16,744 | 12,091 | 9318 | 2156 | 387 | 40,696 | 0.84 |
| Forest to Grass/Shrub | 2211 | 1775 | 1858 | 479 | 82 | 6405 | 0.47 |
Publisher’s Note: MDPI stays neutral with regard to jurisdictional claims in published maps and institutional affiliations. |
© 2020 by the authors. Licensee MDPI, Basel, Switzerland. This article is an open access article distributed under the terms and conditions of the Creative Commons Attribution (CC BY) license (http://creativecommons.org/licenses/by/4.0/).
Share and Cite
Kogo, B.K.; Kumar, L.; Koech, R. Impact of Land Use/Cover Changes on Soil Erosion in Western Kenya. Sustainability 2020, 12, 9740. https://doi.org/10.3390/su12229740
Kogo BK, Kumar L, Koech R. Impact of Land Use/Cover Changes on Soil Erosion in Western Kenya. Sustainability. 2020; 12(22):9740. https://doi.org/10.3390/su12229740
Chicago/Turabian StyleKogo, Benjamin Kipkemboi, Lalit Kumar, and Richard Koech. 2020. "Impact of Land Use/Cover Changes on Soil Erosion in Western Kenya" Sustainability 12, no. 22: 9740. https://doi.org/10.3390/su12229740
APA StyleKogo, B. K., Kumar, L., & Koech, R. (2020). Impact of Land Use/Cover Changes on Soil Erosion in Western Kenya. Sustainability, 12(22), 9740. https://doi.org/10.3390/su12229740