Abstract
Microgrid construction is promoted globally to solve the problems of energy inequality in island regions and the use of fossil fuels. In the application of a microgrid system, it is important to calculate the capacities of renewable energy sources and storage systems (ESSs) to ensure economic feasibility. In some microgrids that have recently had environmental challenges, there are island regions where the policy is to consider both the installation of the microgrid system and the supplement of electric vehicles (EV). However, an EV load pattern that does not match the solar radiation pattern may increase the required ESS capacity. Therefore, in this study, we designed and analyzed a method for reducing the microgrid system cost using a controllable EV charging load without the requirements of vehicle-to-grid technology and real-time pricing. The power system operations at similar capacities of photovoltaic and ESS were shown by applying EV charging control steps in 10% increments to analyze the effect of EV charging demand control on the microgrid. As a result of the proposed simulation, the amount of renewable power generation increased by 2.8 GWh over 20 years only by moving the charging load under the same conditions. This is an effect that can reduce CO2 by about 2.1 kTon.
1. Introduction
The installation of microgrids has been promoted worldwide to concurrently solve the issues of energy inequality and environmental challenges [1,2,3]. Because microgrids use limited power, the capacity design of distributed sources is vital to ensure economic and electrical feasibility. In particular, for islands that are sensitive to environmental issues, such as nature heritages, both microgrids and electric vehicles (EVs) can be considered simultaneously in order to achieve zero fossil fuel use [4]. However, most islands do not have factory loads; therefore, the total load is higher in the evening than the daytime, and EV charging loads also tend to be higher in the evening depending on the consumer’s lifestyle. These load patterns significantly reduce the peak contribution of photovoltaic (PV) power generation and may require a larger energy storage system (ESS) for microgrids.
There are various studies in which EV charging load and microgrids are connected. Fan Wu et al. proposed a method to minimize operating costs through optimal scheduling of the microgrid-type electric vehicle rapid charger [5]. Ronak Deepak Mistry et al. presented the impact of aggregated EV charging stations as flexible load [6]. Mostafa F. Shaaban et al. proposed a joint planning method of EV charging and microgrids [7]. Yan Li et al. proposed the cascade charging strategy for scheduling EV charging [8]. S. G. Liasi et al. suggested the peak shaving of the microgrid using vehicle to gird (V2G) [9,10]. E. Mortaz et al. proposed the energy management system (EMS) of EV and microgrids in connection with the power market [11]. M. Zhang et al. suggested the optimal operation method of microgrids in connection with V2G [12]. C. Chen et al. proposed an economical operation plan for plug-in hybrid EVs [13]. B. Aluisio et al. suggested the optimal operation method of the microgrid considering V2G, and T. Rawat confirmed the effect [14,15]. B. Wang et al. proposed a microgrid scheduling algorithm based on user cost linking V2G [16]. Several studies combining the EV charging load and microgrid design have been conducted, and most major studies have focused on V2G technology. Although V2G is an excellent method to resolve these issues, it has the following limitations. First, V2G technology can only be implemented using a fast charger. However, most fast chargers are developed using a Vienna rectifier to reduce the cost of production that can only operate unidirectionally (grid to vehicle) [17]. Second, because an electricity power trading system must be installed for a small number of users on the microgrid, the cost of installation and operation and management (O&M) may increase. Third, a real-time price system considering weather conditions and load forecasting should be established, which may complicate the operation of the power system. These constraints can be overcome by using time-varying pricing or critical peak pricing to adjust the EV charging pattern. Therefore, this study analyzed the design results of a microgrid system depending on controlled and uncontrolled EV charging loads. On the microgrid, which is a small power grid, the impact of the EV charging load is so great that it must be considered at the design stage. Therefore, this paper simulated the operation of a microgrid for 20 years, taking into account the gradual increase of EVs on the island every year. In addition, the cost benefit of the EV charging load pattern and the solar power generation pattern becoming similar was presented. From the results of this study, the effectiveness of the EV charging demand control was represented under the same capacities of ESS and PV by applying charging control steps in 10% increments. To achieve this, renewable energy sharing, reduction of CO2 emissions, the levelized cost of energy (LCOE), curtailed renewable energy, and an adequate budget for EV charging control were shown to verify the proposed application [18,19,20,21,22,23,24]. Only PV, diesel generators and ESS were considered in the proposed method to show the results because a solar radiation pattern is typically easy to predict and the lack of energy can be supported by the diesel generator. The actual load and weather data of San Cristobal Island in the Galapagos were measured to apply this analysis for a year. Brute force is known as the exhaustive search method used to find the optimal point and make comparisons to the microgrid cost model using the MATLAB program [25].
2. Basic Data Analysis of the Applied Power System
2.1. General and EV Information
The design of the microgrid system was conducted using actual information and measured data from San Cristobal Island in the Galapagos. The main industry of this island is tourism.
Table 1 lists the population for San Cristobal Island, the number of power contract households, and the number of cars and motorcycles. In the calculations, there are several assumptions that are described as follows. First, electric cars and motorcycles have 25 and 3 kWh batteries, respectively. Second, considering the battery capacity of vehicles and low daily mileage on the island, the electric cars are charged once every three days, and the electric motorcycles are charged once every two days. Third, every year, 5% of conventional vehicles will gradually change to EVs. Figure 1 shows the daily EV charging energy requirements by project year. In the final project year, the daily power demand of EVs reaches approximately 4379 kWh.

Table 1.
General and electric vehicle (EV) information of an example island.
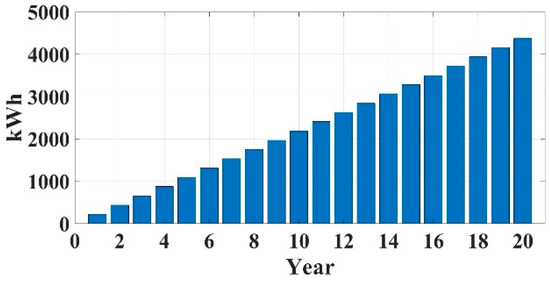
Figure 1.
Daily EV charging consumption by project year.
Fourth, the power system operator or local government can control the EV charging load using their own methods, such as the EV purchase support policy or the charging electricity billing systems. Figure 2 shows the daily EV charging patterns. As shown in Figure 2, typical EV charging loads, denoted by “No control”, which is from the advanced research on EV charging loads of the Nordic region [26], vary according to the owner’s life pattern, as the typical daily load. As the control stage increases, the EV charging load pattern becomes similar to the solar power generation pattern. Although the EV charging load patterns are different, there are integral values for the eleven lines in Figure 2, which implies that the total required energy is the same. These charging curves can be calculated as:
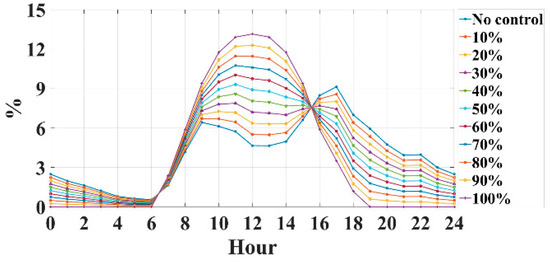
Figure 2.
Daily charging patterns of EV following control steps.
2.2. Conventional Power Load
Figure 3 shows the typical load data measured at the same island power system with general information. The peak load was approximately 2.9 MW in May, and the minimum load was approximately 0.8 MW in December, as shown in Figure 3a,b. Figure 3c shows the histogram and distribution of the load data with a mean of 1.8 MW. From Figure 3d, the usual maximum load occurs at approximately 18:00, which means that human lifestyles generally determine the island load pattern, and the peak contribution of PV is inevitably low. Furthermore, the pattern between the conventional load and the EV charging demand tends to coincide, which further deteriorates the peak contribution of PV generation.
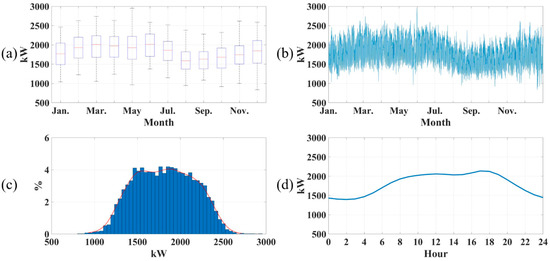
Figure 3.
Load data of an example island: (a) Boxplot, (b) Time series plot, (c) Histogram and distribution, and (d) Average daily time series plot.
2.3. Solar Radiation and Temperature
Figure 4 shows the solar radiation data measured in the same region of the conventional load. In December and April, the monthly average solar radiation reached the highest and lowest levels of 249 and 177 W/m2, respectively, as shown in Figure 4a,b. Figure 4c shows the histogram and distribution of daytime data only. Figure 4d shows the average daily pattern of solar radiation. In this study, the various EV charging patterns changed based on this irradiation pattern. These data were used as input to the solar power output. Figure 5 shows the temperature data synchronized with solar radiation data. As shown in Figure 5a,b, the highest and lowest average monthly temperature was 26.9 and 20.9 °C in January and June, respectively. Figure 5c shows the histogram and distribution of the temperature data with an annual mean of 23.8 °C. The temperature was generally higher during the daytime than at night, as shown in Figure 5d. However, the peak load was recorded between 18:00 and 19:00, according to Figure 3d, because islands generally have fewer facilities that use electricity during the day, such as offices and factories.
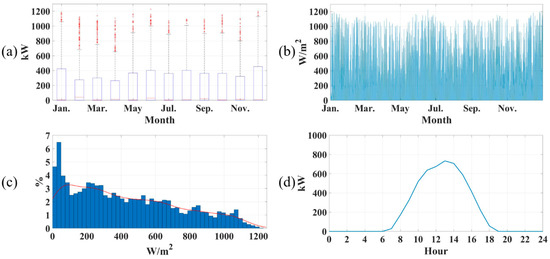
Figure 4.
Solar radiation data of an example island: (a) Boxplot, (b) Time series plot, (c) Histogram and distribution, and (d) Average daily time series plot.
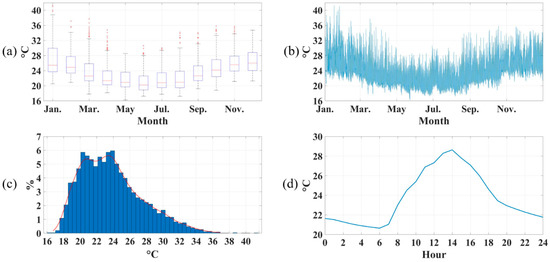
Figure 5.
Temperature data of an example island: (a) Boxplot, (b) Time series plot, (c) Histogram and distribution, and (d) Average daily time series plot.
3. System Modelling
3.1. Photovoltaic
The output of the PV model is calculated using the measured solar radiation and temperature data. These data measured for one year are extrapolated over the duration of the project. The output power of the PV can be expressed as [27]:
where is 1/°C, is 1000 W/m2, and is 25 °C. The output power of the PV system is assumed to include a power conversion system (PCS).
3.2. ESS
The ESS controls the energy balance between demand and supply. It consists of a PCS and a battery, which is typically a lithium-ion battery. Although the PCS capacity of the PV is the same as that of its inverter, is different from because the requirement of should be determined by the sufficient or insufficient power between the renewable energy output and demand load. In this study, the absolute maximum value of considering the unit capacity is determined. The output power of the ESS and the capacity of the inverter can be calculated as:
In Equation (3), the sign of is determined by the power supply and demand. The is the round up operator in Figure 4. If has positive and negative signs, the ESS will be discharged and charged respectively. This energy flow is used to calculate the state of charge (SOC), which can be expressed by the following equation [27]:
3.3. Energy Management System
EMS is essential for the stable operation of a microgrid. Its main purpose is to prevent over-charging and -discharging of the battery. Figure 6 shows simplified EMS logic that can determine the operation of the diesel generator and renewable curtailment. In this logic, the ESS supplies and absorbs power based on the net load when the SOC is within a stable range. If the SOC is above the upper limit, the renewable energy sources are curtailed. Under the lower limit of the SOC, the diesel generator supports the demand load. The final PV output power, including curtailment, diesel operation, and the capacity of the diesel generator can be expressed as [28]:
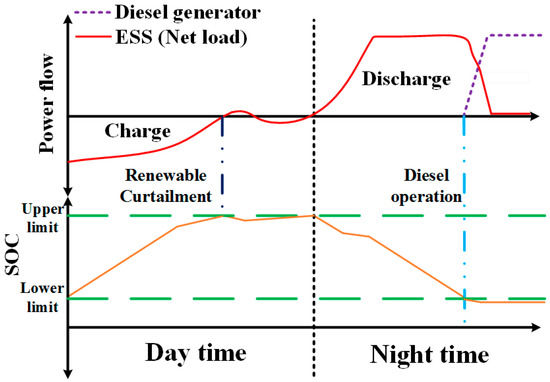
Figure 6.
Simplified energy management system (EMS).
4. Problem Formulation
The main objective function, whose smallest value is the optimal point, focuses on improving the economics of the microgrid, and its determining variables are the capacities of the facilities. The installation cost was taken into account; the project duration and the lifetime of each installation did not match. Therefore, we consider the replacement cost and convert the remaining life into cost. The operating cost was estimated as the fuel cost for the diesel generator. The operating cost was calculated annually for all facilities installed in the microgrid. The total cost function for estimating the capacity of the microgrid and the functions related to the operation cost , installation cost , and maintenance for calculating are expressed as follows:
In Equations (11) and (12), is the remainder operator to calculate the value of the remaining life of the facilities and is the round down operator for calculating the replacement cost of equipment, respectively. From the power flow result and cost functions of Equations (2)–(14), LCOE, renewable energy sharing rate, renewable energy curtailment rate, and CO2 emissions are calculated by Equations (15)–(18). These results are used to verify the effect of EV charging demand control.
Table 2 lists the calculation parameters for the microgrid. These values were determined similar to the actual information. Particularly, the initial SOC has a lower limit because it minimizes the error in the energy inside the original battery. The cost of replacing the equipment is 80% of the initial installation cost because it excludes the civil engineering costs. The project period is set to 20 years according to the life of PV panels. Figure 7 shows the process of estimating the capacity of a microgrid. Because an exhaustive search technique was used, all results were calculated in per unit capacity until the maximum capacity boundaries were reached. The EV charging demand control scenarios were calculated from 0% to 100% in 10% control units.
Table 2.
Calculation parameters.
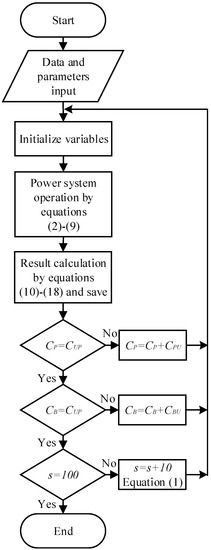
Figure 7.
Calculation process.
5. Simulation Results and Discussion
Figure 8 shows the results of the capacity calculation when the EV charging demand control was not performed. The PV and battery capacities that minimize the overall cost were determined to be 6200 kW and 8500 kWh, respectively. Furthermore, the minimum cost at the optimal point was calculated as USD 72.06 million. Figure 9 shows the results of the power system operation over the 20-year period of the project. It can be confirmed that the output of the diesel generator increased as the PV output degraded and the power load increased. It can be seen that the utilization rate of ESS also gradually decreases as the load increases.
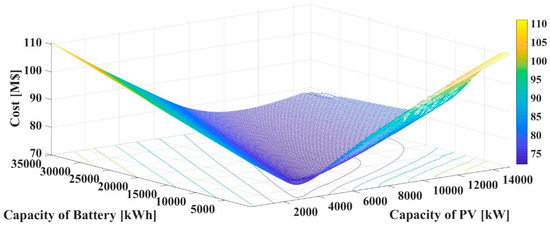
Figure 8.
Optimization result.
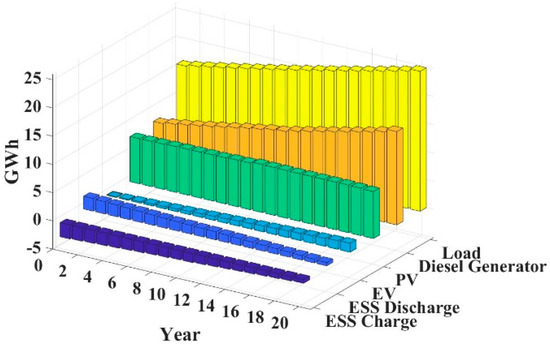
Figure 9.
Annual power system operation result.
Table 3 lists the total cost, renewable energy sharing rate, renewable energy curtailment rate, and CO2 emissions when the same capacity is applied as the result value for each scenario. As the EV charge demand control ratio increased, the total cost gradually decreased, thereby increasing renewable energy sharing and reducing curtailment. The renewable sharing and curtailment in Figure 10 increase and decrease almost linearly; however, the total cost rapidly decreases when the EV charging load is controlled by 70%, as shown in Figure 11. This phenomenon occurs when the required diesel generator capacity decreases and proves that the charging load control reduces the peak load in the evening without PV output as represented in Figure 12. The increase in the peak contribution of PV generation reduced the peak load in the evening, thus avoiding overdesign of diesel power generation. Due to these results, the proposed design initially predicted a linear operating cost reduction, but it was confirmed that the installation and management cost of the diesel generator can be reduced through the shift of the peak load. Figure 13 shows the difference between the total cost of not meeting the charging demand control and the total cost of each scenario, which is the advantage of the EV charging demand control. These advantages can be used by central or local governments to facilitate the spread of EVs, or they can be used for the costs required to control the charging loads, such as monitoring, and the proceeds of EV owners from tariff adjustments. The microgrid, which was the test model of this study, could reduce the total cost by approximately USD 1.1 million, which is 1.52% of the total cost when 100% of the charge load control is achieved. This would give all the 938 EV owners a USD 1172 benefit. Renewable energy sharing increased by 1.7% compared to no control, which was 2.8 GWh. In addition to the above-mentioned advantages, the annual capacity factor of PV rose from 19.07% to 19.39%. Furthermore, the annual renewable curtailment rate was reduced from 12.51% to 11.01%. This can be expected to improve the efficiency by about 1.5% compared to when not controlled.
Table 3.
Calculation results depend on control steps.
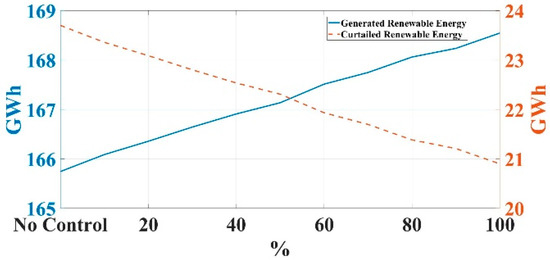
Figure 10.
Renewable sharing and curtailment.
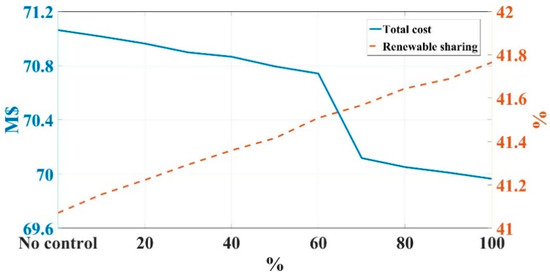
Figure 11.
Total cost and renewable sharing rate.
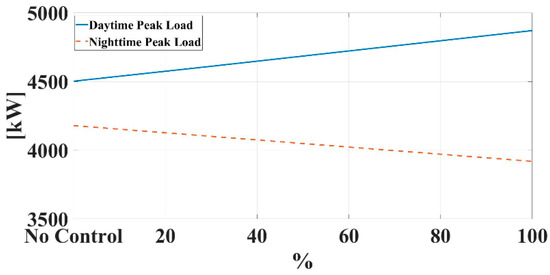
Figure 12.
Day and night peak load.
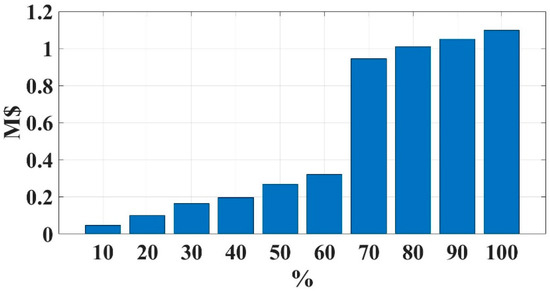
Figure 13.
Benefits of EV charging control.
6. Conclusions
In this study, a microgrid system was designed considering controllable EV charging demand. The effect was analyzed and verified when the EV charging load was controlled by the charging fee or policy without V2G technology and real-time pricing. As a result of capacity calculations and computer analysis, the EV charge demand control could help reduce peak loads in the evening. By reducing the number of diesel generators required, it was proved that the effect is maximized by reducing the installation, operation, and maintenance costs of diesel generators. Additionally, both the renewable energy sharing and CO2 emissions were improved when the EV charging demand control was performed at 100%, which was approximately 2.1 kTon and 2.8 GWh. If microgrids and EVs are considered concurrently in an isolated area, this work will contribute to better operation by calculating the EV charging demand control and its essential costs.
Author Contributions
S.H.C. performed Software, visualization and writing-original draft. G.H.K. performed formal analysis, data curation and writing—original draft. Y.-J.C. provided the methodology, validation and writing—review & editing. E.-H.K. provided the conceptualization, supervision, and writing—review and editing. All authors have read and agreed to the published version of the manuscript.
Funding
This research was funded by KETEP and KEPCO.
Acknowledgments
The Korea Institute of Energy Technology Evaluation and Planning (KETEP) and the Ministry of Trade, Industry & Energy (MOTIE) of the Republic of Korea (No. 20194030202310). This research was supported by Korea Electric Power Corporation. (Grant number: R18XA03).
Conflicts of Interest
The authors declare no conflict of interest.
Nomenclature
| CO2 | Carbon dioxide |
| ESS | Energy storage system |
| EMS | Energy management system |
| EV | Electric vehicle |
| LCOE | Levelized cost of energy |
| O&M | Operation and management |
| PV | Photovoltaic |
| PCS | Power conversion system |
| SOC | State of charge |
| V2G | Vehicle to grid |
| $ | United states dollar |
| Indices | |
| Index of hourly time segments (1, 2, 3, ⋯) | |
| Index of facilities (PV, battery, PCS, diesel generator) | |
| Index of project year (1, 2, 3, ⋯) | |
| Index of EV charging control steps (0–100%) | |
| Variables | |
| Requirement of overall EV charging energy (kWh) | |
| Binary operator for diesel operation | |
| Capacity of battery (kWh) | |
| Capacity of PCS (kW) | |
| Capacity of PV (kW) | |
| Capacity of diesel generator (kW) | |
| Normalized EV charging demand without control (p.u.) | |
| Normalized PV output pattern (p.u.) | |
| Hourly EV charging demand (kW) | |
| Measured hourly conventional power demand (kW) | |
| Hourly output power of ESS (kW) | |
| Hourly output power of diesel generation (kW) | |
| Hourly output power of PV (kW) | |
| Hourly curtailed output power of PV (kW) | |
| SOC of ESS (p.u.) | |
| Total cost of microgrid (M$) | |
| Installation cost (M$) | |
| Remaining lifetime cost (M$) | |
| Operational cost (M$) | |
| Management cost (M$) | |
| Parameters | |
| Cost of diesel generation intercept factor (L/kW) | |
| Cost of diesel generation slope factor (L/kWh) | |
| Unit capacity of inverter (kW) | |
| Unit capacity of battery (kW) | |
| Unit capacity of PV (M$) | |
| Unit capacity of diesel generator (M$) | |
| Upper boundary capacity of battery (kWh) | |
| Upper boundary capacity of PV (kW) | |
| Annual capacity degradation of battery (%/year) | |
| Annual output degradation of PV (%/year) | |
| Minimum operation time of diesel generator (h) | |
| Total efficiency of the ESS (%) | |
| Diesel fuel price ($/L) | |
| Reference solar radiation (W/m2) | |
| Measured solar radiation data (W/m2) | |
| Load growth rate (p.u.) | |
| Installation cost of inverter ($/kW) | |
| Installation cost of battery ($/kWh) | |
| Installation cost of PV ($/kW) | |
| Installation cost of diesel generator ($/kW) | |
| Coefficient of PV output (1/°C) | |
| Lifetime of inverter (years) | |
| Lifetime of battery (years) | |
| Lifetime of PV (years) | |
| Lifetime of diesel generator (years) | |
| Maintenance cost of inverter ($/kW) | |
| Maintenance cost of battery ($/kWh) | |
| Maintenance cost of PV ($/kW) | |
| Maintenance cost of diesel generator ($/kW) | |
| Project duration (years) | |
| Discount rate (p.u.) | |
| Ratio of replacement cost to new inverter (p.u.) | |
| Ratio of replacement cost to new battery (p.u.) | |
| Ratio of replacement cost to new PV (p.u.) | |
| Ratio of replacement cost to new diesel generator (p.u.) | |
| Ratio of renewable sharing (%) | |
| Ratio of renewable curtailment (%) | |
| Lower limit of SOC (p.u.) | |
| Upper limit of SOC (p.u.) | |
| Initial SOC (p.u.) | |
| Measured temperature data (°C) | |
| Reference temperature (°C) | |
References
- Lasseter, R.H. MicroGrids. In Proceedings of the 2002 IEEE Power Engineering Society Winter Meeting. Conference Proceedings (Cat. No.02CH37309), New York, NY, USA, 27–31 January 2002. [Google Scholar]
- Guoping, Z.; Weijun, W.; Longbo, M. An Overview of Microgrid Planning and Design Method. In Proceedings of the 2018 IEEE 3rd Advanced Information Technology, Electronic and Automation Control Conference (IAEAC), Chongqing, China, 12–14 October 2018. [Google Scholar]
- Sharmila, N.; Natarj, K.R.; Rekha, K.R. An Overview on Design and Control Schemes of Microgrid. In Proceedings of the 2019 Global Conference for Advancement in Technology (GCAT), Bangaluru, India, 18–20 October 2019. [Google Scholar]
- Zhang, Y.; Teng, Y.; Zhang, Z.; Li, J.; Jiang, R.; Huang, Q. Scheduling optimization of microgrid considering electric vehicles. In Proceedings of the 2017 2nd International Conference on Power and Renewable Energy (ICPRE), Chengdu, China, 20–23 September 2017. [Google Scholar]
- Wu, F.; Zhou, Y.; Feng, D.; Shi, Y.; Lei, T.; Fang, C. Day-Ahead Scheduling of a Microgrid-Like Fast Charging Station. In Proceedings of the 2019 IEEE 3rd International Electrical and Energy Conference (CIEEC), Beijing, China, 7–9 September 2019. [Google Scholar]
- Mistry, R.D.; Eluyemi, F.T.; Masaud, T.M. Impact of aggregated EVs charging station on the optimal scheduling of battery storage system in islanded microgrid. In Proceedings of the 2017 North American Power Symposium (NAPS), Morgantown, WV, USA, 17–19 September 2017. [Google Scholar]
- Shaaban, M.F.; Mohamed, S.; Ismail, M.; Qaraqe, K.A.; Serpedin, E. Joint Planning of Smart EV Charging Stations and DGs in Eco-Friendly Remote Hybrid Microgrids. IEEE Trans. Smart Grid 2019, 10, 5819–5830. [Google Scholar] [CrossRef]
- Li, Y.; Han, P.; Wang, J.; Song, X. Modeling and optimization oriented to the micro-grid-EV joint system. In Proceedings of the 2016 12th International Conference on Natural Computation, Fuzzy Systems and Knowledge Discovery (ICNC-FSKD), Changsha, China, 13–15 August 2016. [Google Scholar]
- Liasi, S.G.; Bathaee, S.M.T. Optimizing microgrid using demand response and electric vehicles connection to microgrid. In Proceedings of the 2017 Smart Grid Conference (SGC), Tehran, Iran, 20–21 December 2017. [Google Scholar]
- Liasi, S.G.; Golkar, M.A. Electric vehicles connection to microgrid effects on peak demand with and without demand response. In Proceedings of the 2017 Iranian Conference on Electrical Engineering (ICEE), Tehran, Iran, 2–4 May 2017. [Google Scholar]
- Mortaz, E.; Valenzuela, J. Microgrid energy scheduling using storage from electric vehicles. Electr. Power Syst. Res. 2017, 143, 554–562. [Google Scholar] [CrossRef]
- Zhang, M.; Chen, J. The Energy Management and Optimized Operation of Electric Vehicles Based on Microgrid. IEEE Trans. Power Deliv. 2014, 29, 1427–1435. [Google Scholar] [CrossRef]
- Chen, C.; Duan, S. Microgrid economic operation considering plug-in hybrid electric vehicles integration. J. Mod. Power Syst. Clean Energy 2015, 3, 221–231. [Google Scholar] [CrossRef]
- Aluisio, B.; Conserva, A.; Dicorato, M.; Forte, G.; Trovato, M. Optimal operation planning of V2G-equipped Microgrid in the presence of EV aggregator. Electr. Power Syst. Res. 2017, 152, 295–305. [Google Scholar] [CrossRef]
- Rawat, T.; Niazi, K.R. Impact of EV charging/discharging strategies on the optimal operation of islanded microgrid. J. Eng. 2019, 2019, 4819–4823. [Google Scholar] [CrossRef]
- Wang, B.; Hu, Y.; Zeng, F. A user cost and convenience oriented EV charging and discharging scheduling algorithm in V2G based microgrid. In Proceedings of the 2017 International Conference on Circuits, Devices and Systems (ICCDS), Chengdu, China, 5–8 September 2017. [Google Scholar]
- Liu, S.; Jiang, J.; Cheng, G. Research on Vector Control Strategy of Three Phase VIENNA Rectifier Employed in EV Charger. In Proceedings of the 2019 Chinese Control and Decision Conference (CCDC), Nanchang, China, 3–5 June 2019. [Google Scholar]
- Kanchev, H.; Lu, D.; Colas, F.; Lazarov, V.; Francois, B. Energy Management and Operational Planning of a Microgrid with a PV-Based Active Generator for Smart Grid Applications. IEEE Trans. Ind. Electron. 2011, 58, 4583–4592. [Google Scholar] [CrossRef]
- Moshi, G.G.; Bovo, C.; Berizzi, A. Optimal operational planning for PV-Wind-Diesel-battery microgrid. In Proceedings of the 2015 IEEE Eindhoven PowerTech, Eindhoven, The Netherlands, 29 June–2 July 2015. [Google Scholar]
- Bhattacharya, S.; Mishra, S. Coordinated decentralized control for PV-EV based Grid connected Microgrids. In Proceedings of the 2016 IEEE 6th International Conference on Power Systems (ICPS), New Delhi, India, 4–6 March 2016. [Google Scholar]
- Zhaoxia, X.; Hui, L.; Tianli, Z.; Huaimin, L. Day-ahead Optimal Scheduling Strategy of Microgrid with EVs Charging Station. In Proceedings of the 2019 IEEE 10th International Symposium on Power Electronics for Distributed Generation Systems (PEDG), Xi’an, China, 3–6 June 2019. [Google Scholar]
- Khorramdel, H.; Aghaei, J.; Khorramdel, B.; Siano, P. Optimal Battery Sizing in Microgrids Using Probabilistic Unit Commitment. IEEE Trans. Ind. Inform. 2016, 12, 834–843. [Google Scholar] [CrossRef]
- Bahramirad, S.; Reder, W.; Khodaei, A. Reliability-Constrained Optimal Sizing of Energy Storage System in a Microgrid. IEEE Trans. Smart Grid 2012, 3, 2056–2062. [Google Scholar] [CrossRef]
- Atia, R.; Yamada, N. Sizing and Analysis of Renewable Energy and Battery Systems in Residential Microgrids. IEEE Trans. Smart Grid 2016, 7, 1204–1213. [Google Scholar] [CrossRef]
- Pecenak, Z.K.; Stadler, M.; Fahy, K. Efficient multi-year economic energy planning in microgrids. Appl. Energy 2019, 255, 113771. [Google Scholar] [CrossRef]
- Liu, Z.; Wu, Q.; Nielsen, A.; Wang, Y. Day-Ahead Energy Planning with 100% Electric Vehicle Penetration in the Nordic Region by 2050. Energies 2014, 7, 1733–1749. [Google Scholar] [CrossRef]
- Borhanazad, H.; Mekhilef, S.; Ganapathy, V.G.; Modiri-Delshad, M.; Mirtaheri, A. Optimization of micro-grid system using MOPSO. Renew. Energy 2014, 71, 295–306. [Google Scholar] [CrossRef]
- Dufo-López, R.; Bernal-Agustín, J.L. Multi-objective design of PV–wind–diesel–hydrogen–battery systems. Renew. Energy 2008, 33, 2559–2572. [Google Scholar] [CrossRef]
Publisher’s Note: MDPI stays neutral with regard to jurisdictional claims in published maps and institutional affiliations. |
© 2020 by the authors. Licensee MDPI, Basel, Switzerland. This article is an open access article distributed under the terms and conditions of the Creative Commons Attribution (CC BY) license (http://creativecommons.org/licenses/by/4.0/).