Assessing Ecological Carrying Capacity in the Guangdong-Hong Kong-Macao Greater Bay Area Based on a Three-Dimensional Ecological Footprint Model


Abstract
1. Introduction
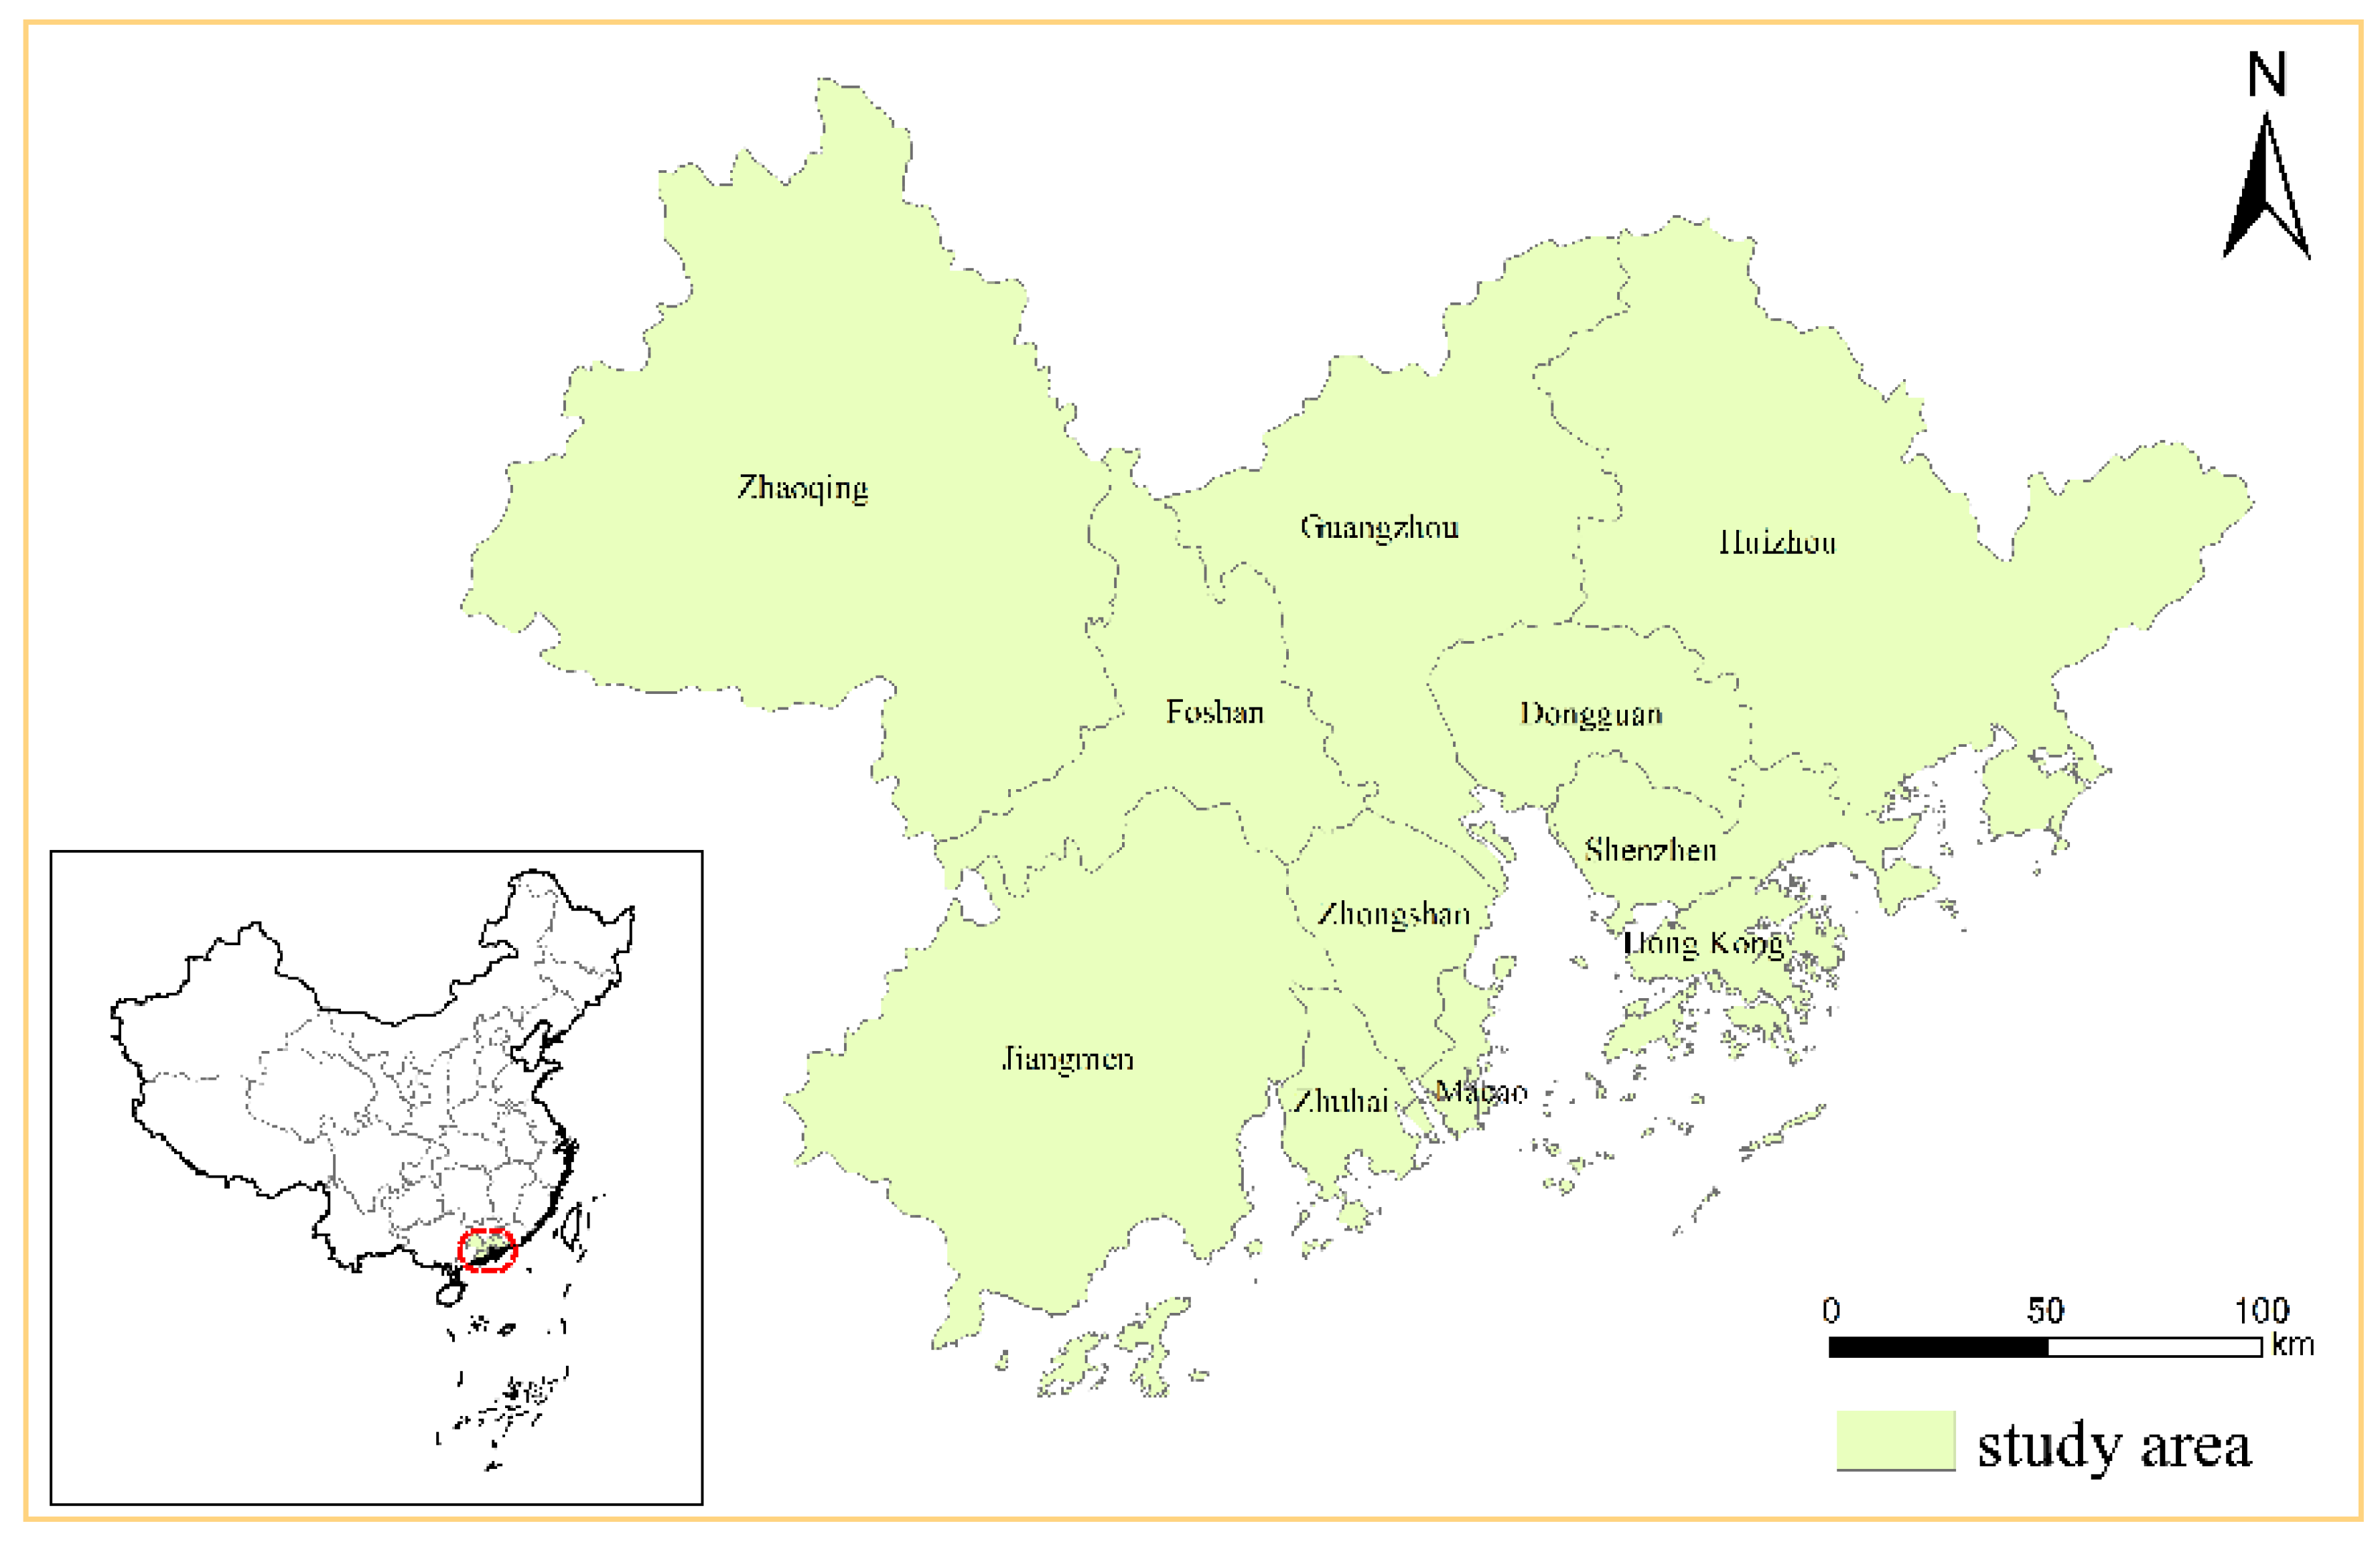
2. Study Area
3. Materials and Methods
3.1. Materials
3.2. Methods
4. Results
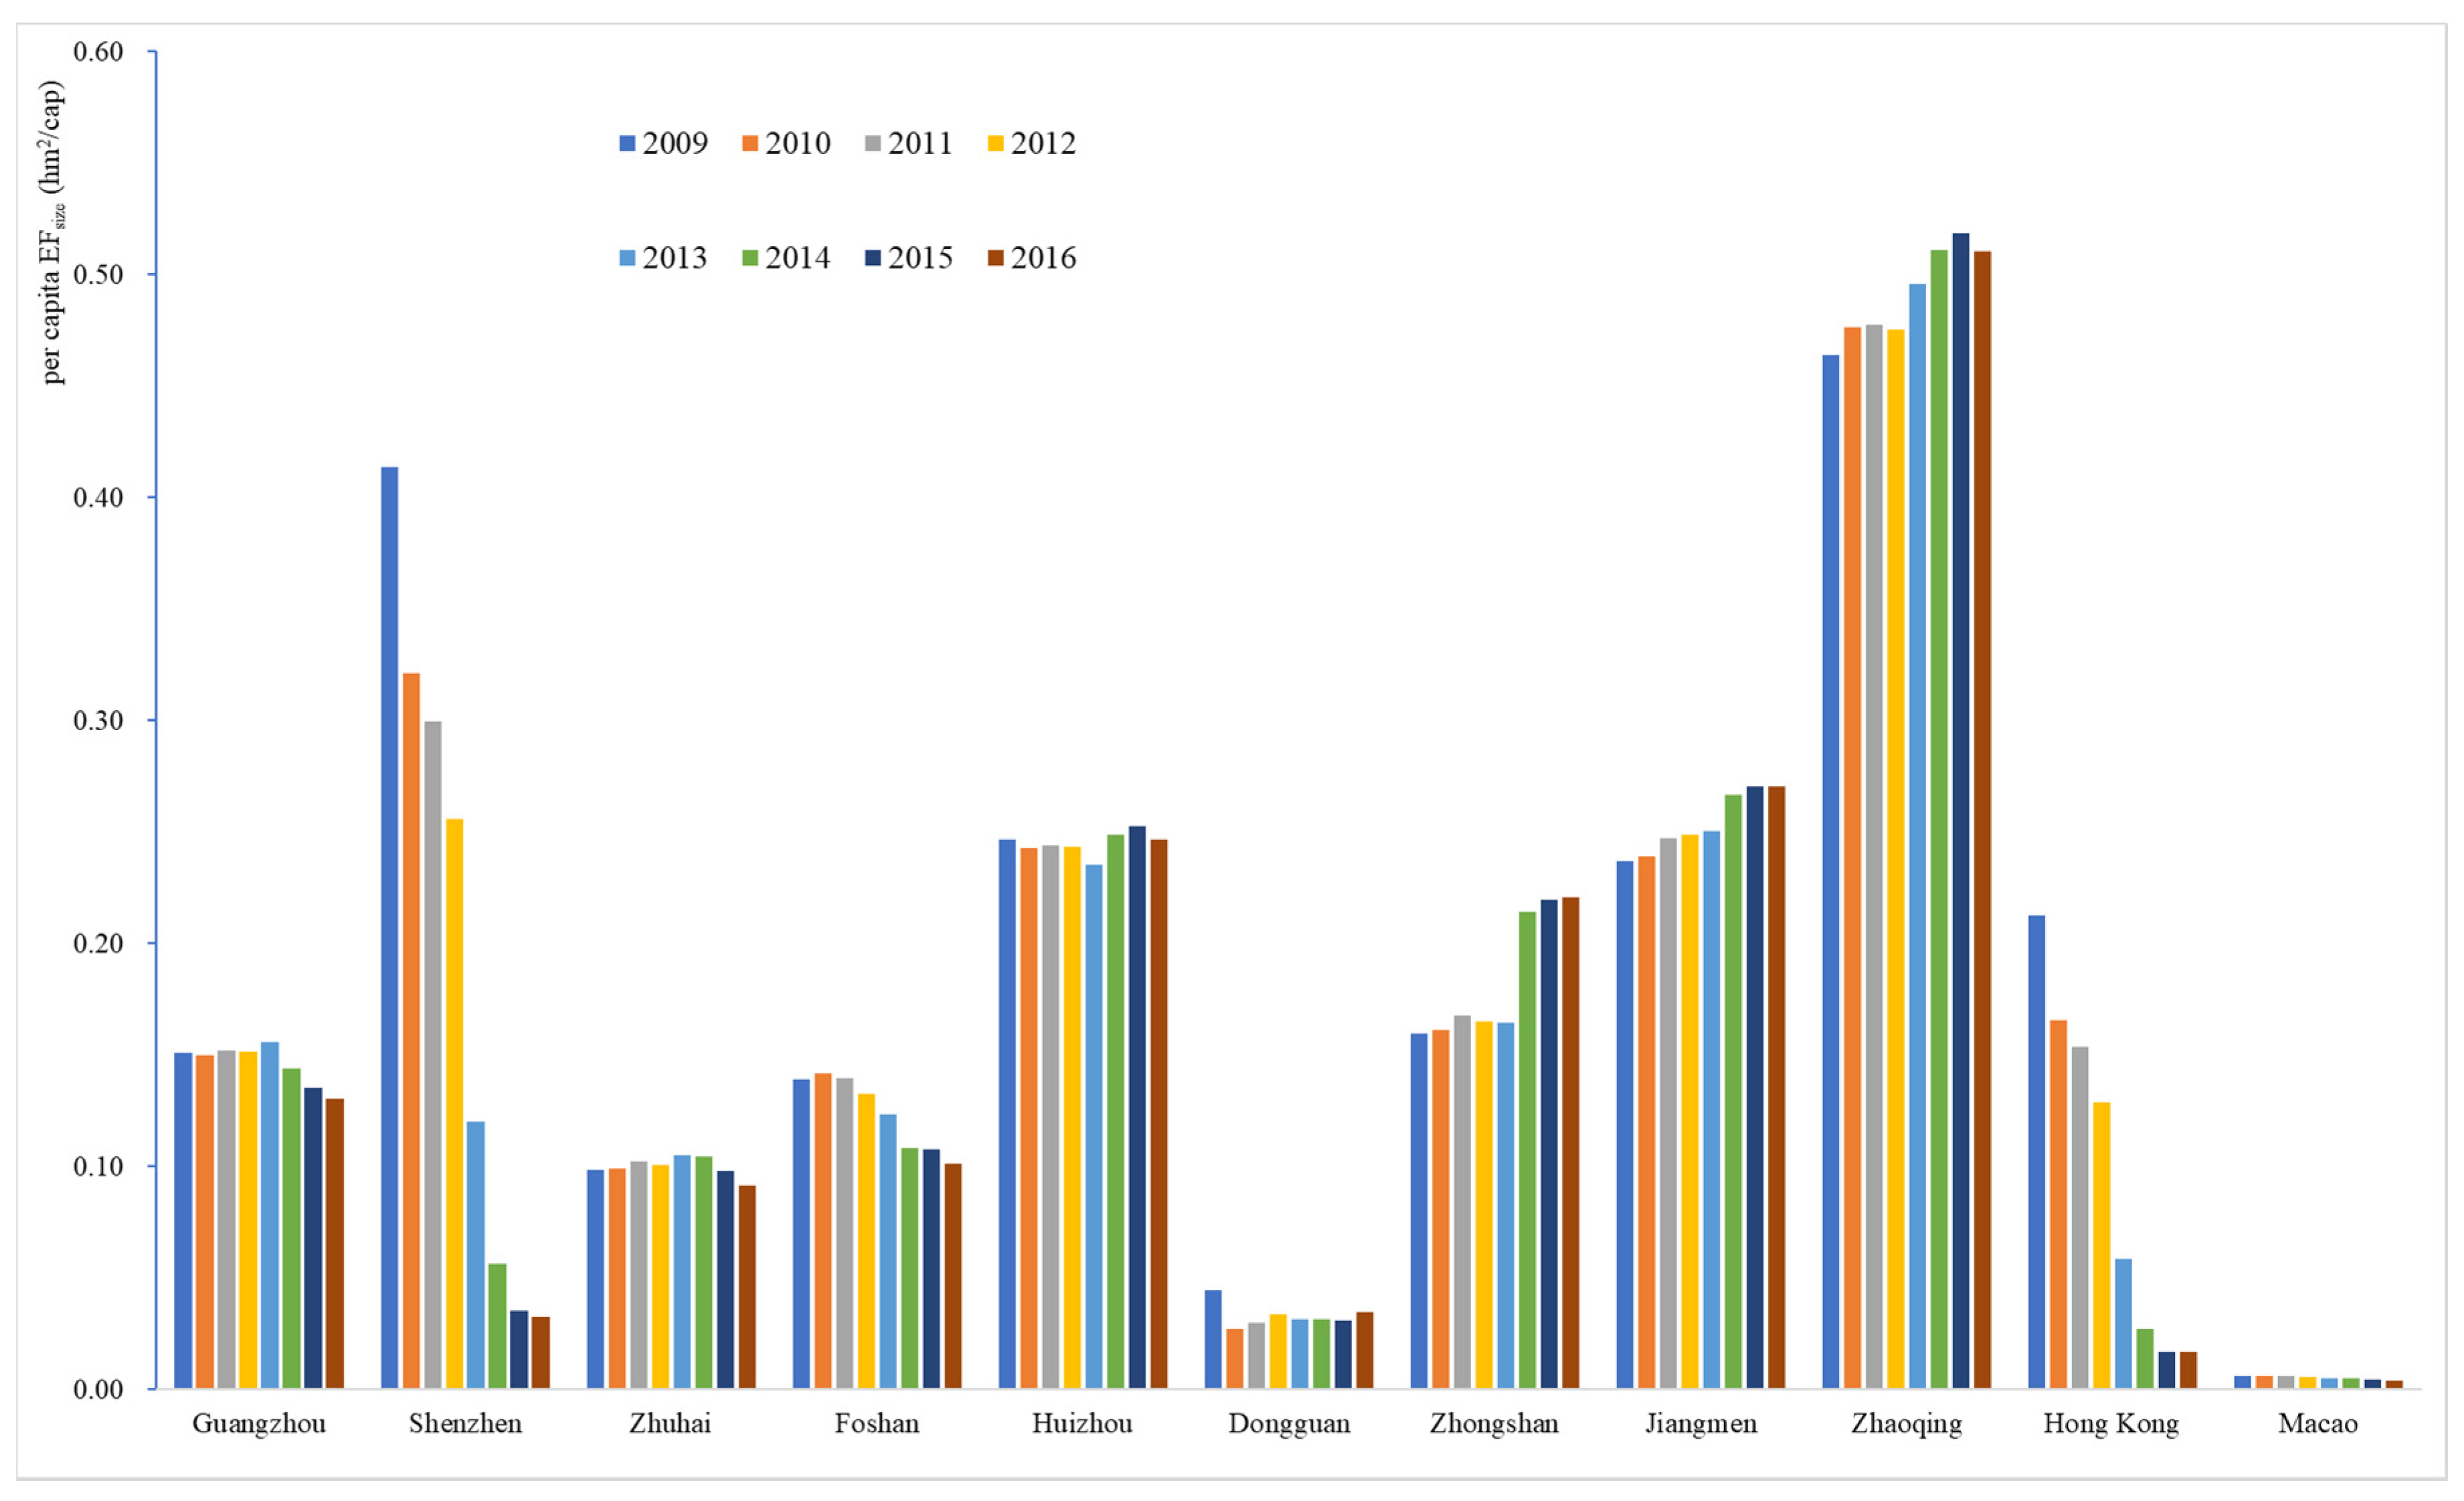
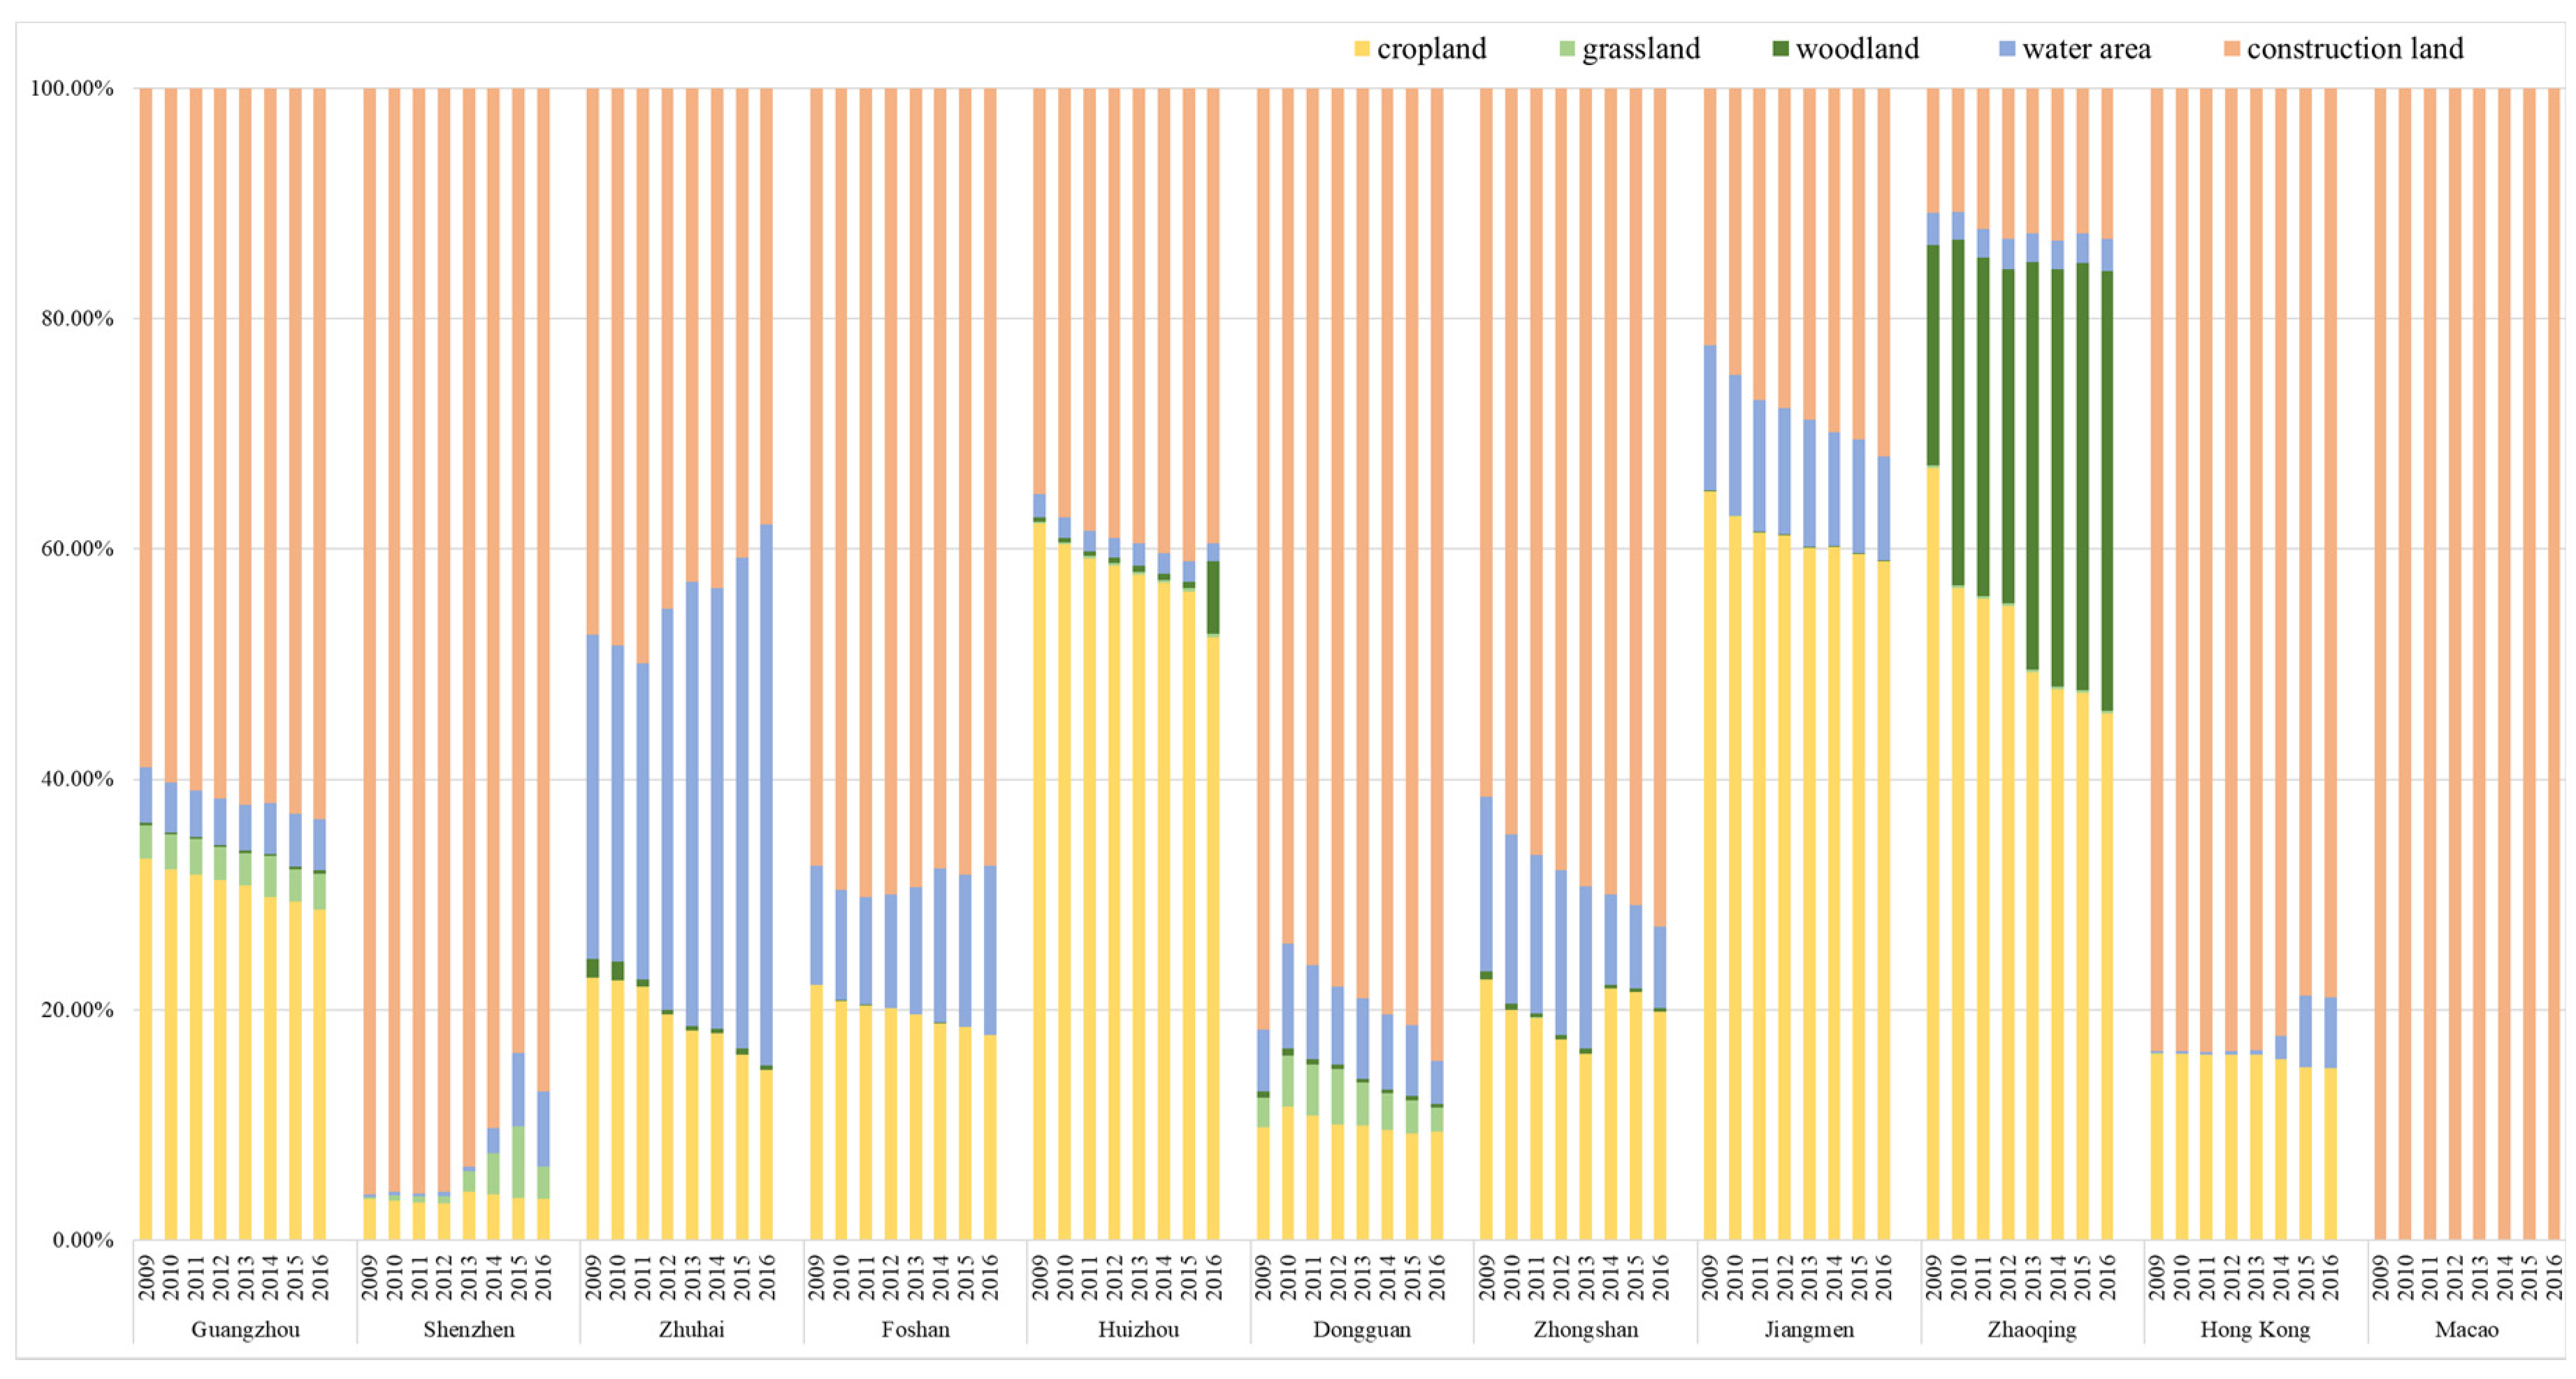
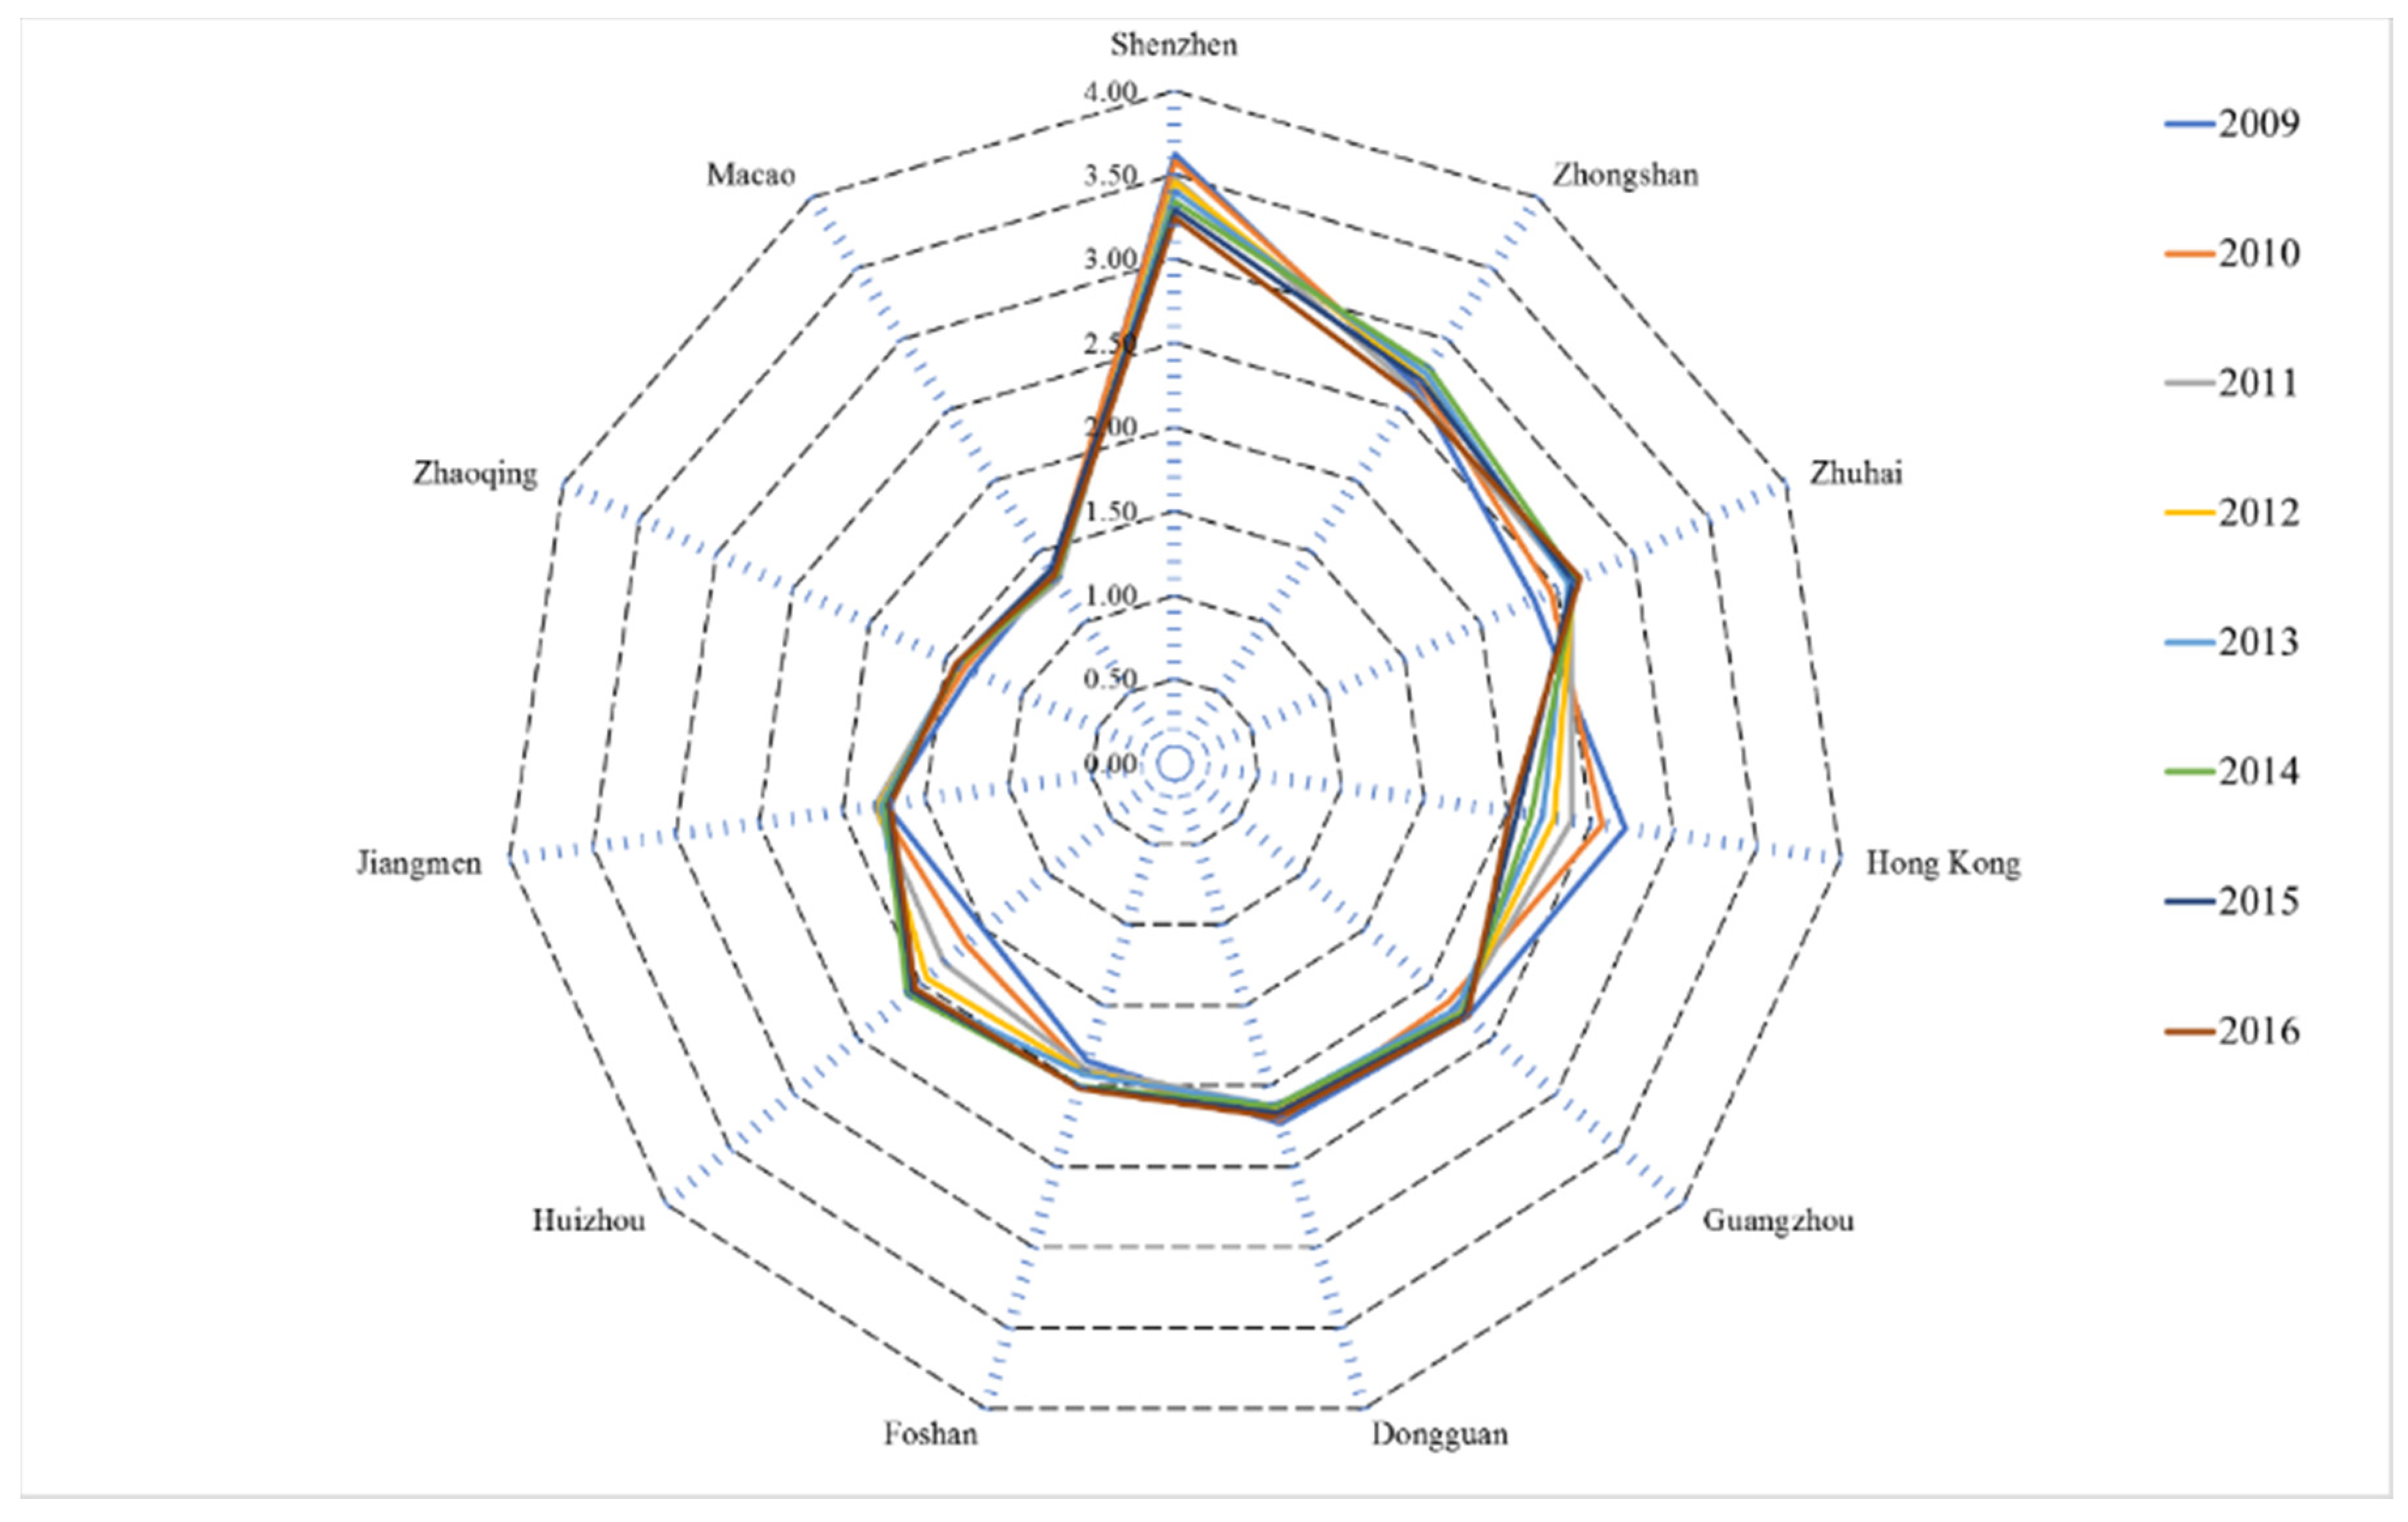
4.1. Analysis of Ecological Footprint Size
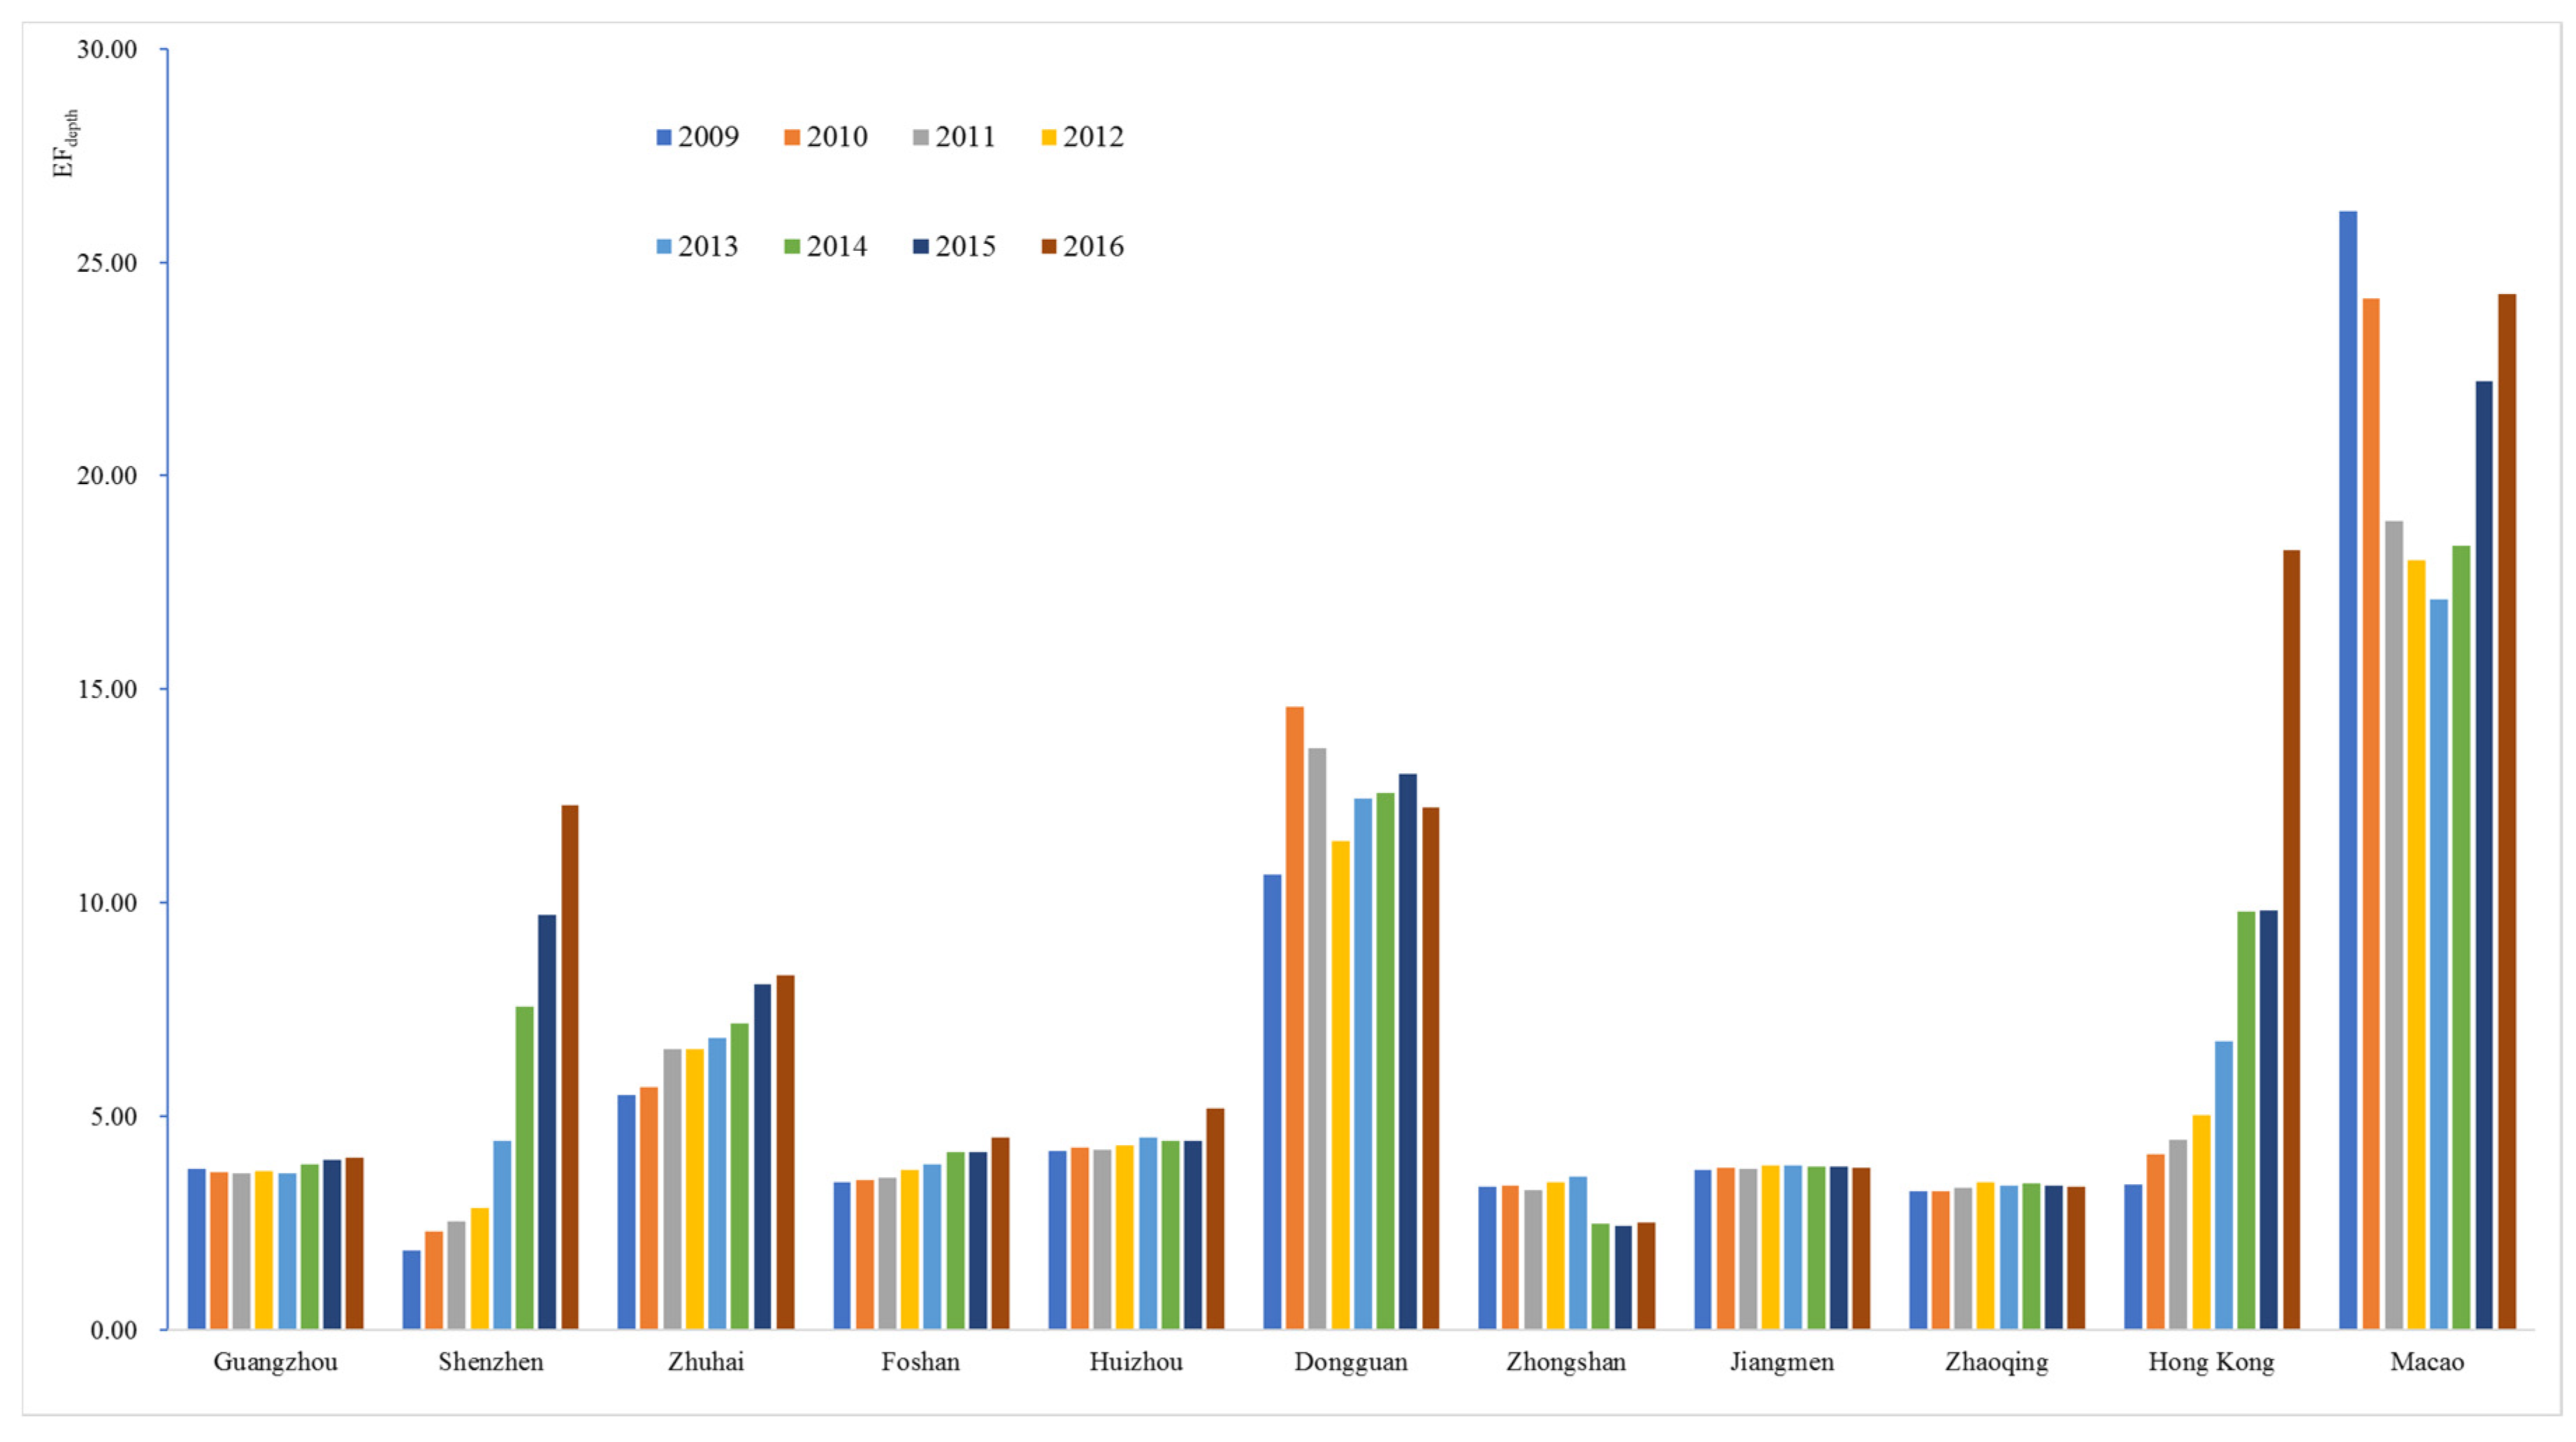
4.2. Analysis of Ecological Footprint Depth
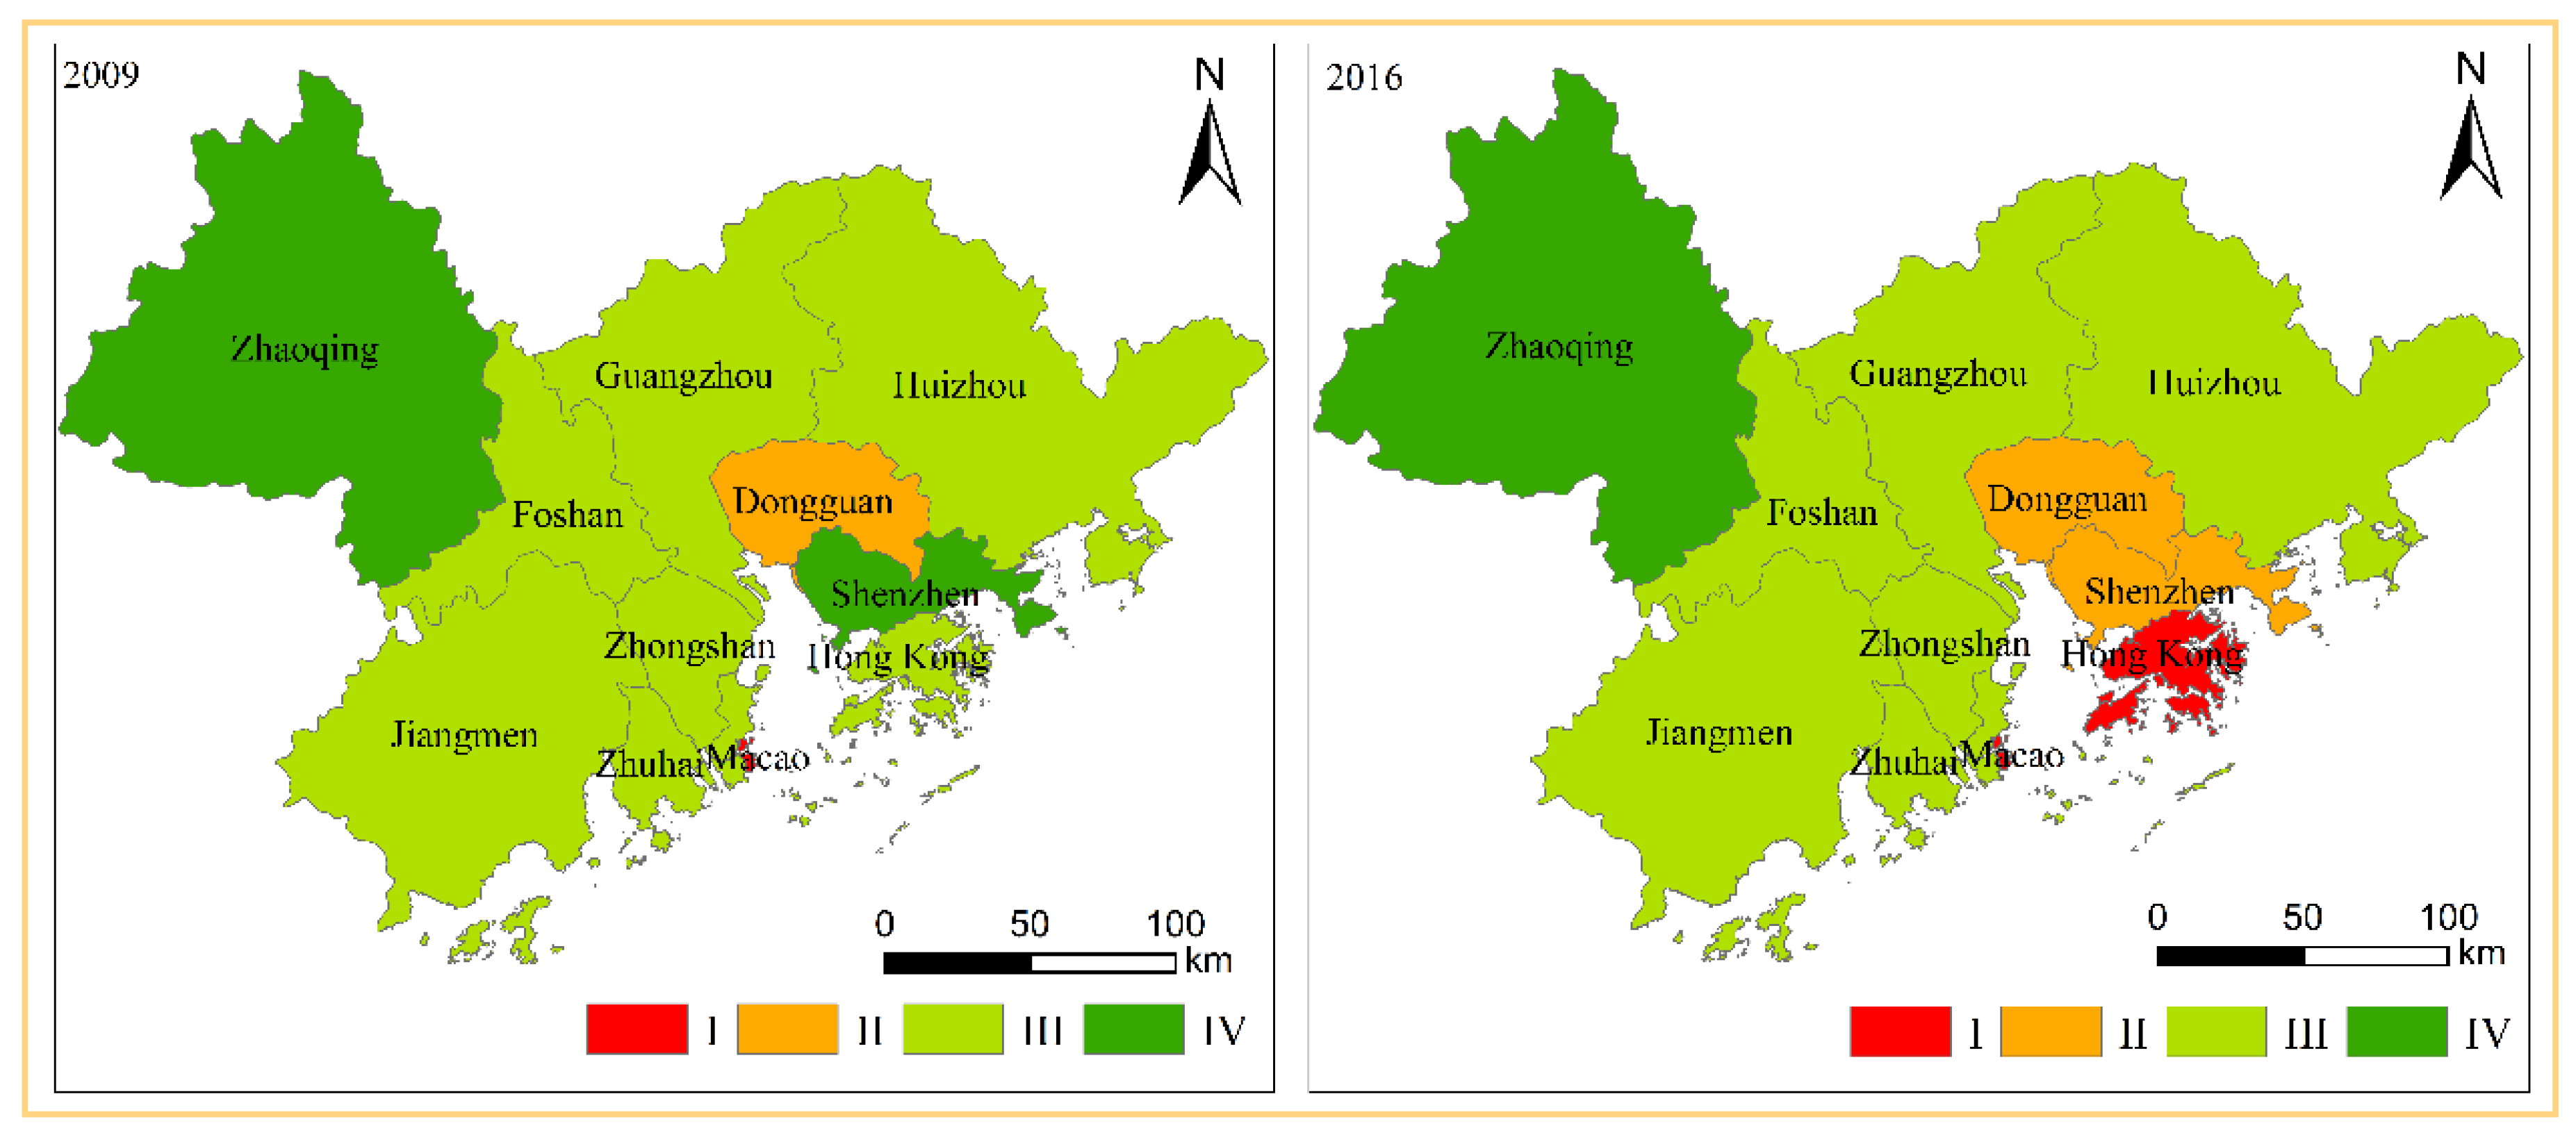
4.3. Analysis of Ecological Carrying Capacity Intensity
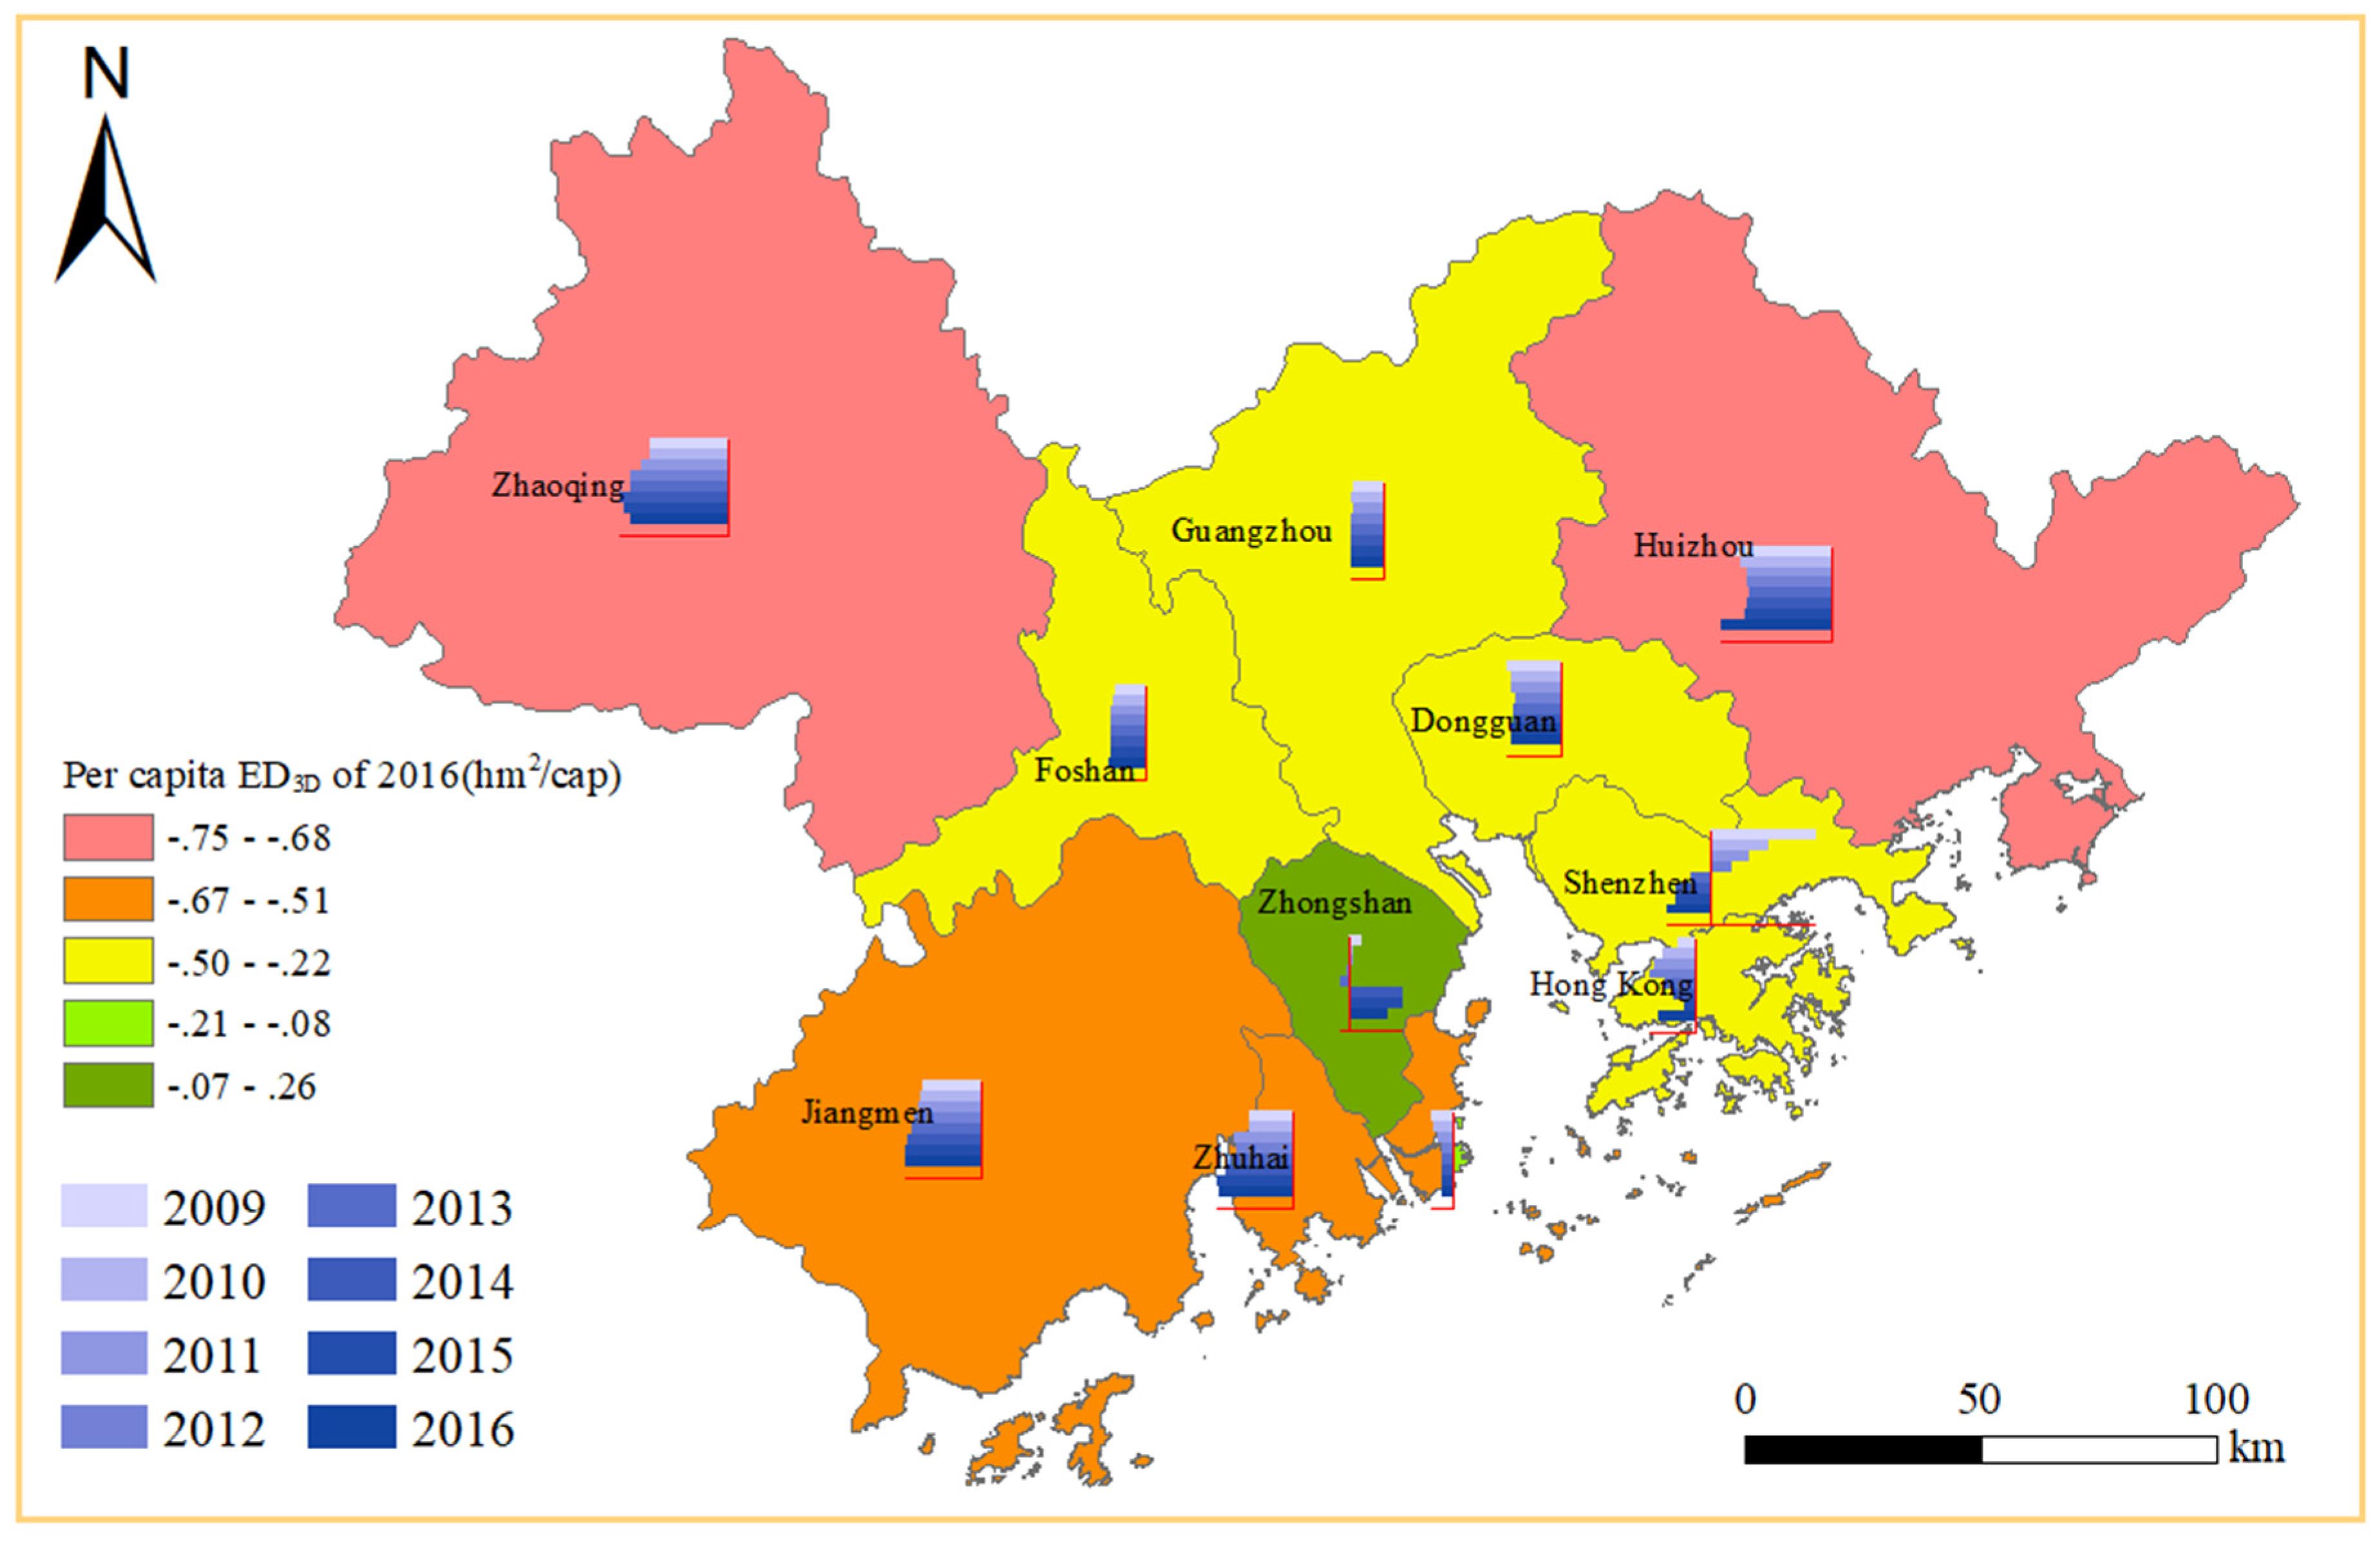
4.4. Analysis of Three-Dimensional Ecological Deficit
5. Discussion
5.1. Spatial Analysis of Natural Capital Utilization
5.2. Driving Factors Analysis of Ecological Footprint and Carrying Capacity
5.3. Implications for Ecological Deficit Mitigation
5.4. Uncertainty Analysis of ECintensity
6. Conclusions
Author Contributions
Funding
Acknowledgments
Conflicts of Interest
References
- Ress, W.E.; Wackernagel, M. Ecological Footprints and Appropriated Carrying Capacity: Measuring the Natural Capital Requirements of the Human Economy. Focus 1996, 6, 45–60. [Google Scholar] [CrossRef]
- Wackernagel, M.; Rees, W.E. Perceptual and structural barriers to investing in natural capital: Economics from an ecological footprint perspective. Ecol. Econ. 1997, 20, 3–24. [Google Scholar] [CrossRef]
- Galli, A.; Kitzes, J.; Niccolucci, V.; Wackernagel, M.; Wada, Y.; Marchettini, N. Assessing the global environmental consequences of economic growth through the Ecological Footprint: A focus on China and India. Ecol. Indic. 2012, 17, 99–107. [Google Scholar] [CrossRef]
- Lane, M. The carrying capacity imperative: Assessing regional carrying capacity methodologies for sustainable land-use planning. Land Use Policy 2010, 27, 1038–1045. [Google Scholar] [CrossRef]
- Mostafa, M.M. A Bayesian approach to analyzing the ecological footprint of 140 nations. Ecol. Indic. 2010, 10, 808–817. [Google Scholar] [CrossRef]
- Wood, R.; Garnett, S. An assessment of environmental sustainability in Northern Australia using the ecological footprint and with reference to Indigenous populations and remoteness. Ecol. Econ. 2009, 68, 1375–1384. [Google Scholar] [CrossRef]
- Borucke, M.; Moore, D.; Cranston, G.; Gracey, K.; Iha, K.; Larson, J.; Lazarus, E.; Morales, J.C.; Wackernagel, M.; Galli, A. Accounting for demand and supply of the biosphere’s regenerative capacity: The National Footprint Accounts’ underlying methodology and framework. Ecol. Indic. 2013, 24, 518–533. [Google Scholar] [CrossRef]
- Zhang, K.; Fu, S.; Zhang, W. Ecological carrying capacity of 31 provinces based on improved ecological footprint model. Sci. Geogr. Sin. 2011, 31, 1084–1089. [Google Scholar] [CrossRef]
- Yue, D.; Xu, X.; Hui, C.; Xiong, Y.; Han, X.; Ma, J. Biocapacity supply and demand in Northwestern China: A spatial appraisal of sustainability. Ecol. Econ. 2011, 70, 988–994. [Google Scholar] [CrossRef]
- Geng, Y.; Zhang, L.; Chen, X.; Xue, B.; Fujita, T.; Dong, H. Urban ecological footprint analysis: A comparative study between Shenyang in China and Kawasaki in Japan. J. Clean. Prod. 2014, 75, 130–142. [Google Scholar] [CrossRef]
- Pan, H.; Zhuang, M.; Geng, Y.; Wu, F.; Dong, H. Emergy-based ecological footprint analysis for a mega-city: The dynamic changes of Shanghai. J. Clean. Prod. 2019, 210, 552–562. [Google Scholar] [CrossRef]
- Niccolucci, V.; Bastianoni, S.; Tiezzi, E.B.P.; Wackernagel, M.; Marchettini, N. How deep is the footprint? A 3D representation. Ecol. Model. 2009, 220, 2819–2823. [Google Scholar] [CrossRef]
- Niccolucci, V.; Galli, A.; Reed, A.; Neri, E.; Wackernagel, M.; Bastianoni, S. Towards a 3D National Ecological Footprint Geography. Ecol. Model. 2011, 222, 2939–2944. [Google Scholar] [CrossRef]
- Fang, K.; Reinout, H. A review on three-dimensional ecological footprint model for natural capital accounting. Prog. Geogr. 2012, 31, 1700–1707. [Google Scholar] [CrossRef]
- Fang, K. Assessing the natural capital use of eleven nations: An application of a revised three-dimensional model of ecological footprint. Acta Ecol. Sin. 2015, 35, 3766–3777. [Google Scholar] [CrossRef]
- Peng, J.; Du, Y.; Ma, J.; Liu, Z.; Liu, Y.; Wei, H. Sustainability evaluation of natural capital utilization based on 3DEF model: A case study in Beijing City, China. Ecol. Indic. 2015, 58, 254–266. [Google Scholar] [CrossRef]
- Du, Y.; Peng, J.; Gao, Y.; Zhao, H. Sustainability evaluation of natural capital utilization based on a three-dimensional ecological footprint model: A case study of the Beijing-Tianjin-Hebei Metropolitan region. Prog. Geogr. 2016, 35, 1186–1196. [Google Scholar] [CrossRef][Green Version]
- Xun, F.; Hu, Y. Evaluation of ecological sustainability based on a revised three-dimensional ecological footprint model in Shandong Province, China. Sci. Total Environ. 2019, 649, 582–591. [Google Scholar] [CrossRef]
- Yang, Y.; Ling, S.; Zhang, T.; Yao, C. Three-dimensional ecological footprint assessment for ecologically sensitive areas: A case study of the Southern Qin Ling piedmont in Shaanxi, China. J. Clean. Prod. 2018, 194, 540–553. [Google Scholar] [CrossRef]
- Yang, Y.; Hu, D. Natural capital utilization based on a three-dimensional ecological footprint model: A case study in northern Shaanxi, China. Ecol. Indic. 2018, 87, 178–188. [Google Scholar] [CrossRef]
- Destek, M.A.; Sarkodie, S.A. Investigation of environmental Kuznets curve for ecological footprint: The role of energy and financial development. Sci. Total Environ. 2019, 650, 2483–2489. [Google Scholar] [CrossRef] [PubMed]
- Wetzel, K.R.; Wetzel, J.F. Sizing the earth: Recognition of economic carrying capacity. Ecol. Econ. 1995, 12, 13–21. [Google Scholar] [CrossRef]
- Waggoner, P.E.; Ausubel, J.H. A framework for sustainability science: A renovated IPAT identity. Proc. Natl. Acad. Sci. USA 2002, 99, 7860–7865. [Google Scholar] [CrossRef] [PubMed]
- York, R.; Rosa, E.A.; Dietz, T. STIRPAT, IPAT and ImPACT: Analytic tools for unpacking the driving forces of environmental impacts. Ecol. Econ. 2003, 46, 351–365. [Google Scholar] [CrossRef]
- Solarin, S.A.; Bello, M.O. Persistence of policy shocks to an environmental degradation index: The case of ecological footprint in 128 developed and developing countries. Ecol. Indic. 2018, 89, 35–44. [Google Scholar] [CrossRef]
- Sun, J.W. Changes in energy consumption and energy intensity: A complete decomposition model. Energy Econ. 1998, 20, 85–100. [Google Scholar] [CrossRef]
- Al-mulali, U. The investigation of environmental Kuznets curve hypothesis in the advanced economies: The role of energy prices. Renew. Sustain. Energy Rev. 2016, 54, 1622–1631. [Google Scholar] [CrossRef]
- Zhang, X.; Zeng, H. Dynamic of three dimensional ecological footprint in the Pearl River Delta and its driving factors. Acta Sci. Circumstantiae 2017, 37, 771–778. [Google Scholar] [CrossRef]
- Andersson, J.O.; Lindroth, M. Ecologically unsustainable trade. Ecol. Econ. 2001, 37, 113–122. [Google Scholar] [CrossRef]
- Al-Mulali, U.; Weng-Wai, C.; Sheau-Ting, L.; Mohammed, A.H. Investigating the environmental Kuznets curve (EKC) hypothesis by utilizing the ecological footprint as an indicator of environmental degradation. Ecol. Indic. 2015, 48, 315–323. [Google Scholar] [CrossRef]
- Uddin, G.A.; Salahuddin, M.; Alam, K.; Gow, J. Ecological footprint and real income: Panel data evidence from the 27 highest emitting countries. Ecol. Indic. 2017, 77, 166–175. [Google Scholar] [CrossRef]
- Ulucak, R.; Bilgili, F. A reinvestigation of EKC model by ecological footprint measurement for high, middle and low income countries. J. Clean. Prod. 2018, 188, 144–157. [Google Scholar] [CrossRef]
- Jia, J.; Deng, H.; Duan, J.; Zhao, J. Analysis of the major drivers of the ecological footprint using the STIRPAT model and the PLS method-A case study in Henan Province, China. Ecol. Econ. 2009, 68, 2818–2824. [Google Scholar] [CrossRef]
- McDonald, G.W.; Patterson, M.G. Ecological Footprints and interdependencies of New Zealand regions. Ecol. Econ. 2004, 50, 49–67. [Google Scholar] [CrossRef]
- Chankrajang, T.; Muttarak, R. Green Returns to Education: Does Schooling Contribute to Pro-Environmental Behaviours? Evidence from Thailand. Ecol. Econ. 2017, 131, 434–448. [Google Scholar] [CrossRef]
- Charfeddine, L.; Mrabet, Z. The impact of economic development and social-political factors on ecological footprint: A panel data analysis for 15 MENA countries. Renew. Sustain. Energy Rev. 2017, 76, 138–154. [Google Scholar] [CrossRef]
- Wang, Y.; Jiang, Y.; Zheng, Y.; Wang, H. Assessing the ecological carrying capacity based on revised three-dimensional ecological footprint model in Inner Mongolia, China. Sustainability 2019, 11, 2002. [Google Scholar] [CrossRef]
- Alola, A.A.; Bekun, F.V.; Sarkodie, S.A. Dynamic impact of trade policy, economic growth, fertility rate, renewable and non-renewable energy consumption on ecological footprint in Europe. Sci. Total Environ. 2019, 685, 702–709. [Google Scholar] [CrossRef]
- Pickett, S.T.A.; Cadenasso, M.L.; Childers, D.L.; Mcdonnell, M.J.; Zhou, W. Evolution and future of urban ecological science: Ecology in, of, and for the city. Ecosyst. Health Sustain. 2016, 2, e01229. [Google Scholar] [CrossRef]
- Steffen, W.; Richardson, K.; Rockström, J.; Cornell, S.E.; Fetzer, I.; Bennett, E.M.; Biggs, R.; Carpenter, S.R.; De Vries, W.; De Wit, C.A.; et al. Planetary boundaries: Guiding human development on a changing planet. Science 2015, 347, 1259855. [Google Scholar] [CrossRef]
- Haberl, H.; Erb, K.H.; Krausmann, F. How to calculate and interpret ecological footprints for long periods of time: The case of Austria 1926–1995. Ecol. Econ. 2001, 38, 25–45. [Google Scholar] [CrossRef]
- Krausmann, F.; Erb, K.H.; Gingrich, S.; Lauk, C.; Haberl, H. Global patterns of socioeconomic biomass flows in the year 2000: A comprehensive assessment of supply, consumption and constraints. Ecol. Econ. 2008, 65, 471–487. [Google Scholar] [CrossRef]
- Borucke, M.; Galli, A.; Iha, K.; Mattoon, S.; Morales, J.; Poblete, P.; Wackernagal, M. The National Footprint Accounts, 2012 Edition; Global Footprint Network: Oakland, CA, USA, 2012. [Google Scholar]
- Gong, P.; Liu, H.; Zhang, M.; Li, C.; Wang, J.; Huang, H.; Clinton, N.; Ji, L.; Li, W.; Bai, Y.; et al. Stable classification with limited sample: Transferring a 30-m resolution sample set collected in 2015 to mapping 10-m resolution global land cover in 2017. Sci. Bull. 2019, 64, 370–373. [Google Scholar] [CrossRef]
- Lu, Y.; Zhang, Y.; Cao, X.; Wang, C.; Wang, Y.; Zhang, M.; Ferrier, R.C.; Jenkins, A.; Yuan, J.; Bailey, M.J.; et al. Forty years of reform and opening up: China’s progress toward a sustainable path. Sci. Adv. 2019, 5, eaau9413. [Google Scholar] [CrossRef] [PubMed]
- Ma, M.; Ma, X.; Xie, Y.; Ma, T. Analysis the relationship between ecological footprint (EF) of ningxia and influencing factors: Partial Least-Squares Regression. Acta Ecol. Sin. 2014, 34, 682–689. [Google Scholar] [CrossRef]
- Costanza, R.; D’Arge, R.; De Groot, R.; Farber, S.; Grasso, M.; Hannon, B.; Limburg, K.; Naeem, S.; O’Neill, R.V.; Paruelo, J.; et al. The value of the world’s ecosystem services and natural capital. Nature 1997, 387, 253–260. [Google Scholar] [CrossRef]
- Spellerberg, I.F.; Fedor, P.J. A tribute to Claude-Shannon (1916–2001) and a plea for more rigorous use of species richness, species diversity and the “Shannon-Wiener” Index. Glob. Ecol. Biogeogr. 2003, 12, 177–179. [Google Scholar] [CrossRef]
- Chertow, M.R. The IPAT Equation and Its Variants. J. Ind. Ecol. 2000, 76, 138–154. [Google Scholar] [CrossRef]
- Harrigan, K.R.; Guardo, M.C.D.; Bo, C. Multiplicative-innovation synergies: Tests in technological acquisitions. J. Technol. Transf. 2017, 42, 1212–1233. [Google Scholar] [CrossRef]
- Wang, H.; Wu, Z.; Meng, J. Partial Lease-Squares Regression—Linear and Nonlinear Methods; National Defense Industry Press: Beijing, China, 2006. [Google Scholar]
- Wold, S.; Kettaneh, N.; Tjessem, K. Hierarchical multiblock PLS and PC models for easier model interpretation and as an alternative to variable selection. J. Chemom. 1996, 10, 463–482. [Google Scholar] [CrossRef]
- Moore, D.; Tam, L.; Tway, T.; Iha, K.; Thompson, P. Ecological Footprint analysis San Francisco-Oakland-Fremont, CA; Global Footprint Network: Oakland, CA, USA, 2011. [Google Scholar]
- Wackernagel, M.; Schulz, N.B.; Deumling, D.; Linares, A.C.; Jenkins, M.; Kapos, V.; Monfreda, C.; Loh, J.; Myers, N.; Norgaard, R.; et al. Tracking the ecological overshoot of the human economy. Proc. Natl. Acad. Sci. USA 2002, 99, 9266–9271. [Google Scholar] [CrossRef] [PubMed]
- Warren-Rhodes, K.; Koenig, A. Ecosystem appropriation by Hong Kong and its implications for sustainable development. Ecol. Econ. 2001, 39, 347–359. [Google Scholar] [CrossRef]
- Musetta-Lambert, J.L.; Enanga, E.M.; Teichert, S.; Creed, I.F.; Kidd, K.A.; Kreutzweiser, D.P.; Sibley, P.K. Industrial innovation and infrastructure as drivers of change in the Canadian boreal zone1. Environ. Rev. 2019, 27, 275–294. [Google Scholar] [CrossRef]
- Federici, M.; Ulgiati, S.; Verdesca, D.; Basosi, R. Efficiency and sustainability indicators for passenger and commodities transportation systems. The case of Siena, Italy. Ecol. Indic. 2003, 3, 155–169. [Google Scholar] [CrossRef]
- Hu, J.; Wood, R.; Tukker, A.; Boonman, H.; de Boer, B. Global transport emissions in the Swedish carbon footprint. J. Clean. Prod. 2019, 226, 210–220. [Google Scholar] [CrossRef]
- Berg, H.; Michélsen, P.; Troell, M.; Folke, C.; Kautsky, N. Managing aquaculture for sustainability in tropical Lake Kariba, Zimbabwe. Ecol. Econ. 1996, 18, 141–159. [Google Scholar] [CrossRef]
- Gyllenhammar, A.; Håkanson, L. Environmental consequence analyses of fish farm emissions related to different scales and exemplified by data from the Baltic—A review. Mar. Environ. Res. 2005, 60, 211–243. [Google Scholar] [CrossRef]
- Gerbens-Leenes, P.W.; Nonhebel, S. Consumption patterns and their effects on land required for food. Ecol. Econ. 2002, 42, 185–199. [Google Scholar] [CrossRef]
- Zhao, J.; Liu, X.; Dong, R.; Shao, G. Landsenses ecology and ecological planning toward sustainable development. Int. J. Sustain. Dev. World Ecol. 2015, 23, 293–297. [Google Scholar] [CrossRef]
- Al-mulali, U.; Solarin, S. Investigating the environmental Kuznets curve hypothesis in seven regions: The role of renewable energy. Ecol. Indic. 2016, 67, 267–282. [Google Scholar] [CrossRef]
- Hafeez, M.; Yuan, C.; Shahzad, K.; Aziz, B.; Iqbal, K.; Raza, S. An empirical evaluation of financial development-carbon footprint nexus in One Belt and Road region. Environ. Sci. Pollut. Res. 2019, 26, 25026–25036. [Google Scholar] [CrossRef] [PubMed]
- Sadorsky, P. The impact of financial development on energy consumption in emerging economies. Energy Policy 2010, 38, 2528–2535. [Google Scholar] [CrossRef]
- Santos-Martín, F.; Zorrilla-Miras, P.; García-Llorente, M.; Quintas-Soriano, C.; Montes, C.; Benayas, J.; Gómez Sal, A.; Paracchini, M.L. Identifying win–win situations in agricultural landscapes: An integrated ecosystem services assessment for Spain. Landsc. Ecol. 2019, 34, 1789–1805. [Google Scholar] [CrossRef]
- Wu, Y.; Tian, X.; Li, X.; Yuan, H.; Liu, G. Characteristics, influencing factors, and environmental effects of plate waste at university canteens in Beijing, China. Resour. Conserv. Recycl. 2019, 149, 151–159. [Google Scholar] [CrossRef]
- Bratman, G.N.; Anderson, C.B.; Berman, M.G.; Cochran, B.; de Vries, S.; Flanders, J.; Folke, C.; Frumkin, H.; Gross, J.J.; Hartig, T.; et al. Nature and mental health: An ecosystem service perspective. Sci. Adv. 2019, 5, eaax0903. [Google Scholar] [CrossRef] [PubMed]
- Chojnacka, K.; Kowalski, Z.; Kulczycka, J.; Dmytryk, A.; Górecki, H.; Ligas, B.; Gramza, M. Carbon footprint of fertilizer technologies. J. Environ. Manag. 2019, 231, 962–967. [Google Scholar] [CrossRef] [PubMed]
- Zhang, L.; Dzakpasu, M.; Chen, R.; Wang, X.C.C. Validity and utility of ecological footprint accounting: A state-of-the-art review. Sustain. Cities Soc. 2017, 32, 411–416. [Google Scholar] [CrossRef]
- Ress, W.; Wackernagel, M. Urban Ecological Footprints: Why Cities Cannot be Sustainable—And Why They are a Key to Sustainability. Environ. Impact Assess. Rev. 2008, 16, 537–555. [Google Scholar] [CrossRef]
- Pickett, S.T.A.; Cadenasso, M.L.; Grove, J.M. Resilient cities: Meaning, models, and metaphor for integrating the ecological, socio-economic, and planning realms. Landsc. Urban. Plan. 2004, 69, 369–384. [Google Scholar] [CrossRef]
- Seelan, S.K.; Laguette, S.; Casady, G.M.; George, A.S. Remote sensing applications for precision agriculture: A learning community approach. Remote Sens. Environ. 2003, 88, 157–169. [Google Scholar] [CrossRef]
- Linares, N.; Silvestre-Albero, A.M.; Serrano, E.; Silvestre-Albero, J.; García-Martínez, J. Mesoporous materials for clean energy technologies. Chem. Soc. Rev. 2014, 43, 7681–7717. [Google Scholar] [CrossRef] [PubMed]
- Zhou, X.; Imura, H. How does consumer behavior influence regional ecological footprints? An empirical analysis for Chinese regions based on the multi-region input–output model. Ecol. Econ. 2011, 71, 171–179. [Google Scholar] [CrossRef]
- Stern, D.I. The rise and fall of the Environmental Kuznets. Curve. World Dev. 2004, 32, 1419–1439. [Google Scholar] [CrossRef]
- Verhofstadt, E.; Ootegem, L.V.; Defloor, B.; Bleys, B. Linking individuals’ ecological footprint to their subjective well-being. Ecol. Econ. 2016, 127, 80–89. [Google Scholar] [CrossRef]
- Galli, A.; Iha, K.; Pires, S.M.; Mancini, M.S.; Alves, A.; Zokai, G.; Lin, D.; Murthy, A.; Wackernagel, M. Assessing the ecological footprint and biocapacity of Portuguese cities: Critical results for environmental awareness and local management. Cities 2020, 96, 102442. [Google Scholar] [CrossRef]


| Biological Products/Energy Consumption Items | Land Categories |
|---|---|
| Cereals, tubers, beans, oil-bearing crops, vegetables, pork, poultry eggs | Cropland |
| Beef, mutton, milk, sheep wool, goat wool, cashmere | Grassland |
| Honey, tea, wood, fruit | Woodland |
| Fish, shrimps, prawns and crabs, shellfish, algae | Water area |
| Coal, coke, crude oil, gasoline, kerosene, diesel oil, fuel oil, natural gas | Fossil energy land |
| Electricity | Construction land |
| Dimension of Index | Driving Factors | Unit |
|---|---|---|
| Population | Permanent population | 10,000 persons |
| Economics | GDP of the primary industry | 100 million RMB |
| GDP of the secondary industry | ||
| GDP of the tertiary industry | ||
| GDP | ||
| Foreign trade | Total value of exports | 10,000 dollars |
| Total value of imports | ||
| Policy | total fixed capital | 100 million RMB |
| Residents’ life | total retail sales | 100 million RMB |
| disposable income | RMB | |
| consumption expenditure | RMB | |
| Energy consumption | electric consumption | 100 million kWh |
| Circulation | highway mile | 10,000 km |
| ownership vehicles | 10,000 units | |
| freight volume | 10,000 tons | |
| Urbanization level | construction area | 10,000 hectares |
| Proportion of urban population to permanent population | % | |
| Science and technology and education | R&D personnel | Person |
| Students in primary education | ||
| Students in secondary education |
| Municipality | EFdepth | ECintensity | Per Capita ED3D |
|---|---|---|---|
| Guangzhou | 0.94 | — | 0.14 |
| Shenzhen | 0.99 | 0.97 | 0.90 |
| Zhuhai | 0.93 | 0.77 | 0.88 |
| Foshan | 0.95 | 0.89 | 0.89 |
| Huizhou | 0.58 | 0.94 | — |
| Dongguan | — | 0.08 | 0.82 |
| Zhongshan | 0.65 | — | 0.61 |
| Jiangmen | 0.61 | 0.87 | 0.98 |
| Zhaoqing | 0.87 | 0.92 | 0.98 |
| Hong Kong | 0.86 | 0.97 | — |
| Macao | 0.92 | — | 0.92 |
Publisher’s Note: MDPI stays neutral with regard to jurisdictional claims in published maps and institutional affiliations. |
© 2020 by the authors. Licensee MDPI, Basel, Switzerland. This article is an open access article distributed under the terms and conditions of the Creative Commons Attribution (CC BY) license (http://creativecommons.org/licenses/by/4.0/).
Share and Cite
Wang, Y.-N.; Zhou, Q.; Wang, H.-W. Assessing Ecological Carrying Capacity in the Guangdong-Hong Kong-Macao Greater Bay Area Based on a Three-Dimensional Ecological Footprint Model. Sustainability 2020, 12, 9705. https://doi.org/10.3390/su12229705
Wang Y-N, Zhou Q, Wang H-W. Assessing Ecological Carrying Capacity in the Guangdong-Hong Kong-Macao Greater Bay Area Based on a Three-Dimensional Ecological Footprint Model. Sustainability. 2020; 12(22):9705. https://doi.org/10.3390/su12229705
Chicago/Turabian StyleWang, Ye-Ning, Qiang Zhou, and Hao-Wei Wang. 2020. "Assessing Ecological Carrying Capacity in the Guangdong-Hong Kong-Macao Greater Bay Area Based on a Three-Dimensional Ecological Footprint Model" Sustainability 12, no. 22: 9705. https://doi.org/10.3390/su12229705
APA StyleWang, Y.-N., Zhou, Q., & Wang, H.-W. (2020). Assessing Ecological Carrying Capacity in the Guangdong-Hong Kong-Macao Greater Bay Area Based on a Three-Dimensional Ecological Footprint Model. Sustainability, 12(22), 9705. https://doi.org/10.3390/su12229705