Article

Response of Soil Bacterial Community to Application of Organic and Inorganic Phosphate Based Fertilizers under Vicia faba L. Cultivation at Two Different Phenological Stages

by
Shamina Imran Pathan
1,*,
Silvia Scibetta
2,
Chiara Grassi
1,
Giacomo Pietramellara
1,
Simone Orlandini
1,
Maria Teresa Ceccherini
1 and
Marco Napoli
1
1
Department of Agriculture, Food, Environment and Forestry, University of Florence, Piazzale delle Cascine 28, 50144 Florence, Italy
2
Department of Agricultural Sciences, Mediterranean University of Reggio Calabria, Feo di Vito, 89124 Reggio Calabria, Italy
*
Author to whom correspondence should be addressed.
Sustainability 2020, 12(22), 9706; https://doi.org/10.3390/su12229706
Submission received: 22 October 2020 / Revised: 16 November 2020 / Accepted: 17 November 2020 / Published: 20 November 2020

Abstract

:
It is essential to investigate to which extent and how specifically soil–plant–microbe interactions can be conditioned by different agricultural practices. Legumes such as Vicia faba is one of the essential functional group in intercropping and crop rotations due to its higher N fixing capacity. Hence, it is important to study the living microbial community of this legume. Further, it is also expected that fluctuations in soil microbial diversity and composition could be complemented by plant phenological stages and different fertilizer amendments. Thus, we investigated bacterial community composition in soil treated with phosphate-based inorganic and organic fertilizers, in the presence of Vicia faba plants at flowering and fruiting time using NGS 16S rRNA gene amplicon sequencing. Further, the evaluation of plant biomass parameters under different fertilizer treatments was also carried out. The presence of the Vicia faba plant increased the abundance of N fixing bacterial such as Bardyrhizobium, Microvirga (Rhizobiales), Arthrobacter, and Psuedoarthrobacter (Actinomycetales) in soil. Fluctuation in composition and diversity of bacterial community was further supplemented by plant phenological stages. These alterations could be due to changes that occurred in the plant nutrient requirement and varied root exudation patterns at a specific phenological stage. Further, fertilizer treatments also have a profound effect on the diversity and structure of the bacterial community. Organic fertilizers, especially vegetable tanned leather waste (VTLW), have a stronger effect on the composition and diversity of bacterial community compared to inorganic fertilizer (PT—triple superphosphate). Alpha-diversity was significantly decreased by both organic and inorganic amendments, especially a species evenness because each fertilizer tends to stimulate the growth of distinctive microbes that dominated the community of amended soil. Proteobacteria, Actinobacteria, and Cyanobacteria were the most abundant phyla, and Chelatococcus, Cyanobacteria, Sphingomonas, and Microvirga were a most abundant genus that contributed most in co-occurrence pattern, which suggests that these generalists are adapted to a variety of environments. These indicate that plant presence was a key, dominating factor, followed by fertilizers and time, in affecting soil bacterial diversity and composition. Plant recruits system (fertilization and time) -specific taxa due to differences in available nutrients and energy sources among different treatments during different growth stages. Further, fertilizer treatments did not have a stronger effect on plant production as compared to the effect on microbial community, which highlights that organic fertilizers did not tend to increase plant production. Thus, organic and inorganic amendments with matched macronutrients could have a similar impact on crop yields.

1. Introduction

Legumes are one of the cheaper and higher sources of proteins, minerals, and fibers for animals and humans [1], thus, it is a staple food in many developing countries. Further, legumes are a key functional group in intercropping and crop rotation and are highly valued by providing multiple services in the context of sustainable management [2,3,4]. Along with being served as basic high protein food and forage to humans and animals, legumes further contribute to improving soil health by nitrogen (N) fixation, phosphorus mobilization, water retention, and reducing greenhouse gas emission [1,5]. Thus, they have a high potential for sustainable agriculture being functional either as growing crops or as crop residue and promoting ecosystem efficiency [2,6]. Due to the higher nutritional values, such as protein, carbohydrates, B group vitamins, and minerals [7], the Faba bean (Vicia faba L.) is one of the important legumes around the world [8]. Moreover, Faba bean has high N fixing capacity and can fix approximately 50–330 kg N ha−2 [9,10]. Despite legume’s N fixing capability through a symbiotic relationship with Rhizobium leguminosarum, by some means, they also require fertilization, particularly during the seedling time. Further, low nutrient availability in soil could have a negative effect on legume production [11]. Previous studies demonstrated that nodulated legumes have a strong direct positive relationship with soil phosphorus (P) and organic matter content [12,13,14,15]. Moreover, much of the nitrogen benefit of legumes to upcoming crop comes from the plant residue—shoots and roots—which demonstrated the need for enough soil nutrients to improve legume biomass that can be fulfilled by fertilizer amendments.
Soil microbial community is a key driver of energy flow and biogeochemical cycling in terrestrial ecosystems [16,17]. Hence, soil ecological processes preliminary depend on the composition, diversity, and stability of soil microbial communities [18,19]. Furthermore, soil microbial community is a significant soil quality indicator and is highly sensitive to different biotic and abiotic factors, such as soil nutrient, pH, plant species, and soil management practices [20,21,22,23]. Many studies showed that the soil microbial community is profoundly influenced by the use of legume in intercropping or crop rotation. These influence directly [24,25,26,27] or indirectly, through changes in rhizosphere pH, enhanced availability of nutrients, or the effect on the quantity, the quality, and the distribution of soil organic matter in upper-soil horizons [28,29]. Along with plant species, plant growth stages also have a strong influence on soil microbial community, which could be due to different nutrient requirements and varied root exudation patterns during different phenological stages of the plant [30,31,32]. Despite a substantial body of literature, indicating that legumes play a vital role in stimulating microbial community and their activities [1,33], none of them actually looked into the microbial community of living legumes and the time in which these interaction manifest.
Phosphorus (P) is the second most important macronutrient in agroecosystem [34]. Unlike nitrogen (N) and sulfur (S), P does not occur as gas or disappear into the atmosphere but can be easily fixed and bind to iron and aluminium or strongly absorbed on soil particles and become unavailable to plants. Soil microbial community plays a vital role in P solubilization and mineralization [35] and as a group these microbes are named P solubilizing microbes (PSB). Vice versa, organic and inorganic P has a profound impact on the abundance, diversity, and structure of soil microbial communities [23,36]. Recently, many meta-analysis studies demonstrated that organic and inorganic amendment with matched macronutrients might have a similar effect on plant production, while microbial community respond differently [37,38]. These demonstrate that nutrients are a limiting factor for plant production, though the soil microbial community is more correlated with their chemical and biochemical properties and other abiotic factors.
Hence, the present study aims to assess the response of the bacterial community to plant presence and time after the addition of phosphorus-based organic and inorganic amendment to the soil. Soil bacterial community was analysed with and without Vicia faba cultivation at flowering and fruiting time using NGS 16S rRNA gene amplicon sequencing. We hypothesized that (i) diversity and structure of bacterial community would differ among different fertilizer amendments due to various biochemical characteristic; (ii) changes in the bacterial community would be supplemented by plant presence and sampling time due to differences in plant nutrient requirement and root exudation pattern during flowering and fruiting time; (iii) changes in a microbial community under the organic amendment would be due to the supplied organic material, not by fertilizer-born-microbes.

2. Materials and Methods

2.1. Soil Properties

Sandy soil was taken from an experimental field (0–10 cm depth) in Florence, Italy. After air-drying, the soil was sieved at 5 mm. After sieving, the soil was used for the pot experiment, and the main characteristic of soil is given in Table 1.

2.2. Fertilizer Characteristics

2.2.1. Organic Fertilizers

Vegetable Tanned Leather Waste (VTLW, Fertilizzanti Certaldo Srl, Certaldo, Tuscany, Italy) is an organo-mineral fertilizer from vegetable tanned leather, certified as organic products. The waste material is hydrolyzed by sulphuric acid and then converted into a liquid form; natural soft rock phosphate is added to solidify and create an intermediate product. The transition from liquid to solid state occurs in about three months, a period called maturation. Then, the product is granulated for commercialization and contains 3% N mainly as amino acids and short-chain peptides, 11% phosphoric anhydride (P2O5), 10% organic carbon (OC), 15% calcium oxide (CaO), and 12% sulphuric anhydride (SO3).
A combination of commercial Pelleted Chicken Manure (PCM) and Natural Soft Rock Phosphate (NSRP), certified as an organic product, was selected as another organic fertilizer. PCM contained 3% N mainly as uric acid and urea, 2% P2O5, and 41.3% OC; NSRP contained 25% P2O5 (Fertilizzanti Certaldo Srl, Certaldo, Tuscany, Italy).

2.2.2. Inorganic Fertilizers

Triple superphosphate (TP) and urea (U) (Fertilizzanti Certaldo Srl, Certaldo, Tuscany, Italy). TP, manufactured by letting the phosphoric acid react with phosphate rock, contained 46% of P2O5. Urea contained 46% of N. The main characteristics of used organic and inorganic fertilizers are given in Table 2.

2.3. Experimental Design

The experiment was three-factorial and the experimental plan included four fertilizer treatments, two soil sampling time during the growing season (flowering and fruiting), and one soil with and without plant presence. The treatments were performed in triplicates. To test the effect of the fertilizer on the soil chemical and biological properties, a total of 48 pots (30 cm × 30 cm × 30 cm) were filled with 18 kg of soil. Fertilizer treatments (Supplementary Table S1) comprised control (C) containing only U, VTLW plus U (P), PCM plus NSRP (PP), and TP plus U (PT). To evaluate the effect of the plant presence on soil properties, the test was performed in pots with plants (WP) and no plants (NP) in the open air. Treatments were set up by distributing the respective fertilizers (Supplementary Table S1) in each pot and then homogenously incorporating the fertilizer by manual mixing. Twenty-four pots were sown with three Vicia faba L. seeds per pot in October 2017, while the other 24 pots remained unseeded. All pots were arranged in a randomized pattern and were irrigated with a dripping system, depending on soil moisture. At flowering (FL) and at fruiting (FR) time, the soil was sampled for each of the pots.
Since the root system of the three plants grown in each pot completely occupied the available space, we assimilated the soil as ectorhizospheric. The control was the soil in a pot without plants. All the soil samples were stored at −20 °C prior to further analysis.

2.4. Plant Biomass Analysis

At maturity, the plants were separately harvested for analysing the length of stem and roots, root collar diameters, and the number of seeds per plant. For each pot, roots, aboveground biomass (stem and leaves), and seeds inside the pods were placed separately inside paper bags and kept in a drying oven at 60 °C for 3 days until a constant weight was achieved. Then, the same plant parts were separately weighed on an electronic balance to measure the dry weight. Roots were recovered from each pot and maintained separately. The soil was removed from the pot and disaggregated by hand carefully to keep the roots intact and recover as much as possible. The roots were then gently washed with distilled water to remove residual soil particles.

2.5. Soil Chemical Analysis

Inorganic nitrogen, ammonium-nitrogen (NH4+-N), nitrate-nitrogen (NO3-N), and nitrite-nitrogen (NO2-N), and urea-nitrogen (U-N) were analysed by the photometric method. Briefly, 40 g of air-dried soil from each sample was added to the 160 mL of a 0.01 M CaCl2 solution (Sigma-Aldrich, 97%) and then was shaken for 2 h at 150 rev min−1. Later, the suspensions were filtered through a nitrate-free filter and immediately analysed for N compounds or stored at −40 °C in the dark. The concentrations of NH4+-N, NO3-N, NO2-N, and U-N were determined by using a HI 83200-02 photometer (Hanna Instruments Inc., Highland Industrial Park, Woonsocket, RI, USA) with the respective reagents as explained by Schlesinger and Valkenburgh [39]; Kustin et al. [40] and Irandoust et al. [41].

2.6. Soil DNA Extraction and 16S rRNA Gene Sequencing

Total soil and chicken manure (PP) DNA was extracted using the Fast DNA™SPIN Kit for soil (MP Biomedicals, Santa Ana, California, USA) according to Panico et al. [42]. Quality control and DNA yield were checked by 2% agarose gel electrophoresis and by spectrophotometer (Picodrop limited, Hinxton, UK).
The V3-V4 region of 16S rRNA gene was amplified using the Illumina barcoded primer pair S-D-BACT-0341F/S-D-BACT-0785 [43] by using a TProfessional thermal cycler (Biometra, biomedizinische Analytik GmbH). The PCR reaction mix (50 μL) contained: 40 ng of template DNA, 1X (plus MgCl2 20 mM) Dream Taq reaction buffer (Thermo Scientific, Carlsbad, CA, USA), 0.04 μg μL−1 of BSA, 0.05 Units μL−1 of Taq DNA Polymerase (ThermoFisher Scientific), 0.4 μM of each primer, 0.4 mM of dNTPs. PCR running conditions were: 3 min denaturation at 95 °C, followed by 30 sequential cycles each consisting of 30 s at 95 °C, 30 s at 55 °C, 30 s at 72 °C, followed by a final extension step at 72 °C for 7 min. PCR products (amplicon size ~550 bp) were purified using a NucleoSpin® Gel and PCR Clean-up Kit (MACHEREY-NAGEL, Dueren, Germany) and then quantified by an Invitrogen™ Qubit™ 2.0 Fluorometer (ThermoFisher Scientific). Purified amplicons were used for library preparation and sequencing, according to the Illumina 16S Metagenomic Sequencing Library Preparation guide (downloaded from https://support.illumina.com/content/dam/illumina-support/documents/documentation/chemistry_documentation/16s/16s-metagenomic-library-prep-guide-15044223-b.pdf). Paired-end sequencing (2 × 300 bp) was carried out by using a MiSeq System (Illumina, CA, USA).

2.7. Sequencing Data Processing and Data Analysis

Paired reads were assembled, quality-filtered, and analysed using the pipeline SEED 2.0.3 [44] with the inclusion criteria of mean quality score ≥32 and length ≥250 bp. Briefly, chimeric sequences were detected using the de novo VSEARCH algorithm [45] and removed from the dataset. Sequences were then clustered into operational taxonomic units (OTUs) at a 97% sequence identity threshold using the VSEARCH algorithm; consensus sequences were constructed for all clusters [44]. Low abundant sequences (≤5 of total count) were excluded from further analysis. Identification and the taxonomic assignment were done using representative sequences retrieved from RDP database [46] and the NCBI (https://www.ncbi.nlm.nih.gov/) using a 10-4 E value threshold. Sequences identified other than bacteria were discarded. The remaining sequences were used to create OTU table and then normalized by dividing sequences of individual OTU by dividing the sum of all sequences for each sample. Phylogenetic assignment to bacterial phyla and class level was based on best hits, by dividing the number of sequences belonging to each phylogenetic group by the total number of sequences in the given sample. All Illumina datasets were submitted to the European Nucleotide Archive under the study accession number PRJEB40215.
PAST 3.03 [47] and R Statistical Environment (R development Core Team, 2008) were used for all statistical analysis. Venn diagram was constructed to identify shared and unique OTUs among different fertilizer treatment, time, and plant presence/absence. Rarefaction and alpha diversity of OTUs was performed on resampled datasets with the same number of sequences randomly selected from all samples (20.000 sequences) using the SEED 2.0.3 software [44]. Three-way analysis of variance (ANOVA, fertilizer treatment × plant presence × time) was performed to check any significant effect of fertilizers, plant presence, and their interaction on the variability of alpha diversity data. F values resulting from ANOVA were used to find out if the average between two sets of data were significantly different or not. Further, multiple pairwise comparisons of means was done by Tukey’s honestly significant difference (HSD) test at p < 0.05 level of significance to analyse the individual effects of each factor. Correlations between alpha diversity and physicochemical variables or plant production data were examined by means of a Spearman’s rank correlation test. OTUs with >0.5% abundance were used to evaluate differences in beta diversity. Principal Coordinate Analysis (PCoA) and PERMANOVA test were conducted based on Bray-Curtis similarity distance to determine the distribution of diversity and statistical significance of beta diversity, respectively. Heatmap was constructed for the top 50 OTUs based on abundance at different taxonomic levels (Phyla to Genus) to identify which OTUs contributed most to discriminate the soil bacterial community within a different treatment, time, and plant presence. Correlations between beta diversity and physicochemical variables or plant production data were determined by canonical corresponding analysis (CCA). The forward selection was based on Monte Carlo permutation tests (permutations D 999) [48]. The ordination in the x- and y-axes and the length of the corresponding arrows indicated the importance of environmental variables in explaining the taxon distribution across communities. The co-occurrence of the 50 most abundant OTUs in microbial communities among all samples was analysed by calculating Spearman’s rank coefficients (p) using R package Hmisc [49]. Subsequently, those significant (FDR-adjusted p value < 0.01) and robust (p ≥ 0.6) correlations between OTUs were exported as a GML format network file using R package igraph [50]. Network visualization was conducted using the Fruchtermann–Feingold layout of the interactive platform Gephi version 0.9.2. Possible keystone genera were those that demonstrated high betweenness centrality values [51]. The modular structure of the community was evaluated via the modularity index [52].

3. Results

3.1. Plant Biomass

Table 2 shows the considered plant biomass data per pot according to soil treatments. No significant differences were observed between treatments in terms of stem length, stem and leaves dry weight, and roots collar diameter (Table 3). The P treatment significantly reduced (p < 0.05) the roots length as compared to plants grown in C and PT treatments, while no significant difference was observed with respect to plants grown in PP. There was no difference in the roots length among the C, PP, and PT treatments. The heavier roots among those tested were measured in the PP treatment, followed, in decreasing order, by PT, C, and P. The roots dry weight measured in the P treatment resulted significantly lower (p < 0.05) than those measured in the other treatments. Both for the number of seeds per plant and seeds dry weight the highest values were measured in the PT treatment, followed by the PP, C, and P treatments. The number of seeds per plant and the seeds’ dry weight measured in the P treatment were significantly lower (p < 0.05) than those measured in the PT treatment, while no significant difference was observed with respect to the C and PP treatment.

3.2. Soil Inorganic N Compounds

Three-way ANOVA results showed that all three factors—fertilizers treatment, plant presence and sampling time—and their interactions significantly affected the different nitrogen forms (ammonia, nitrite, nitrate, urea, and total nitrogen); time and plant presence did not have a significant effect on urea and nitrate, respectively (Supplementary Table S2). Further, ammonia and nitrate contents were significantly higher in soil treated with VTLW (P) during flowering than the other fertilizer treatments (Supplementary Table S3), while fertilizer treatments did not have significant effect on Urea content (Supplementary Table S3).

3.3. Bacterial Alpha Diversity

After quality filtering, chimera cleaning, and removal of low abundant sequences (≤5 total count), 2,655,968 16S rRNA sequences, and 30,198 OTUs were obtained from a total of 51 samples (48 soil samples and 3 fertilizer samples—PCM). The rarefaction curve was reached to saturation for all samples, indicating the sequencing depth sufficient to cover detectable species in all samples (Supplementary Figure S1). Venn diagram revealed that 9744 OTUs (68.7%) were exclusively shared by soil with and without plant presence, while 2619 OTUs (18.3%) were only enriched in soil with plant, and 1949 OTUs (13.6%) in soil without plant (Figure 1). Assessing time effect, results showed that 10,068 OTUs (71%) were shared by soil during flowering and fruiting time, though 1008 (7.1%) and 3105 (21.9%) OTUs were uniquely enriched in the soil during flowering and fruiting time, respectively. Further, a comparison among fertilizer showed that 8645 OTUs (48.7%) were shared by different fertilizer treatments. Whilst somehow, each treatment had exclusive OTUs in the range of 1241 to 1005 with the highest number enriched by C treatment (7.0%) and the lowest enriched in PP treatment (5.7%).
Estimated diversity indices, Shannon index, evenness, and Chao1 richness are shown in Supplementary Table S4, and the effect of all three factors, plant presence, time and fertilizers, and their interaction are shown in Table 4. Time had a consistent significant effect (p < 0.05), while fertilizer treatment had a significant effect on Shannon index and evenness not on Choa-1. Further, plant presence did not have any significant effect on alpha diversities (Table 4 and Supplementary Table S4). Interaction of time with plant presence and did not have any significant effect on alpha diversities, while, the interaction between time and fertilizers had only significant effect on evenness. Interaction between plant presence and fertilizers had a significant influence on all three diversity indices (Table 4 and Supplementary Table S4).
Moreover, the interaction between all factors significantly affected the Shannon index and evenness, while this interaction did not influence Chao1 richness. Evenness was decreased considerably in fertilizer treated soils during both flowering and fruiting time compared to control soil, especially in P treatment. While Choa-1 richness was increased in treated soils, but the differences were not significant.

3.4. Correlation of Alpha Diversity with Soil Edaphic Properties and Plant Biomass

The correlation of soil bacterial alpha diversity with soil chemical properties and plant biomass data are shown in Table 5a,b, respectively. In plant presence, only evenness was significantly and positively correlated with ammonia content during flowering time. In soil without plant, all soil edaphic factors are significantly but negatively correlated with evenness except nitrite during flowering time, although Shannon index and Chao-1 were also negatively (significant) correlated only with ammonia during flowering time. During fruiting time, only urea was negatively correlated with Shannon index and evenness.
Plant biomass parameters, root and stem length, and root dry weight were significantly and positively correlated only with evenness during flowering time. Further, Chao-1 was negatively (significant) correlated with root dry weight during flowering time. Any plant biomass data did not have a significantly correlation with Shannon index during flowering time, while Shannon index was significantly and positively correlated only with root length during the fruiting time. Further, stem and root length were also significantly correlated with evenness during fruiting time.

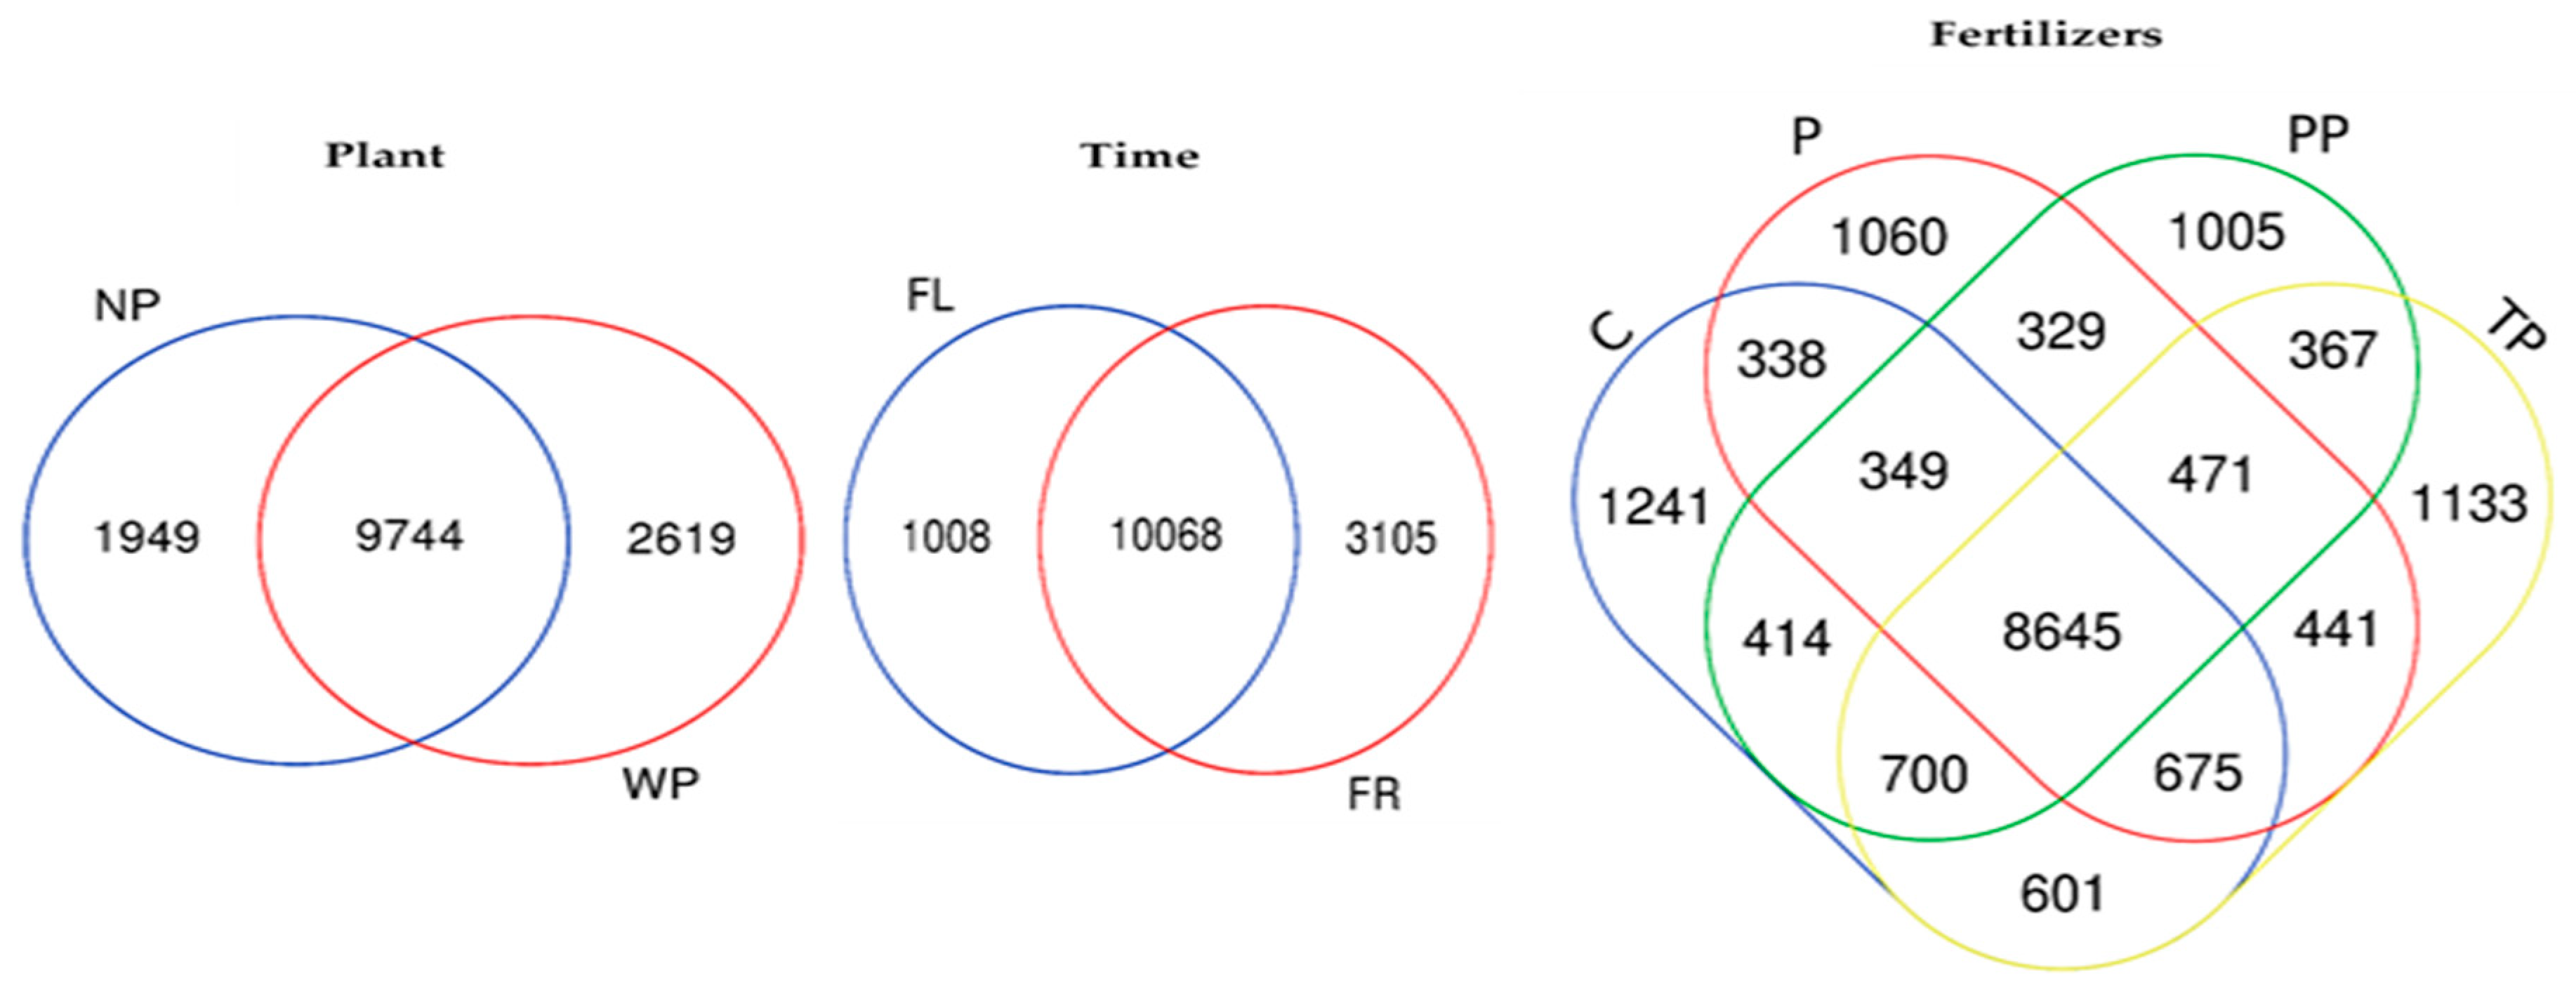
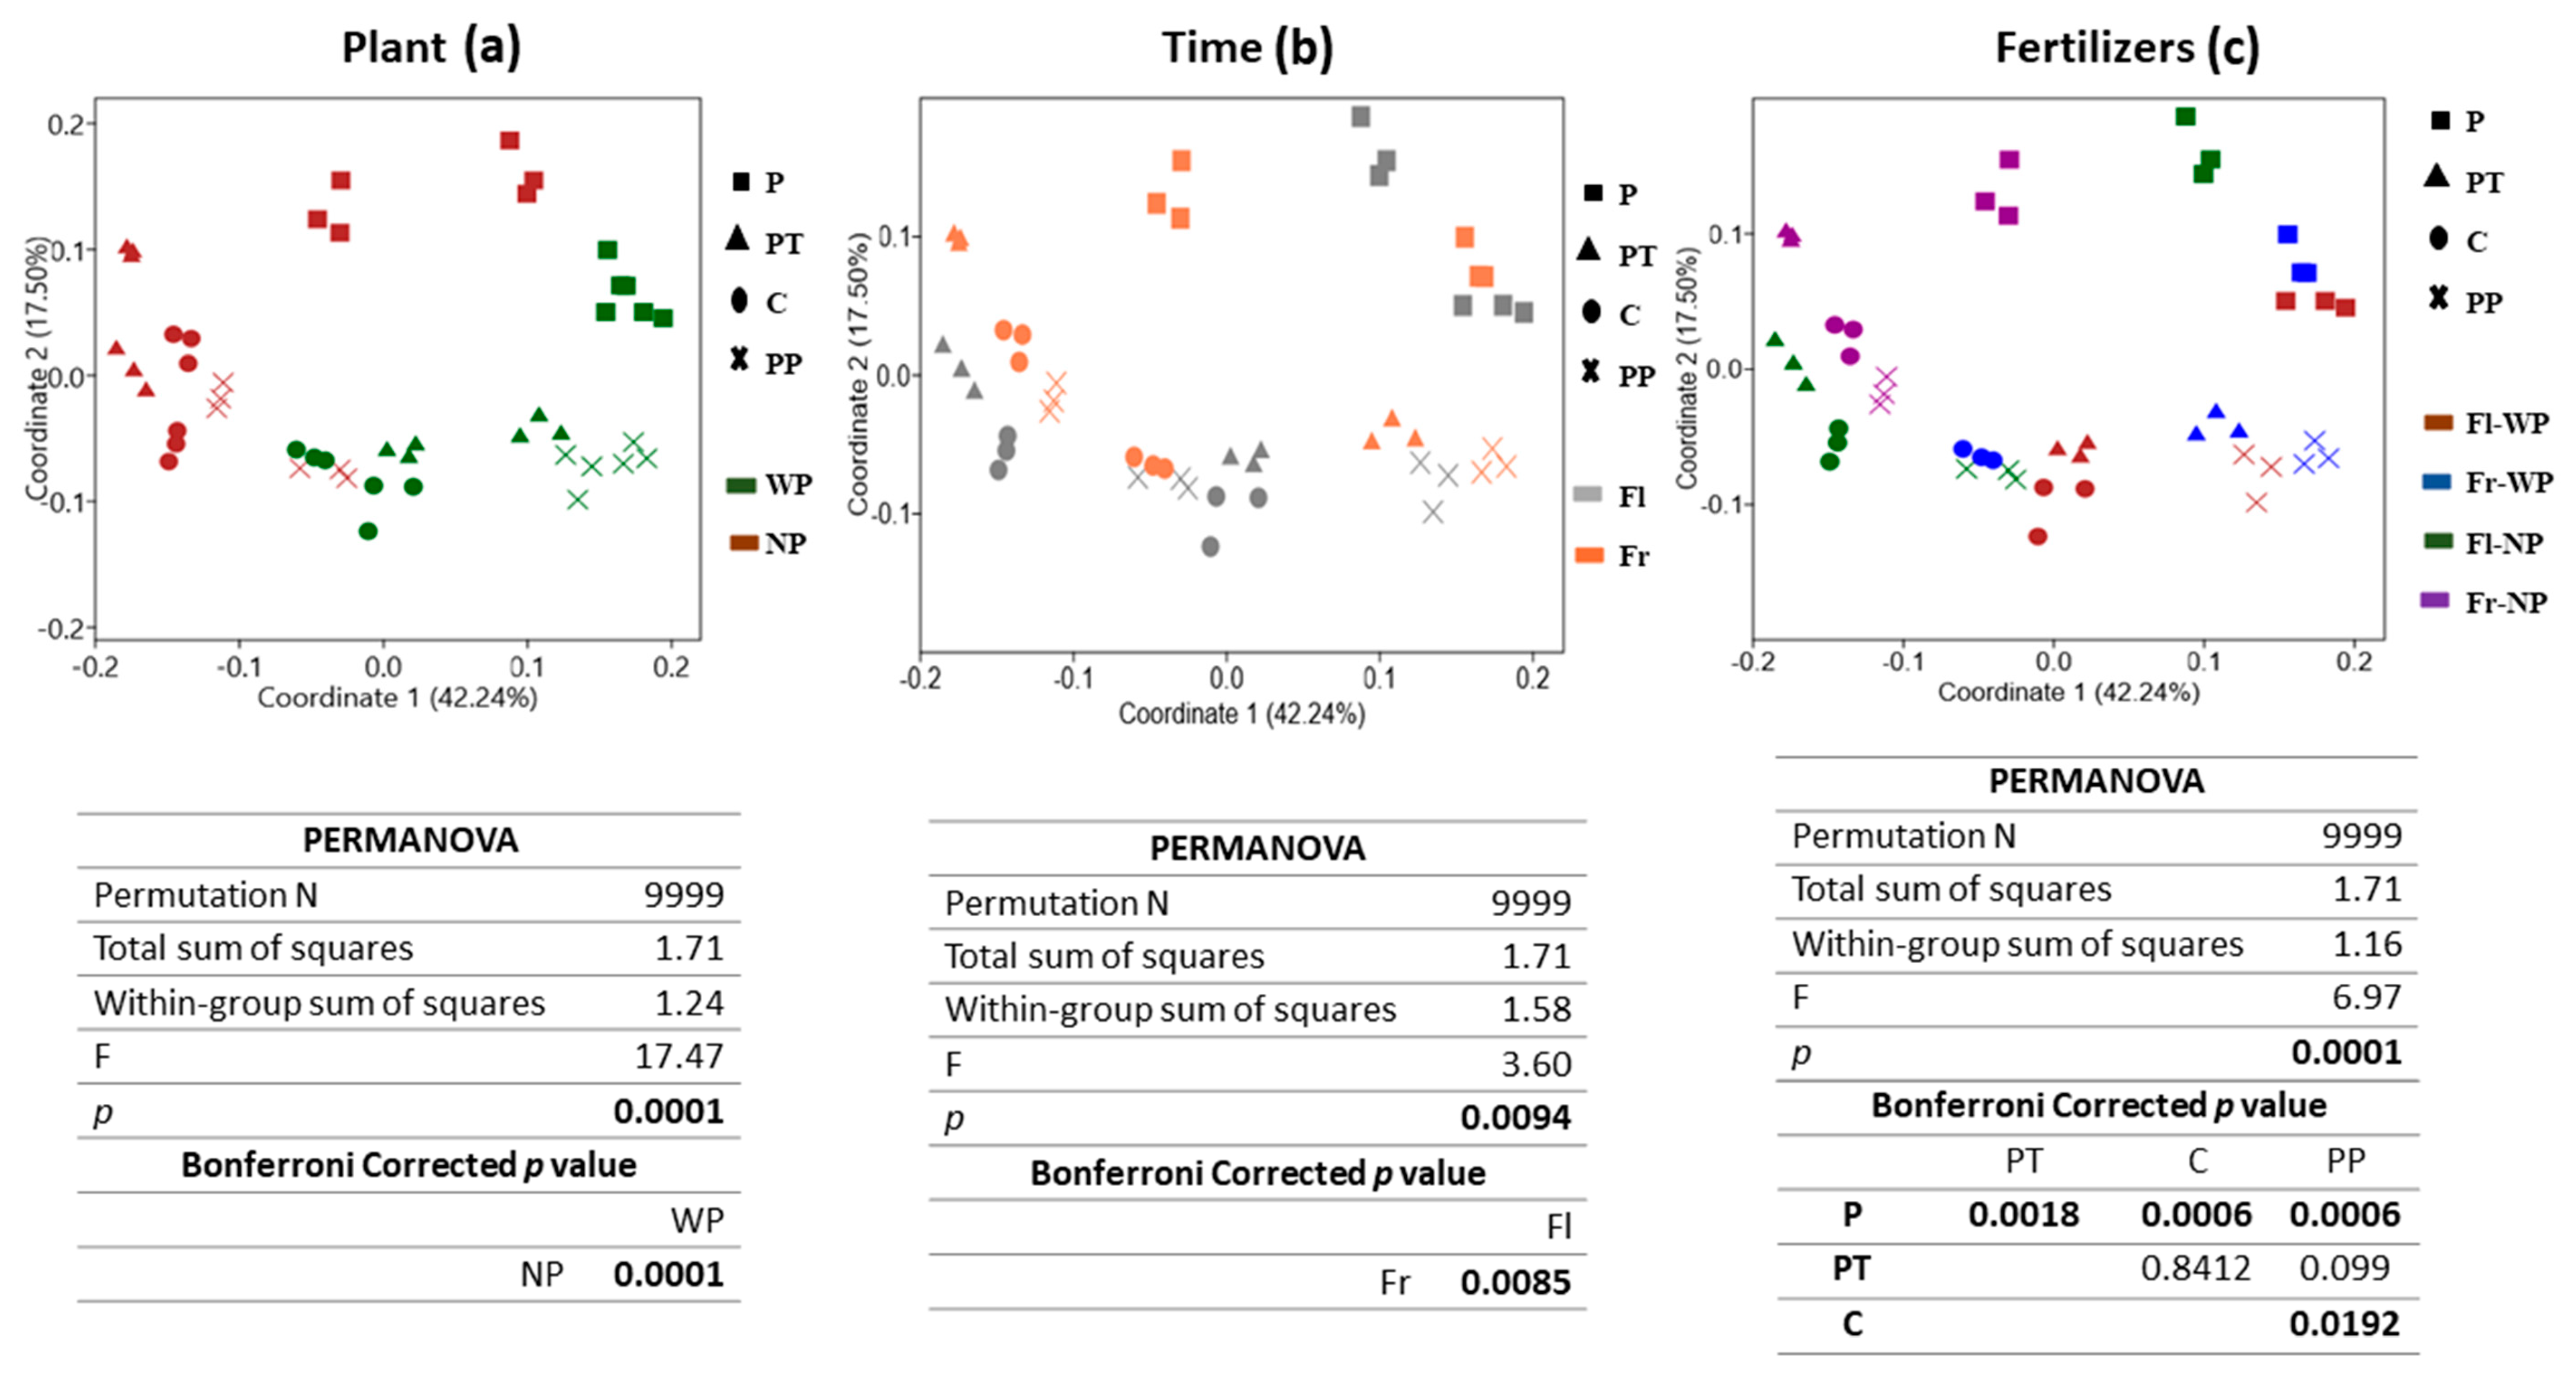
3.5. Changes in Bacterial Community Structure (Beta Diversity) in Response to Time, Plant Presence and Fertilizer Treatment

Beta diversity allows studying how different the population structure is in various environments. PCoA of Bray-Curtis distance was used to analyse the variation in the bacterial community as affected by plant presence, time, and fertilizers (Figure 2a–c). The significance level of variation was checked by PERMANOVA. The first two principal coordinators explain a high percentage of variance (~60%, coordinate 1:42.24% and coordinate 2:17.50%) with distinction in community structure associated with all three factors. Plots revealed that community clustered differently under all three factors, especially under plant presence and absence. PERMANOVA results confirmed a significant global effect of plant presence (F = 17.47, p = 0.0001), time (F = 3.60, p = 0.0085), and fertilizer treatments (F = 6.67, p = 0.0001). The strongest influence was shown by the presence of plant followed by fertilizer treatments and then time. Time did not have a stronger effect, as shown by plant presence. Regarding the fertilizer effect, PCoA plot and pairwise PERMANOVA showed that the community treated with VTLW (P) was significantly different (p < 0.05) from control soil and the other fertilizer treatments. Moreover, significant differences were also observed between the community structure of C (control) and PP (PCM plus NSRP) treatment.

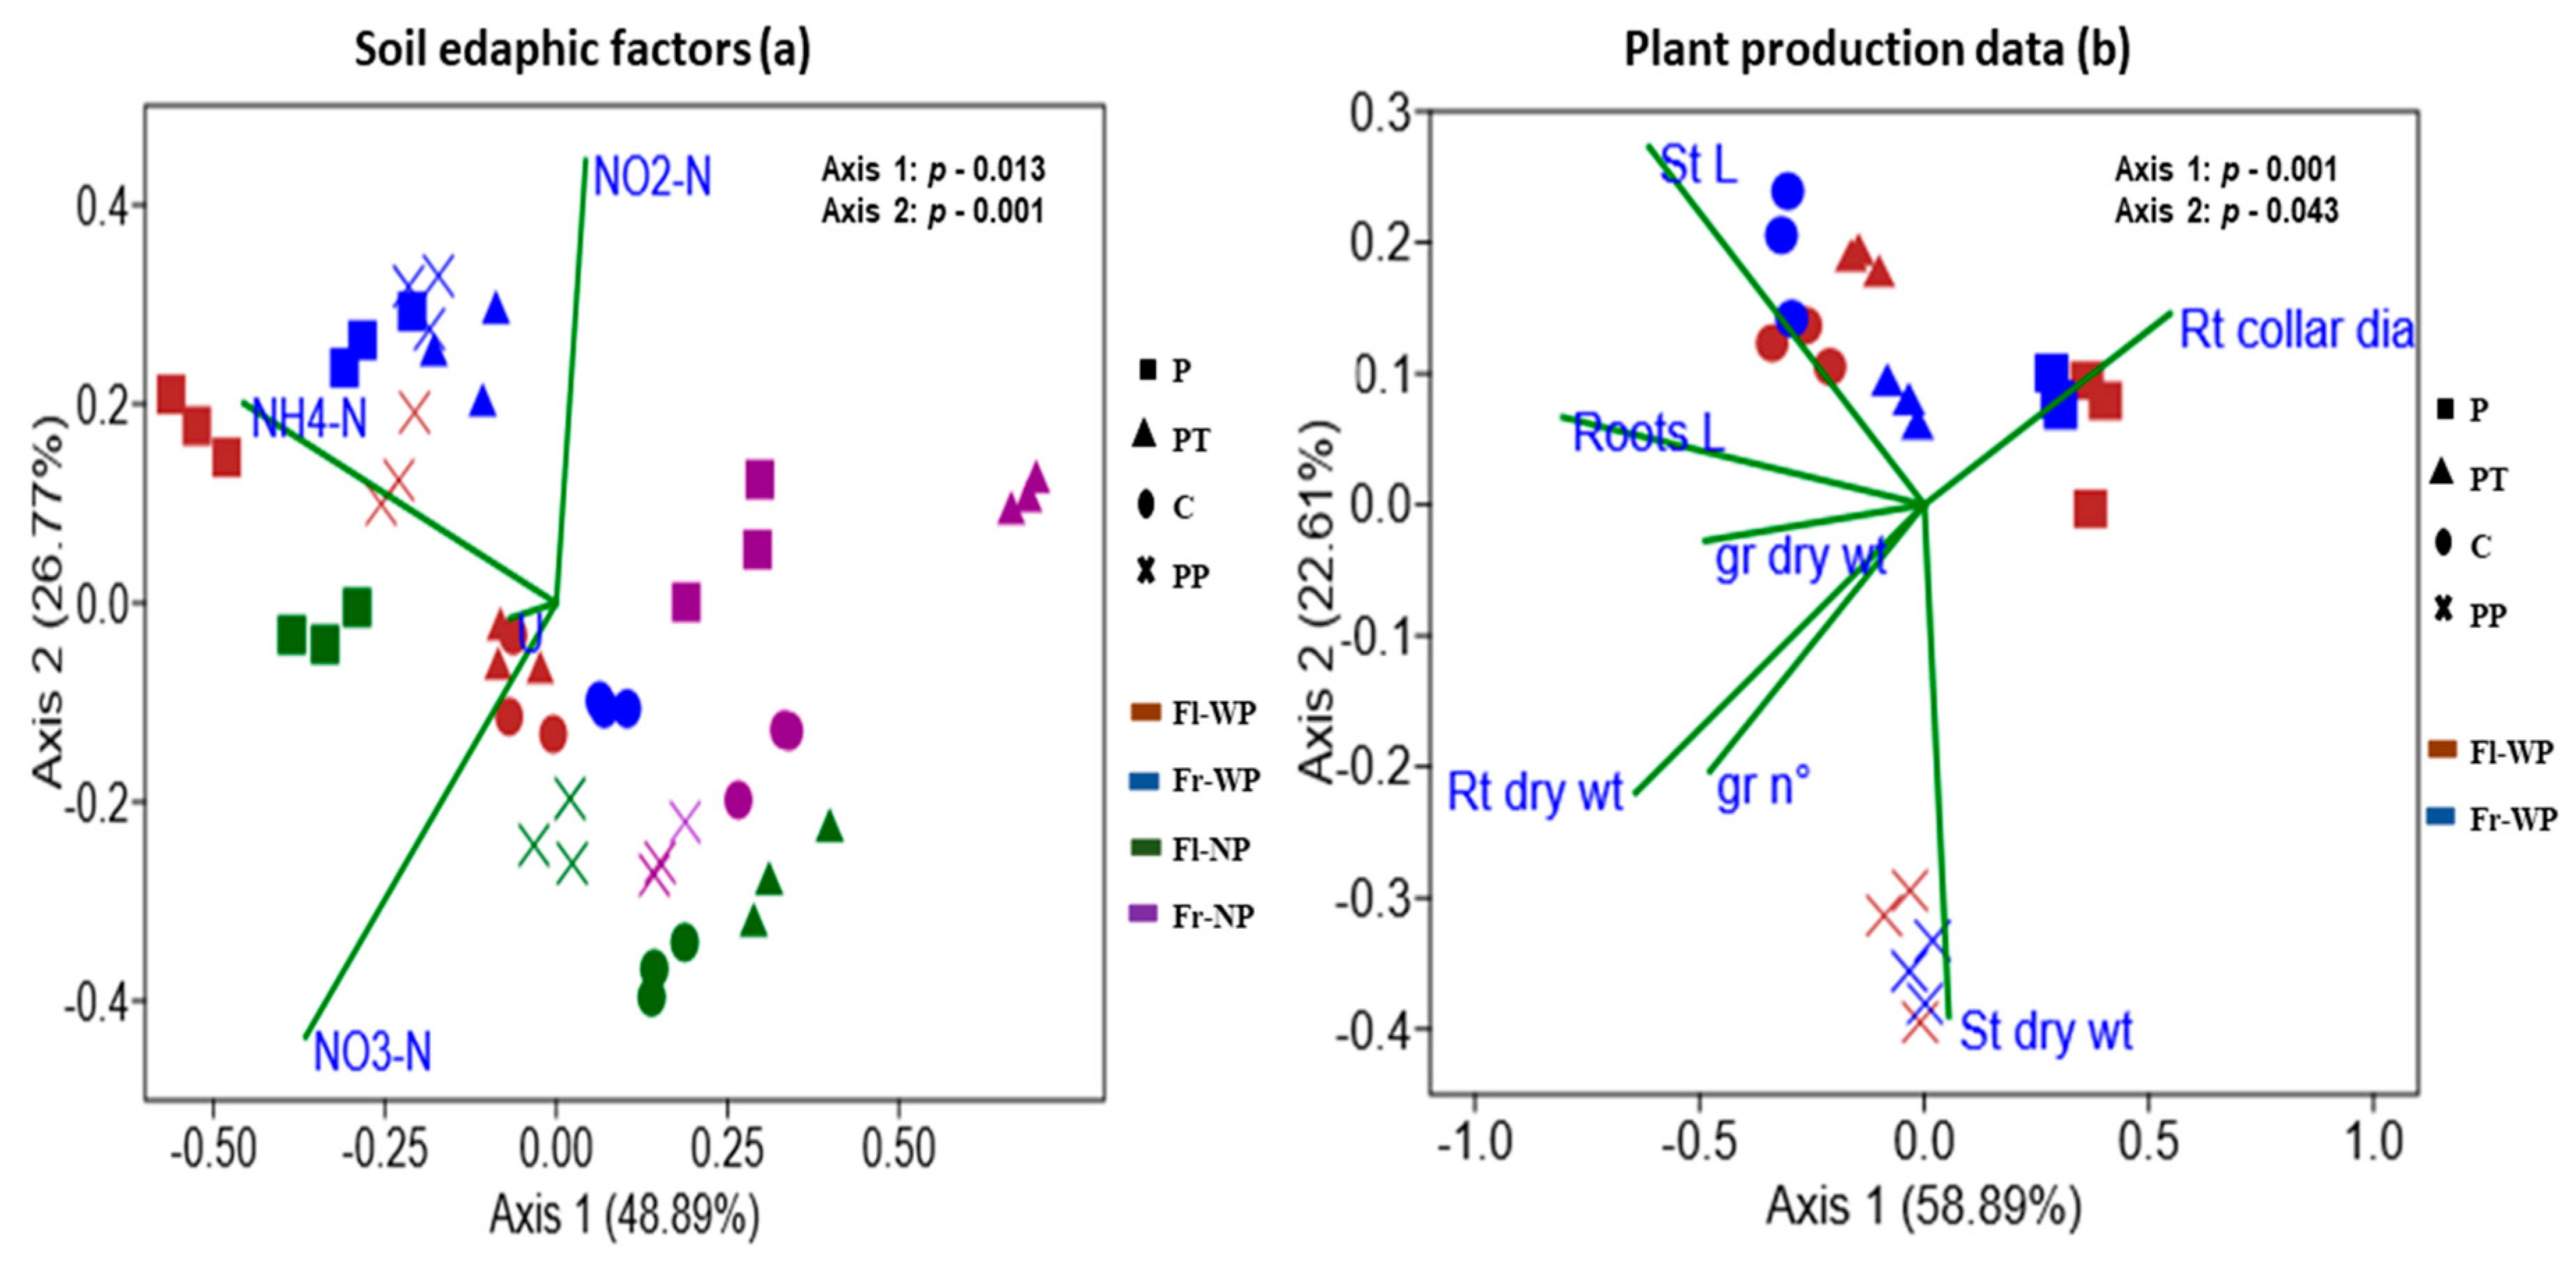
3.6. Correlation between Bacterial Community Structure and Soil Edaphic Properties and Plant Biomass Data

CCA analysis and Mantel test were performed to correlate soil and plant variables to bacterial community structure (Figure 3a,b, Table 6). Output of Mantel test indicated that different soil nitrogen forms (ammonia; p = 0.028, nitrite; p = 0.039, nitrate; p = 0.0002, urea; p = 0.032) have significant correlation with bacterial community. CCA plots showed that the first two axes explain 48.89% (p = 0.013) and 26.77% (p= 0.001) of total variance. Soil bacterial community formed distinct clusters by plant presence and fertilizer treatment, while weakly grouped into a cluster by sampling time (Figure 3a). Ammonia and nitrite had a stronger correlation with the bacterial community under the treatment of organic fertilizers (P and PP) especially, with plant presence, while urea and nitrate had a stronger correlation with the bacterial community under treatment of triple phosphate (PT) and control soil (C). Soil bacterial community without plant presence did not have a stronger correlation with N forms as shown by the community under plant presence.
To assess the link with plant variables, only soil bacterial community with plant presence were analysed (Figure 3b, Table 6). Mantel test showed that only stem length (p = 0.001), root length (p = 0.0003), and root dry weight (p = 0.0002) are significantly correlated with bacterial community. CCA plot showed that first two axes explain 58.89% (p = 0.001) and 22.50% (p = 0.043) of total variance. Soil bacterial community are distinctly clustered by fertilizer treatments, while weakly separated by sampling time. Treatment of organic fertilizers has a stronger effect as they are clustering separately from each other and also from C and PT treatments. Stem length has a stronger correlation with a bacterial community of C and PT treatment, while stem dry weight has a stronger correlation with the community treated with PP.

3.7. Bacterial Community Composition of PP and P Fertilizers

Extracting DNA from the pure PP fertilizer and sequencing the 16S rDNA, results revealed that the most represented phyla were Firmicutes (68%) and Actinobacteria (27.7%); the remaining were unknown (4.3%) (Supplementary Figure S2). Due to hydrolysis of sulphuric acid, the microbial community was not able to survive in VTLW (P) and, thus, we were not able to extract or sequence the bacterial community of VTLW (P) fertilizer.

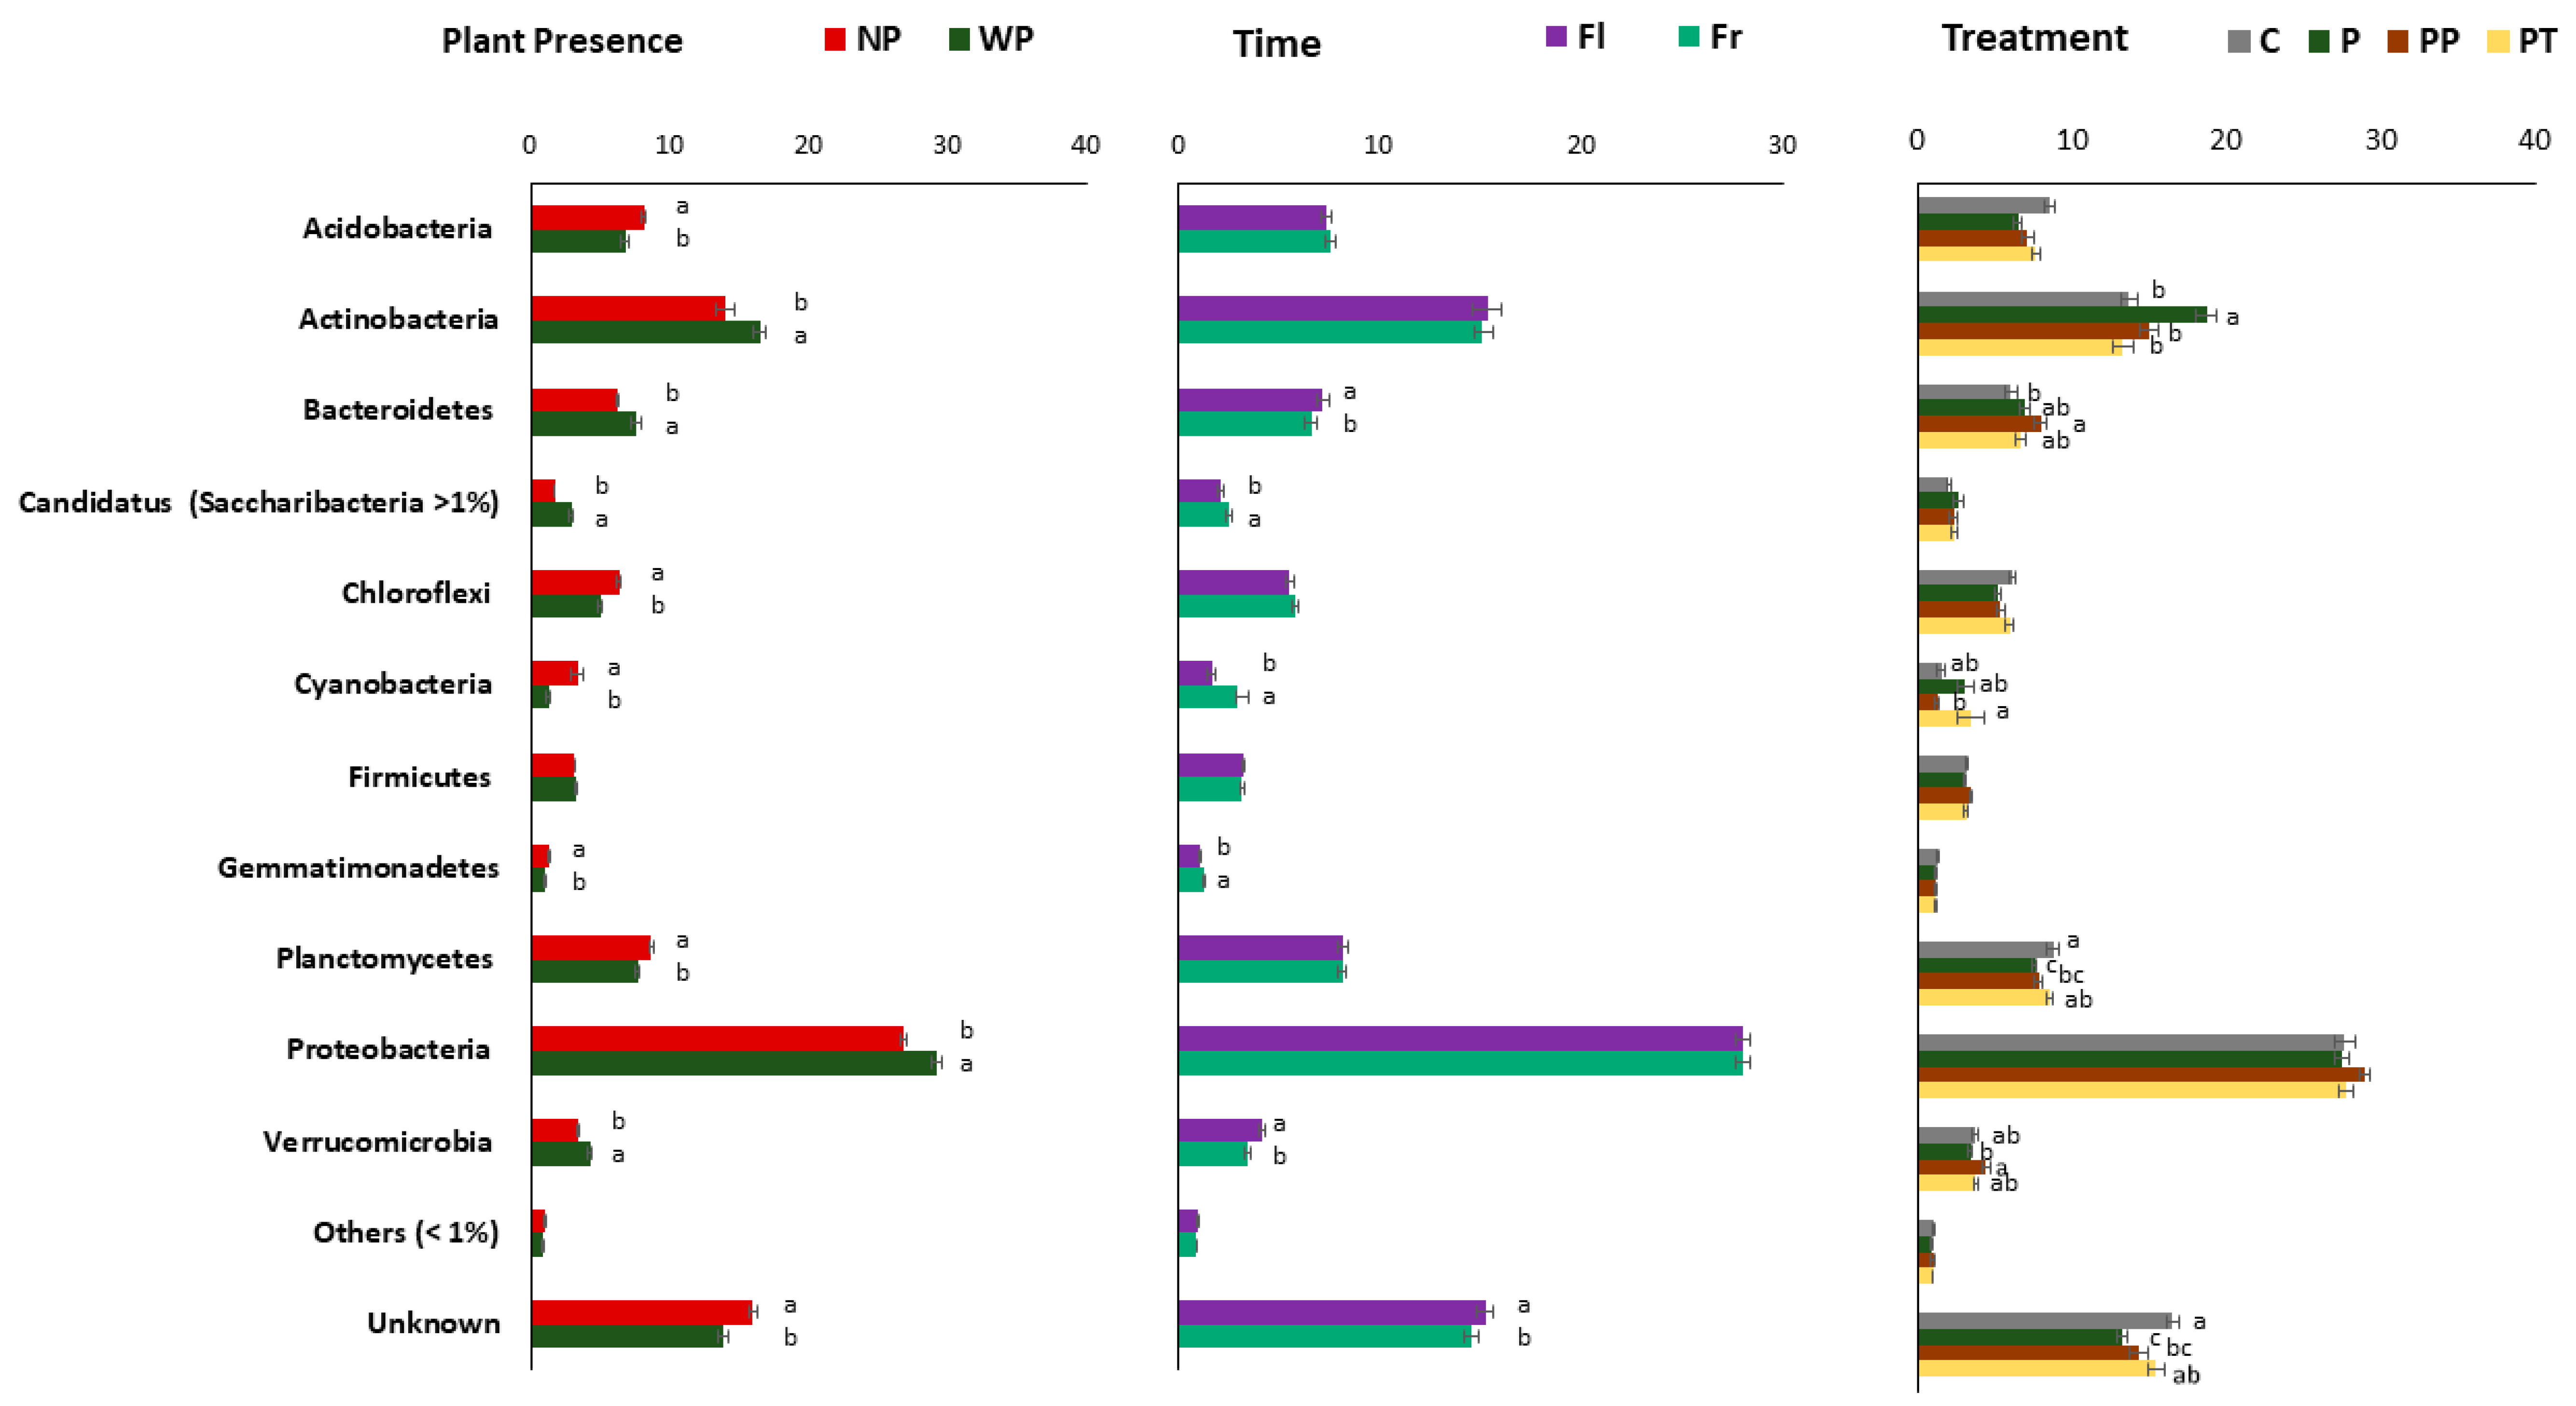
3.8. Influence of Plant Presence, Time, and Fertilizer Treatment on Taxonomic Composition

To analyse the effect of all three factors on soil bacterial composition, we assessed the bacterial relative abundance at two different taxonomic levels, Phylum, and Class. More than 50 phyla were identified in the present study, but we only showed those present >1% (Figure 4). At the class level, only the ten most abundant classes are showed (Supplementary Figure S3). Overall, phylum Proteobacteria (~30%) with classes alpha, beta, delta, and gamma was the most abundant followed by Actinobacteria (~20%), Acidobacteria (~20%), Planctomycetes (Planctomycetia), Bacteriodetes (Chitinophagia and Cytophagia), Chloroflexi, Firmicutes, Verrucomicrobia, etc. All three factors had various influences on soil bacterial taxonomic compositions.
Actinobacteria, Bacteroidetes, Proteobacteria with classes alpha, beta, and gamma, and Verrucomicrobia significantly increased in soil with plant present, while Acidobacteria, Chloroflexi, Cyanobacteria Gemmatimonadetes were significantly enriched in soil without plant (Figure 4 and Supplementary Figure S3). Further, bacilli class was significantly enriched in soil with plant (Supplementary Figure S3). Time did not have a strong effect as plant at phylum level but had a stronger effect at class level taxonomy (Supplementary Figure S3). At class level only Bacteroidetes and Verrucomicrobia were enriched during flowering time, whereas relative abundance of Candidatus, Cyanobacteria Gemmatimonadetes increased during the fruiting time. Beta and gamma Proteobacteria were significantly increased during flowering time, while alpha and delta Proteobacteria were strongly enriched during the fruiting time.
Relative abundances of Acidobacteria and Planctomycetes and unknown bacteria were depleted in all fertilizer treatments (Figure 4 and Supplementary Figure S3). Actinobacteria were significantly enriched in soil treated with VTLW (P). The relative abundance of Verrucomicrobia was strongly increased in soil treated with chicken manure (PP), while the amendment of triple phosphate (PT) significantly increased the abundance of Cyanobacteria. In general, the plant presence, time, and treatments, especially the organic fertilizers (P and PP), induced the largest variations within classes. Delta-proteobacteria was significantly affected by treatments (PP > P > PT > C) while these did not have a significant influence on other Proteobacteria (Supplementary Figure S3).
Differences in the relative abundance of the 50 most abundant OTUs were shown by heatmap analysis (Supplementary Figures S4–S6). Evidently, these OTUs differed among plant presence, time, and fertilization but with different strengths. OTUs belonging to Actinomycetales (such as OTUs 1, 2, 21) and Rhizobiales (such as OTUs 24, 25) were significantly higher in plant presence, while OTUs identified as cyanobacteria (such as OTUs 9, 10, 14) or unknown (OTUs 13, 38, 59) were highly abundant without plant.
Time did not have a strong effect as plant presence. OTUs identified for cyanobacteria phylum were more abundant during fruiting time, while the abundance of OTU 54 (Paeniglutamicibacter) and OTU60 (Pseudomonas) were significantly higher during flowering time.
Among fertilizers, OTUs belonging to Cyanobacteria were significantly more abundant in PT treatments; Arthrobacter and Pseudoarthrobacter were significantly more represented in P samples. The remaining OTUs were more or less represented at the same amount in PP and C.
Moreover, looking at the most abundant OTUs, Cyanobacteria (OTU 9, 14, 32), Paeniglutamicibacter (OTU 54) and Pseudomonas (OTU 60) were those significantly influenced by plant presence, time, and fertilizers treatments; while Actinomycetales (OTU 6), Sphingomonas (OTU 22), Chloroflexi (OTU 26) were the less influenced by the three factors.
Further, we looked for the most abundant OUTs significantly affected by all three factors, plant presence, time, and fertilizers treatments, and OTUs that are not affected by any of three factors (Supplementary Table S5). OUTs 9, 14, 32 (Cyanobacteria), 54 (Paeniglutamicibacter) and 60 (Pseudomonas) were those significantly influenced by all three factors while OTUs 6 (unknown Actinomycetales), 22 (Sphingomonas), 24 (Bradyrhizobium), 26 (unknown Chloroflexi), 30 (Nocardiodes), 45 (Hyphomicrobium) and 45 (Marmoricola) were not affected by any of the factors.

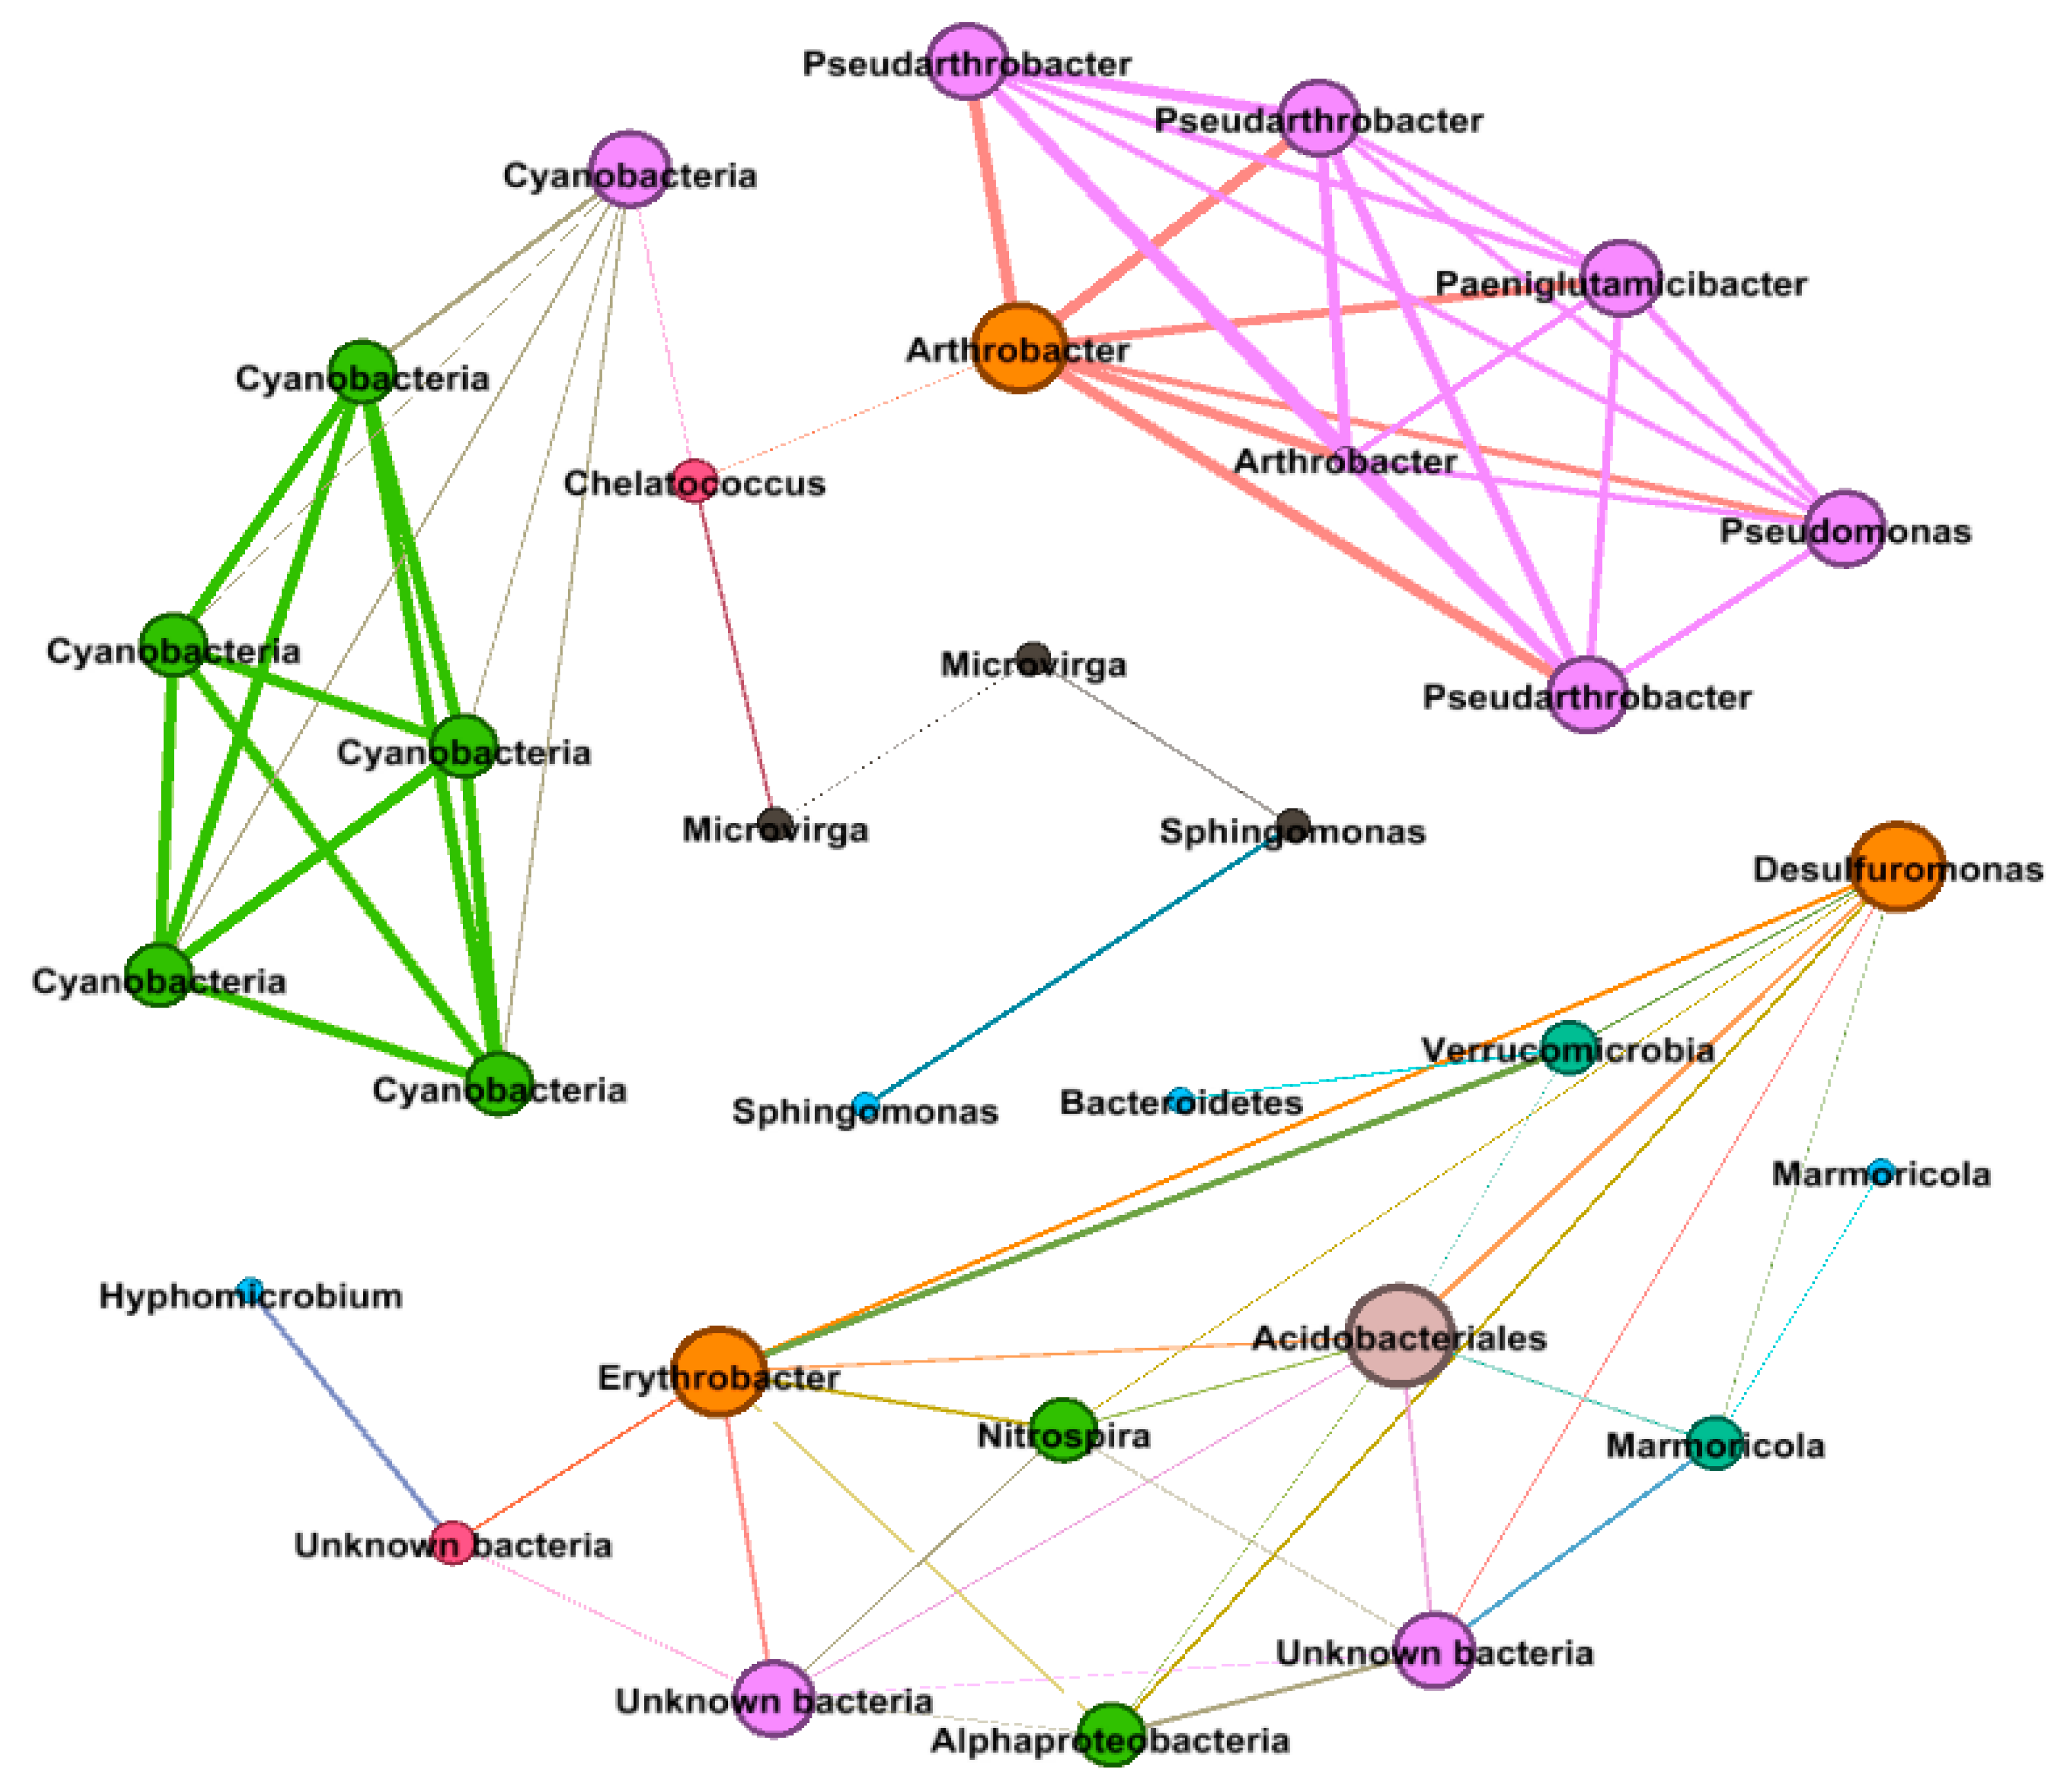
3.9. Bacterial Co-occurrence Network Analysis

Across all the considered variables, the correlation network analysis (Figure 5) showed 71 strong positive correlations among 31 genera (R > 0.6, p < 0.01) with 24 internal type and 47 external type concurrence. The network of positive correlations formed three distinct major modules (8 ≥ OTUs). The average path length (APL) between two nodes was 2.67 edges with a diameter of 6 edges. The clustering coefficient (CC) was 0.68 and the modularity index (MD) was 0.67, where MD > 0.4 suggests that the network has a modular structure. All genera in the network were assigned to a different bacterial taxonomic level. Among these, Proteobacteria, Actinobacteria, and Cyanobacteria made up the largest proportions, accounting for 32.28, 26.01, and 19.25% of all nodes, respectively. Based on betweenness centrality scores, the top genera identified were Chelatococcus (OTU 23), Arthrobacter (OTU 1), Cyanobacteria (OTU 16), and Microvirga (OTUs 44, 25), which indicated the most influential bacteria and the critical roles they play in the co-occurrence network.

4. Discussion

The variation in bacterial community composition in terms of beta diversity and taxonomy was manifested by plant presence. Driving force-underlying variances in the bacterial community can be directly due to easily available energy sources in the rhizosphere zone or indirectly due to changes in soil chemical and biochemical properties through root exudations [53,54]. Increased relative abundance of Actinobacteria, Proteobacteria, and Verrucomicrobia was also previously identified in the soil of Faba beans [18,55]. Increased abundance of N fixing bacteria such as Bardyrhizobium, Microvirga (Rhizobiales), Arthrobacter, and Psuedoarthrobacter (Actinomycetales) is anticipated in a leguminous plant. However, alpha diversity was not influenced by plant presence, which is supported by previous studies, which demonstrated that plant have less control over bacterial alpha diversity [54,56].
Fluctuation in composition and diversity of bacterial community was further supplemented by plant phenological stages. These alterations could be due to changes that occurred in the plant nutrient requirement and varied root exudation patterns at specific phenological stages [37,57]. Henceforth, the availability of varied organic substrates during flowering and fruiting time could selectively attract specific microorganisms and, thus, stimulate changes in the bacterial community. Results suggest the need of further analysis on the identification of root exudation patterns of Vicia faba during different phenological stages and consequences of a changed pattern on soil microbial community and their functions. The genus Pseudomonas is one of the more diverse genera; because of their catabolic versatility, excellent root-colonizing abilities, and capacity to produce a wide range of antifungal metabolites, the soil-borne Pseudomonas had received particular attention among PGPRs [58]. Its presence in the soil at flowering could be positive for the flower’s formation of the plant. Cyanobacteria are one of the major components of the nitrogen fixing biomass in soil and provide a potential source of nitrogen fixation at no cost. Due to the important characteristic of nitrogen fixation, Cyanobacteria have a unique potential: to contribute to productivity in a variety of agricultural and ecological situations [59,60]. Temperature is determinant to enhance the growth rate of Cyanobacteria, as they surpass other taxonomical groups under high temperature [61,62,63]. Therefore, in addition to the plant presence effect, an increase in temperature between flowering and fruiting could also have been a factor that promoted the presence of Cyanobacteria.
Concerning the fertilizer effect, there is evidence that organic and inorganic amendments with equivalent total nutrient content have comparable fertilizer effect not only on crop yield [64,65] but also on soil microbial community [38]. Alpha-diversity was significantly decreased by both organic and inorganic amendments, especially species evenness because each fertilizer tends to stimulate the growth of distinctive microbes that dominated the community of amended soil [38]. Inorganic fertilizer (PT) contains easily available micro- and macronutrients, while organic fertilizers P and PP, comprise of both C and nutrients. Further, in VTLW, 90% of nitrogen is organic N such as amino acids and peptides, while chicken manure contains up to 70% of nitrogen in the form of urea and uric acid. Slow nutrient release fertilizer P had a larger effect on community structure than PP and PT. Previous findings also showed that the addition of nutrients or labile carbon with different C:N:P ratio to soil has frequently been shown to have a divergent and selective effect on the diversity and structure of microbial community [38,66]. Considering that, varying C compound and nutrient components tend to influence the microbial community [67,68], further fluctuations in community compositions are due to the contrasting chemical composition of the used fertilizers amendments. Recent findings by Tao et al. [69] support increase of Pseudomonas in VTLW treatment, as authors reported that bioorganic fertilizers tend to increase indigenous Pseudomonas. Cyanobacteria abundance tends to increase in the optimal combination of biogenic elements in soil, such as reduced nitrogen content under a sufficient amount of phosphorus [60], which could underpin the higher abundance of these bacteria in PT treatment, which contain higher phosphorus.
We have further looked into the effect of organic-fertilizer-borne microorganism on soil microbial community because, in some way, these fertilizers contain harmful microbes, antibiotics, etc. Due to the hydrolysis of sulphuric acid, the microbial community might be not able to survive in VTLW and, thus, we were not able to extract or sequence the bacterial community of VTLW fertilizer. While we successfully sequenced and identified poultry litter, bacterial community and results clearly showed that native soil bacterial community was not adopting fertilizer-borne microorganisms. Thus, this finding suggests that poultry litter-borne microorganisms entering the soil be outcompeted by native soil-borne bacteria, thus, indicating the suppressiveness of the native microbial community to harmful pathogenic microbes.
Network analysis of OTUs based on correlation analysis provides insight into co-occurrence patterns among the 50 most abundant taxa that were influenced interactively by all three studied factors; plant, time, and fertilizers. Seventy-one positive correlations among 32 different genera indicate metabolic cooperation may play an important role in modelling species co-occurrence [70]. Proteobacteria, Actinobacteria, and Cyanobacteria were the most abundant phyla that contributed most to co-occurrence patterns, which stipulate that these generalists are adapted to a variety of environments [71,72]. Chelatococcus, Cyanobacteria, Sphingomonas, and Microvirga had the top betweenness centrality (degree of the nodes stand together), indicating their high degree of the importance of these nodes in the co-occurrence network. Cyanobacteria has already been mentioned above. Chelatococcus is an aerobic denitrifying bacteria genus and attracted a lot of attention for its denitrification rate, comparable, if not higher, to that of anaerobic denitrification in biotrickling filters [73]. Moreover, Chelatococcus can reduce atmospheric dinitrogen when living in symbiosis with leguminous plants [74]. Sphingomonas is a bacterial genus isolated from a variety of anthropogeneously contaminated environments, including soil, sediments, and aquatic habitats. Species belonging to this genus were shown to possess abilities to degrade a variety of pollutants including polycyclic aromatic hydrocarbons and herbicides [75]. This metabolic function within agricultural fields has important implications for the longevity of polluting compounds and their mobility to the ground and surface water [76,77]. Microvirga is an Alphaproteobacterial root nodule bacteria that fix nitrogen and have been isolated from nitrogen-fixing nodules of legumes. Because Microvirga is not a close relative of Rhizobium, the close affinity of nif genes to those of Rhizobium suggests that these genes were acquired through horizontal transfer [78]. These results, clearly point out that plant, time, and fertilizers not only had singular but also shared effects on bacterial community as the top five genera found in co-concurrence network were somehow also affected by each factors individually. Further, there are few genera; OTUs 6, 22, 24, 26, 30, 45, and 45 were not affected by any of the three factors, which specifies not only adoptive but resistance responsiveness of soil microbial community under different environmental circumstances.
The bacterial community was further affected by soil-plant properties, with plant roots (length and dry weight), stem length, and soil inorganic Nx as key drivers. While other plant variables did not have a significant correlation with the bacterial community. Microbial diversity was significantly correlated with soil inorganic N forms, especially the community treated with VTLW. N in VTLW was mainly available in amino acid and small peptides forms, which allow constant stimulation to the N cycling community due to slow-release tendency of given fertilizer. Thus, future work is required to study the molecular ecology of bacteria, encoding different N cycling-genes to identify responsible microbes that are performing these functions under Faba bean plantation. The plant roots and the microbial community influence each other [79]. In fact, they are able to micro-engineer their habitats by changing the porosity and clustering properties of the soil pores. Biota act to significantly alter their habitat toward a more porous, ordered, and aggregated structure that has important consequences for functional properties [80]. Our results showed that the bacterial community was significantly affected by two plant properties: root length, and root dry weight. These observations support the hypothesis that the soil–plant–microbe system is self-organized.
Moreover, the plant root system is involved in the acquisition of nutrients and water, synthesis of hormones as well as anchoring to the plant; and crop growth and yield formation is significantly affected by roots. So, we considered some root and seed parameters for a comparison between organic and inorganic treatments. Plant biomass data of PP samples (root length and dry weight, seed number, and dry weight) were significantly higher than C and P samples. On the other side, the same parameters (except root dry weight) in PP were significantly lower than in PT samples. However, considering the number and the dry weight of seeds in PP, the values were only 18.8% and 28.3% lower than in the chemical PT samples. This gap can be considered in line with the one calculated using a new large meta-dataset [81]. A question still discussed among the proponents of sustainability in agriculture concerns crop yield. There are, in fact, those who argue that sustainability should be as productive as conventional agriculture and others who argue that sustainable could be less productive than conventional in exchange for better protection of the soil, the environment, and, consequently, of human health.

5. Conclusions

In this study, we determined the effect of phosphorus-based fertilizers with equivalent total nutrients on soil bacterial community of Vicia faba. Our results suggest that variation in diversity and structure of bacterial community among different fertilizer amendment was due to fertilizer biochemical characteristics and further changes were supplemented by plant and sampling time due to differences in nutrient requirement and root exudation patent during the flowering and fruiting time. Further, changes in the bacterial community under organic amendment were due to supplied organic material, not by fertilizer-born-microbes. With this study, we offer a contribution also to reflect on the importance of improving the fertility of agricultural soil by stimulating soil microbial community, especially different plant growth-promoting bacteria, even if this involves a slightly lower production yield. Maintaining soil fertility for future generations is well worth a small renunciation. However, future research should investigate the soil functional diversity of microbial groups involved in different nutrient cycling under given treatments to the eventual selection of specific biochemical mechanisms.

Supplementary Materials

The following are available online at https://www.mdpi.com/2071-1050/12/22/9706/s1, Figure S1: Rarefaction curves of soil bacterial communities, Figure S2: The variation in bacterial community composition in chicken manure fertilizer, Figure S3: The variation in bacterial community composition in soil bacterial community at class level due to all three factors. (a) Plant presence (WP, NP), (b) Sampling time; flowering (Fl) and fruiting (Fr), and (c) Fertilizer treatments (P, PT, PP, C), Figure S4: A heatmap diagram of the dominant 50 OTUs in soil with plant presence (WP) and absence (NP), Figure S5: A heatmap diagram of the dominant 50 OTUs in soil during flowering (fl) and fruiting (fr) time, Figure S6: A heatmap diagram of the dominant 50 OTUs in soil under different fertilizers treatments, Table S1: Distribution of fertilizers and nutrient contents for given treatments, Table S2: Main effects due to treatment, sampling time, plant presence and their interaction on the variability of selected chemical variables, Table S3: Measured concentration of different soil nitrogen forms different fertilizer treatments, time and plant presence, Table S4: Individual effect of treatments, sampling time and plant presence on variability of alpha diversity, Table S5: List of most abundant OTUs that are significantly affected or not affected by all three factors, plant presence, time and fertilizers treatments.

Author Contributions

Data curation, S.I.P., M.T.C. and M.N.; Formal analysis, S.I.P., C.G., S.S. and M.N.; Methodology: S.I.P., C.G., M.N. and M.T.C.; Writing—original draft: S.I.P.; Writing—review & editing: S.I.P., C.G., M.N., M.T.C., S.S., G.P. and S.O.; supervision, M.T.C.; project administration, M.T.C. and S.O.; funding acquisition, M.T.C. and O.L. All authors have read and agreed to the published version of the manuscript.

Funding

This research was supported by the project “AgrinMec—Produzione di fertilizzante per AGRicoltura biologica: automazione del ciclo tramite Innovative parti MECcaniche” and was co-financed under Regione Toscana ERDF ROP 2014–2020–POR-CReO FESR 2014–2020 RD&I Call 2. We thank Fertilizzanti Certaldo Srl, Italy and Eco-pollina Trasimeno Srl, Castiglion Del Lago, Italy for providing fertilizers for this study.

Availability of Data and Material

The datasets used or analysed during the current study are available from the corresponding author on reasonable request.

Conflicts of Interest

The authors declare that they have no conflict of interest.

References

  1. Gogoi, N.; Baruah, K.K.; Meena, R.S. Legumes for Soil Health and Sustainable Management. In Legumes for Soil Health and Sustainable Management; Springer: Berlin/Heidelberg, Germany, 2018; pp. 511–539. [Google Scholar]
  2. Stagnari, F.; Maggio, A.; Galieni, A.; Pisante, M. Multiple benefits of legumes for agriculture sustainability: An overview. Chem. Biol. Technol. Agric. 2017, 4, 1–13. [Google Scholar] [CrossRef] [Green Version]
  3. Laik, R.; Sharma, S.; Idris, M.; Singh, A.K.; Singh, S.S.; Bhatt, B.P.; Ladha, J.K. Integration of conservation agriculture with best management practices for improving system performance of the rice-wheat rotation in the Eastern Indo-Gangetic Plains of India. Agric. Ecosyst. Environ. 2014, 195, 68–82. [Google Scholar] [CrossRef]
  4. Gan, Y.; Hamel, C.; O’Donovan, J.T.; Cutforth, H.; Zentner, R.P.; Campbell, C.A.; Poppy, L. Diversifying crop rotations with pulses enhances system productivity. Sci. Rep. 2015, 5. [Google Scholar] [CrossRef] [PubMed]
  5. Meena, R.S.; Lal, R. Legumes and Sustainable Use of soils. In Legumes for Soil Health and Sustainable Management; Meena, R.S., Lal, R., Eds.; Springer: Singapore, 2018; pp. 1–31. [Google Scholar]
  6. Malezieux, E.; Crozat, Y.; Dupraz, C.; Laurans, M.; Makowski, D.; Ozier-Lafontaine, H.; Rapidel, B.; de Tourdonnet, S.; Valantin-Morison, M. Mixing plant species in cropping systems: Concepts, tools and models. A review. Agron. Sustain. Dev. 2009, 29, 43–62. [Google Scholar] [CrossRef] [Green Version]
  7. Crépon, K.; Marget, P.; Peyronnet, C.; Carrouée, B.; Arese, P.; Duc, G. Nutritional value of faba bean (Vicia faba L.) seeds for feed and food. Field Crop. Res. 2010, 115, 329–339. [Google Scholar] [CrossRef]
  8. Etemadi, F.; Hashemi, M.; Barker, A.V.; Zandvakili, O.R.; Liu, X. Agronomy, Nutritional Value, and Medicinal Application of Faba Bean (Vicia faba L.). Hortic. Plant J. 2019, 5, 170–182. [Google Scholar] [CrossRef]
  9. Galloway, J.N.; Dentener, F.J.; Capone, D.G.; Boyer, E.W.; Howarth, R.W.; Seitzinger, S.P.; Asner, G.P.; Cleveland, C.C.; Green, P.A.; Holland, E.A.; et al. Nitrogen cycles: Past, present, and future. Biogeochemistry 2004, 70, 153–226. [Google Scholar] [CrossRef]
  10. Etemadi, F.; Hashemi, M.; Zandvakili, O.; Dolatabadian, A.; Sadeghpour, A. Nitrogen Contribution from Winter-Killed Faba Bean Cover Crop to Spring-Sown Sweet Corn in Conventional and No-Till Systems. Agron. J. 2018, 110, 455–462. [Google Scholar] [CrossRef]
  11. Wei, M.; Takeshima, K.; Yokoyama, T.; Minamisawa, K.; Mitsui, H.; Itakura, M.; Kaneko, T.; Tabata, S.; Saeki, K.; Omori, H.; et al. Temperature-Dependent Expression of Type III Secretion System Genes and Its Regulation in Bradyrhizobium japonicum. Mol. Plant-Microbe Interact. 2010, 23, 628–637. [Google Scholar] [CrossRef] [Green Version]
  12. Cabeza, R.A.; Liese, R.; Lingner, A.; Von Stieglitz, I.; Neumann, J.; Salinas-Riester, G.; Pommerenke, C.; Dittert, K.; Schulze, J. RNA-seq transcriptome profiling reveals that Medicago truncatula nodules acclimate N 2 fixation before emerging P deficiency reaches the nodules. J. Exp. Bot. 2014, 65, 6035–6048. [Google Scholar] [CrossRef] [Green Version]
  13. Míguez-Montero, M.A.; Valentine, A.; Pérez-Fernández, M.A. Regulatory effect of phosphorus and nitrogen on nodulation and plant performance of leguminous shrubs. AoB Plants 2019, 12, 1–11. [Google Scholar] [CrossRef]
  14. Chen, Y.; Camps-Arbestain, M.; Shen, Q.; Singh, B.; Cayuela, M.L. The long-term role of organic amendments in building soil nutrient fertility: A meta-analysis and review. Nutr. Cycl. Agroecosyst. 2018, 111, 103–125. [Google Scholar] [CrossRef]
  15. Swanepoel, P.A.; Botha, P.R.; Truter, W.F.; Surridge-Talbot, A.K. No TitleThe effect of soil carbon on symbiotic nitrogen fixation and symbiotic Rhizobium populations in soil with Trifolium repens as host plant. Afr. J. Range Forage Sci. 2011, 28, 121–128. [Google Scholar] [CrossRef]
  16. Artursson, V.; Finlay, R.D.; Jansson, J.K. Interactions between arbuscular mycorrhizal fungi and bacteria and their potential for stimulating plant growth. Environ. Microbiol. 2006, 8, 1–10. [Google Scholar] [CrossRef] [PubMed]
  17. Morris, S.J.; Blackwood, C.B. The Ecology of the Soil Biota and their Function. In Soil Microbiology, Ecology and Biochemistry, 4th ed.; Elsevier: Amsterdam, The Netherlands, 2015; pp. 273–309. [Google Scholar]
  18. Zhou, Y.; Zhu, H.; Fu, S.; Yao, Q. Variation in Soil Microbial Community Structure Associated with Different Legume Species Is Greater than that Associated with Different Grass Species. Front. Microbiol. 2017, 8, 1007. [Google Scholar] [CrossRef] [PubMed]
  19. Coleman, D.C.; Whitman, W.B. Linking species richness, biodiversity and ecosystem function in soil systems. Pedobiologia 2005, 49, 479–497. [Google Scholar] [CrossRef] [Green Version]
  20. Sánchez-Cañizares, C.; Jorrín, B.; Poole, P.S.; Tkacz, A. Understanding the holobiont: The interdependence of plants and their microbiome. Curr. Opin. Microbiol. 2017, 38, 188–196. [Google Scholar] [CrossRef]
  21. McLaren, J.R.; Turkington, R. Plant Identity Influences Decomposition through More Than One Mechanism. PLoS ONE 2011, 6, e23702. [Google Scholar] [CrossRef]
  22. Mele, P.M.; Crowley, D.E. Application of self-organizing maps for assessing soil biological quality. Agric. Ecosyst. Environ. 2008, 126, 139–152. [Google Scholar] [CrossRef]
  23. Zhong, W.; Gu, T.; Wang, W.; Zhang, B.; Lin, X.; Huang, Q.; Shen, W. The effects of mineral fertilizer and organic manure on soil microbial community and diversity. Plant Soil 2010, 326, 511–522. [Google Scholar] [CrossRef]
  24. Bünemann, E.; Bossio, D.; Smithson, P.; Frossard, E.; Oberson, A. Microbial community composition and substrate use in a highly weathered soil as affected by crop rotation and P fertilization. Soil Biol. Biochem. 2004, 36, 889–901. [Google Scholar] [CrossRef]
  25. Zhang, N.N.; Sun, Y.M.; Li, L.; Wang, E.T.; Chen, W.X.; Yuan, H. Effects of intercropping and Rhizobium inoculation on yield and rhizosphere bacterial community of faba bean (Vicia faba L.). Biol. Fertil. Soils 2010, 46, 625–639. [Google Scholar] [CrossRef]
  26. Duchene, O.; Vian, J.-F.; Celette, F. Intercropping with legume for agroecological cropping systems: Complementarity and facilitation processes and the importance of soil microorganisms. A review. Agric. Ecosyst. Environ. 2017, 240, 148–161. [Google Scholar] [CrossRef]
  27. Chaudhari, D.; Rangappa, K.; Das, A.; Layek, J.; Basavaraj, S.; Kandpal, B.K.; Shouche, Y.; Rahi, P. Pea (Pisum sativum l.) Plant Shapes Its Rhizosphere Microbiome for Nutrient Uptake and Stress Amelioration in Acidic Soils of the North-East Region of India. Front. Microbiol. 2020, 11, 968. [Google Scholar] [CrossRef] [PubMed]
  28. Latati, M.; Blavet, D.; Alkama, N.; Laoufi, H.; Drevon, J.-J.; Gerard, F.; Pansu, M.; Ounane, S.M. The intercropping cowpea-maize improves soil phosphorus availability and maize yields in an alkaline soil. Plant Soil 2014, 385, 181–191. [Google Scholar] [CrossRef]
  29. Latati, M.; Bargaz, A.; Belarbi, B.; Lazali, M.; Benlahrech, S.; Tellah, S.; Kaci, G.; Drevon, J.J.; Ounane, S.M. The intercropping common bean with maize improves the rhizobial efficiency, resource use and grain yield under low phosphorus availability. Eur. J. Agron. 2016, 72, 80–90. [Google Scholar] [CrossRef]
  30. S Pathan, S.I.; Ceccherini, M.T.; Sunseri, F.; Lupini, A. Rhizosphere as Hotspot for Plant-Soil-Microbe Interaction. In Carbon and Nitrogen Cycling in Soil; Springer: Berlin/Heidelberg, Germany, 2019; pp. 17–43. [Google Scholar]
  31. Bardgett, R.D.; Van Der Putten, W.H. Belowground biodiversity and ecosystem functioning. Nat. Cell Biol. 2014, 515, 505–511. [Google Scholar] [CrossRef]
  32. Philippot, L.; Raaijmakers, J.M.; Lemanceau, P.; Van Der Putten, W.H. Going back to the roots: The microbial ecology of the rhizosphere. Nat. Rev. Genet. 2013, 11, 789–799. [Google Scholar] [CrossRef]
  33. Dhakal, D.; Islam, M.A. Grass-Legume Mixtures for Improved Soil Health in Cultivated Agroecosystem. Sustainability 2018, 10, 2718. [Google Scholar] [CrossRef] [Green Version]
  34. Holford, I.C.R. Soil phosphorus: Its measurement, and its uptake by plants. Soil Res. 1997, 35, 227. [Google Scholar] [CrossRef]
  35. Bhattacharyya, P.N.; Jha, D.K. Plant growth-promoting rhizobacteria (PGPR): Emergence in agriculture. World J. Microbiol. Biotechnol. 2012, 28, 1327–1350. [Google Scholar] [CrossRef] [PubMed]
  36. Ali, W.; Nadeem, M.; Ashiq, W.; Zaeem, M.; Gilani, S.S.M.; Rajabi-Khamseh, S.; Pham, T.H.; Kavanagh, V.; Thomas, R.; Cheema, M. The effects of organic and inorganic phosphorus amendments on the biochemical attributes and active microbial population of agriculture podzols following silage corn cultivation in boreal climate. Sci. Rep. 2019, 9, 1–17. [Google Scholar] [CrossRef] [PubMed] [Green Version]
  37. Lori, M.; Symnaczik, S.; Mäder, P.; De Deyn, G.; Gattinger, A. Organic farming enhances soil microbial abundance and activity—A meta-analysis and meta-regression. PLoS ONE 2017, e0180442. [Google Scholar] [CrossRef] [PubMed]
  38. Celestina, C.; Wood, J.L.; Manson, J.B.; Wang, X.; Sale, P.W.G.; Tang, C.; Franks, A.E. Microbial communities in top- and subsoil of repacked soil columns respond differently to amendments but their diversity is negatively correlated with plant productivity. Sci. Rep. 2019, 9, 1–12. [Google Scholar] [CrossRef]
  39. Schlesinger, H.V. Ferrous nitroso c0mpounds. J. Am. Chem. Soc. 1929, 51, 1323–1331. [Google Scholar] [CrossRef]
  40. Kustin, K.; Taub, I.A.; Weinstock, E. A Kinetic study of the formation of the Ferrous-Nitric Oxide Complexis. Inorg. Chem. 1966, 5, 1079–1082. [Google Scholar] [CrossRef]
  41. Irandoust, M.; Shariati-Rad, M.; Haghighi, M. Nitrite determination in water samples based on a modified Griess reaction and central composite design. Anal. Methods 2013, 5, 5977–5982. [Google Scholar] [CrossRef]
  42. Panico, S.C.; Ceccherini, M.T.; Memoli, V.; Maisto, G.; Pietramellara, G.; Barile, R.; De Marco, A. Effects of different vegetation types on burnt soil properties and microbial communities. Int. J. Wildland Fire 2020, 29, 628. [Google Scholar] [CrossRef]
  43. Klindworth, A.; Pruesse, E.; Schweer, T.; Peplies, J.; Quast, C.; Horn, M.; Glöckner, F.O. Evaluation of general 16S ribosomal RNA gene PCR primers for classical and next-generation sequencing-based diversity studies. Nucleic Acids Res. 2013, 41, e1. [Google Scholar] [CrossRef] [PubMed]
  44. Větrovský, T.; Baldrian, P. The Variability of the 16S rRNA Gene in Bacterial Genomes and Its Consequences for Bacterial Community Analyses. PLoS ONE 2013, 8, e57923. [Google Scholar] [CrossRef] [PubMed] [Green Version]
  45. Rognes, T.; Flouri, T.; Nichols, B.; Quince, C.; Mahé, F. VSEARCH: A versatile open source tool for metagenomics. PeerJ 2016, 4, e2584. [Google Scholar] [CrossRef] [PubMed]
  46. Wang, Q.; Garrity, G.M.; Tiedje, J.M.; Cole, J.R. Naiïve Bayesian Classifier for Rapid Assignment of rRNA Sequences into the New Bacterial Taxonomy. Appl. Environ. Microbiol. 2007, 73, 5261–5267. [Google Scholar] [CrossRef] [PubMed] [Green Version]
  47. Hammer, Ø.; Harper, D.A.; Ryan, P.D. PAST: Paleontological Statistics software packages for education and data analysis. Palaeontol. Electron. 2001, 4, 4–9. [Google Scholar]
  48. Anderson, M.; Ter Braak, C. Permutation tests for multi-factorial analysis of variance. J. Stat. Comput. Simul. 2003, 73, 85–113. [Google Scholar] [CrossRef]
  49. Harrell, J. Hmisc: Harrell Miscellaneous. R Package Version 3.5-2. 2008. Available online: https://cran.r-project.org/web/packages/Hmisc/Hmisc.pdf (accessed on 18 November 2020).
  50. Csardi, G.; Nepusz, T. The igraph software package for complex network research. Int. J. Complex Syst. 2006, 1695, 1–9. [Google Scholar]
  51. Vick-Majors, T.J.; Priscu, J.C.; Amaral-Zettler, L.A. Modular community structure suggests metabolic plasticity during the transition to polar night in ice-covered Antarctic lakes. ISME J. 2014, 8, 778–789. [Google Scholar] [CrossRef] [Green Version]
  52. Lambiotte, R.; Delvenne, J.C.; Barahona, M. Random walks, Markov processes and the multiscale modular organization of complex networks. IEEE Trans Netw. Sci. Eng. 2014, 1, 76–90. [Google Scholar] [CrossRef] [Green Version]
  53. Van Der Heijden, M.G.A.; Bardgett, R.D.; Van Straalen, N.M. The unseen majority: Soil microbes as drivers of plant diversity and productivity in terrestrial ecosystems. Ecol. Lett. 2008, 11, 296–310. [Google Scholar] [CrossRef]
  54. Wardle, D.A.; Bardgett, R.D.; Klironomos, J.N.; Setälä, H.; Van Der Putten, W.H.; Wall, D.H. Ecological Linkages Between Aboveground and Belowground Biota. Science 2004, 304, 1629–1633. [Google Scholar] [CrossRef]
  55. Siczek, A.; Frąc, M.; Gryta, A.; Kalembasa, S.; Kalembasa, D. Variation in soil microbial population and enzyme activities under faba bean as affected by pentachlorophenol. Appl. Soil Ecol. 2020, 150, 103466. [Google Scholar] [CrossRef]
  56. Prober, S.M.; Leff, J.W.; Bates, S.T.; Borer, E.T.; Firn, J.; Harpole, W.S.; Lind, E.M.; Seabloom, E.W.; Adler, P.B.; Bakker, J.D.; et al. Plant diversity predicts beta but not alpha diversity of soil microbes across grasslands worldwide. Ecol. Lett. 2015, 18, 85–95. [Google Scholar] [CrossRef] [PubMed]
  57. Baudoin, E.; Benizri, E.; Guckert, A. Impact of artificial root exudates on the bacterial community structure in bulk soil and maize rhizosphere. Soil Biol. Biochem. 2003, 35, 1183–1192. [Google Scholar] [CrossRef]
  58. Fischer, S.; Jofré, E.C.; Cordero, P.V.; Mañero, F.J.G.; Mori, G.B. Survival of native Pseudomonas in soil and wheat rhizosphere and antagonist activity against plant pathogenic fungi. Antonie van Leeuwenhoek 2009, 97, 241–251. [Google Scholar] [CrossRef] [PubMed]
  59. Arora, N.K.; Fatima, T.; Mishra, I.; Verma, M.; Mishra, J.; Mishra, V. Environmental sustainability: Challenges and viable solutions. Environ. Sustain. 2018, 1, 309–340. [Google Scholar] [CrossRef]
  60. Pankratova, E.M. Functioning of cyanobacteria in soil ecosystems. Eurasian Soil Sci. 2006, 39, S118–S127. [Google Scholar] [CrossRef]
  61. Jeppesen, E.; Meerhoff, M.; Davidson, T.A.; Trolle, D.; Søndergaard, M.; Lauridsen, T.L.; Beklioglu, M.; Brucet, S.; Volta, P.; González-Bergonzoni, I.; et al. Climate change impacts on lakes: An integrated ecological perspective based on a multi-faceted approach, with special focus on shallow lakes. J. Limnol. 2014, 73, 88–111. [Google Scholar] [CrossRef] [Green Version]
  62. Singh, J.S.; Kumar, A.; Rai, A.N.; Singh, D.P. Cyanobacteria: A Precious Bio-resource in Agriculture, Ecosystem, and Environmental Sustainability. Front. Microbiol. 2016, 7, 529. [Google Scholar] [CrossRef] [Green Version]
  63. Savadova, K.; Mazur-Marzec, H.; Karosienė, J.; Kasperovičienė, J.; Vitonytė, I.; Toruńska-Sitarz, A.; Koreivienė, J. Effect of Increased Temperature on Native and Alien Nuisance Cyanobacteria from Temperate Lakes: An Experimental Approach. Toxins 2018, 10, 445. [Google Scholar] [CrossRef] [Green Version]
  64. Chen, J.; Shen, W.; Xu, H.; Li, Y.; Luo, T. The Composition of Nitrogen-Fixing Microorganisms Correlates With Soil Nitrogen Content During Reforestation: A Comparison Between Legume and Non-legume Plantations. Front. Microbiol. 2019, 10, 508. [Google Scholar] [CrossRef] [Green Version]
  65. Hijbeek, R.; Van Ittersum, M.; Berge, H.T.; Gort, G.; Spiegel, H.; Whitmore, A. Do organic inputs matter—A meta-analysis of additional yield effects for arable crops in Europe. Plant Soil 2017, 411, 293–303. [Google Scholar] [CrossRef] [Green Version]
  66. Li, H.-B.; Singh, R.K.; Singh, P.; Song, Q.-Q.; Xing, Y.-X.; Yang, L.-T.; Li, Y.-R. Genetic Diversity of Nitrogen-Fixing and Plant Growth Promoting Pseudomonas Species Isolated from Sugarcane Rhizosphere. Front. Microbiol. 2017, 8, 1268. [Google Scholar] [CrossRef]
  67. Cozzolino, V.; Di Meo, V.; Monda, H.; Spaccini, R.; Piccolo, A. The molecular characteristics of compost affect plant growth, arbuscular mycorrhizal fungi, and soil microbial community composition. Biol. Fertil. Soils 2015, 52, 15–29. [Google Scholar] [CrossRef]
  68. Baumann, K.; Marschner, P.; Smernik, R.J.; Baldock, J.A. Residue chemistry and microbial community structure during decomposition of eucalypt, wheat and vetch residues. Soil Biol. Biochem. 2009, 41, 1966–1975. [Google Scholar] [CrossRef]
  69. Tao, C.; Li, R.; Xiong, W.; Shen, Z.; Liu, S.; Wang, B.; Ruan, Y.; Geisen, S.; Shen, Q.; Kowalchuk, G.A. Bio-organic fertilizers stimulate indigenous soil Pseudomonas populations to enhance plant disease suppression. Microbiome 2020, 8, 1–14. [Google Scholar] [CrossRef]
  70. Zelezniak, A.; Andrejev, S.; Ponomarova, O.; Mende, D.R.; Bork, P.; Patil, K.R. Metabolic dependencies drive species co-occurrence in diverse microbial communities. Proc. Natl. Acad. Sci. USA 2015, 112, 6449–6454. [Google Scholar] [CrossRef] [Green Version]
  71. Jiao, S.; Xu, Y.; Zhang, J.; Hao, X.; Lu, Y. Core Microbiota in Agricultural Soils and Their Potential Associations with Nutrient Cycling. mSystems 2019, 4, 1–16. [Google Scholar] [CrossRef] [PubMed] [Green Version]
  72. Xue, L.; Ren, H.; Li, S.; Leng, X.; Yao, X. Soil Bacterial Community Structure and Co-occurrence Pattern during Vegetation Restoration in Karst Rocky Desertification Area. Front. Microbiol. 2017, 8, 2377. [Google Scholar] [CrossRef] [Green Version]
  73. Liang, W.; Huang, S.; Liu, J.; Zhang, R.; Yan, F. Removal of nitric oxide in a biotrickling filter under thermophilic condition using Chelatococcus daeguensis. J. Air Waste Manag. Assoc. 2012, 62, 509–516. [Google Scholar] [CrossRef] [Green Version]
  74. Valenzuela-Encinas, C.; Neria-González, I.; Alcántara-Hernández, R.J.; Estrada-Alvarado, I.; De La Serna, F.J.Z.-D.; Dendooven, L.; Marsch, R. Changes in the bacterial populations of the highly alkaline saline soil of the former lake Texcoco (Mexico) following flooding. Extremophiles 2009, 13, 609–621. [Google Scholar] [CrossRef] [PubMed]
  75. Leys, N.M.E.J.; Ryngaert, A.; Bastiaens, L.; Verstraete, W.; Top, E.M.; Springael, D. Occurrence and Phylogenetic Diversity of Sphingomonas Strains in Soils Contaminated with Polycyclic Aromatic Hydrocarbons. Appl. Environ. Microbiol. 2004, 70, 1944–1955. [Google Scholar] [CrossRef] [Green Version]
  76. Bending, G.D.; Lincoln, S.D.; Sørensen, S.R.; Morgan, J.A.W.; Aamand, J.; Walker, A. In-Field Spatial Variability in the Degradation of the Phenyl-Urea Herbicide Isoproturon Is the Result of Interactions between Degradative Sphingomonas spp. and Soil pH. Appl. Environ. Microbiol. 2003, 69, 827–834. [Google Scholar] [CrossRef] [PubMed] [Green Version]
  77. Sørensen, S.R.; Ronen, Z.; Aamand, J. Isolation from Agricultural Soil and Characterization of a Sphingomonas sp. Able To Mineralize the Phenylurea Herbicide Isoproturon. Appl. Environ. Microbiol. 2001, 67, 5403–5409. [Google Scholar] [CrossRef] [PubMed] [Green Version]
  78. Ardley, J.; Parker, M.A.; De Meyer, S.E.; Trengove, R.D.; O’Hara, G.W.; Reeve, W.G.; Yates, R.J.; Dilworth, M.J.; Willems, A.; Howieson, J.G. Microvirga lupini sp. nov., Microvirga lotononidis sp. nov. and Microvirga zambiensis sp. nov. are alphaproteobacterial root-nodule bacteria that specifically nodulate and fix nitrogen with geographically and taxonomically separate legume hosts. Int. J. Syst. Evol. Microbiol. 2012, 62, 2579–2588. [Google Scholar] [CrossRef] [PubMed]
  79. Pathan, S.I.; Vetrovsky, T.; Giagnoni, L.; Datta, R.; Baldrian, P.; Nannipieri, P.; Renella, G. Microbial expression profiles in the rhizosphere of two maize lines differing in N use efficiency. Plant Soil 2018, 433, 401–413. [Google Scholar] [CrossRef]
  80. Feeney, D.S.; Crawford, J.W.; Daniell, T.; Hallett, P.D.; Nunan, N.; Ritz, K.; Rivers, M.; Young, I.M. Three-dimensional Microorganization of the Soil–Root–Microbe System. Microb. Ecol. 2006, 52, 151–158. [Google Scholar] [CrossRef] [PubMed]
  81. Ponisio, L.C.; M’Gonigle, L.K.; Mace, K.C.; Palomino, J.; De Valpine, P.; Kremen, C. Diversification practices reduce organic to conventional yield gap. Proc. R. Soc. B Boil. Sci. 2015, 282, 20141396. [Google Scholar] [CrossRef] [PubMed] [Green Version]
Figure 1. Venn diagram of exclusive and shared bacterial operational taxonomic units (OTUs) (at the 3% of evolutionary distance) under a plant, time, and fertilizer treatments.
Sustainability 12 09706 g001
Figure 2. Principal Coordinate Analysis (PCoA) based on Bray–Curtis similarity distance of OTUs with abundance >0.1% of soil bacterial community. (a) Plant presence, with plants (WP) and no plants (NP), (b) Sampling time; flowering (Fl) and fruiting (Fr), and (c) Fertilizer treatments (organic fertilizers (P and PP), triple phosphate (PT), control soil (C). Significant differences detected by permutational MANOVA (PERMANOVA).
Sustainability 12 09706 g002
Figure 3. Canonical corresponding analysis based on Bray–Curtis similarity distance of OTUs with abundance >0.1% of soil bacterial community to quantify the impacts of (a) soil edaphic factors and (b) plant production data on bacterial community structure. (a) NH4N: ammonium nitrogen, NO2N: nitrite nitrogen, NO3N: nitrate nitrogen, U: urea; (b) St L: stems length, St dry wt: stems dry weight, Rt collar dia: roots collar diameters, Roots L: roots length, Rt dry wt: roots dry weight, gr nº: seeds nº, gr dry wt: seeds dry weight.
Sustainability 12 09706 g003
Figure 4. The variation in bacterial community composition in soil bacterial community at phylum level due to all three factors. (a) Plant presence (WP, NP), (b) Sampling time; flowering (Fl) and fruiting (Fr), and (c) Fertilizer treatments (P, PT, PP, C). Data represent means and errors of 12 replicates for treatments and 24 replicates for sampling time and plant presence. Significant differences detected by T test or One-way ANOVA followed by Tukey post hoc test, p < 0.05.
Sustainability 12 09706 g004
Figure 5. Network of co-occurring OTUs in different fertilizer treatments, based on correlation analysis. Each edge stands for a strong (Spearman’s ρ > 0.6) and significant (p < 0.01) correlation. The size of each node is proportional to the number of connections (i.e., degree). The nodes are also coloured by degree proportion. The thickness of the edges is proportional to the robustness of a given Spearman’s ρ, ranging from 0.6 to 0.9.
Sustainability 12 09706 g005
Table 1. The main characteristics of soil used in this study.
Sand%Silt%Clay%TotalCaCO3%pHH2OOM%CECcmolc kg−1Exchangeable Cations cmolc kg−1EC1:2.5mS cm−1
Ca++Mg++Na+K+
88.807.403.800.006.900.303.501.910.050.000.080.05
Table 2. The main characteristics of fertilizers used in this study.
N
%
P2O5
%
OC
%
SO3
%
VTLW3.011.017.212.0
PCM3.02.071.00.0
TP0.046.00.00.0
U46.00.00.00.0
NSRP0.025.00.00.0
Table 3. Plant biomass data in function of organic and inorganic fertilizers.
TreatmentStems Length (mm)Stem and Leaves Dry Weight (g)Roots Collar Diameter (g)Roots Length (g)Roots Dry Weight (g)Seeds (n°)Seed Dry Weight (g)
C556.7 ± 23.2 a15.7 ± 1.2 a9.4 ± 0.8 a567.3 ± 40.1 a5.5 ± 1.1 ab11.4 ± 3.5 ab11.9 ± 5.5 ab
P510 ± 20.4 a15.8 ± 6.9 a10.4 ± 0.4 a413.3 ± 20.5 b3.1 ± 1.3 b4.6 ± 1.2 b5.7 ± 2.4 b
PP517.6 ± 14.3 a18.5 ± 5.3 a9.6 ± 0.4 a507.9 ± 52.6 ab8.9 ± 1.9 a15.5 ± 6.5 ab13.7 ± 3.3 ab
PT526.3 ± 13.5 a13.3 ± 0.9 a10.1 ± 0.4 a533.8 ± 39.1 a7.2 ± 0.5 a17.4 ± 2.6 a19.1 ± 3.2 a
Quantities are expressed per pot. Significant differences are shown in the column and are indicated in different lowercase letters (One-way ANOVA followed by Tukey post hoc test, p < 0.05). Means followed by a different letter indicate significant differences at p < 0.05.
Table 4. Main effects due to treatment, sampling time, plant presence, and their interaction on the variability of selected alpha diversities.
Factordf#Shannon-Wiener IndexEvennessChao-1
Fertilizers56.13 **23.86 ***0.22 ns
Time13.37 *25.44 ***7.67 **
Plant presence10.07 ns0.22 ns0.10 ns
Fertilizers × Time51.06 ns3.79 *0.12 ns
Fertilizers × Plant presence53.86 *3.02 *3.93 *
Time × Plant presence10.01 ns2.27 ns0.01 ns
Fertilizers × Time × Plant presence52.95 *4.06 *2.210 ns
Values are F-values (F-stat) from three-dimensional ANOVA (treatment × time × plant presence) with the corresponding P level and statistical significance. Significance: * p < 0.05; ** p < 0.01; *** p < 0.001; ns: not significant; df# Degrees of freedom.
Table 5. Pearson correlation coefficients between alpha diversity and environmental factors. (a) Correlation with soil chemical properties, (b) correlation with plant parameters. Values >0.55 or <0.55 showed are significant positive or negative correlation. Blue to pink colour indicates positive to negative correlations Sustainability 12 09706 i001.
a Soil ParametersFloweringFruiting
Shannon IndexEvennessChao-1Shannon IndexEvennessChao-1
With plantNO3-N−0.33−0.27−0.14−0.240.04−0.23
NO2-N0.050.43−0.1200.02−0.19
NH4-N0.070.75−0.28−0.39−0.11−0.26
U-N0.22−0.110.3−0.140.22−0.41
Without plantNO3-N−0.47−0.59−0.180.250.47−0.3
NO2-N0.380.780.080.330.070.37
NH4-N−0.91−0.85−0.59−0.35−0.470.02
U-N−0.54−0.79−0.2−0.64−0.75−0.06
b Plant parametersFloweringFruiting
Shannon IndexEvennessChao-1Shannon IndexEvennessChao-1
With plantStems length−0.230.65-0.430.480.87−0.54
Stems dry weight−0.26−0.02−0.22−0.1−0.04−0.06
Roots collar diameter0.04−0.310.21−0.49−0.31−0.2
Roots length−0.020.61−0.250.610.86−0.3
Roots dry weight−0.440.78−0.610.370.52−0.27
Seed n°0.20.45−0.050.260.36−0.04
Seed dry weight−0.040.43−0.140.380.280.14
Significant correlations are highlighted in bolds.
Table 6. Mantel test results based on Pearson correlation coefficients to differentiate correlation between beta diversity of soil bacterial community and environmental factors (soil edaphic factors and plant production data).
R-Valuep-Value
Soil edaphic factors
NH4-N0.130.028
NO2-N0.080.039
NO3-N0.200.002
Urea-N0.110.032
Plant production data
Stems length0.290.001
Stems dry weight0.070.231
Roots collar diameter0.060.222
Roots length0.360.0003
Roots dry weight0.380.0002
Seeds0.080.157
Seeds dry weight0.080.138
Significant p values are highlighted in bolds.
Publisher’s Note: MDPI stays neutral with regard to jurisdictional claims in published maps and institutional affiliations.

