Article

Evaluation of Geomagnetic Induced Current on 275 kV Power Transformer for a Reliable and Sustainable Power System Operation in Malaysia

by
Anis Adiba Zawawi
1,*,
Nur Fadilah Ab Aziz
1,
Mohd Zainal Abidin Ab Kadir
1,2,
Halimatun Hashim
1 and
Zmnako Mohammed
1
1
Institute of Power Engineering (IPE), Universiti Tenaga Nasional, Jalan IKRAM-UNITEN, Kajang 43000, Selangor, Malaysia
2
Advanced Lightning, Power and Energy Research (ALPER), Universiti Putra Malaysia, Serdang 43400, Selangor, Malaysia
*
Author to whom correspondence should be addressed.
Sustainability 2020, 12(21), 9225; https://doi.org/10.3390/su12219225
Submission received: 22 September 2020 / Revised: 30 October 2020 / Accepted: 2 November 2020 / Published: 6 November 2020
(This article belongs to the Section Sustainable Engineering and Science)

Abstract

:
Geomagnetic induced current (GIC) occurs as a direct consequence of abnormal space weather which starts from the sun and may flow into a power system network through neutral grounding connections. The flow of GIC through grounded neutral power transformer has been a major concern to researchers since it can potentially affect power system equipment. Most of the previous research was focused on high and mid latitude countries only. However, it has been proven that the GIC is not only limited to high and mid latitudes, but also extends to power systems at lower geographic latitudes. This paper aims to investigate the impacts of GIC on selected 275 kV subpower system networks in Peninsular Malaysia, which is among the low latitude countries. Its impact in terms of magnitude and duration is also assessed together with the use of neutral earthing resistor (NER) as a potential blocking component to reduce the impact of GIC on the Malaysian power system network. Results demonstrated that when GIC exists in the power system, power transformers undergo half-cycle saturation that may lead to a reactive power loss and power system voltage instability. In this case, the power transformer can only withstand a maximum GIC value of 7 A, and beyond this value, if prolonged, may lead to voltage instability. It turned out that GIC magnitude had more impact compared to duration. However, long duration with high magnitude of GIC is the most hazardous to power transformers and could potentially cause major faults in the power system network. As part of mitigation, NER with a value of 315.10 Ω can be used to limit the GIC current flow and thus provide protection to the power system network. Clearly, the issue of GIC undoubtedly affects the reliability, security and sustainability of power system operation, especially networks with highly critical load and capacity and, therefore, thorough studies are required to assess and mitigate this issue.

1. Introduction

Solar activity gives rise to abnormal space weather conditions which, through a complex interaction of events, leads to geomagnetic disturbance (GMD) [1,2]. Approximately every 11 years, solar disturbances occur on the surface of the sun and the most significant phenomenon is a coronal mass ejection (CME). CME has great energy and moves almost at the speed of light. When a CME hits the Earth, the interaction leads to a rapidly changing geomagnetic field. There is an associated electric field induced when there is a change in magnetic field. This phenomenon can be related with the theory of Faraday’s law of electromagnetic induction where the electric current is produced from the induced electric field on the earth’s surface [3]. The induced current is called a geomagnetic induced current (GIC) and can cause significant damage with a single event [4]. This current has a very low frequency of 0.01 Hz to 0.05 Hz with an average magnitude of 10 A to 15 A and peak up to 100 A for one to three minutes [5,6]. GMD can generate high levels of the geomagnetic field, and the most affected equipment are power transformers as GIC flows in power systems through the grounded neutral of the power transformer, which could have negative consequences [7,8].
The existence of GIC in a power system may lead to voltage collapse phenomena due to the imbalance between demand and reactive power supply, which would result in serious voltage drops. Based on the history of GMDs, these impacts can be observed in three major GMD events. The Hydro-Quebec blackout in 1989: a geomagnetic storm that affected Canadian and U.S. power systems resulted in a major power outage and led to millions of people being in the dark for hours towards the end of winter [9]. After nine hours, 83% of full power was restored but 1,000,000 customers were still without electrical power supply. In 2003, large geomagnetic storms affected the power system infrastructure in South Sweden. A three-phase power transformer in the grid was subjected to a GIC flow of approximately 330 A. A blackout for about 20–50 min occurred due to 130 kV line tripping [10]. The storm in 2015 was the largest storm in more than 15 years and was called the St. Patrick’s Day storm. During the storm, it showed obvious deterioration in the performance of the global positioning system (GPS) receivers when the storm was extreme. This was proven when the efficiency of the GPS receivers was impaired and gave inaccurate measurements under such extreme geomagnetic storm conditions. These events created research and interests in the GMDs effects on the power system. Table 1 summarizes the past major event of significant space weather activity.
There are a large number of works associated with GIC conducted around the world done by previous researchers. Most have been done in North America by [21,22,23]. Table 2 shows the summary of GIC studies that have been conducted in several countries on different perspectives.
The impact of GIC is noticeable not only in high latitude regions but also in low latitudes and equatorial regions [33,34,35,36,37,38,39]. Malaysia is located close to the geomagnetic equator with a tropical climate throughout the year. Due to its location, Malaysia is a strategic place for the installation of a magnetometer. A magnetic data acquisition system (MAGDAS) magnetometer has been installed in Malaysia by the Space Environment Research Centre in Japan in collaboration with the Space Science Institute (ANGKASA) and Universiti Kebangsaan Malaysia (UKM). The main purpose of installing the MAGDAS sensor was to study space weather from Malaysia. The installation location was selected according its location near the magnetic equatorial region and low disruption from human activity [40]. At low latitudes, the range of GIC values were reported in the range of 1 A to 30 A [41]. Table 3 shows the locations of magnetometer in Malaysia to monitor the geomagnetic events.
Several works have been carried out on modeling of GIC flows in a high voltage power system network, but the modeling did not include the duration of the GIC [45]. Previous research mainly focused on magnitude only, whereas GIC flows are highly dependent on the complex topology and electrical characteristics of the power system network components, including geographic orientation, transmission line length, response of power transformers and other power equipment. In addition, there are several mitigation methods suggested in the previous research for the GIC phenomenon as different network topology of a power system requires a different mitigation method. The GIC mitigation method can be planned and implemented to reduce the impact on power transformer.
This paper aims to investigate the impacts of GIC on a selected 275 kV subpower system network in Peninsular Malaysia, which is among the low latitude countries, taking into account all the system designs and line parameters for modeling. Its impact in terms of magnitude and duration is assessed together with the use of neutral earthing resistor (NER) as a potential blocking component to reduce the impact of GIC on the Malaysian power system network. In this paper, Section 2 covers the GIC impacts on the power transformer. Section 3 covers modeling of GIC into the neutral line of a grounded power transformer. Description of the test system at a selected 275 kV subpower system network is discussed in Section 4. Section 5 presents the analysis of GIC which includes simulation results and discussion in detail. Lastly, the final part of this paper summarizes and concludes the entirety of this research work.

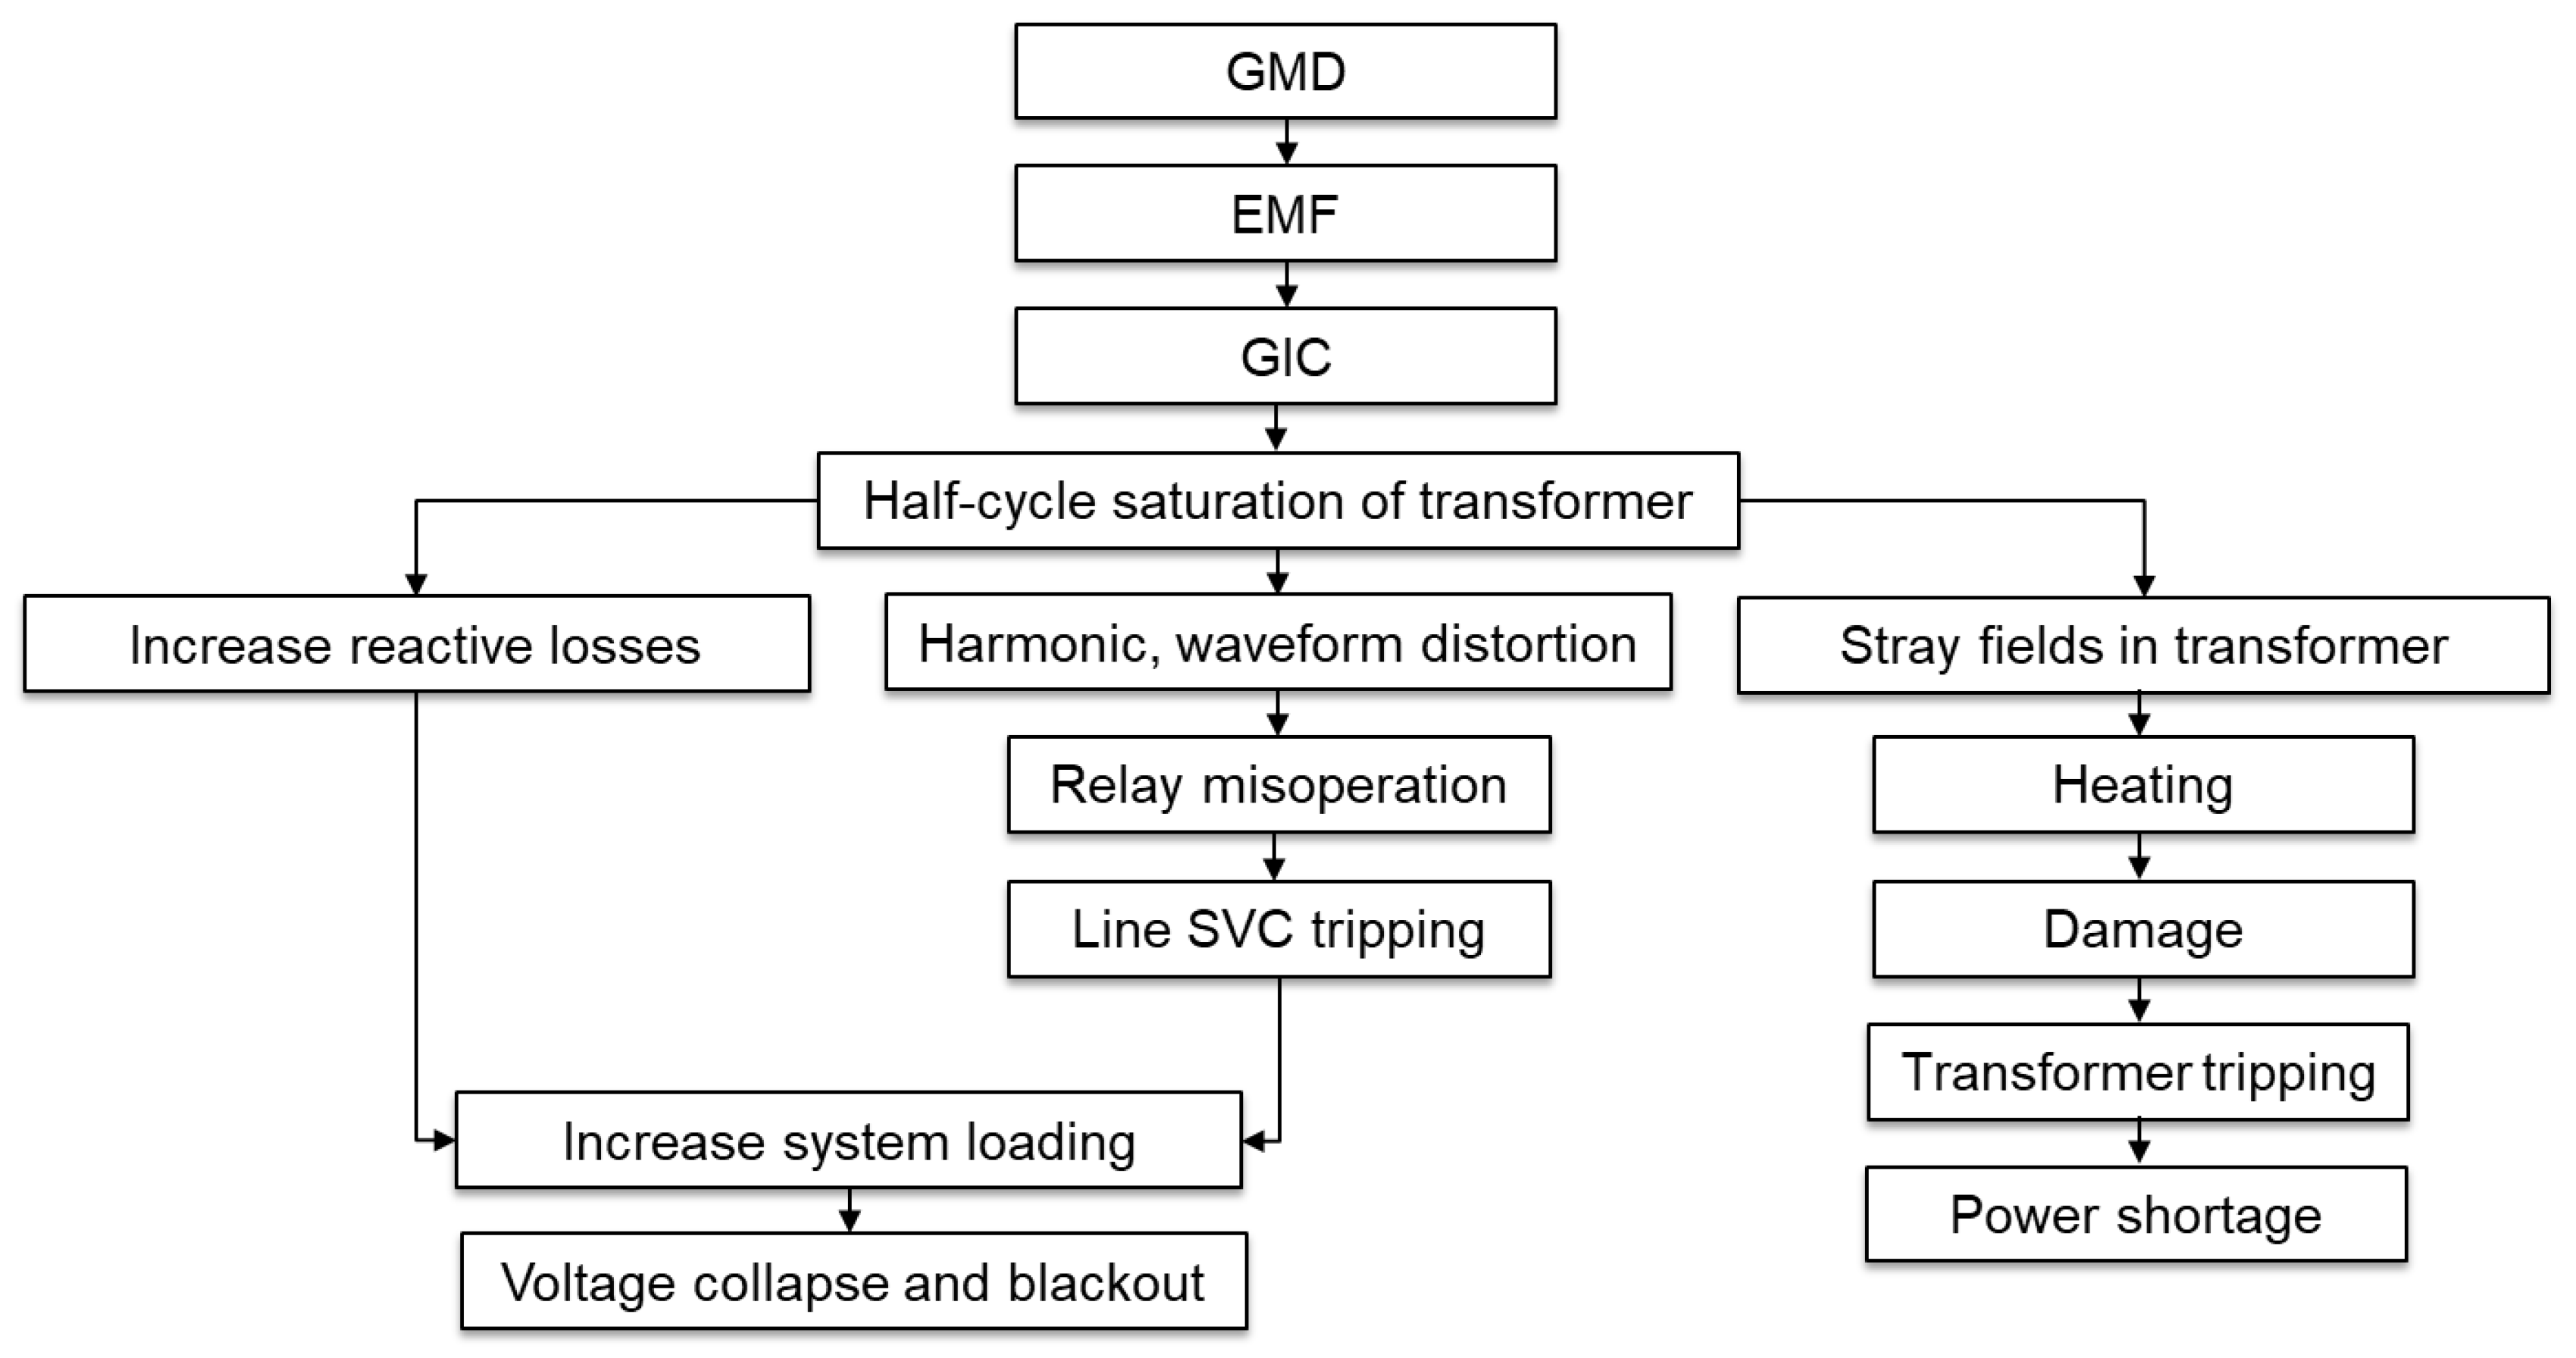
2. GIC Impacts on the Transformer
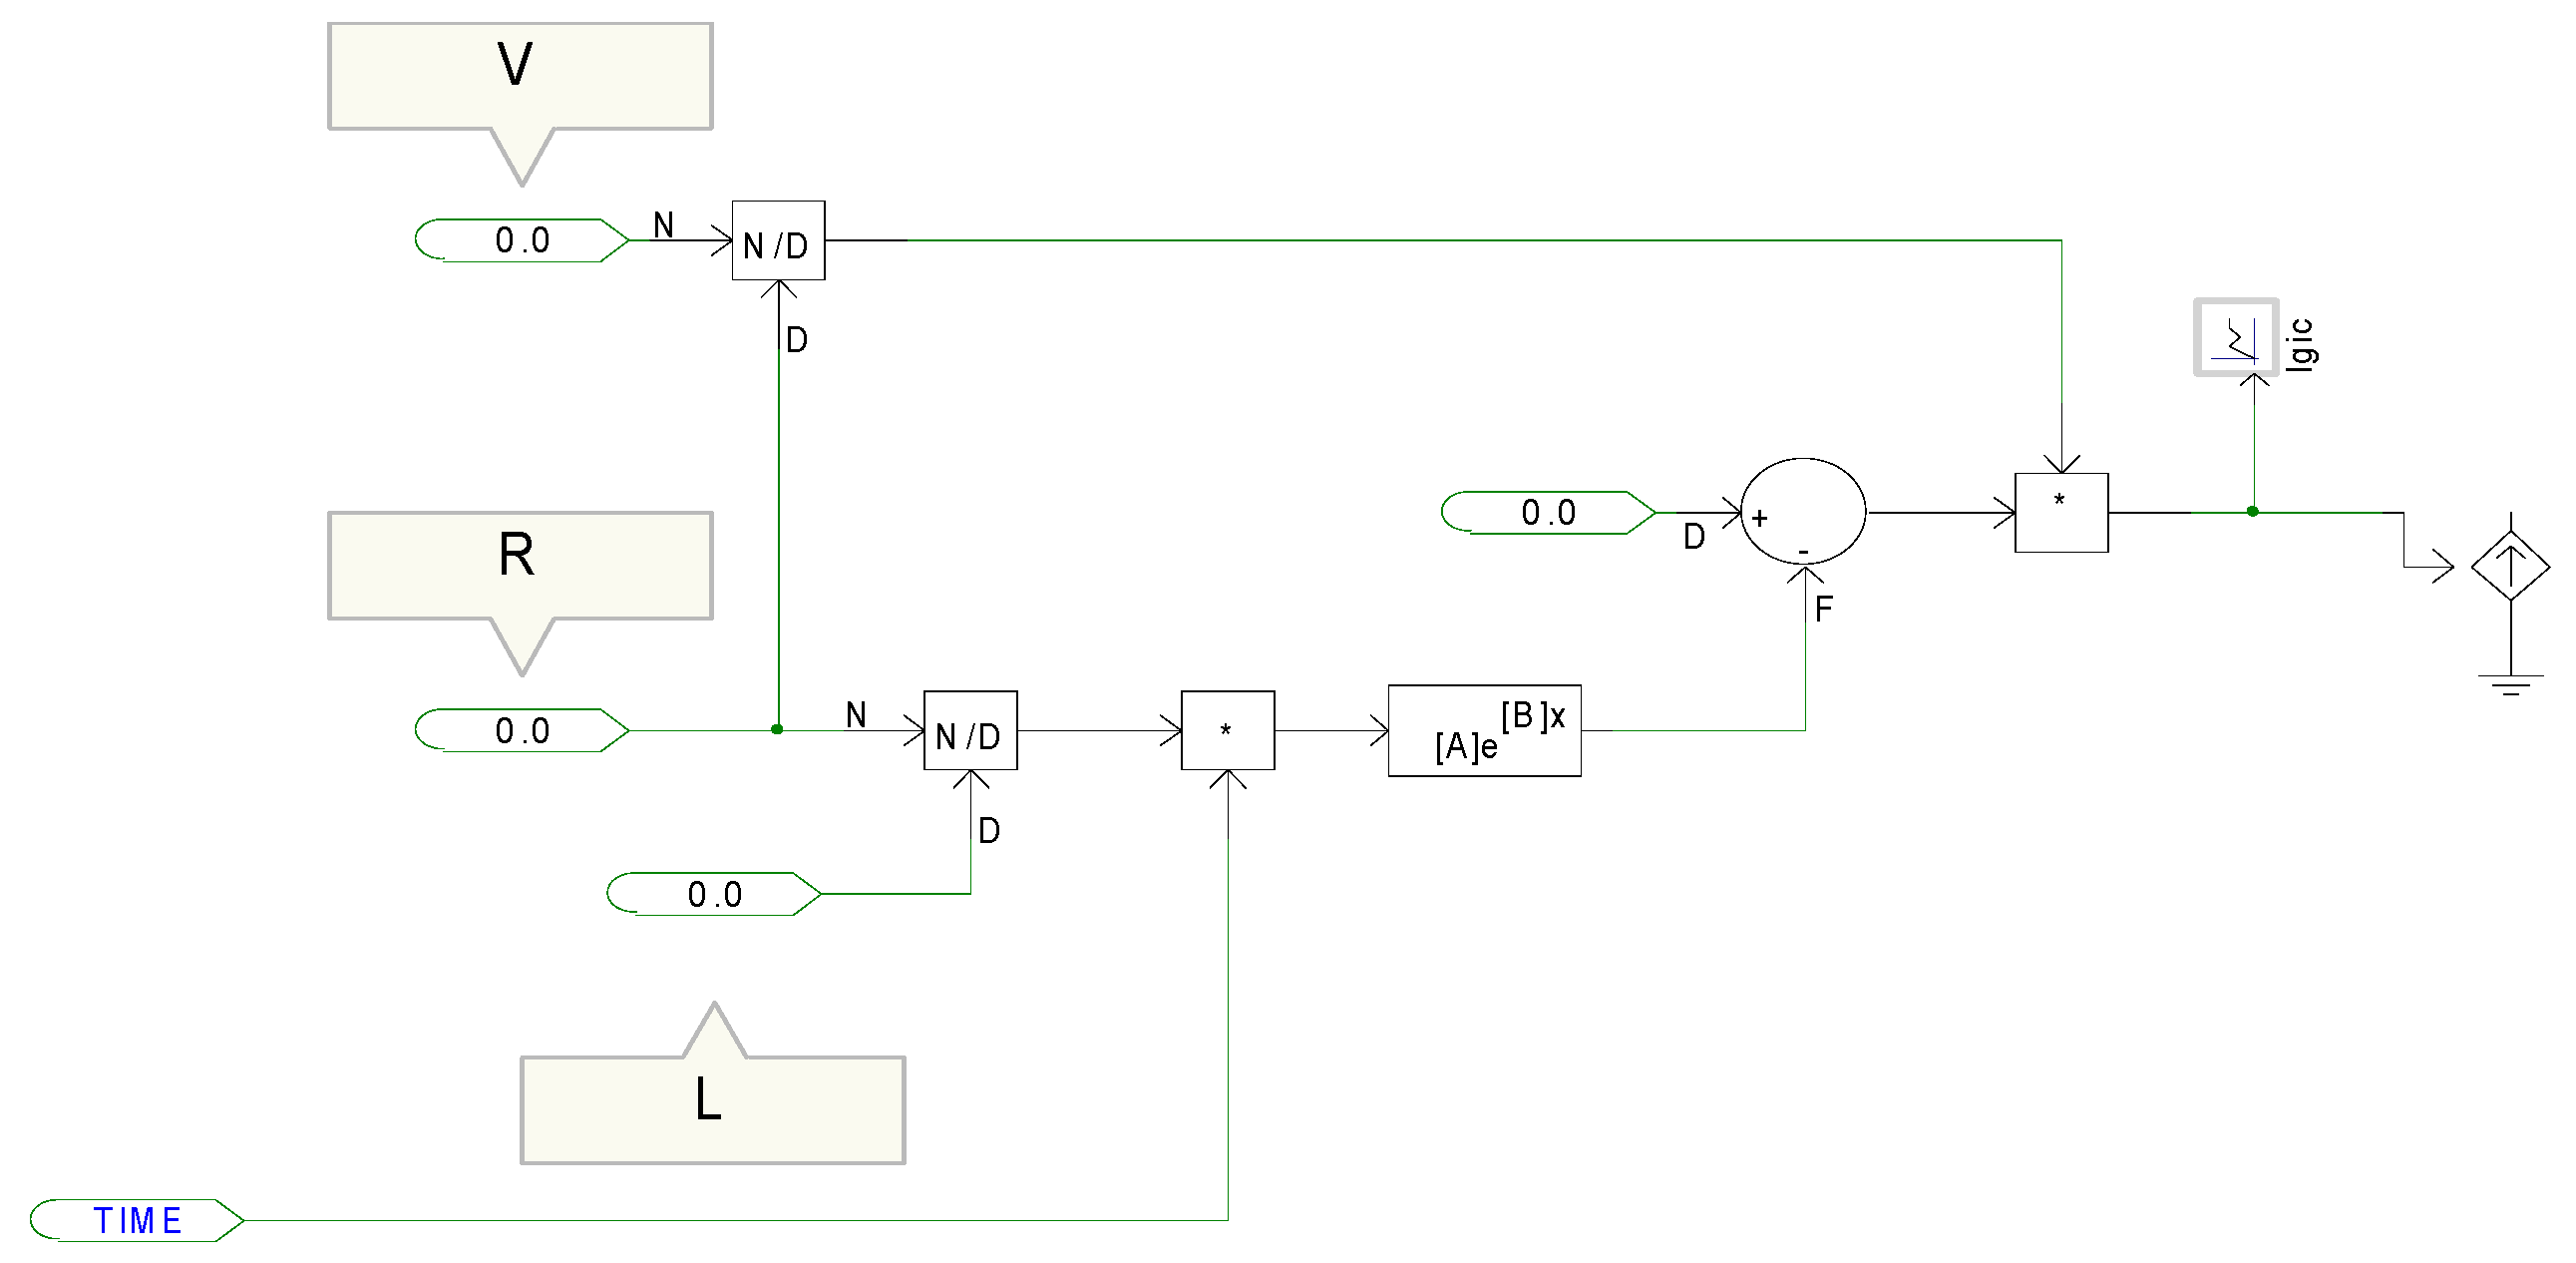
GIC produced by geoelectric fields on the surface of the Earth can affect the normal operation of power systems [46]. GIC flow through the power transformer is the main cause of all issues, as it can cause half-cycle saturation of the power transformer, which can manifest in issues such as harmonic distortion, reactive power demand and transformer heating [47]. GIC is one of the major contributions to the transformer’s failure in the power system resulting in breakdown. For a transformer that is operating close to its parameters, even a small GIC can drive its core into half cycle saturation [48]. The losses that then arise with the leakage of flux may cause localized heating in different parts of transformer core and steel tank. Direct Current (DC) excitation due to GIC also causes the magnetizing current to increase significantly, lagging the system voltage by 90°, generating both even and odd harmonics and bringing about increased demand for volt-ampere reactive (var) [49]. Figure 1 summarizes the impact of GIC on power system components. The findings show that the injection of GIC in grounded neutral of the transformer leads to half-cycle saturation of the transformer.
Table 4 summarizes the impacts of GIC on the transformer that have been conducted by previous researchers towards modeling aspects including advantage, disadvantage and findings.

3. Modeling of GIC

GIC is modeled as a DC current source that is used to inject current into the neutral of a grounded power transformer. This is due to the fact that current from the earth is injected from the ground point. In this model, the magnitude of the GIC is calculated based on Equation (1) taking into consideration the transformer’s response time. When voltage is induced in winding of the transformer, the current flows as a function of the winding time constant. The parameter of the GIC waveform is based on the following Equation (1) [58]:
I g i c =   V R   ( 1 e R L t )
where
  • Igic = Geomagnetic induced current
  • V = Voltage induced at the primary side of the transformer
  • R = Resistance of power transformer
  • L = Inductance of power transformer
  • t = Time taken in seconds (s)
Figure 2 shows the graph of GIC according to Equation (1) with current increasing as a function of time. The graph shows that the current increases from 0 A until 7 A with the peak value occurring at 60 s, beyond which the current becomes constant.
From the literature, the highest reading of GIC in low latitude regions is 30 A, while the lowest reading is 1 A [41]. Therefore, considering the worst-case scenario, a value of 26 A is used for high magnitude in this research work for GIC simulation and analysis. The developed model of GIC in PSCAD is shown in Figure 3.

4. Description of Test System

The simulation was performed at one of the selected 275 kV Malaysian subpower system network. The designed system consisted of two generators, eight passive loads, thirty-one transformers and six transmission lines. The combination of this equipment model was used to represent a subpower system network for the purposes of GIC simulation and analysis. The designed model was mainly used to investigate the impact of GIC on the power transformer. The operating frequency of the system was 50 Hz based on system frequency in Malaysia. Custom blocks in PSCAD software [59] were used to model each part of the system. Figure 4 shows the entire model of schematic diagram of the subpower system network.
Strategic simulated scenarios were planned to achieve the research work objectives. To analyze the GIC impact on power transformer, two different cases of GIC waveform were created. These types of GIC waveform were generated using the RL equation. These GICs were injected individually into the power transformer at grounded neutral at 275 kV power transformer 5 (T5) at substation A. This power transformer was chosen since it is the main transformer in the substation and the location is closer to the generator.

5. Results and Discussions

This section presents the analysis of GIC on the selected 275 kV subpower system network in Peninsular Malaysia using PSCAD. The simulation results and discussions presented are analyzed at the selected power transformer, which is transformer 5 (T5).

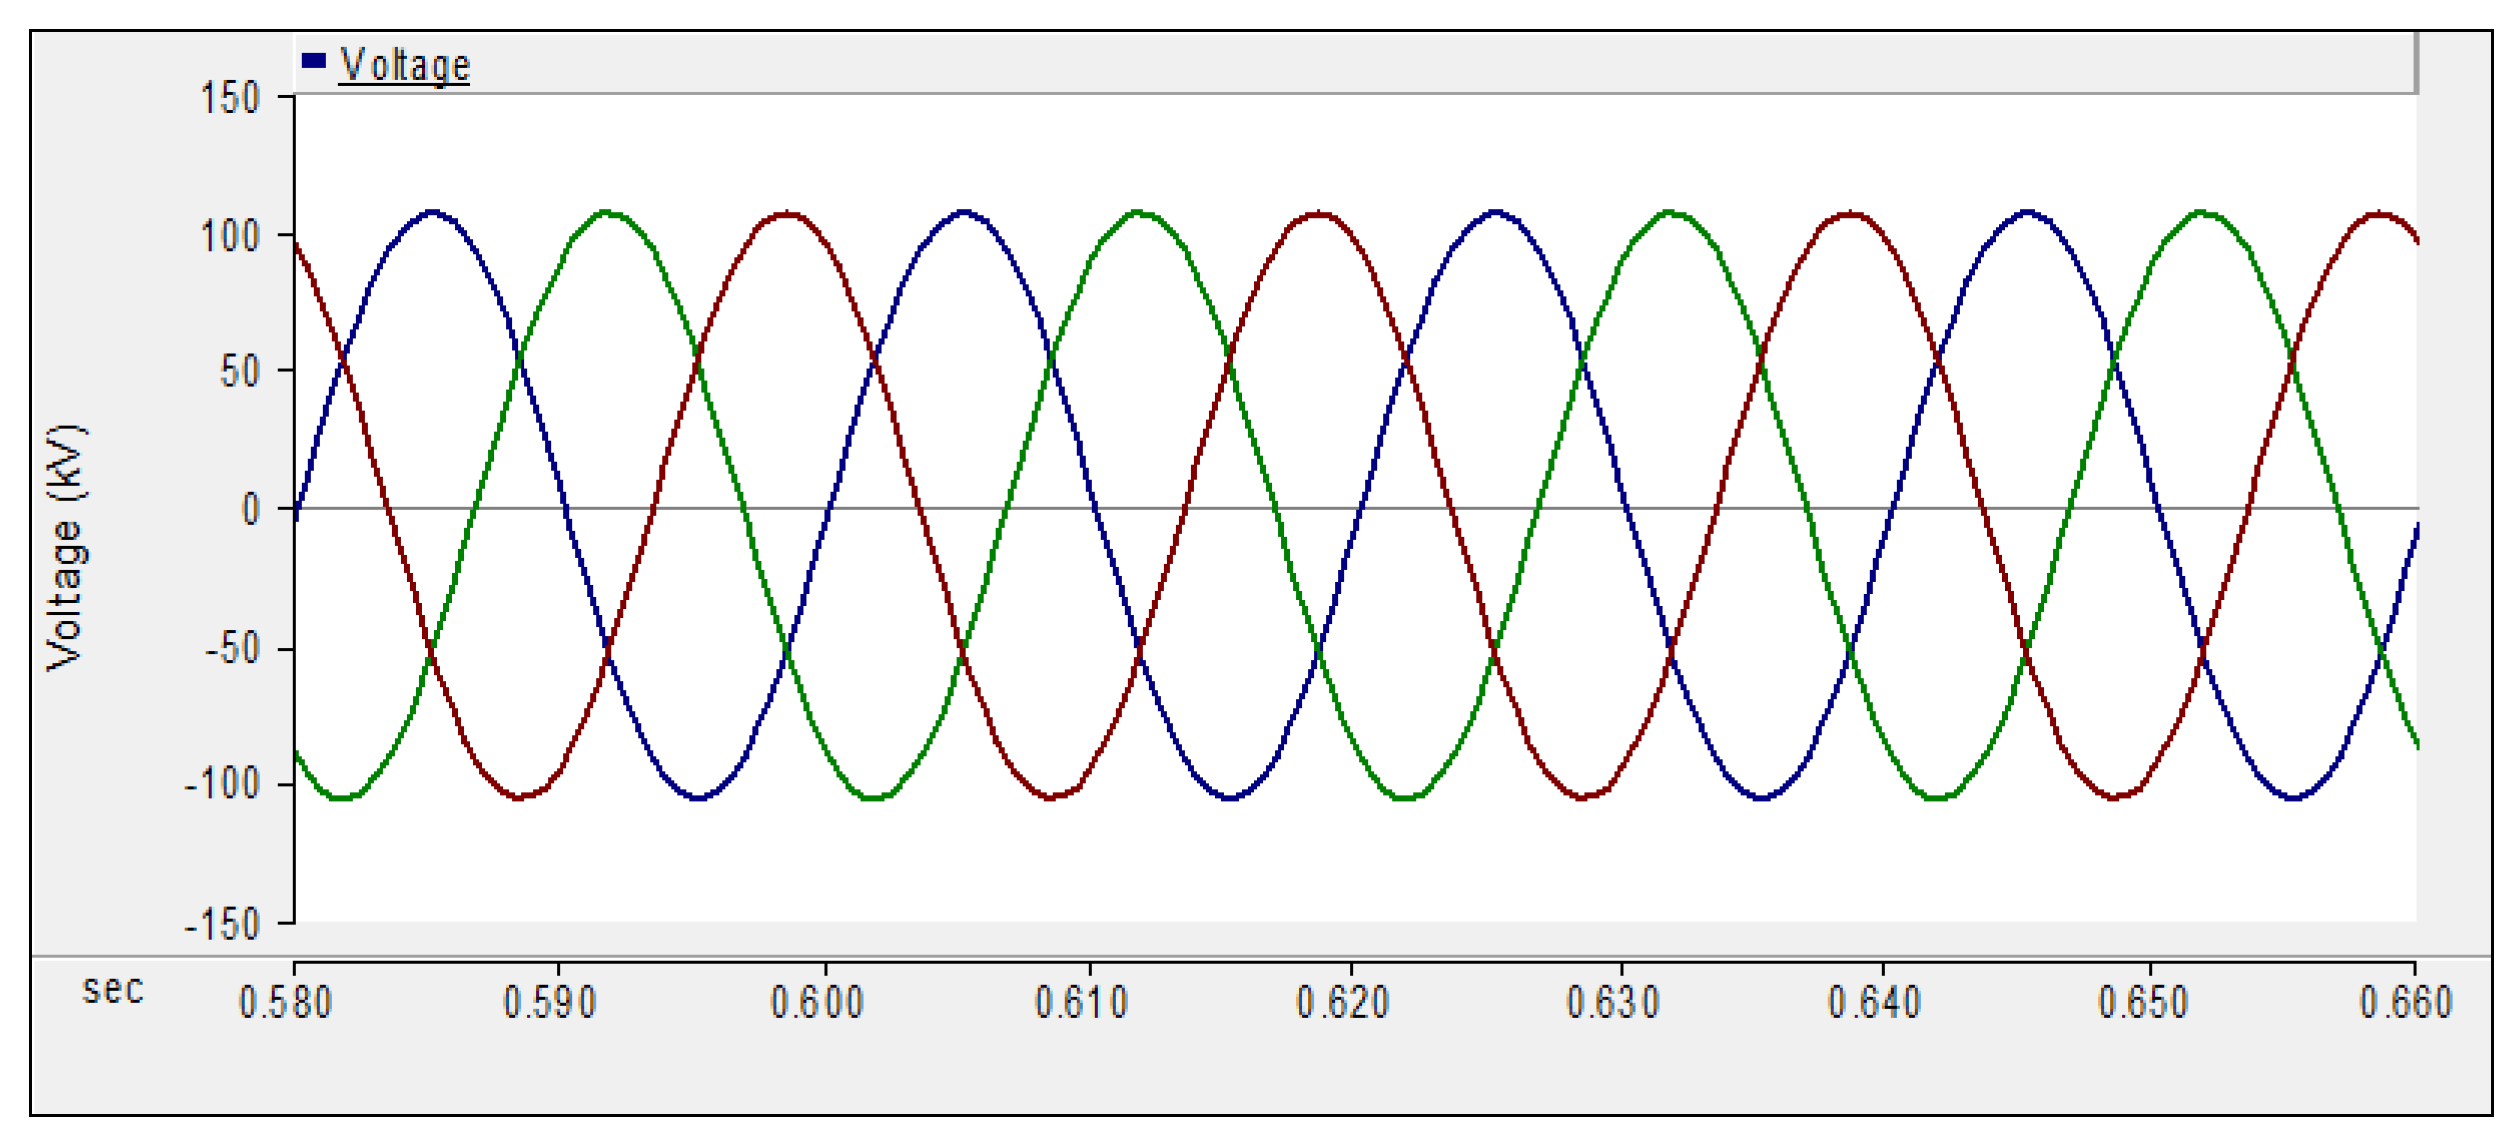
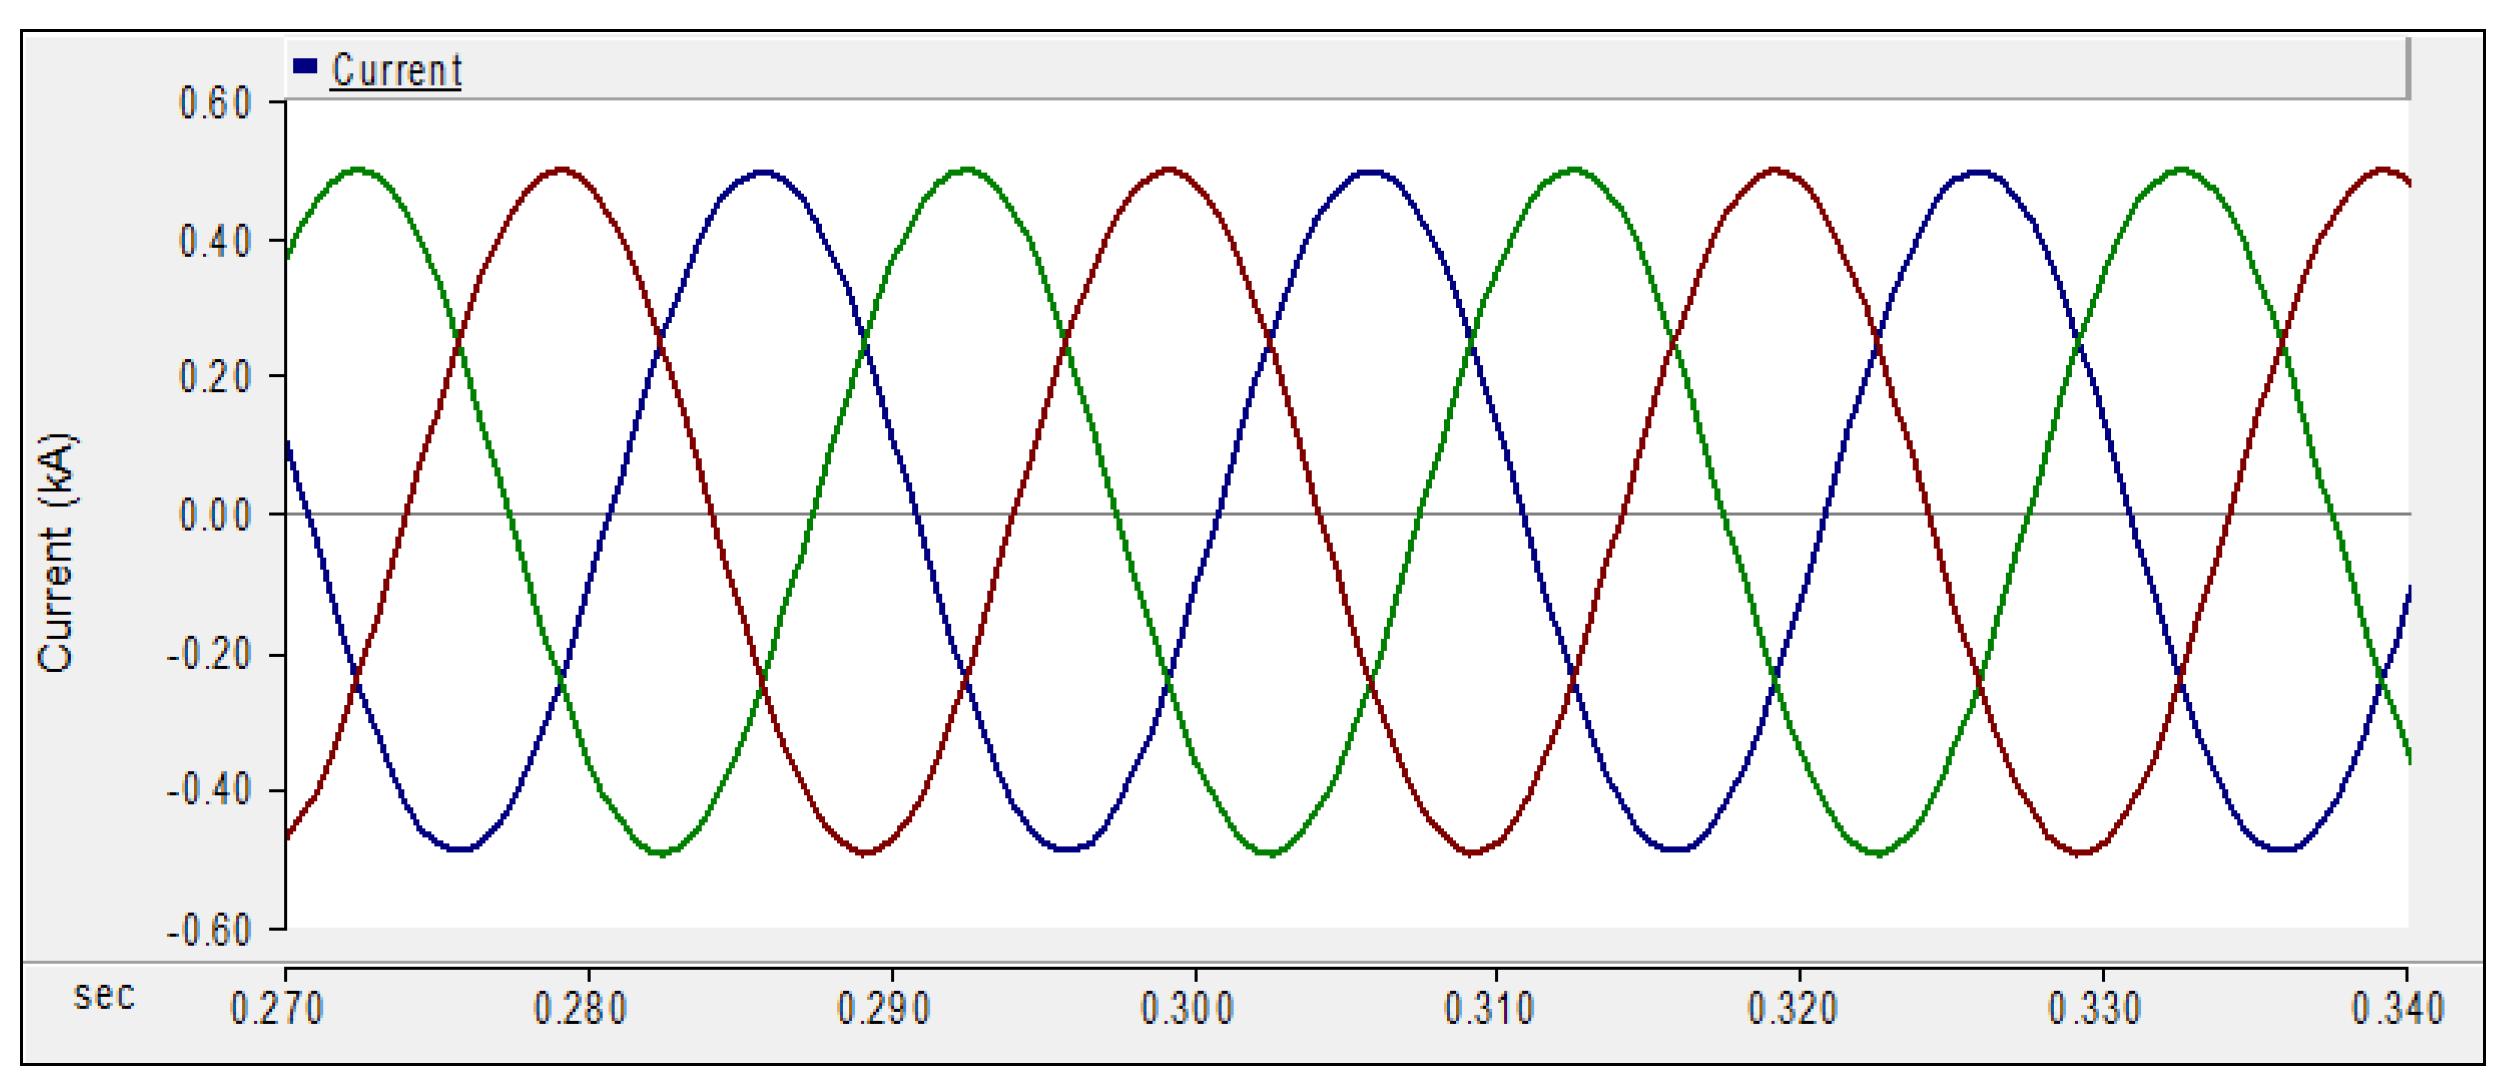
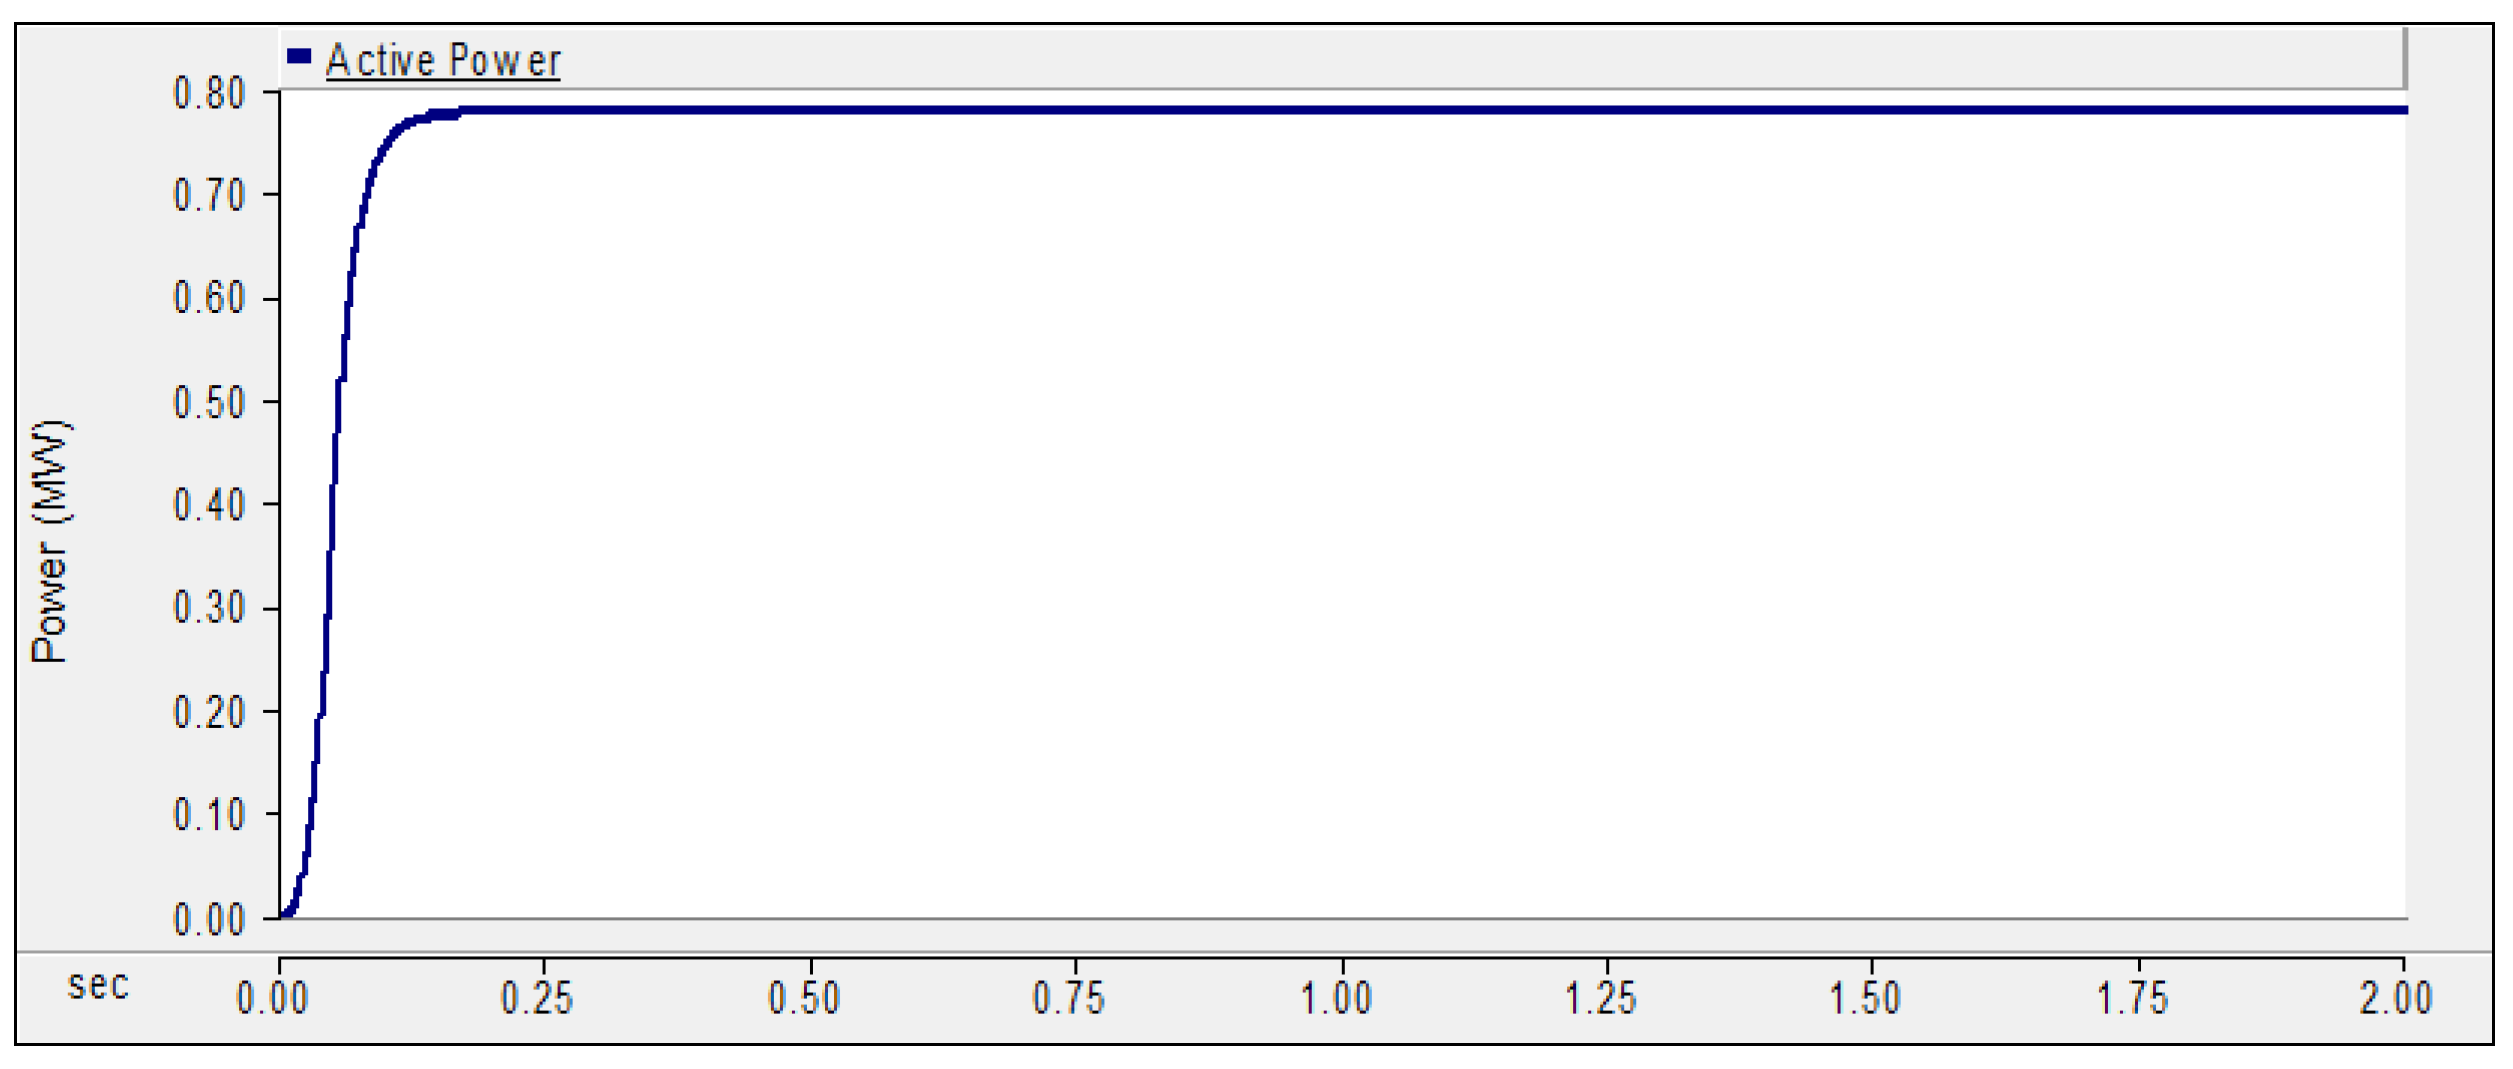
5.1. Simulation Result under Base Case Condition

The simulation results under base case condition without GIC are first investigated. The aim is to analyze the voltage and current profiles as a base case to ensure the reliability and stability of the power system. Figure 5, Figure 6, Figure 7 and Figure 8 illustrate the graphs of instantaneous voltage, current, active power and reactive power, respectively, which show that the current and voltage profiles are pure three-phase sinewave and are within the regulated utility Grid Code [60].
It can be seen that under steady state conditions, flux linkage in the power transformer is sinusoidal and the magnetizing current is within the linear region. Hence, in this case, the hysteresis curve, as expected, is symmetrical around zero as shown in Figure 9.
Table 5 tabulates the monitored active power, reactive power and voltage under base case conditions for substation A. The 275 kV power transformer, denoted as transformer 5 (T5), was used to inject a GIC, as highlighted in Table 5 where, under base case condition, the voltage waveform obtained was within the acceptable limits of ±5% for the 275 kV system in accordance with the utility grid code for Peninsular Malaysia, regulated by the Energy Commission (EC) of Malaysia [60].

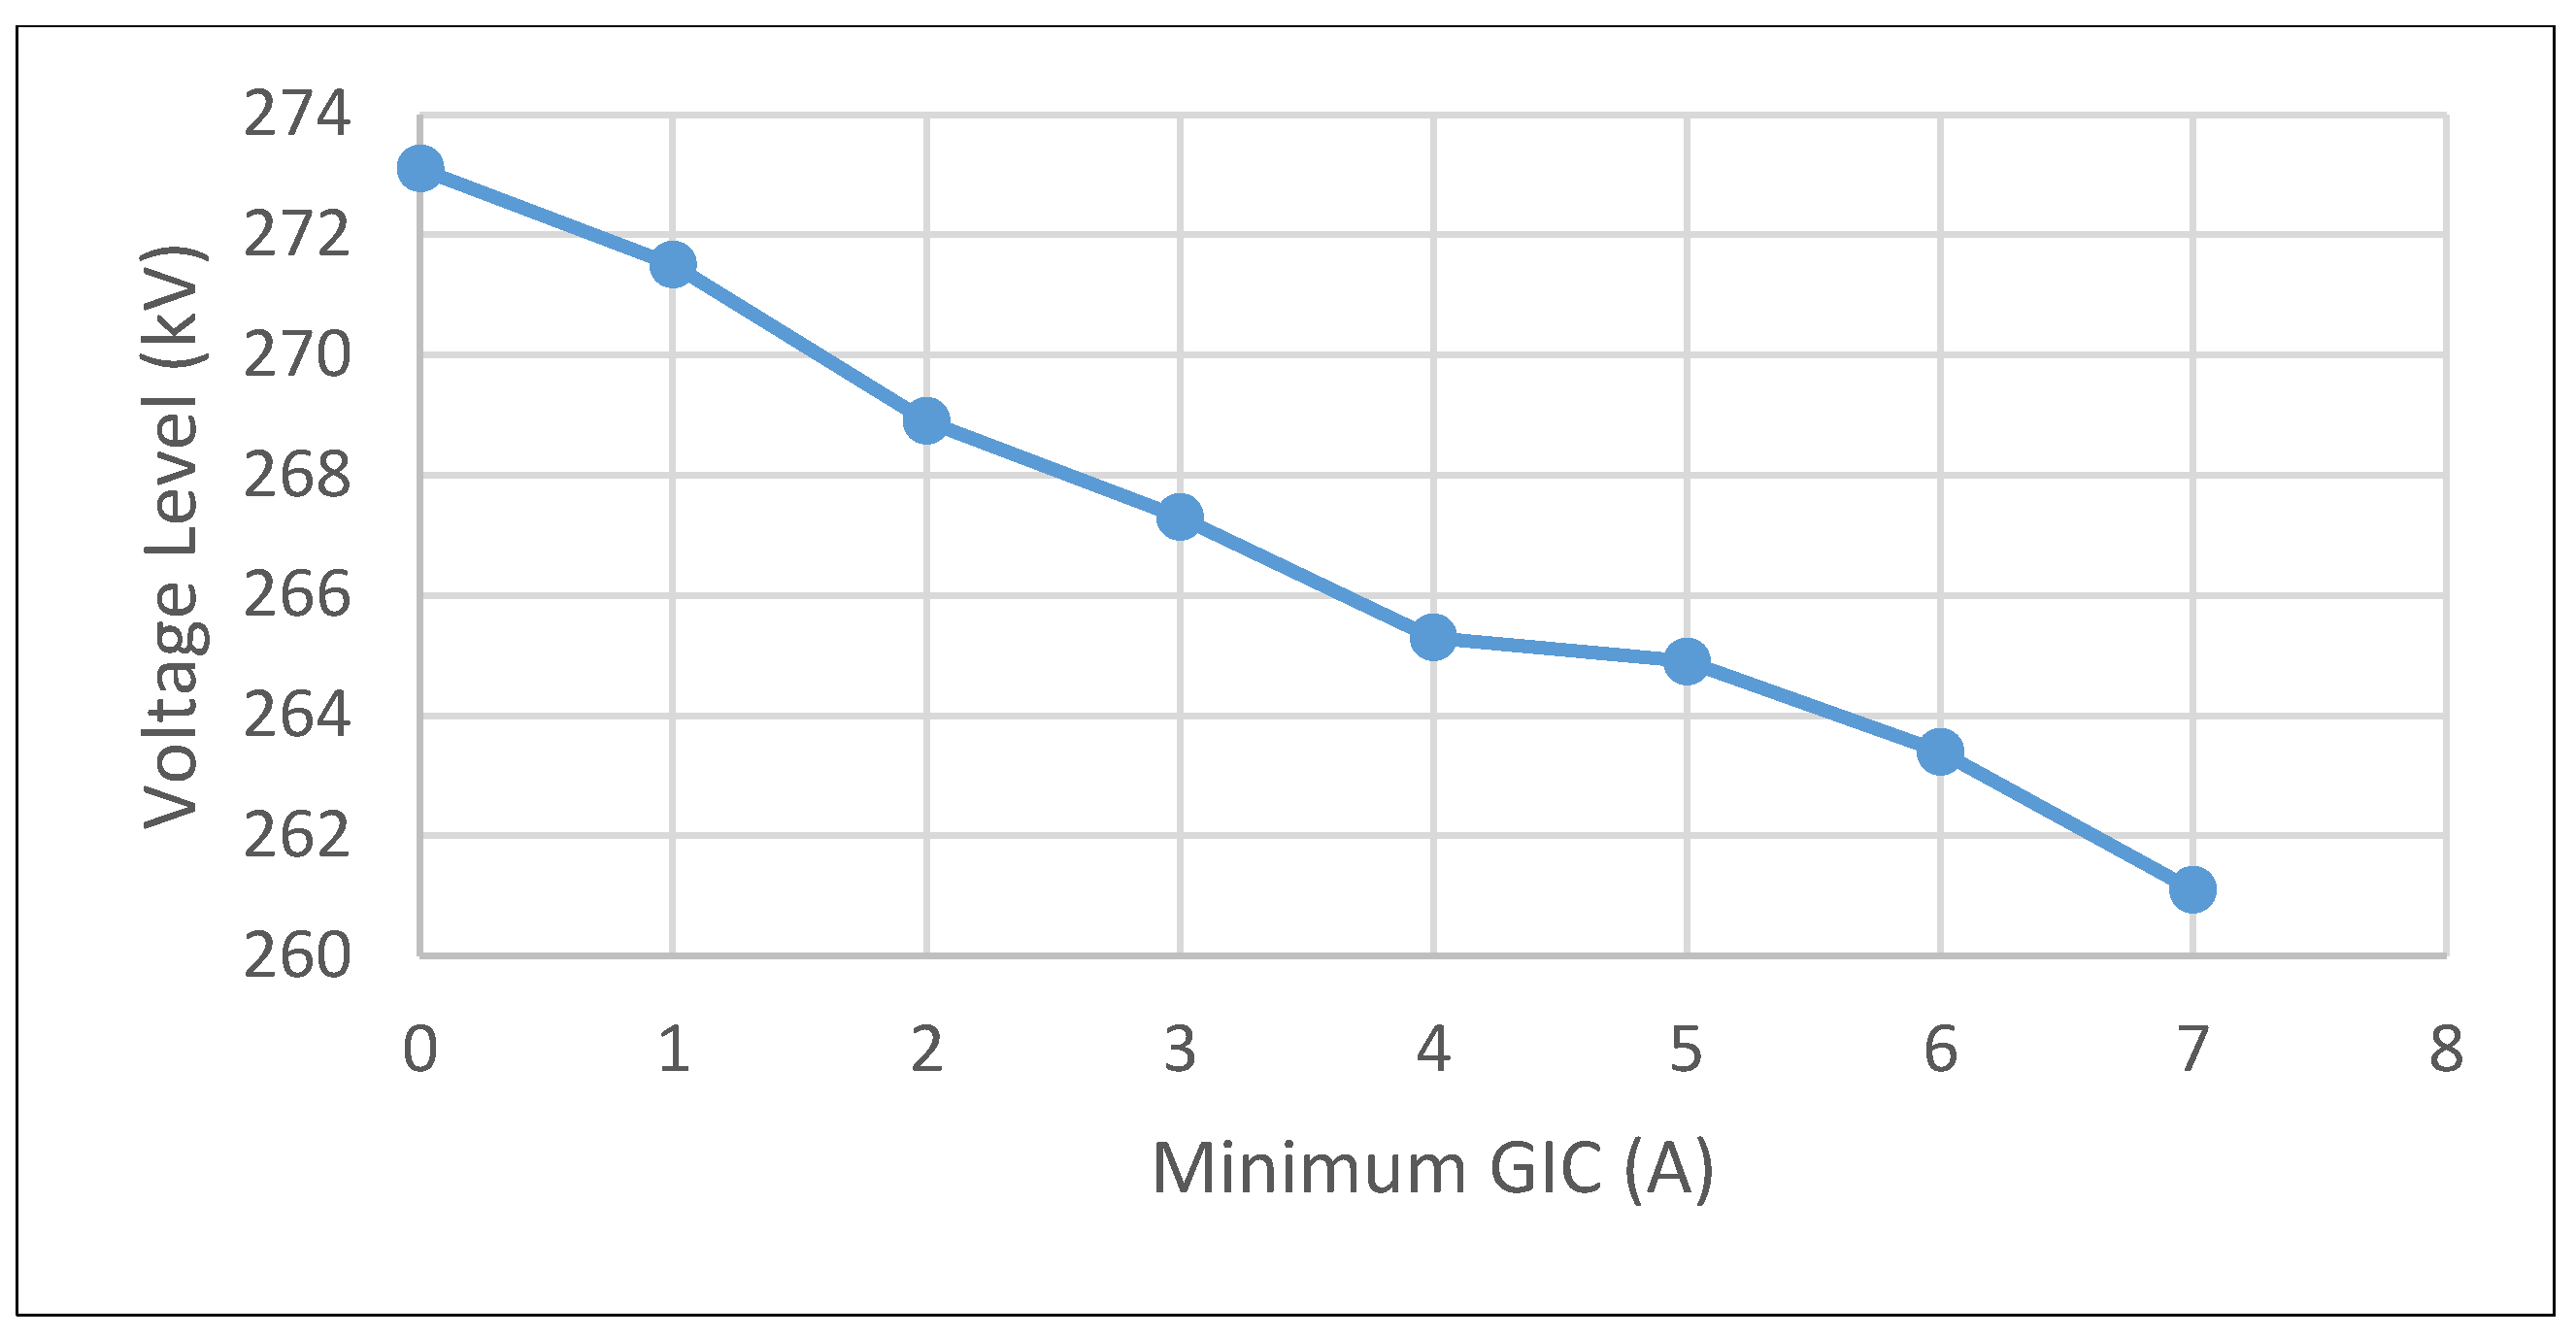
5.2. GIC Impact Analysis on Voltage Stability

This section presents the impact of GIC on the voltage stability of the 275 kV power transformer, labelled as T5. Figure 10 shows the graph of voltage magnitude at T5 against the injected GIC. As the magnitude of GIC injected into the power transformer increased, the lower the voltage level.
Referring to this figure, GIC of 7 A caused the transformer voltage terminal to drop to 261.1 kV, which is a decrement of 5.05% from the base case value. Based on EC [60], the voltage value must be within a ±5% acceptable limit, which is 261.25 kV. Therefore, a GIC injection of 7A violated the voltage limits and if prolonged could lead to voltage instability due to insufficient reactive power in maintaining the system voltage. Considering the peak GIC observed on October 28, 1991 in the eastern part of USA [61], the lowest value of 30 A is almost four times greater than the GIC required to cause the instability to Malaysian power network.
Variation in the increased reactive power consumption that exceeds the available network capacity can lead to fluctuations in the voltage level at some nodes within the network. The results from Figure 10 reflect that the value of the magnetizing current, flux linkage, active power and reactive power are acceptable under steady state condition. To conclude, the minimum severe GIC value at 275 kV Malaysian power system network is at 7 A and may be used to analyze the impact of GIC in next sections.

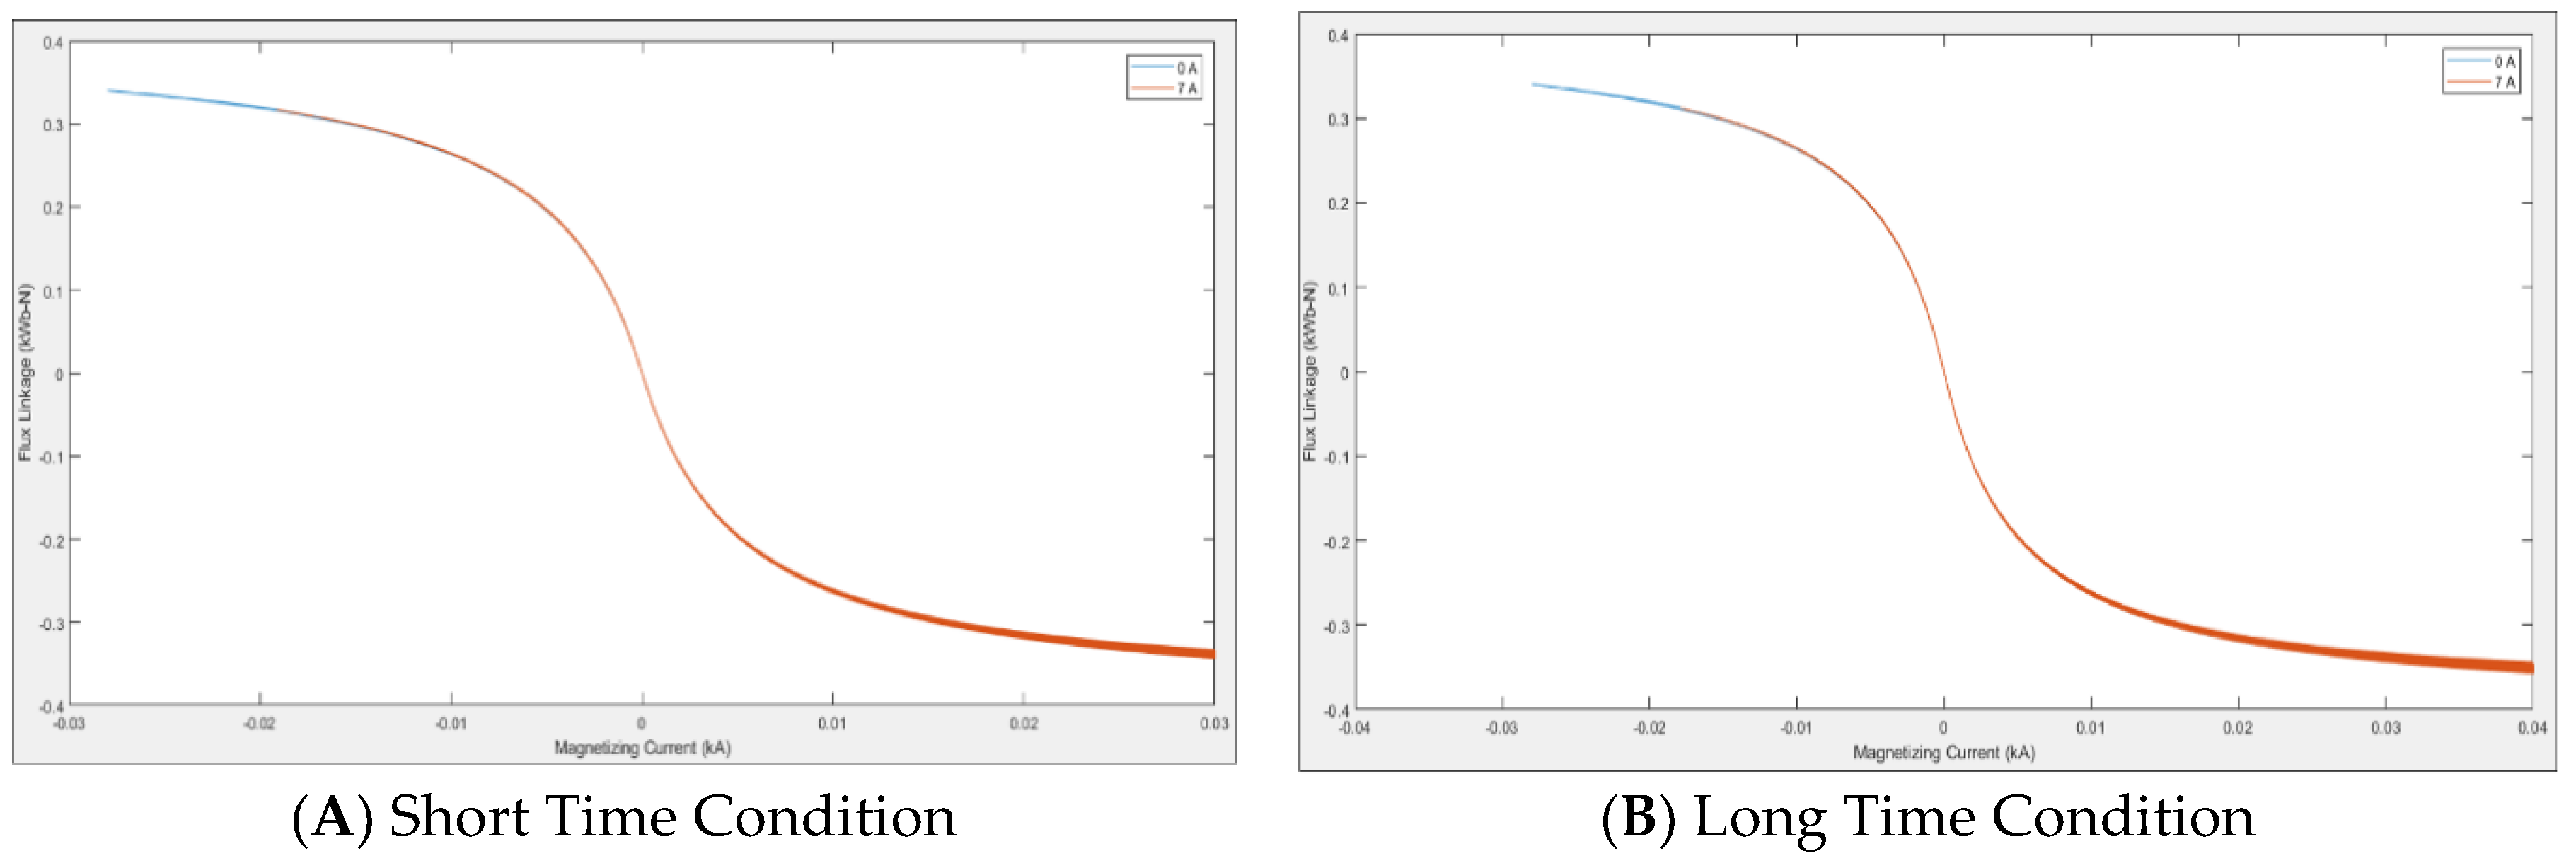
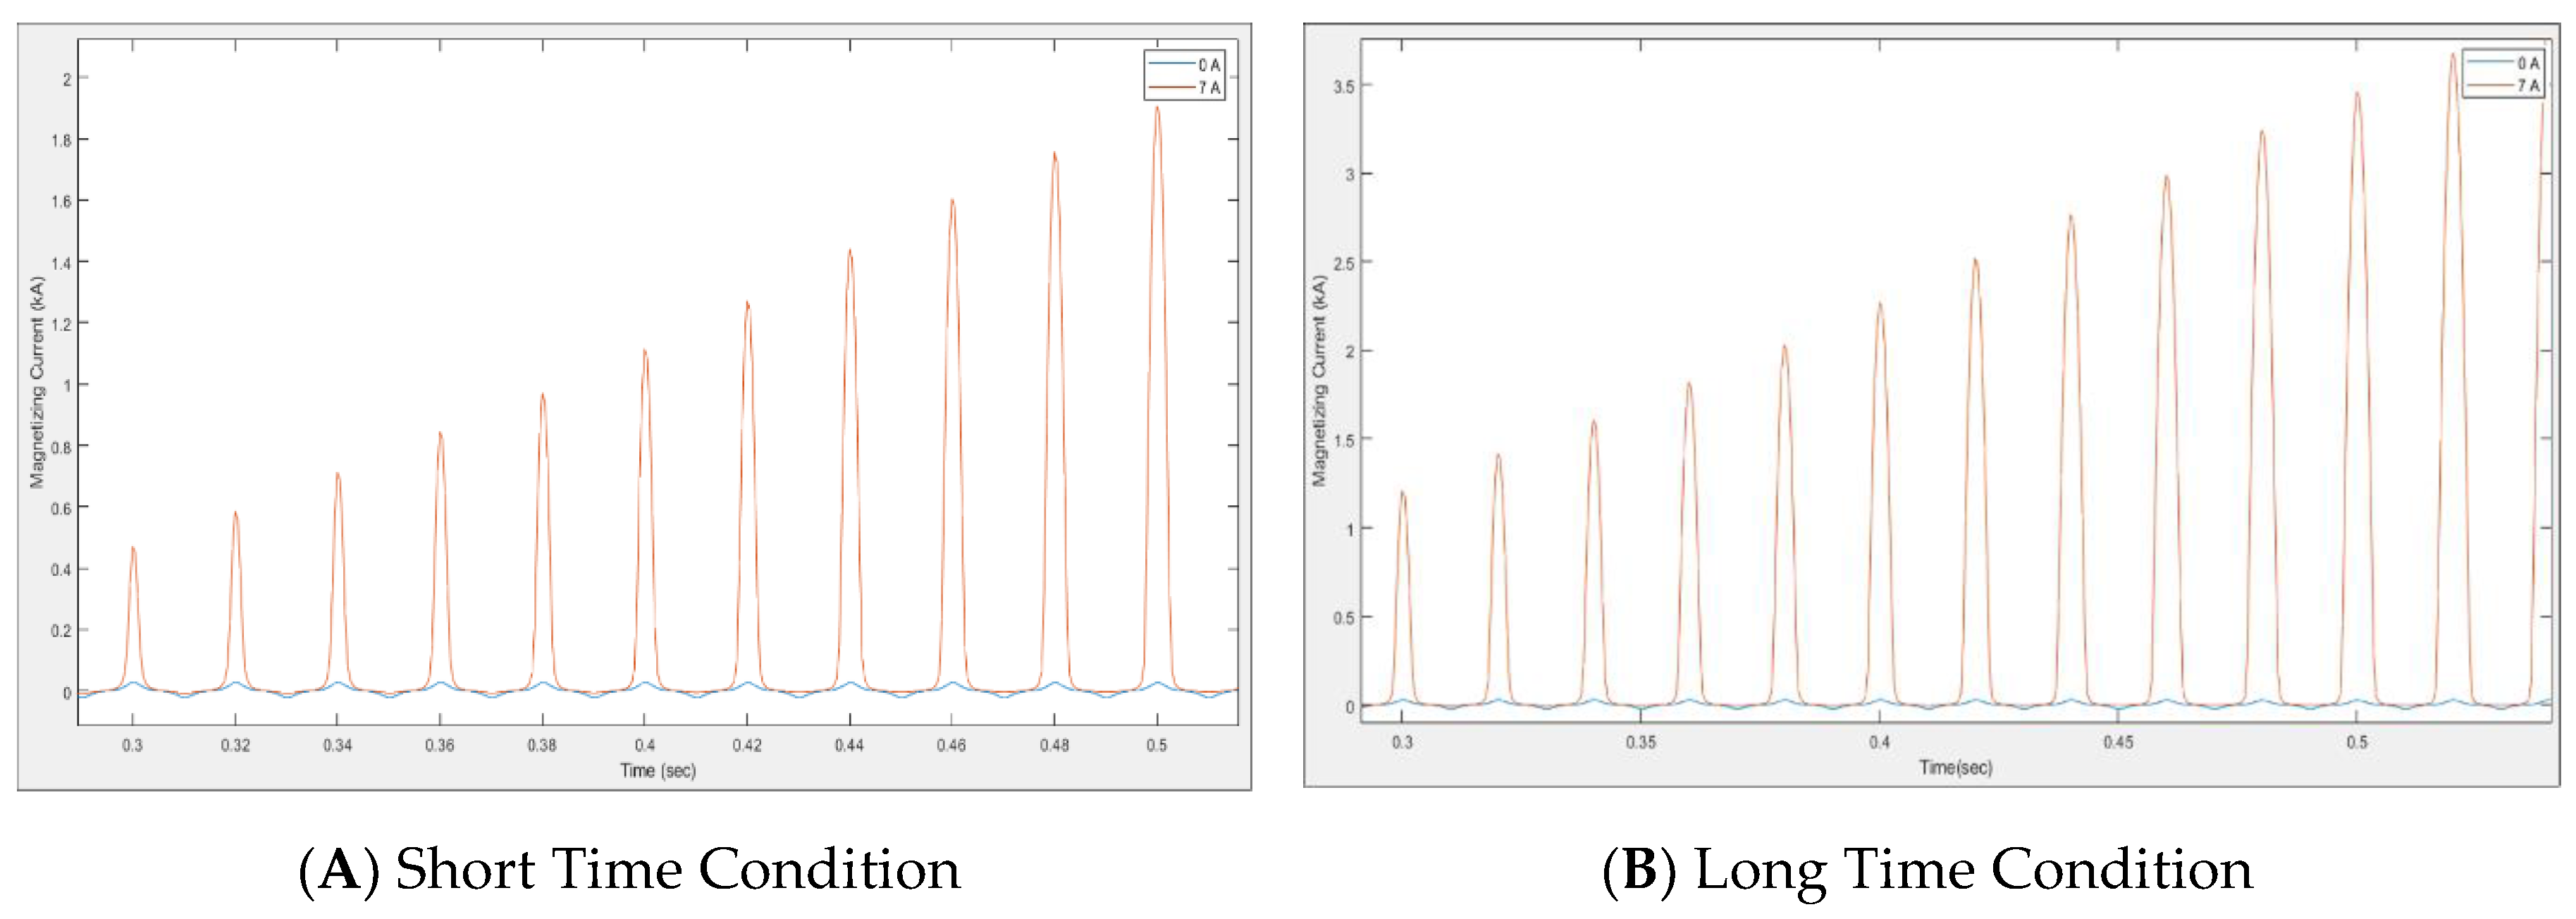
5.3. Simulation Results and Analysis of GIC Impact on the 275 kV Power Transformer

This section focuses on the behavior of the 275 kV power transformer, denoted as T5, in terms of hysteresis curve, magnetizing current, flux linkage, active power and reactive power on the power transformer when GIC is injected into the transformer. In this section, the analysis of GIC impact is investigated in terms of magnitude and duration.

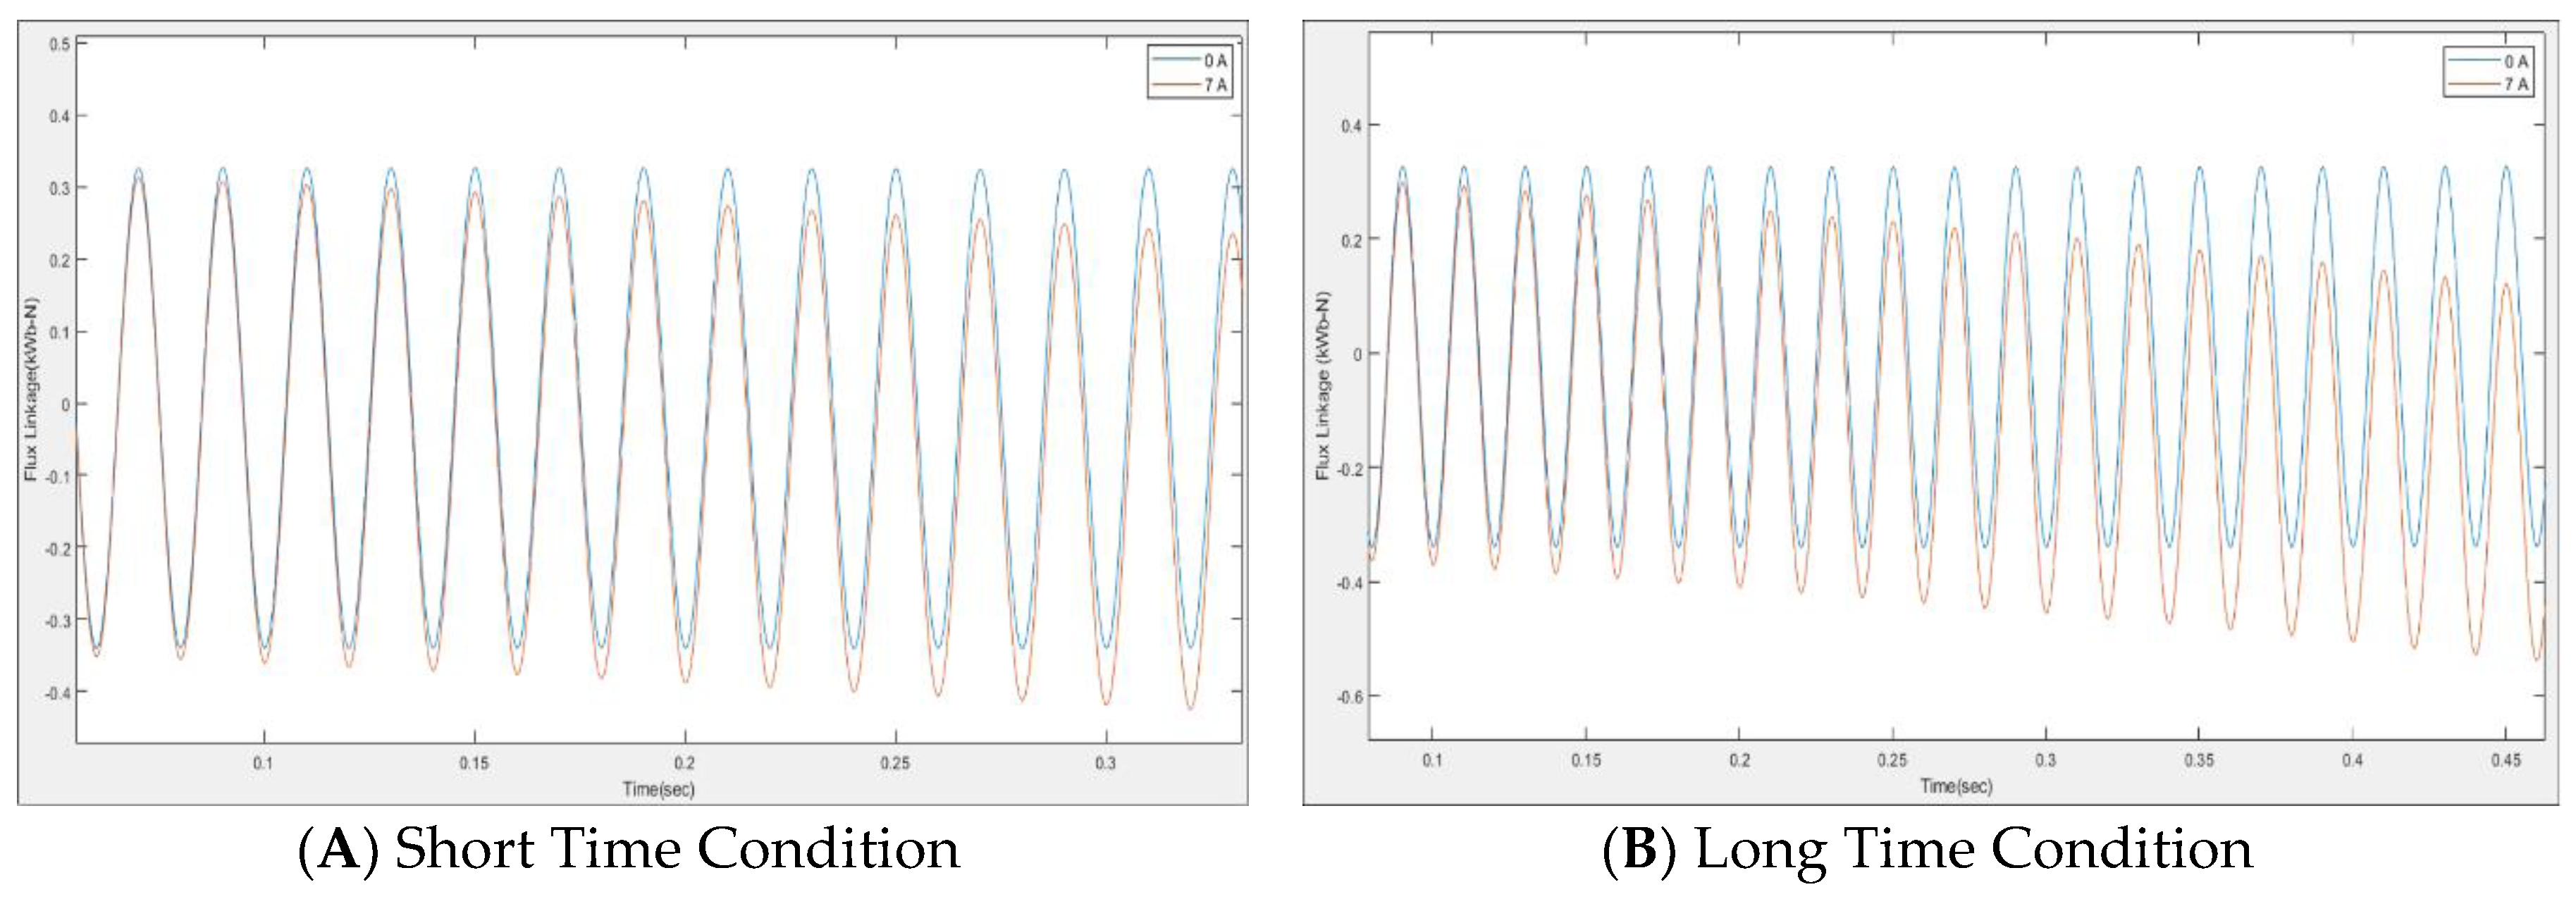
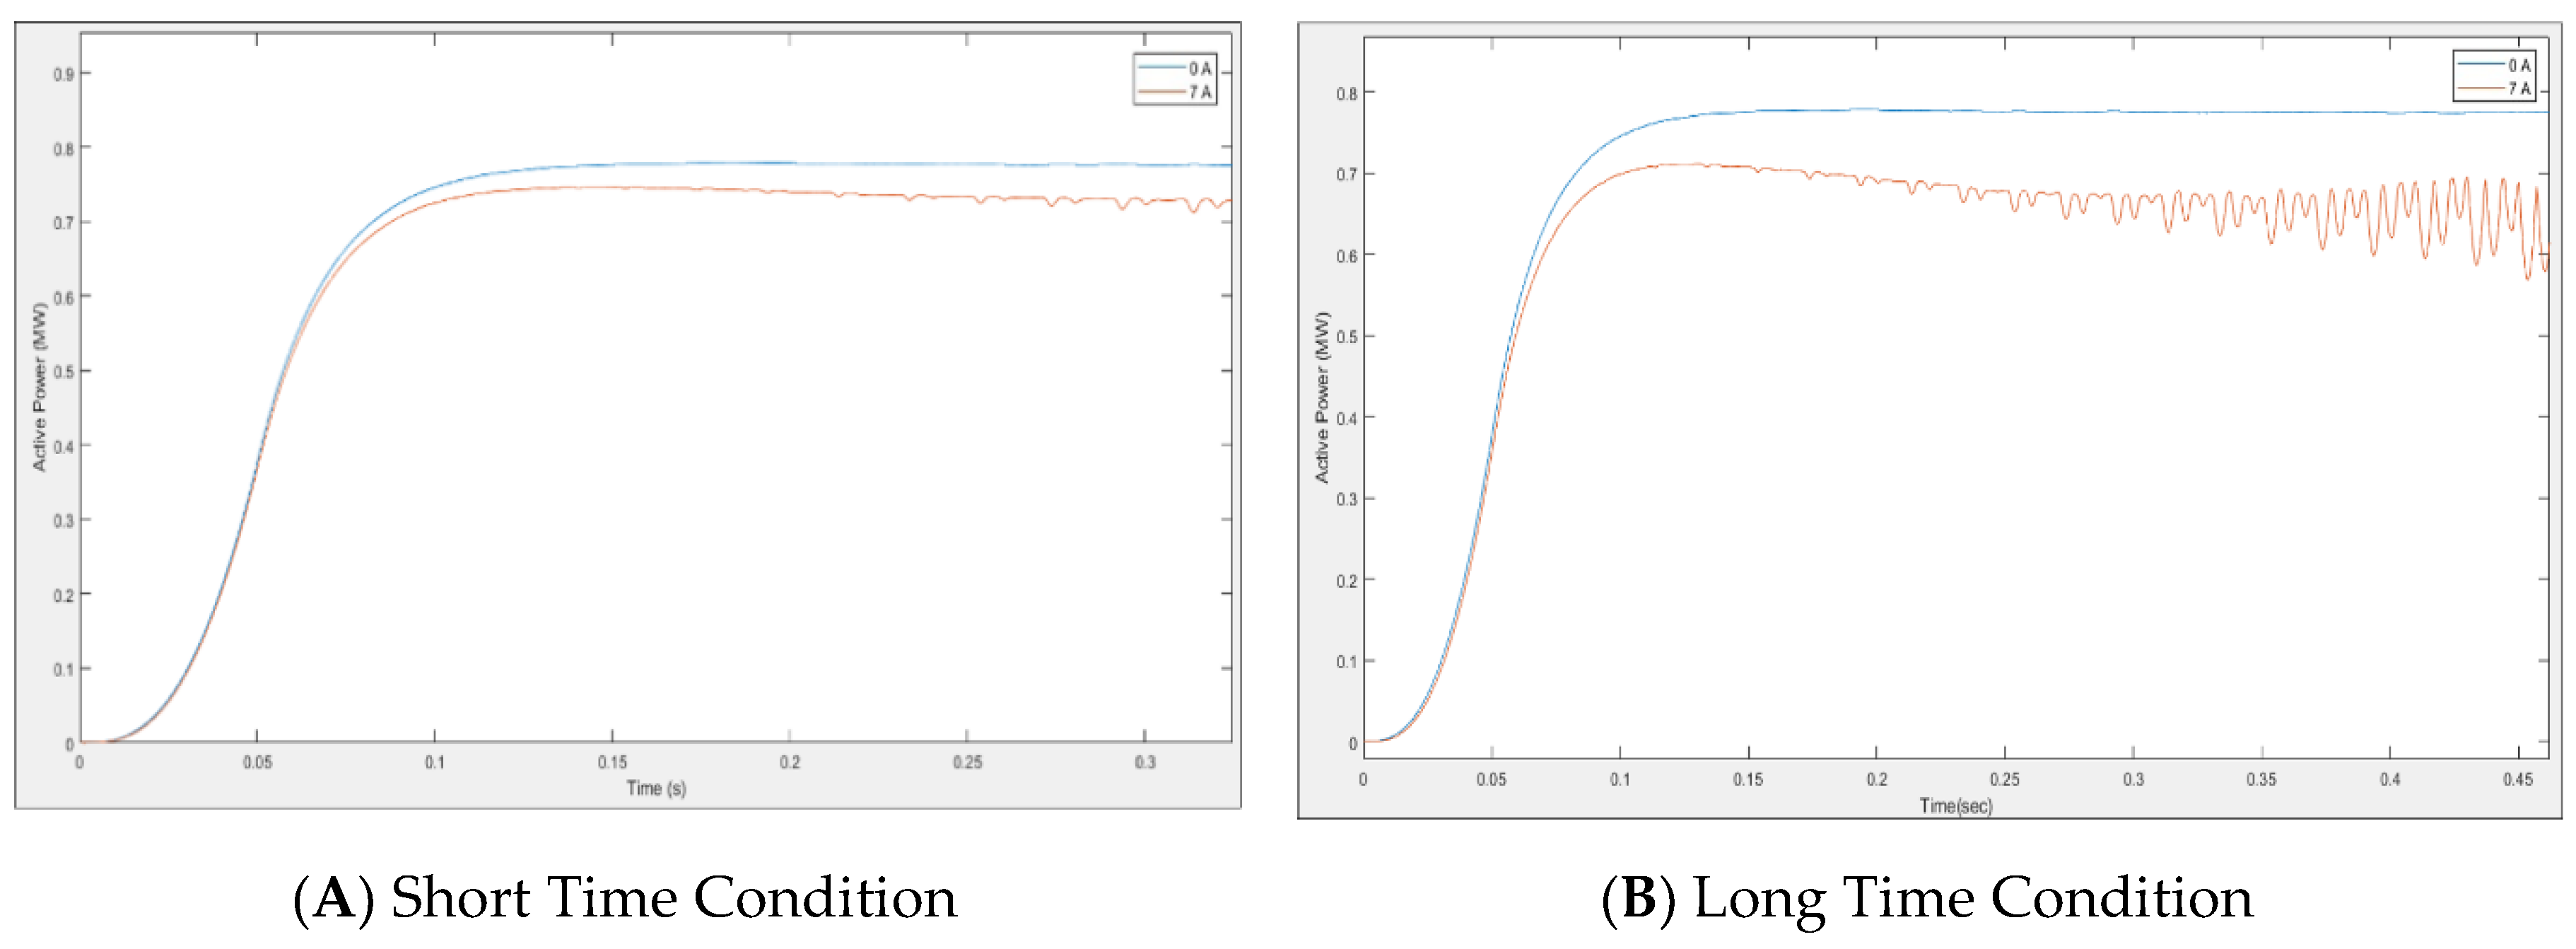
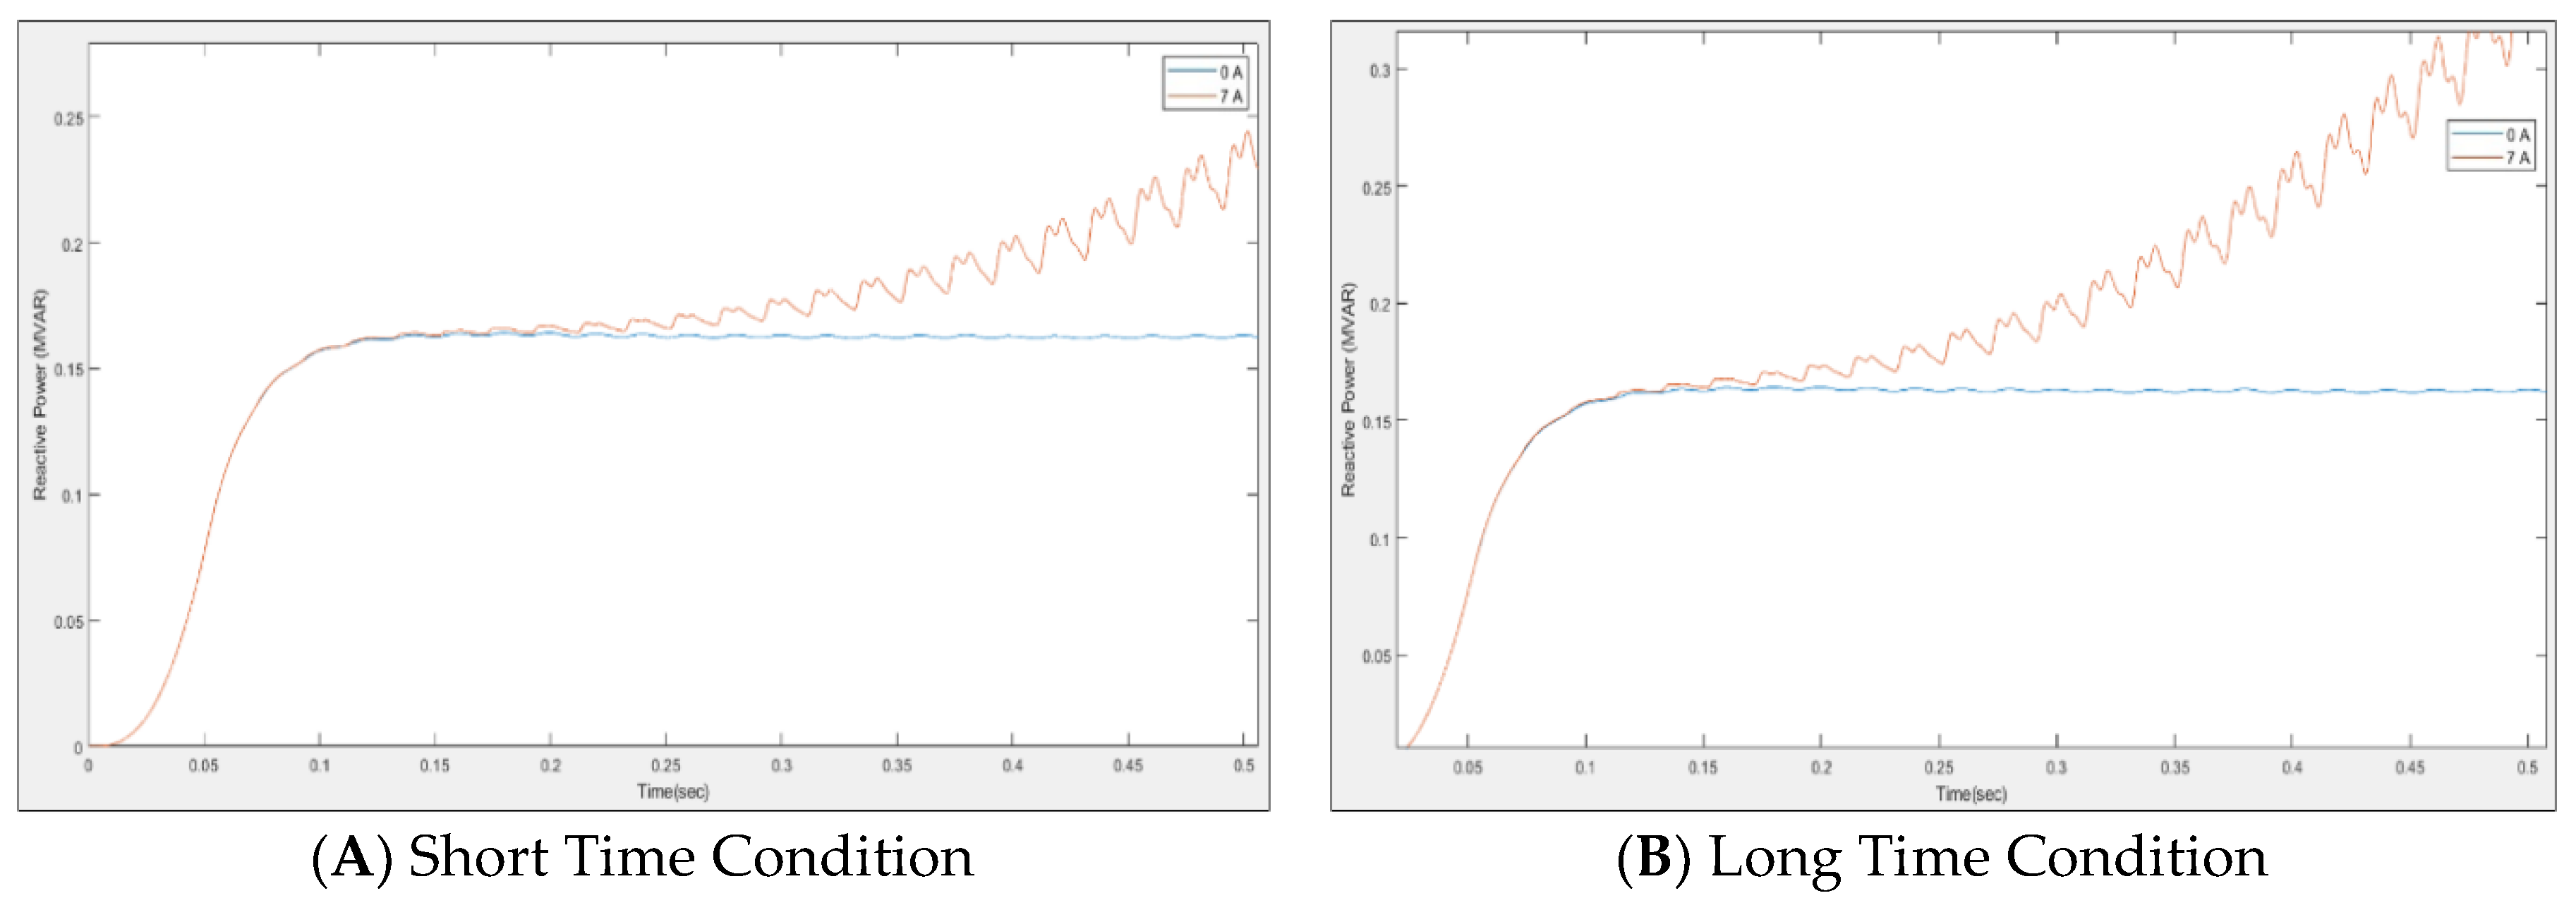
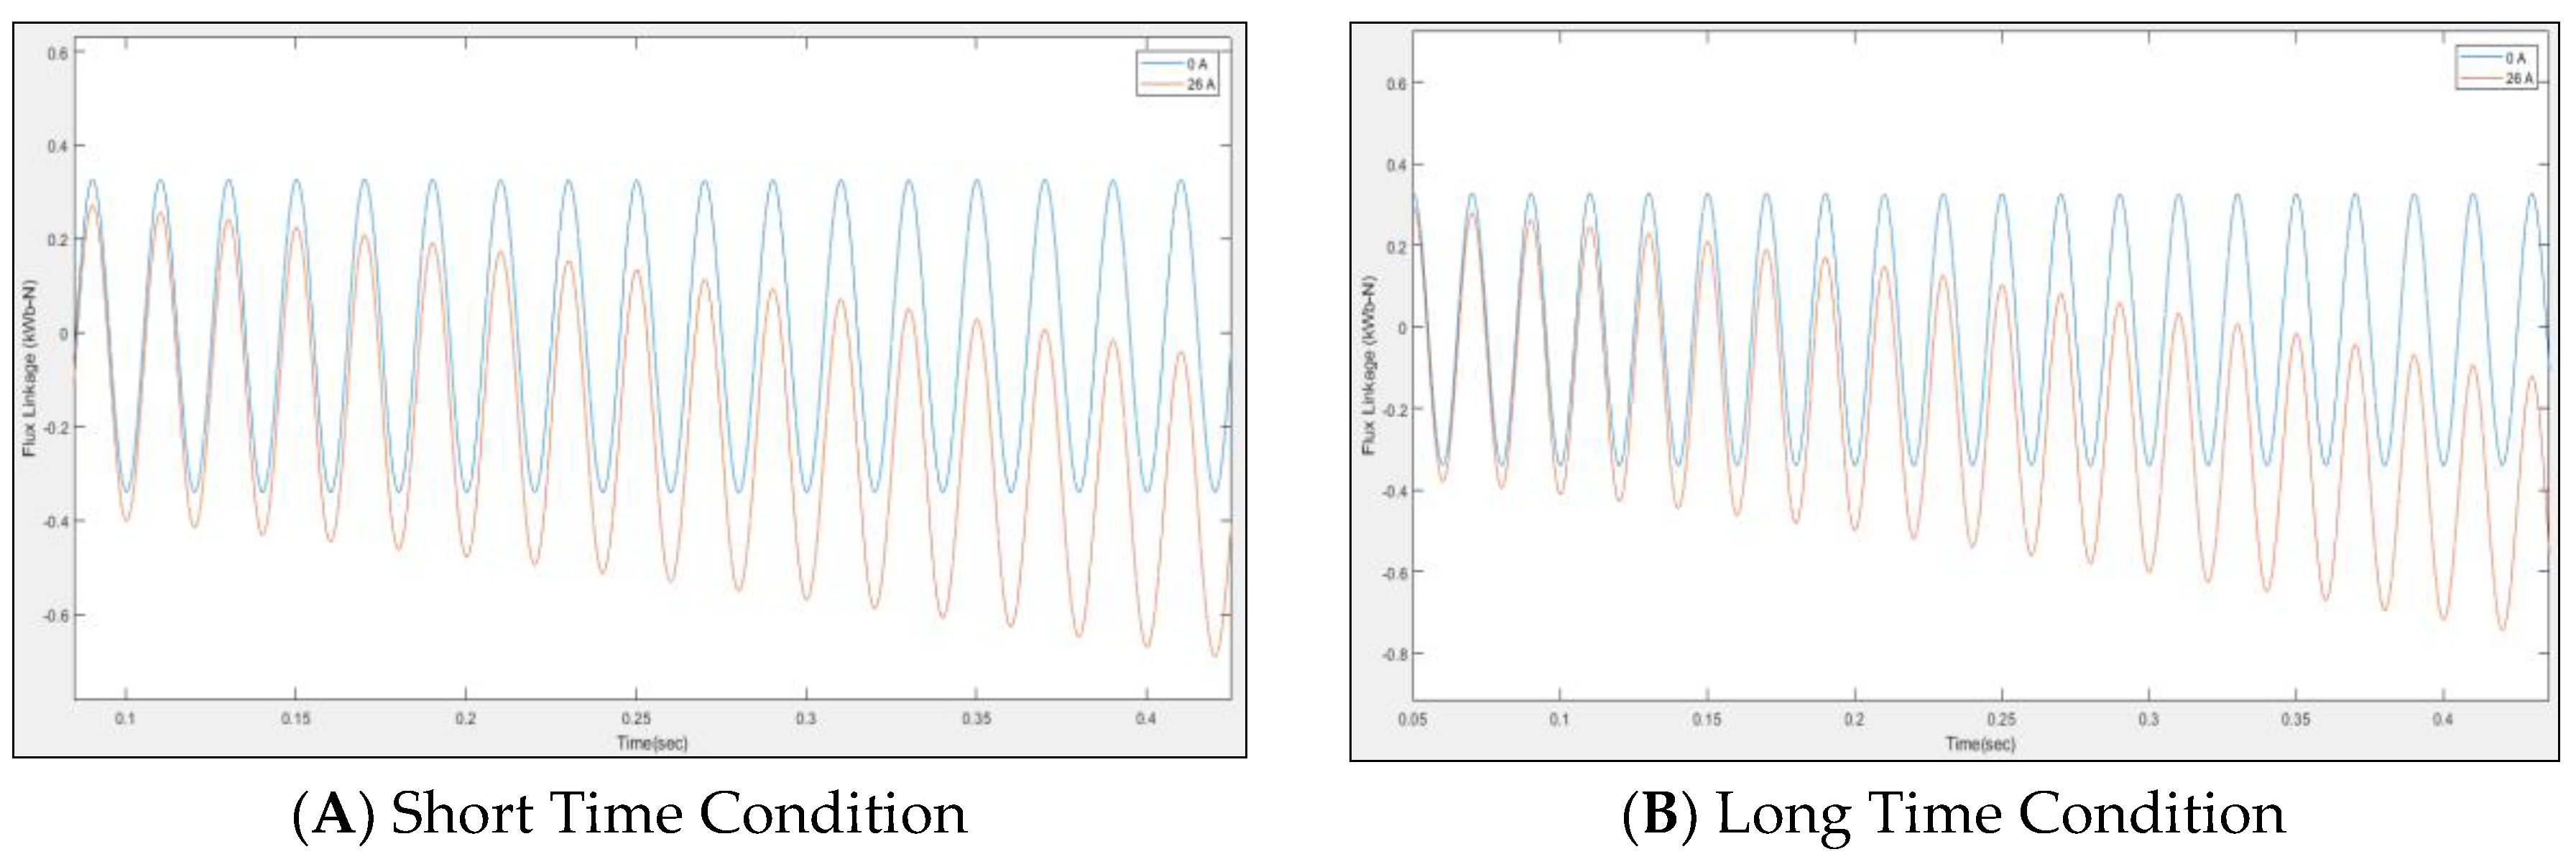
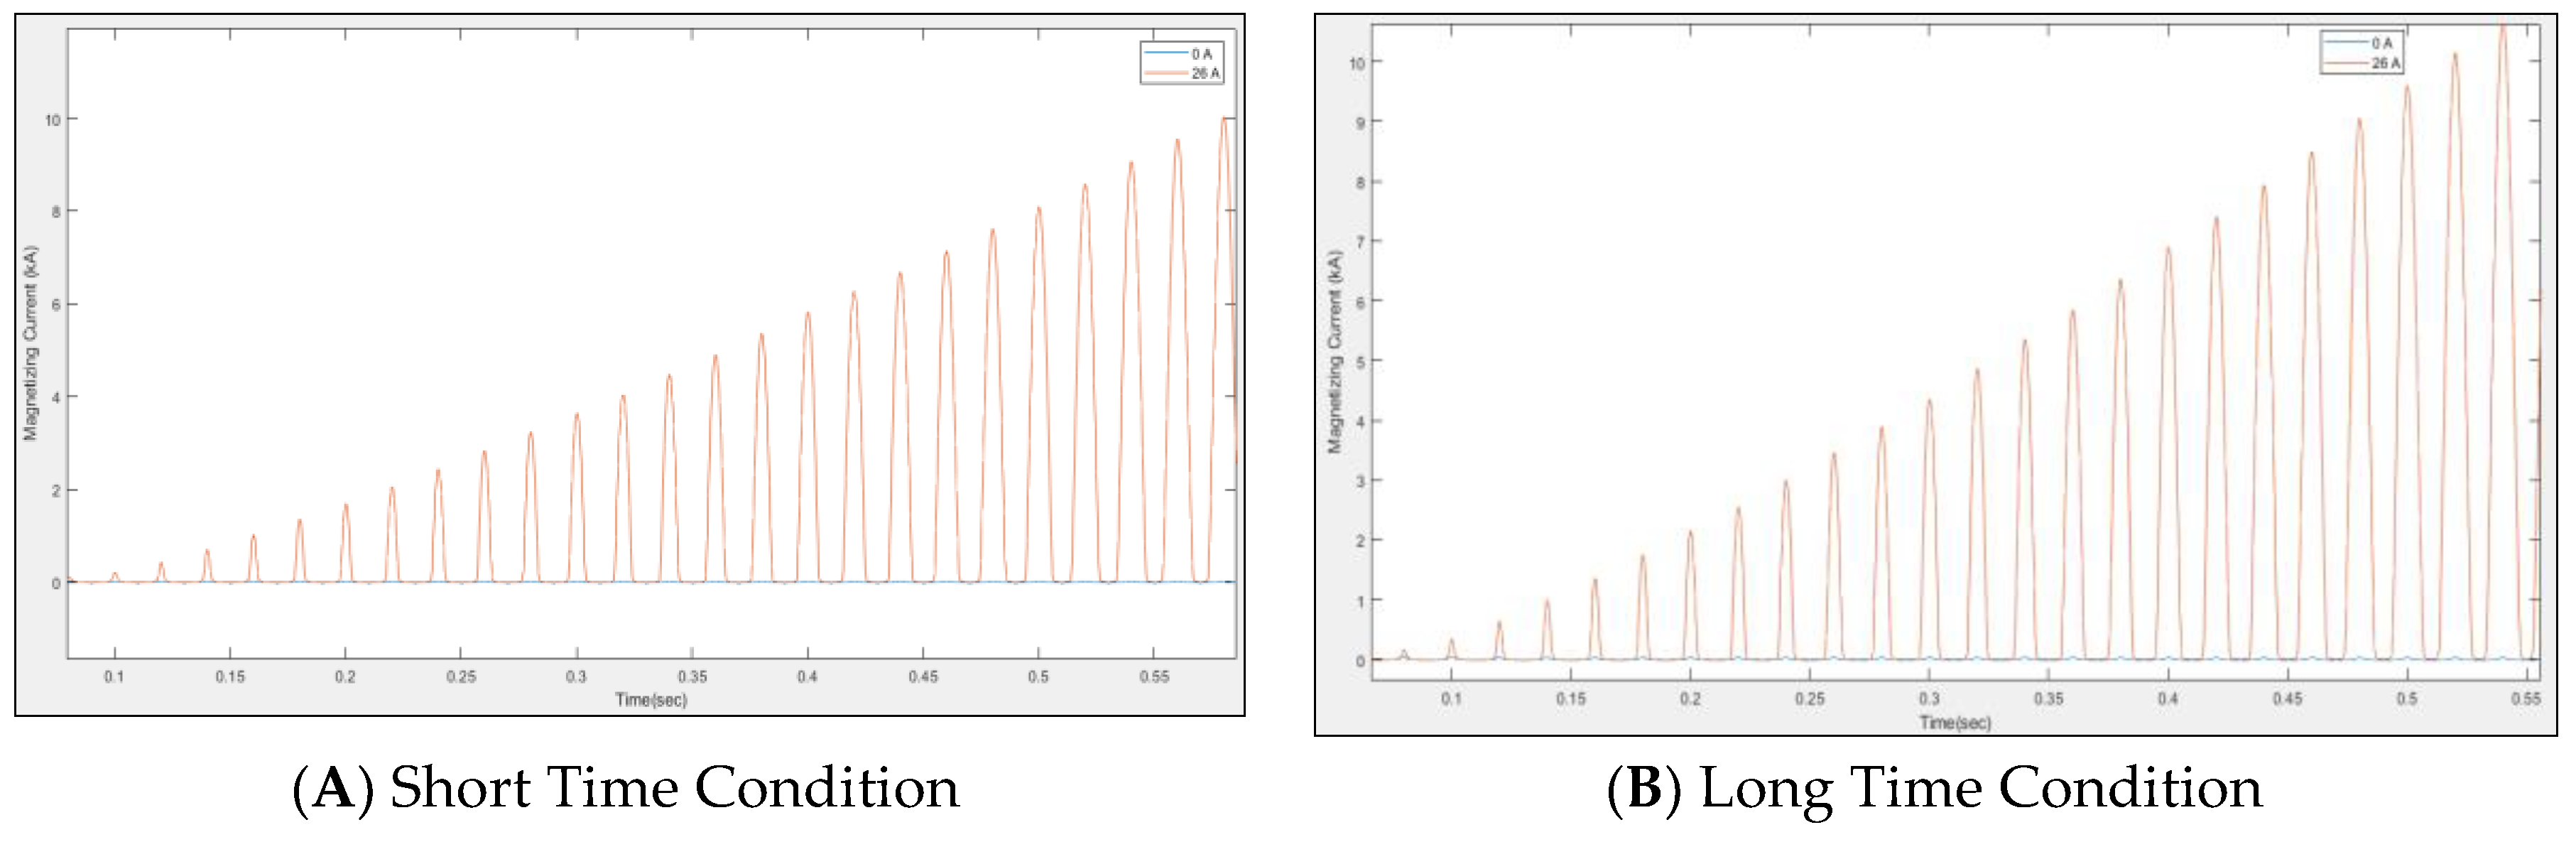
5.3.1. Case 1: Low Magnitude of GIC

For the first case, the system was tested with a minimum magnitude of GIC of 7 A. The entry point of the GIC into the power system was identified through a grounded neutral at the high voltage side of the power transformer. Figure 11, Figure 12, Figure 13, Figure 14 and Figure 15 show the comparison of flux linkage, active power, magnetizing current and reactive power on short time and long time durations of GIC. A short time condition in this research work refers to one minute while a long time duration refers to three minutes [5]. All figures showing 0 A and 7 A are depicted as blue line and red line, respectively. The blue line represents the impact when GIC is 0 A, which means for a system without GIC, while the red line represents the impact when GIC is at 7 A respectively.
As shown in Figure 11, the transformer is driven into the saturation region when GIC flows into its windings under both short time and long time durations, where the latter is much worse than the former. A power transformer is normally designed to operate at the knee point of the saturation curve to maximize its frequency. Due to the superimposition of GIC, the power transformer operating point shifts from the linear region into the saturation region [62]. This phenomenon is called half cycle saturation which can cause several impacts such as increased reactive power consumption, distortion of the core hysteresis curve, harmonics in the secondary and excitation currents and a possible breakdown of a transformer [63]. The core is saturated and the flux begins to leak and couple to everything within the area. Similar findings have been observed from other studies on magnetizing current and flux linkage [64].
As a result, magnetizing current increases as time increases whilst magnitude of flux linkage decreases with time from steady state conditions, as depicted in Figure 12 and Figure 13, respectively. At time equal to 0.5 s for instance, the corresponding magnetizing currents are 1.8 kA and 3.5 kA for short time and long time durations, with the latter almost double the value recorded during the short time duration.
Likewise, in the case of flux linkage for T5 with the magnetic circuit of the core steel saturated, the magnetic flux flows through adjacent paths such as the transformer tank or core-clamping structures. The hot spots that may then form can severely damage the paper winding insulation, produce gassing and combustion of the transformer oil, or lead to other serious internal failures of the transformer [65].
It can be seen that for a short time condition, when GIC is injected into the system, the value of active power decreases from 0.78 MW to 0.73 MW at 0.3 s, which is a 6.41% decrement, while the value of the reactive power increases from 0.16 MVar to 0.24 MVar, which results in a 33.33% increment from steady state condition taken at 0.5 s. For the long time duration, the active power decreases to 0.67 MW, which gives a 14.1% decrement at 0.3 s, while the reactive power increases to 0.3 MVar which is a 46.67% increment from the steady state condition at 0.5 s. This is because when GIC is in the system, the transformer behaves as an inductive load and consumes more reactive power resulting in fluctuations in the voltage level. Another impact is that active power decreases due to losses as a result of deformation of the transformer windings [63]. This is the consequence of repeated excitation by the harmonics current. This agrees with similar findings reported by past researchers [62].
The values of the active power and reactive power for short time and long time duration cases do not change very much. This is because the differences are the duration of GIC in the power transformer. Hence, it is proven that GIC duration does not result in significant impact to the power transformer [62]. A slight change in flux linkage, active power, magnetizing current and reactive power does not affect the behaviour of the power transformer as shown in Figure 12, Figure 13, Figure 14 and Figure 15.

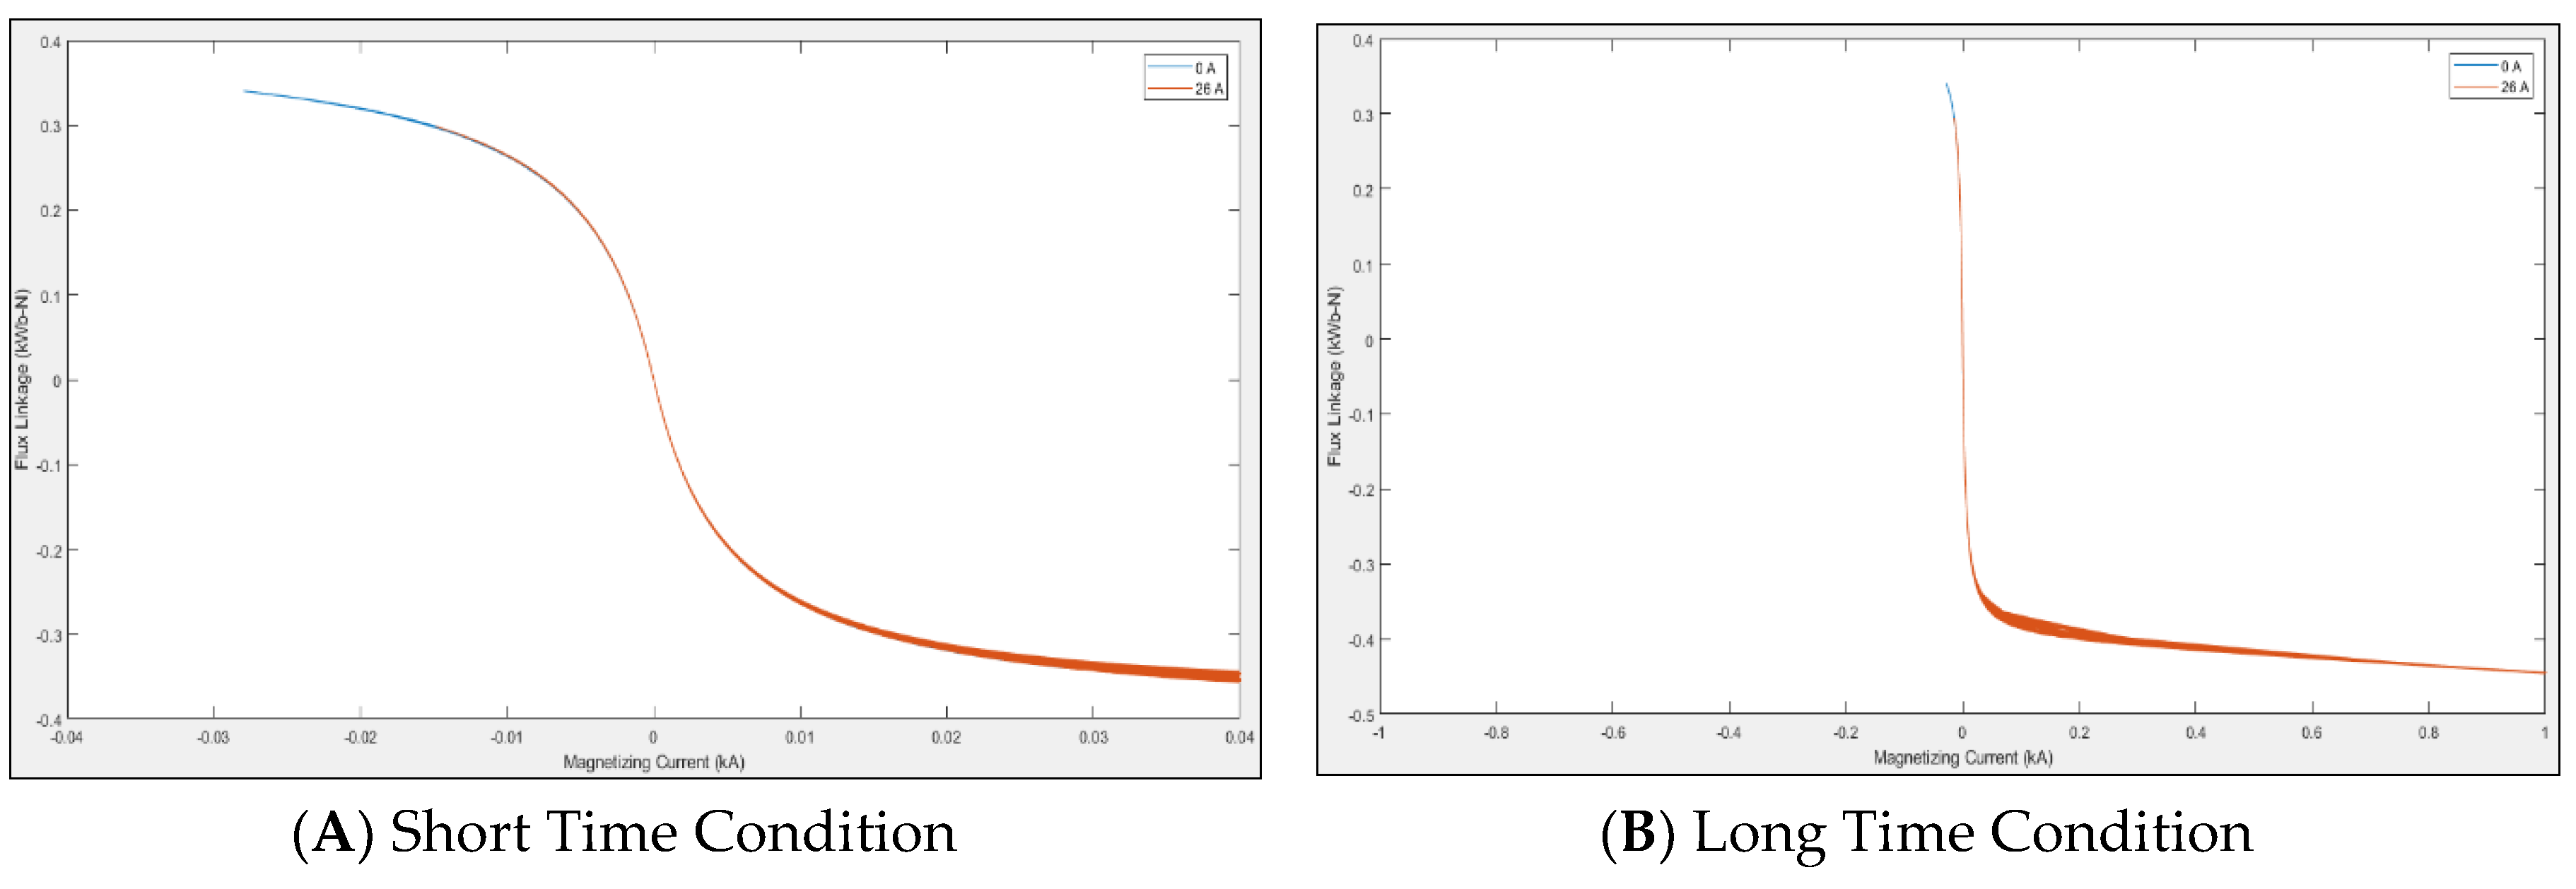
5.3.2. Case 2: High Magnitude of GIC

For the second case, a high magnitude of GIC was applied to the power transformer. As reported in the literature, the magnitude of the GIC can reach up to 30 A in the low latitude region and, therefore, a high magnitude GIC of 26 A was considered in this case. Figure 16, Figure 17, Figure 18, Figure 19 and Figure 20 show the results obtained for the GIC impact due to short time and long time duration of GIC, which are illustrated in the respective figures of flux linkage, active power, magnetizing current and reactive power. The blue line graphs represent the impact when GIC is 0 A, which means for a system without GIC, while the red graphs represent the impact when GIC is at 26 A.
Similar to the scenario in the first case, hysteresis curves were obtained when the T5 was injected with a GIC of 26 A. Figure 16 shows that the transformer is driven into saturation region when GIC flows into its windings. It can be seen that the result is slightly different from the previous case, in particular concerning the long time duration where the curve is much skewed to right, as opposed to the short time duration. This is due to the higher magnitude of GIC injected into the system that caused extreme saturation to occur [65].
Similar to the previous case, a GIC of 26 A, which was injected into the neutral of the T5, caused flux linkage decreases and magnetizing current increases from steady state condition with respect to time. These increments were more severe in the long time duration case by several orders of magnitude, compared to the steady state condition.
Meanwhile in Figure 19, results indicate that the value of the active power decreases to 0.15 MW at 0.45 s, which is an 80.77% decrement, while the value of the reactive power increases to 0.7 MVar at 0.5 s, which results in a 77.14% increment from the steady state condition for the short time condition. As for the long time condition, the active power decreases to 0.01 MW which gives a 98.72% decrement at 0.45 s.
Likewise for the case of reactive power in Figure 20, where the value increases to 0.8 MVar at 0.5 s, an 80% increment from steady state condition occurs. These results are in good agreement when comparing with the GMD storm study carried out by North American Electric Reliability Corporation (NERC) [66]. It can be seen that the higher the magnitude of GIC, the higher the reactive power consumption. As previously discussed, the higher the value of the GIC, more damage occurs in the transformer as it starts to experience fluctuations in the system. This agrees with the statements reported in other studies as GIC can saturate the power transformer and cause high reactive power consumption [62]. Large changes in the reactive and real power balance can cause fluctuations in the system as well as reduce the efficiency of the transformer [66].
Comparing all the results obtained in Figure 16, Figure 17, Figure 18, Figure 19 and Figure 20, those figures clearly show that the impact of GIC to the power system is worst when long GIC time duration is coupled with high GIC magnitude. Higher magnetizing current amplitude of 0.2 kA is obtained, which is 20% more than the magnetizing current amplitude at the steady state condition

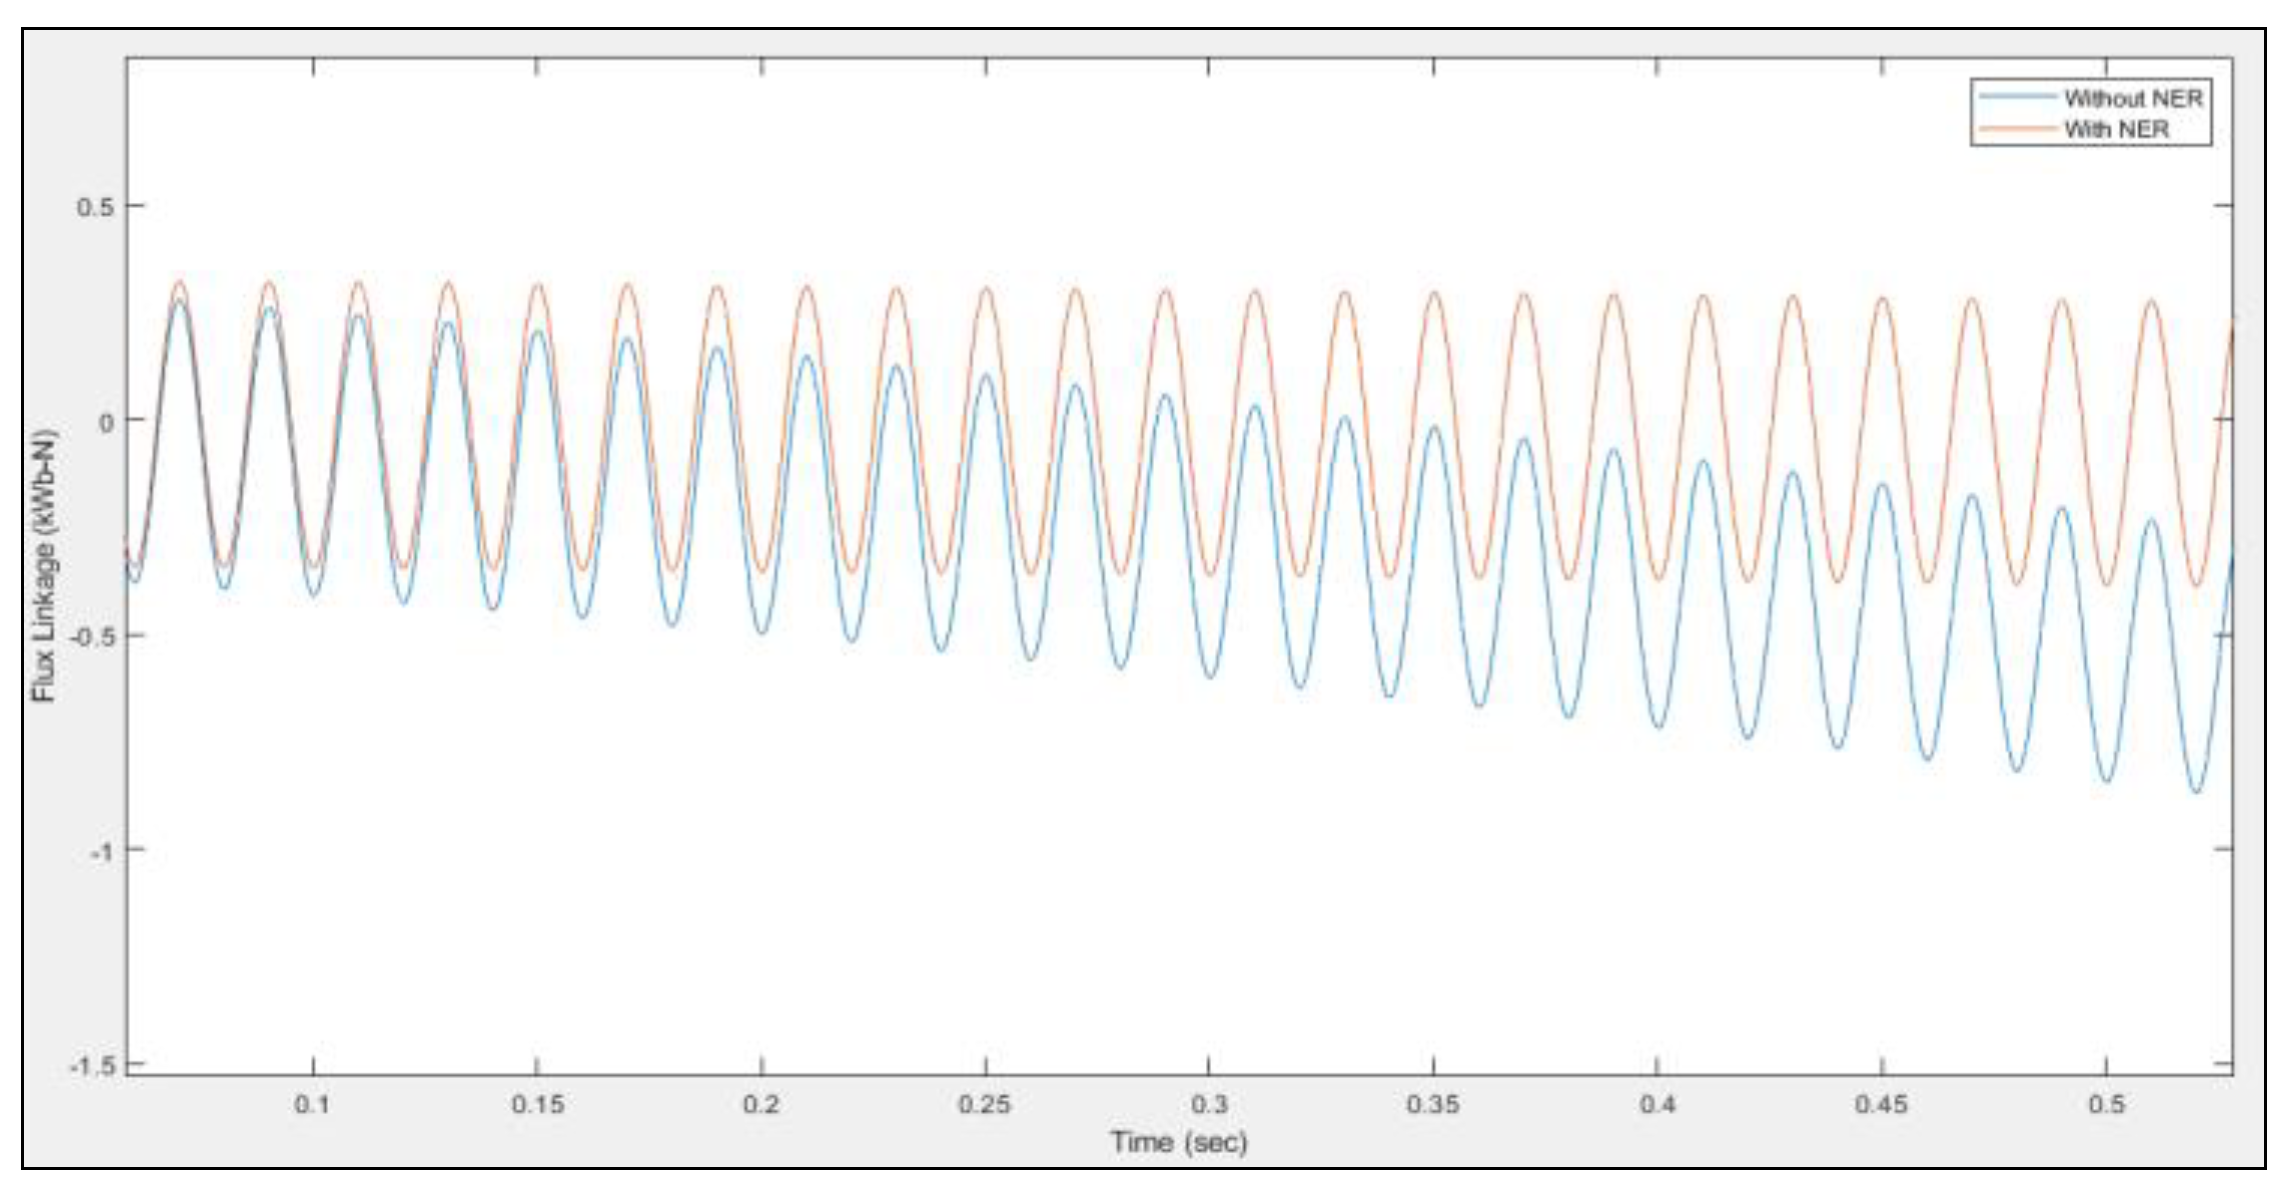
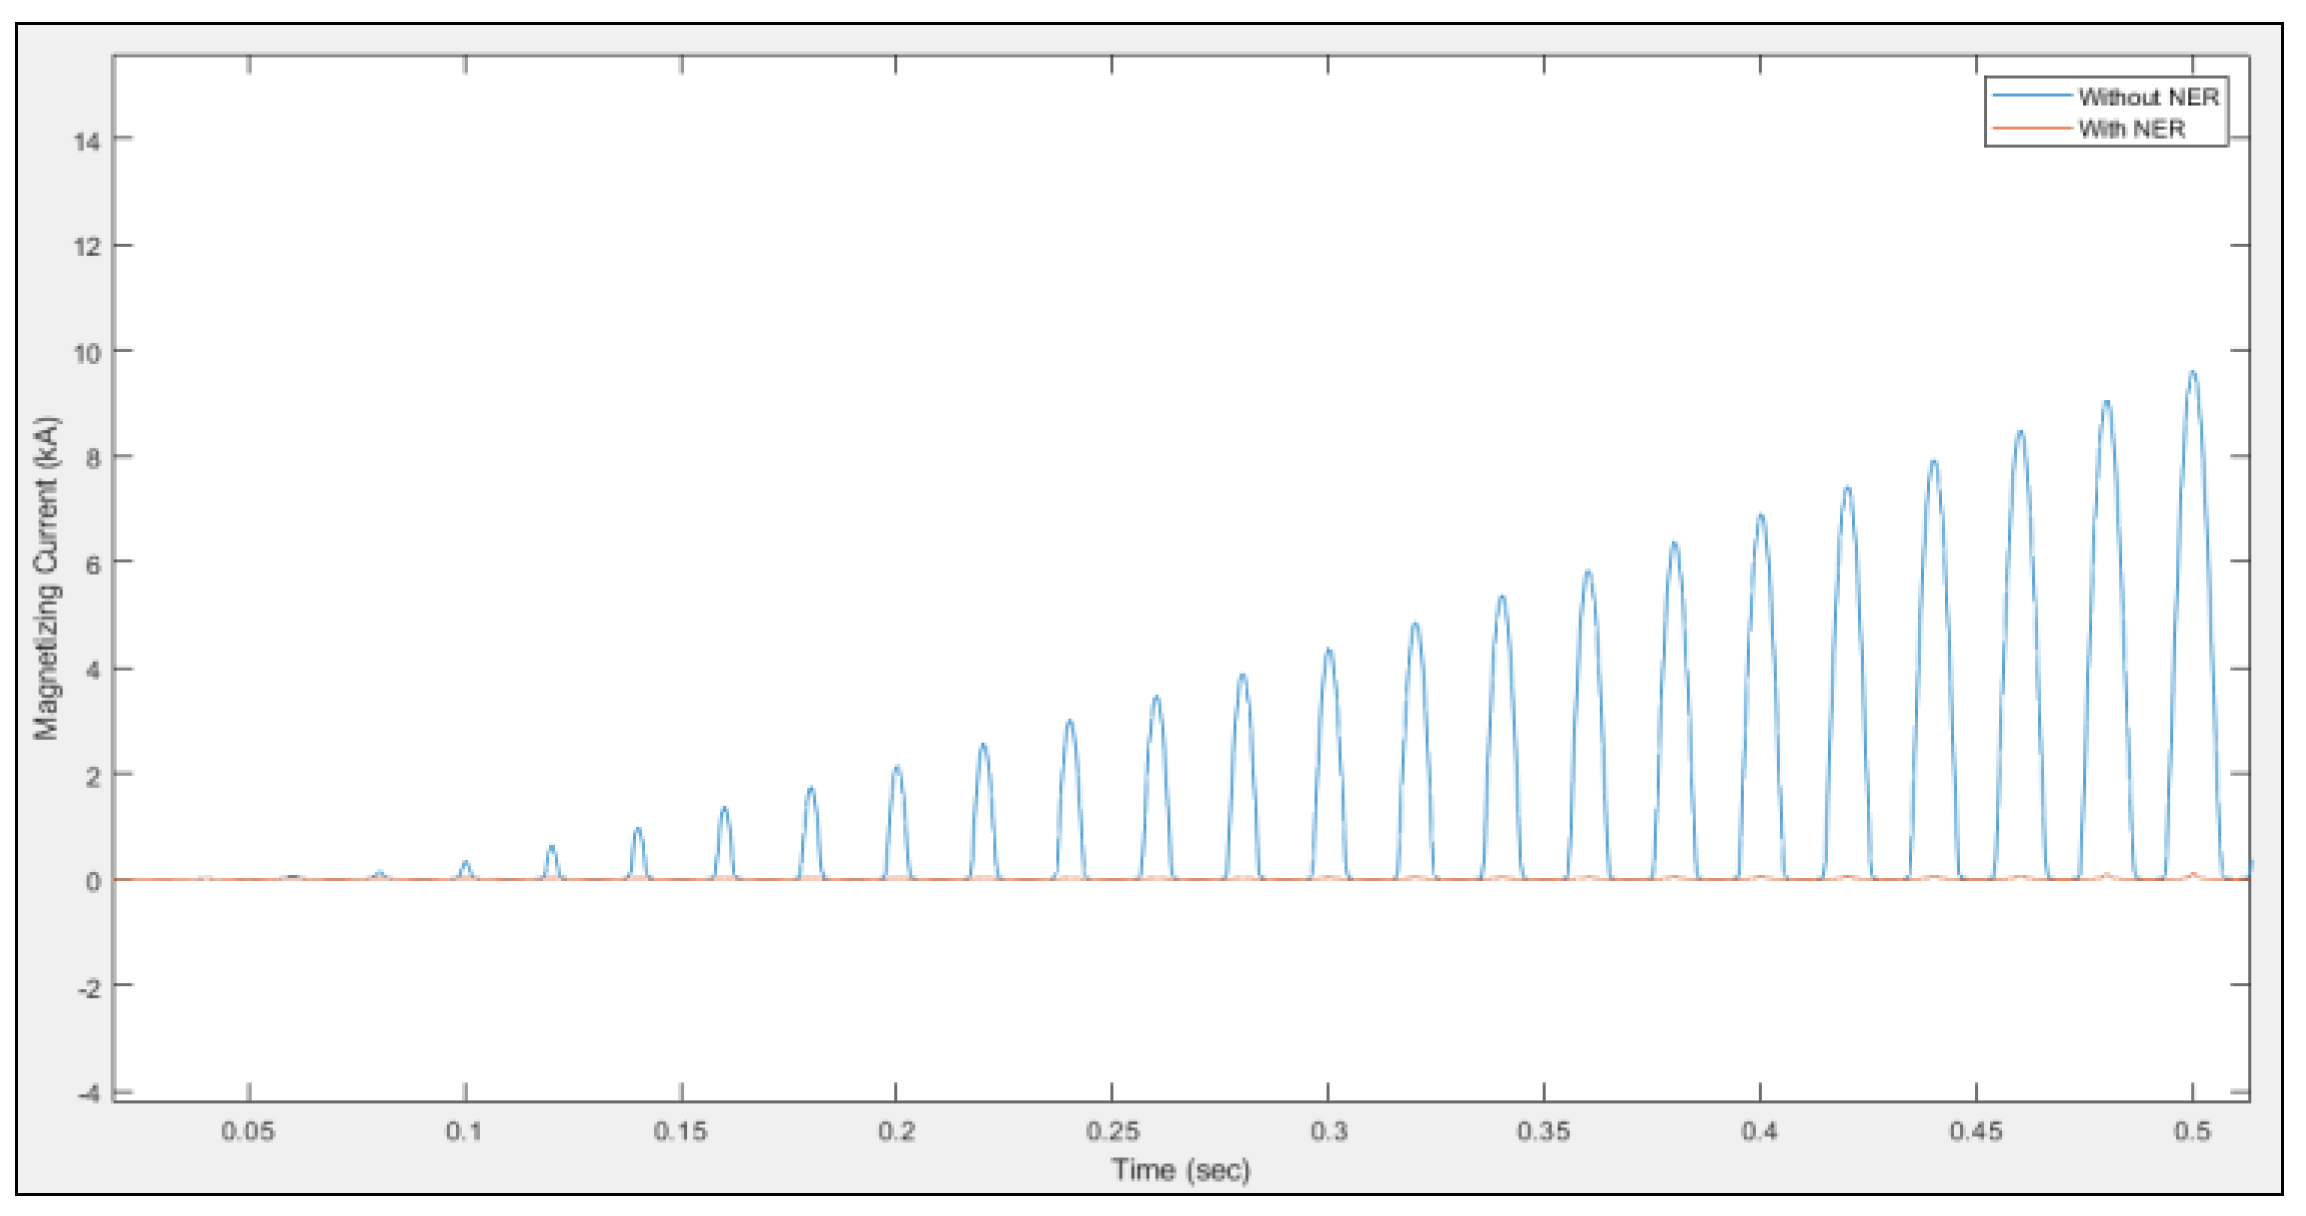
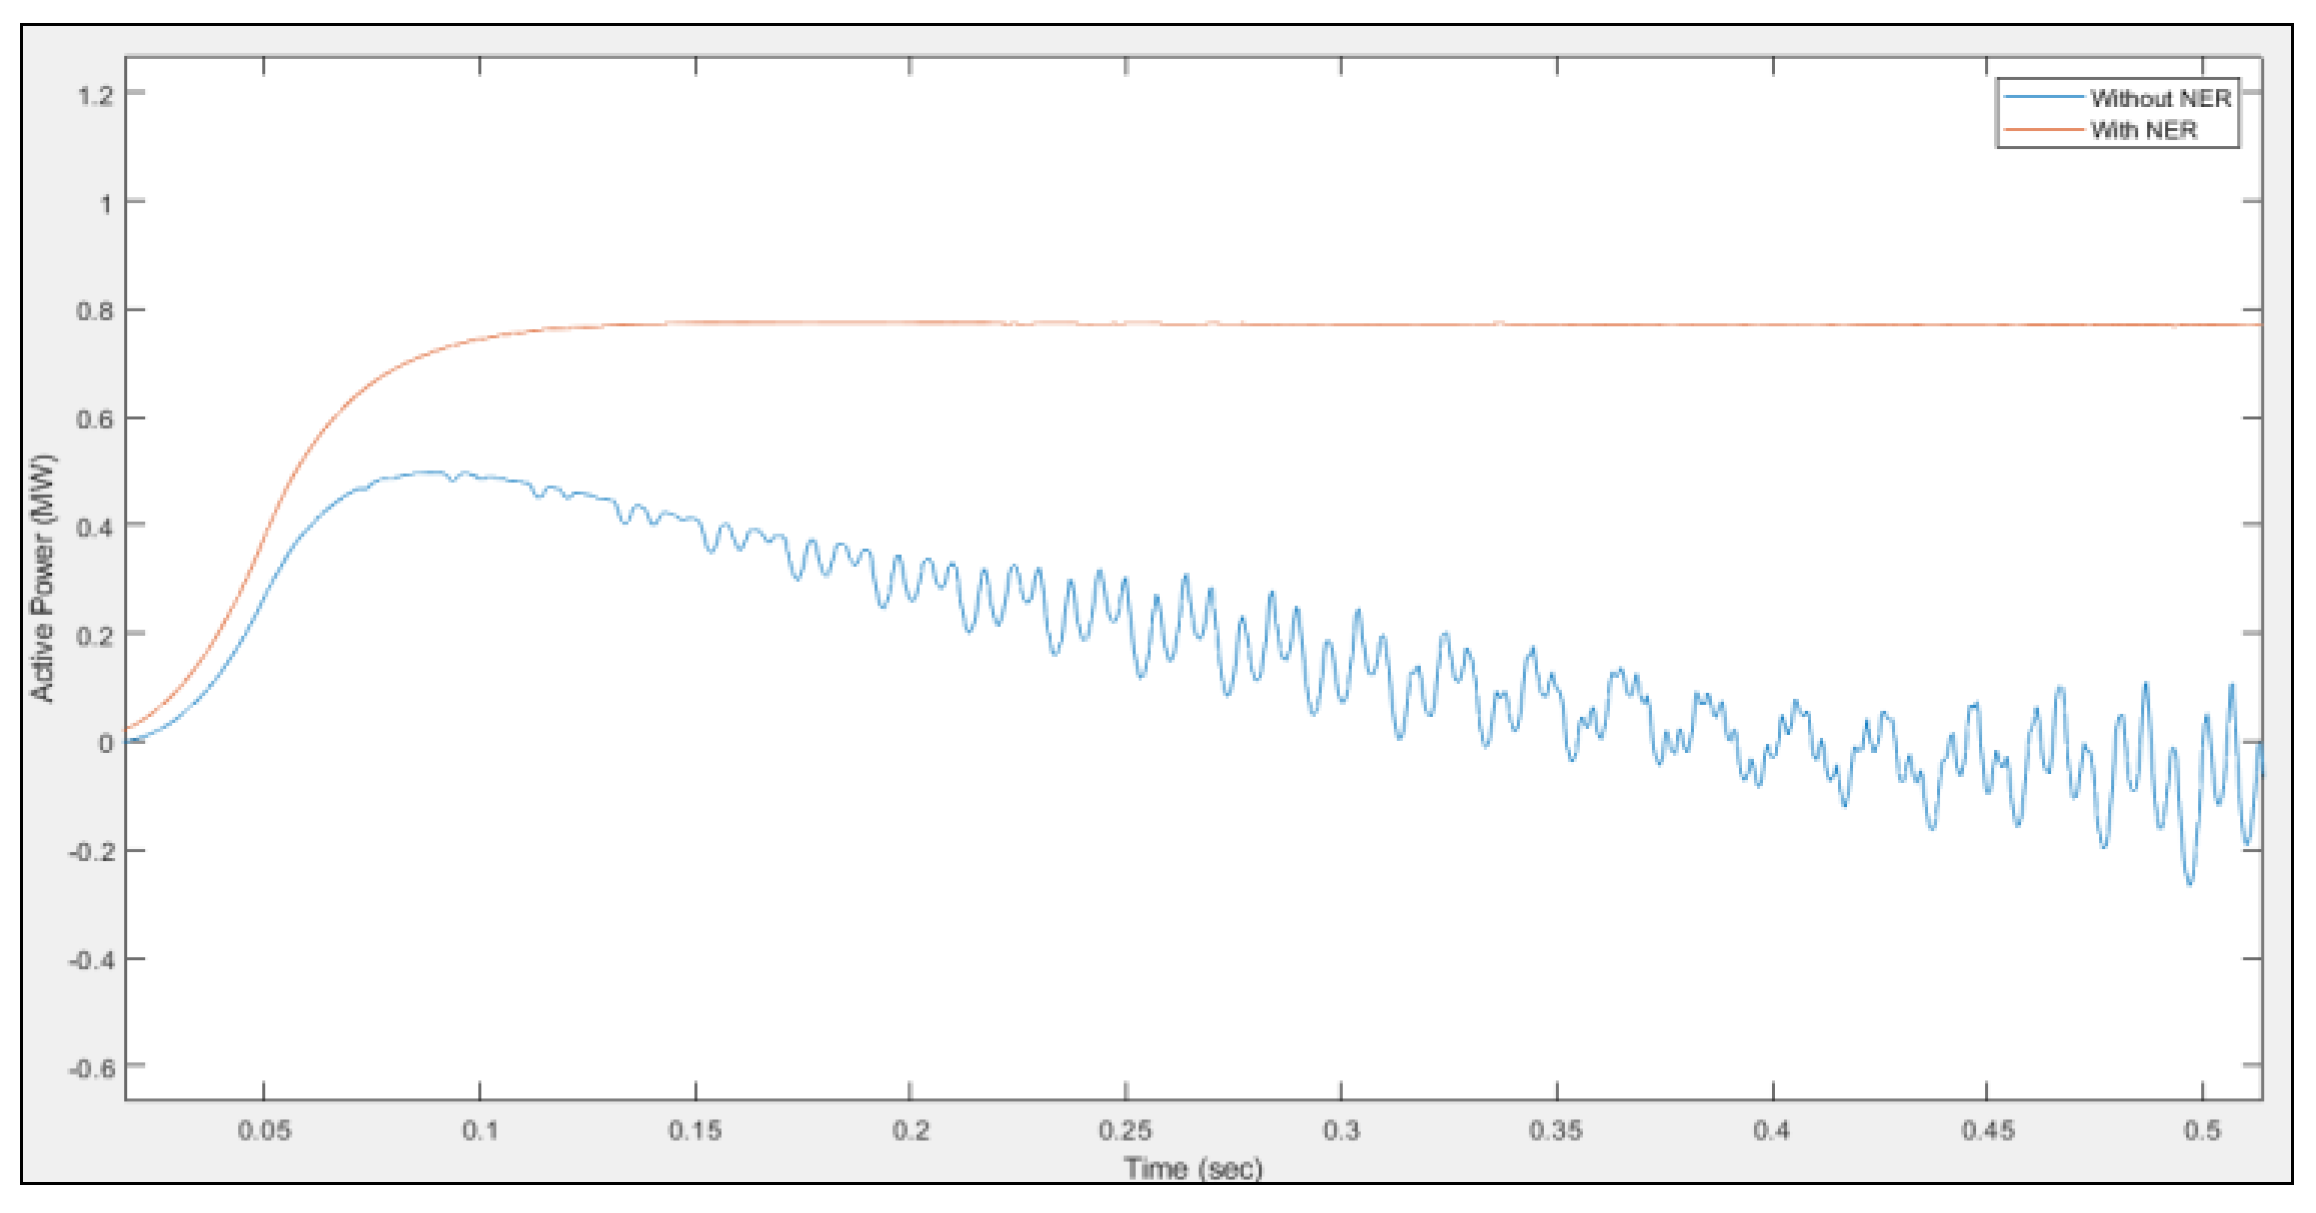
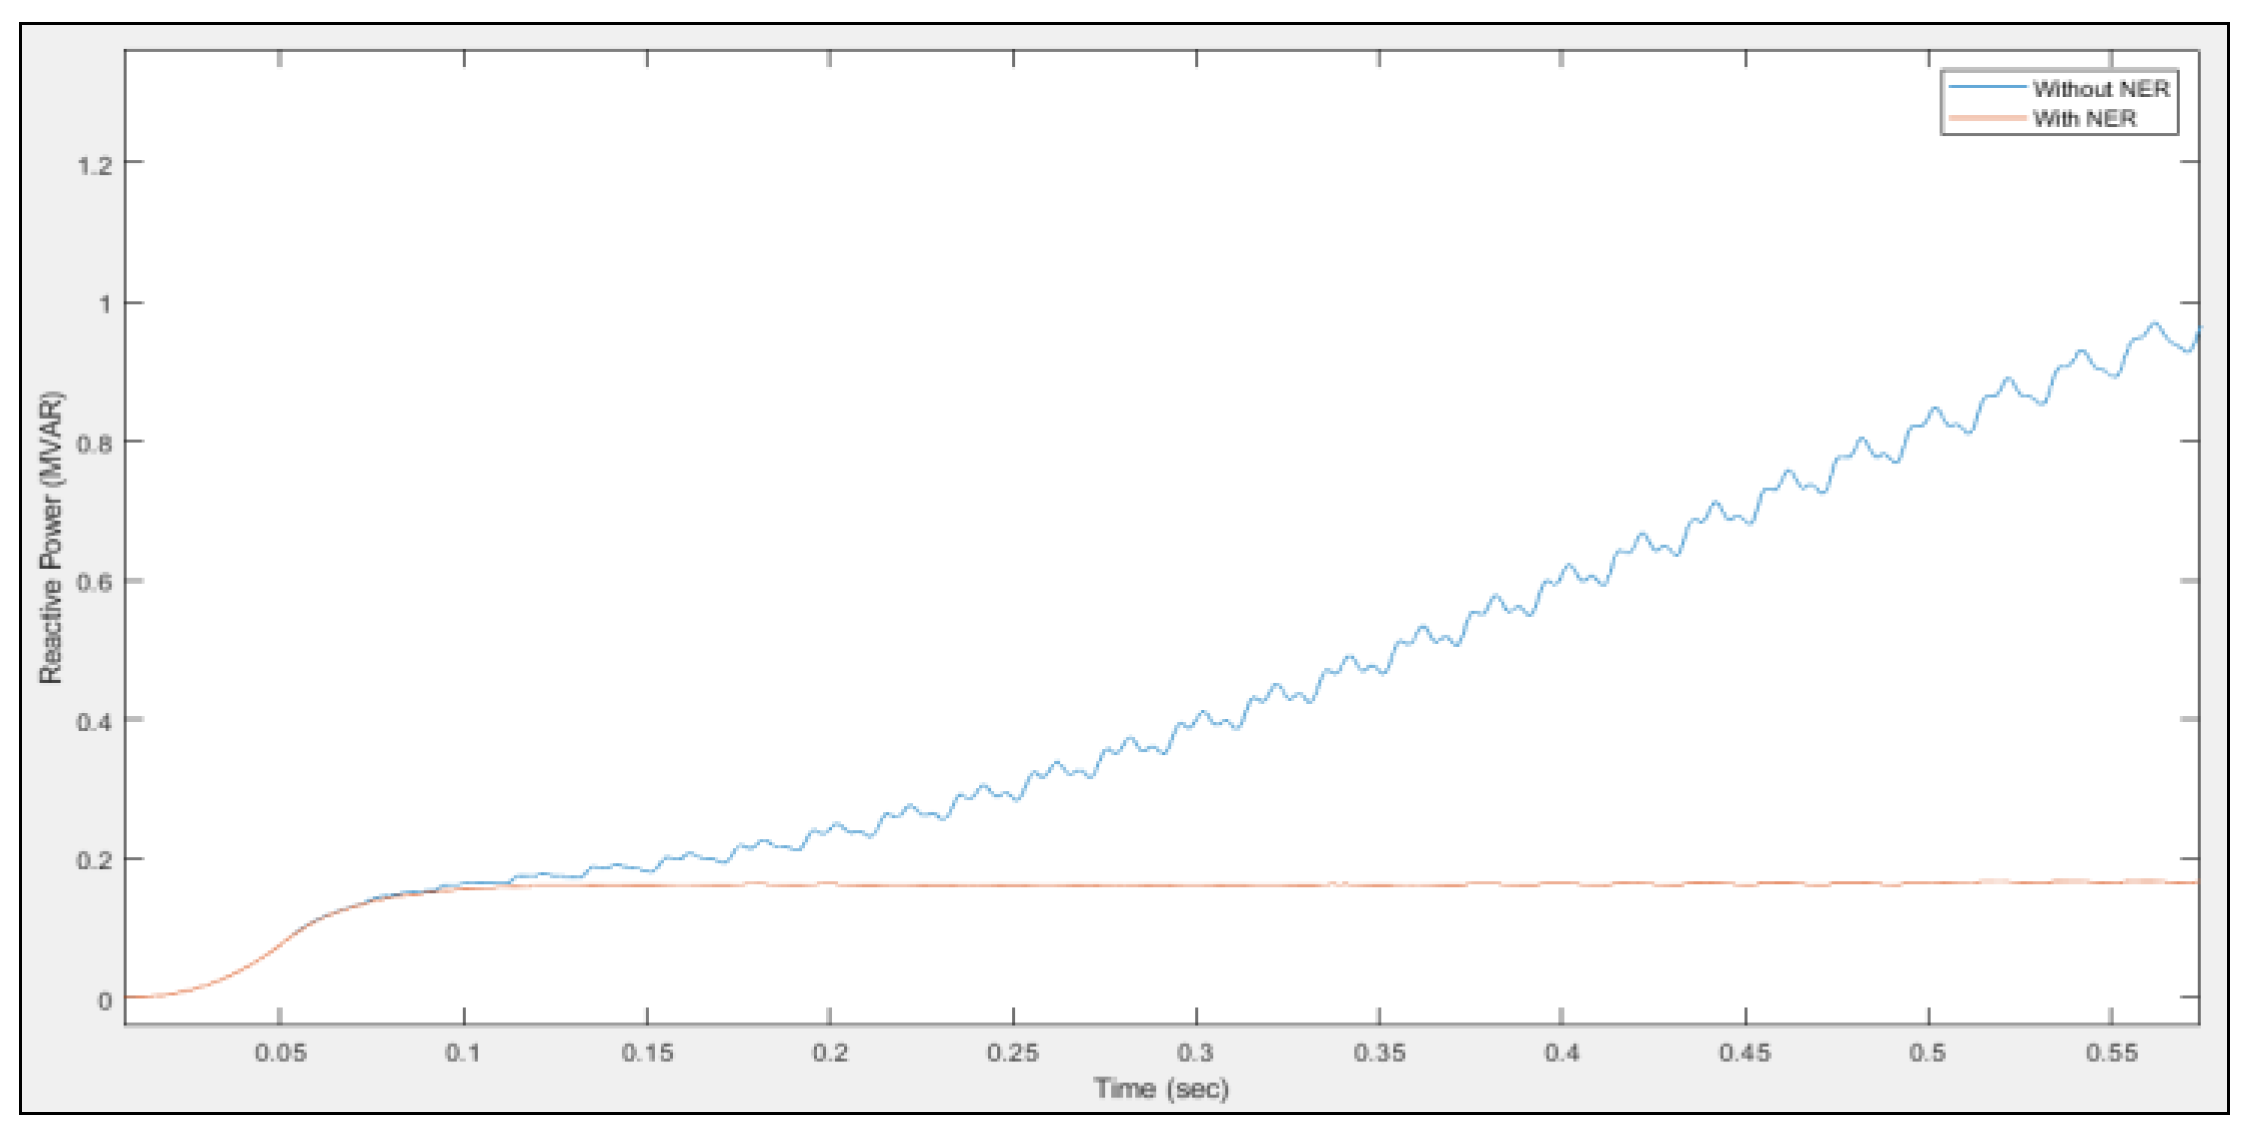
5.4. GIC Mitigation on 275 kV Power Transformer

This section discusses the function of NER as the mitigation method to reduce the GIC impact on 275 kV power transformer. NER was connected to the neutral point of 275 kV power transformer with a value of 315.10 Ω. This section only focuses on the mitigation of the most severe case which is long time duration and high magnitude of GIC condition. Figure 21 depicts the hysteresis curve for both with and without NER.
Figure 22, Figure 23, Figure 24 and Figure 25 show the result of flux linkage, active power, magnetizing current and reactive power for long time and high magnitude of the GIC condition without and with NER. Without NER, the flux linkage magnitude increases whilst the magnetizing current decreases with time for the T5 due to the core, which is heavily saturated. As a result, the distribution of flux is altered, leading to increased eddy current loss, var consumption and tank wall heating. This result is in good observation with the incident reported by IEEE Power Energy Society Working Group K17 in their Technical Report [67] where a GIC of about 75 A per phase distorted the magnetizing current and increased the var consumption by 150–200 MVar.
Considering the worst case scenario simulated for this case, the use of NER was able to lower and correct the flux linkage and the magnetizing current obtained, as opposed to the one without NER.
In terms of the stability, the active power increased and stabilized with time to 0.76 MW whilst the reactive power decreased to 0.18 MVar with time as shown in Figure 24 and Figure 25, respectively. Clearly, NER successfully reduced the magnitude of GIC entering the power transformer and thus maintained the voltage level of power transformer at steady state condition as shown in Table 6.
Table 6 shows a comparison between the values of active power, reactive power and voltage at substation A focusing on T5. Under the influence of GIC without NER, the voltage level was 250 kV which is a decrement of 9.1%, thus it is not within the acceptable limit of ±5% for a high voltage system. The value of voltage increased to 265.1 kV, when NER was connected, which is within the range of ±5% of steady state condition based on EC [60]. The value of voltage was within the acceptable limit of ±5% when a 315.10 Ω NER was connected at grounded neutral of the power transformer. It shows that NER successfully reduced the magnitude of GIC from entering the power transformer. This is consistent with the role of NER, which is to limit the current flowing through the neutral of the power transformer. Hence, grounding the power transformer through NER is the simplest approach to reduce the magnitude of GIC flowing in substation equipment. It reflects an indisputable agreement that the magnitude of GIC can have significant impacts on power transformers and, when it is reduced, the impact to the power transformers are reduced [66].

6. Conclusions

Based on the results obtained, several contributions can be highlighted with regards to the present work, at least for a low latitude country and the same voltage system, as follows:
  • Studies on GIC impact on power systems for low latitude countries are few due to the conceptual understanding that at low latitude they are not affected by the GIC. In contrast, studies have shown that GIC resulting from several other GMDs took place apart from the solar storms. Taking into consideration the probability for this event to happen, especially in South East Asian (SEA) region countries, the present work has successfully provided a reference for other researchers, or power utilities, to look into their system resiliency.
  • Analysis of GIC impacted on a power transformer in Malaysia was modeled based on the actual 275 kV network provided by the local power utility, as opposed to many studies that only focused on the assumed network parameters or only on the transformer. The literature has shown that detail, or a comprehensive network, is required for more accurate analyses. On the other hand, analysis of the impacts of GIC on the Malaysian power system network has not been reported in the past, particularly on the sensitivity of power transformers with respect to the duration of the GIC in order to investigate influence on the flux linkage, magnetizing current, active power, reactive power and hysteresis curves
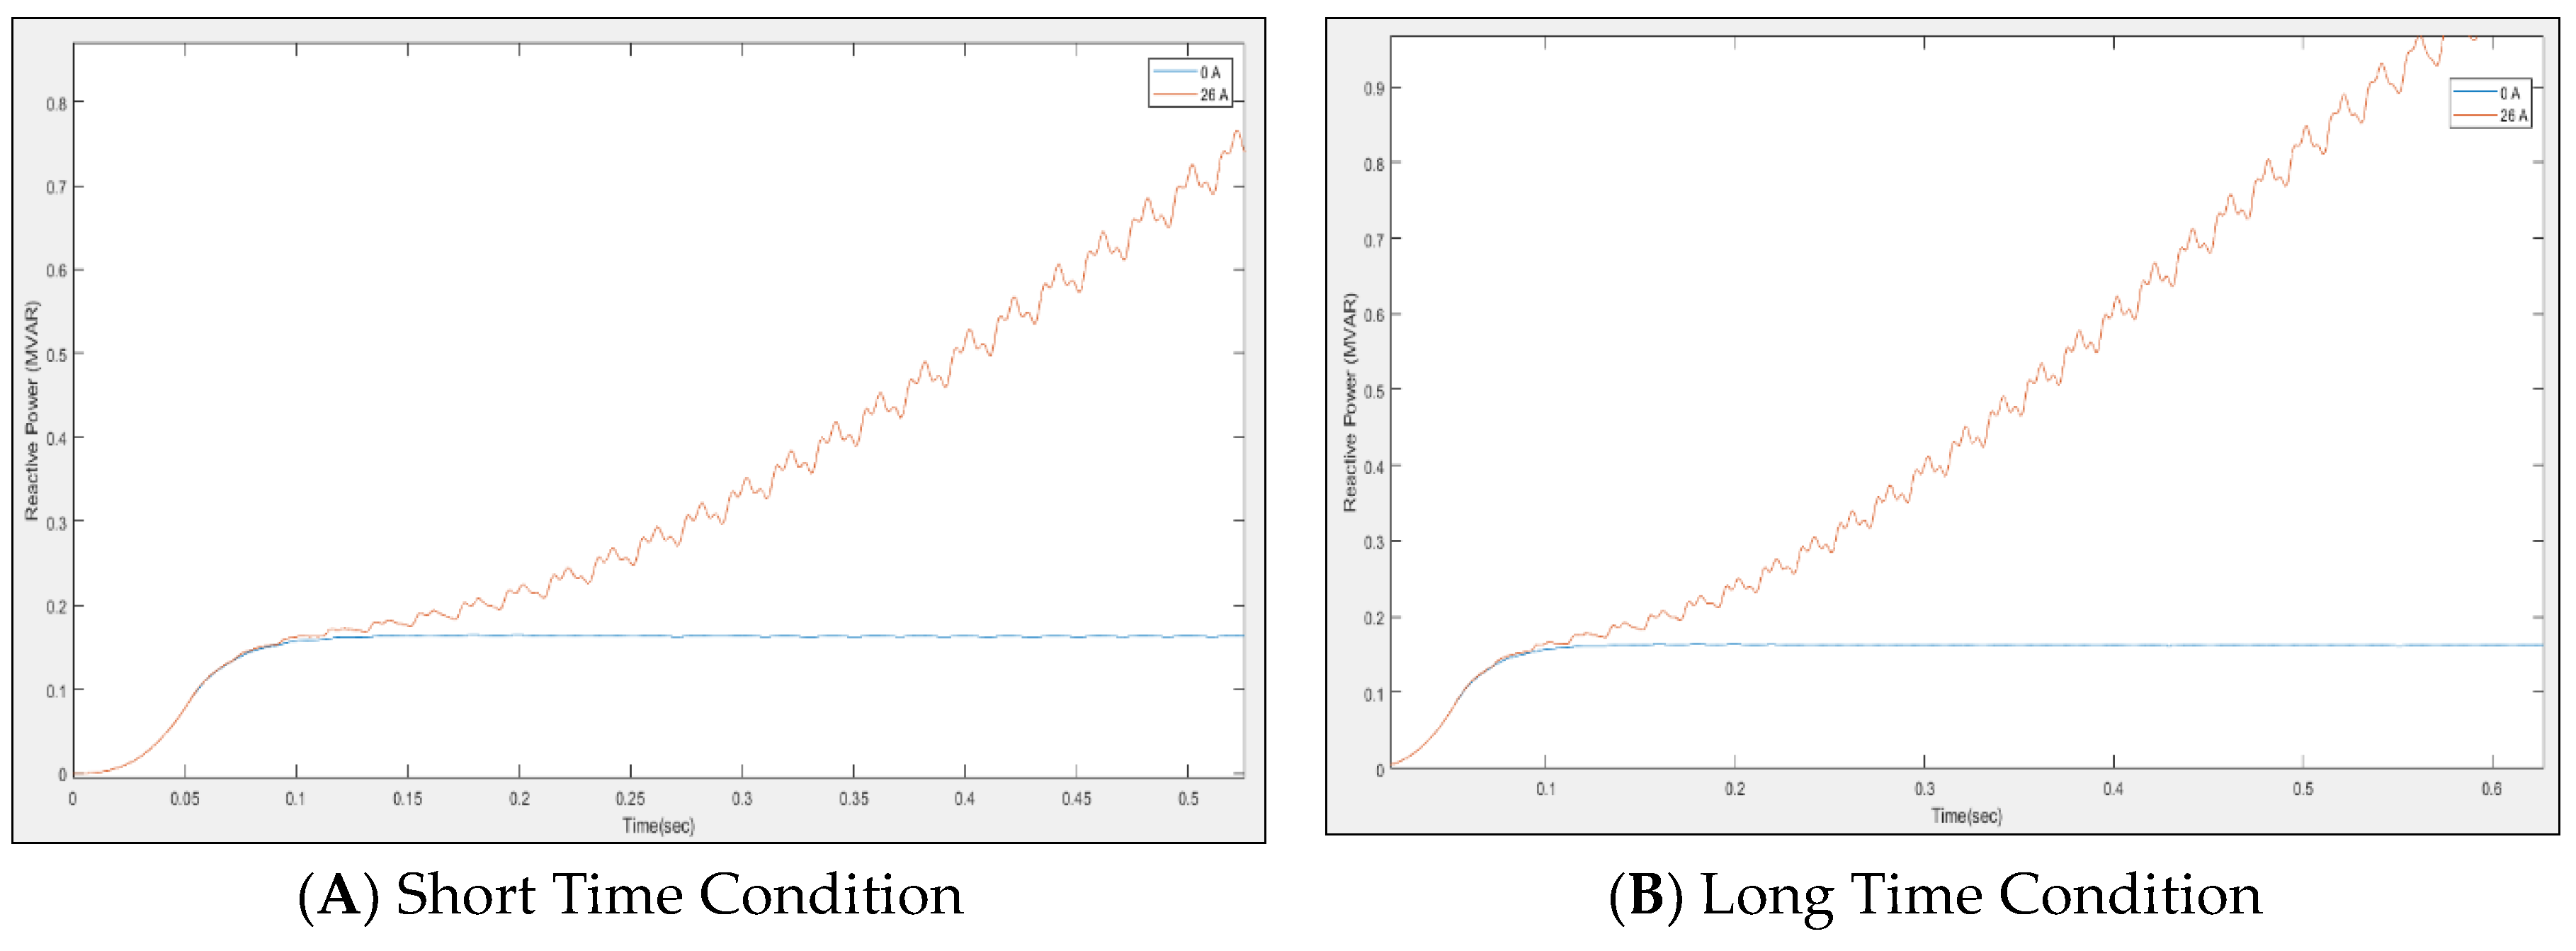
  • Simulation showed that long duration coupled with high magnitude of GIC is the most hazardous to power transformers leading to power system voltage instability. It was also shown that the magnitude of the GIC had a greater impact on the power transformer compared to GIC duration alone.
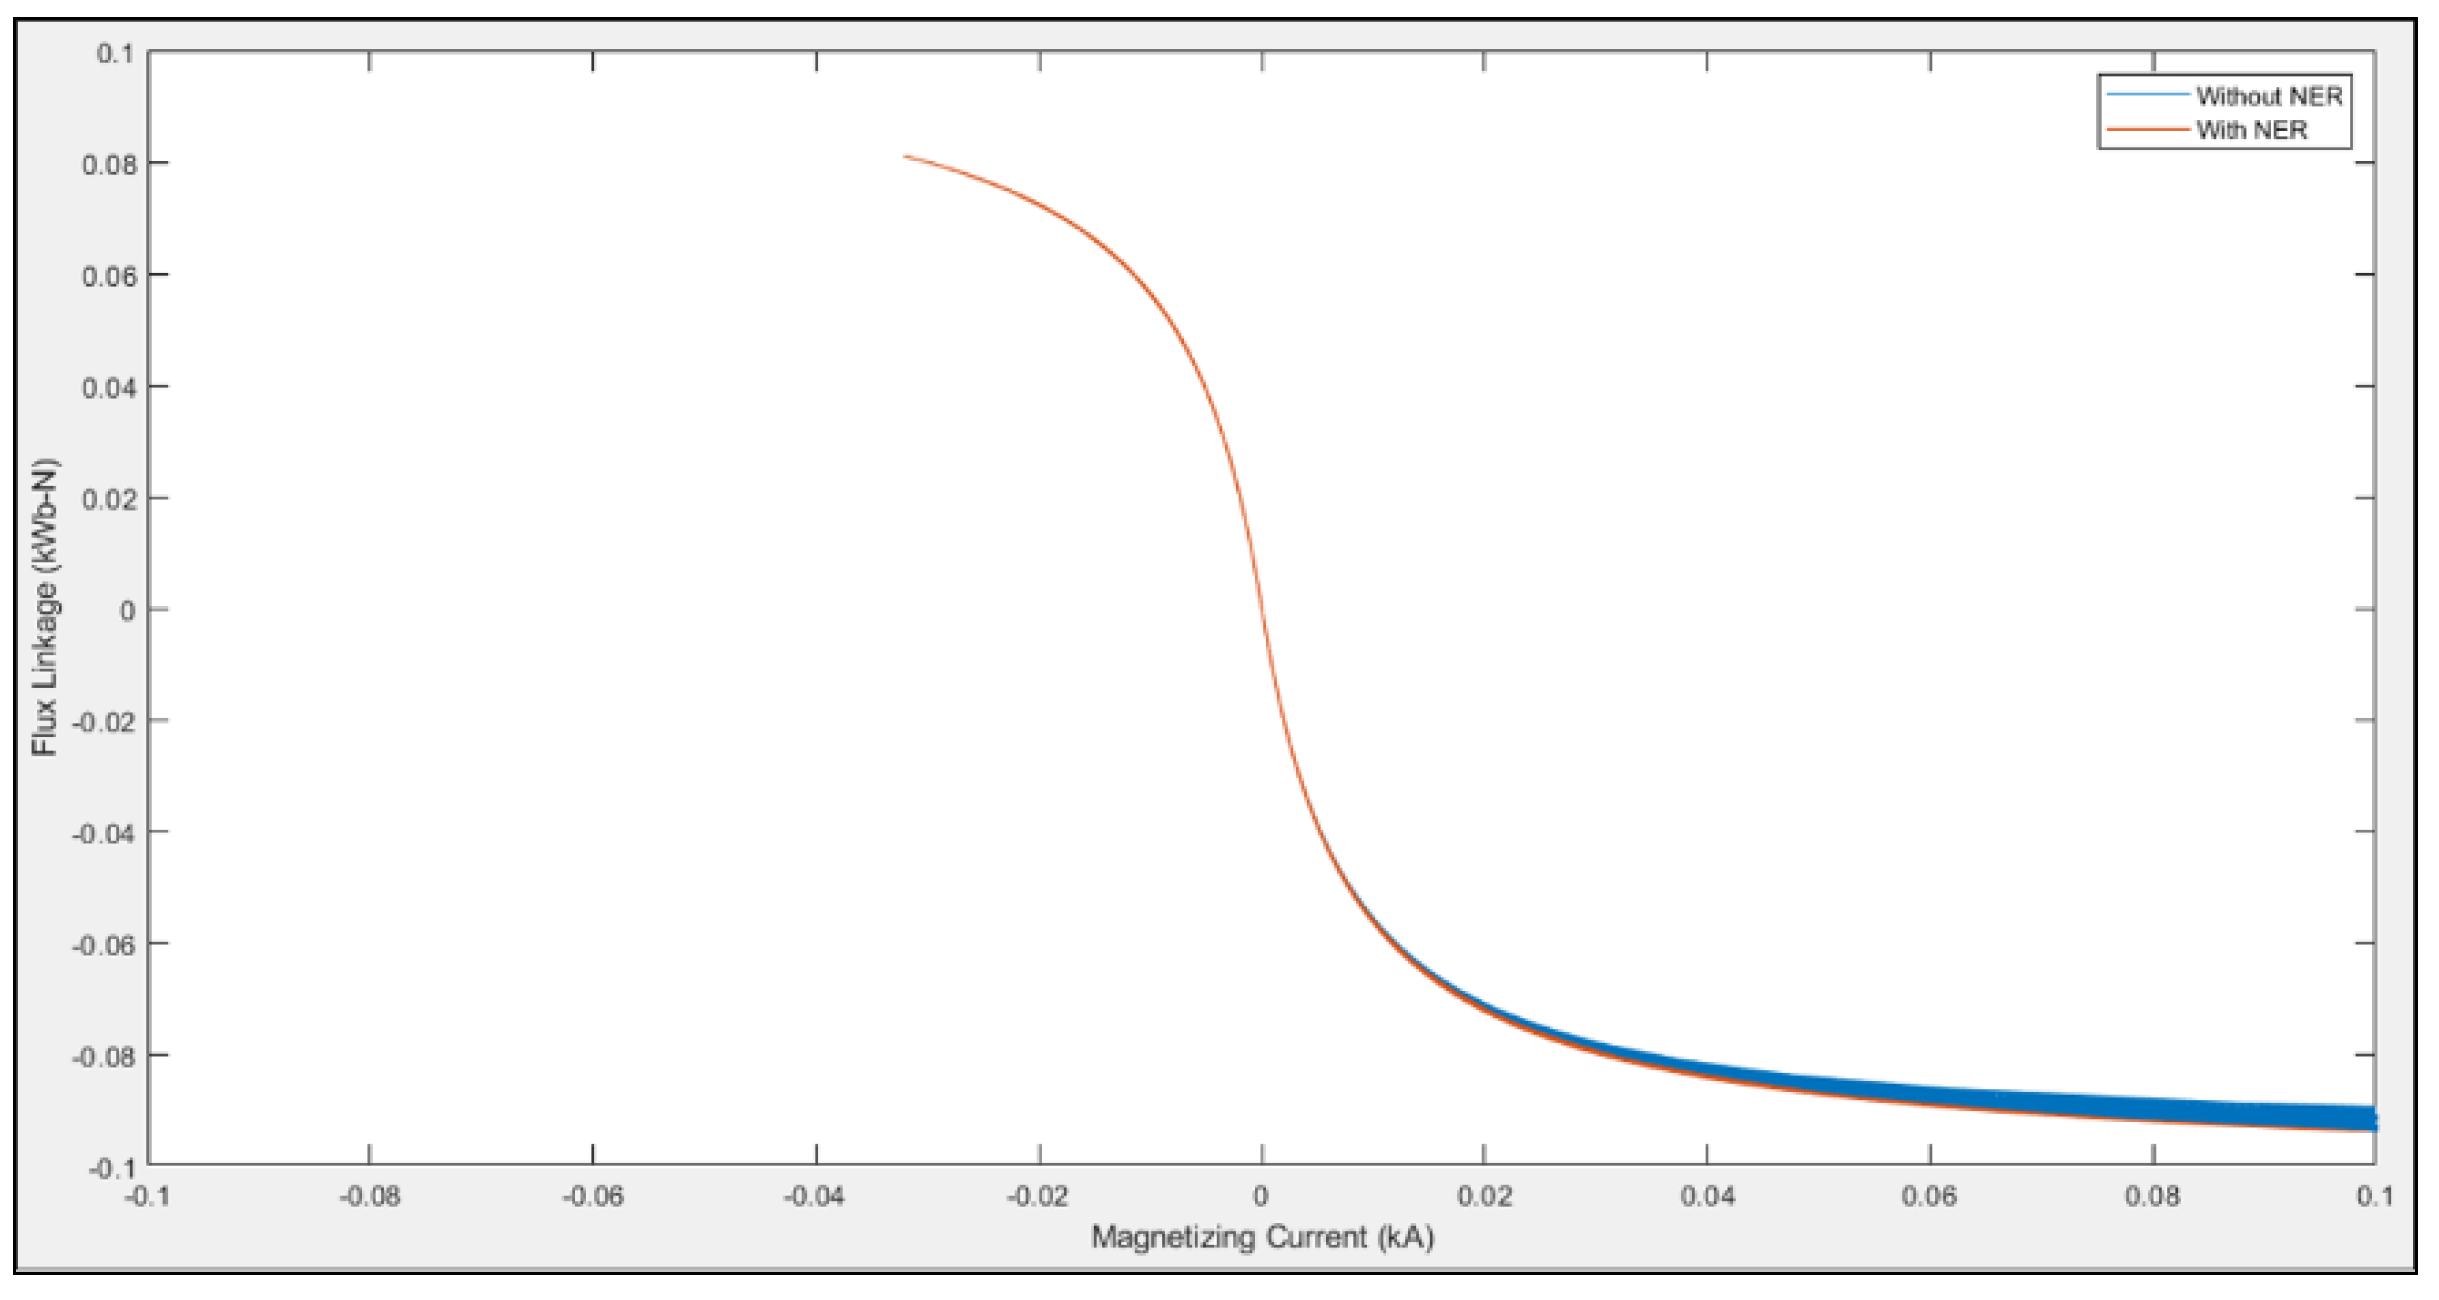
  • Application of an NER as one of the mitigation factors for GIC clearly demonstrated its capability in minimizing, if not eliminating, damage to the power transformer. Results indicate that when an NER of 315.10 Ω was connected to the system, the voltage of the transformer increased to the standard allowable limit and that affected the other parameters observed in the system. Hence, this will improve power system reliability as it is an important aspect of modern technology power supplies.
Overall, for a 275 kV power transformer, results showed that a minimum GIC of 7 A resulted in violating the national grid code regulated by the Energy Commission of Malaysia and having the GIC beyond this value, if prolonged, may lead to system voltage instability. Comparisons and discussions were made to the important publications by CIGRE, IEEE WG and other researchers and were in good agreement, as indicated in the previous section.
Owing to the criticality of GIC impact on the power system, this work is significant due to the fact that all the modeling parameters were based on actual systems and rating. This provides much better perspective for the electrical power utility in revising the specifications required for their equipment and also in providing much better protection schemes, taking into account GIC as another type of disturbance to be considered.

Author Contributions

Conceptualization, A.A.Z. and N.F.A.A.; methodology, A.A.Z.; software, Z.M.; validation, A.A.Z. and M.Z.A.A.K.; formal analysis, A.A.Z.; investigation, A.A.Z.; resources, N.F.A.A.; data curation, A.A.Z.; writing—original draft preparation, A.A.Z.; writing—review and editing, N.F.A.A., M.Z.A.A.K. and H.H; visualization, A.A.Z.; supervision, N.F.A.A., M.Z.A.A.K. and H.H.; project administration, N.F.A.A.; funding acquisition, N.F.A.A. All authors have read and agreed to the published version of the manuscript.

Funding

This research was funded by Ministry of Higher Education (MOHE), grant number 20180112FRGS and UNIVERSITI TENAGA NASIONAL, grant number RJO10517844/061. The APC was funded by UNIVERSITI TENAGA NASIONAL.

Conflicts of Interest

The authors declare no conflict of interest.

References

  1. Zanetti, L.J. Review of North American Electric Reliability Corporation (NERC) Interim Report: Effects of Geomagnetic Disturbances on the Bulk Power System-February. Space Weather 2013, 11, 335–336. [Google Scholar] [CrossRef] [Green Version]
  2. Fulnecek, J.; Mach, V.; Vramba, J. Space weather effects on power grids. In Proceedings of the 2015 16th International Scientific Conference on Electric Power Engineering (EPE), Kouty nad Desnou, Czech Republic, 20–22 May 2015; pp. 499–502. [Google Scholar]
  3. Ngwira, C.M. Geomagnetically Induced Current Characteristics in Southern Africa. Master’s Thesis, Rhodes University, Grahamstown, South Africa, 2008. [Google Scholar]
  4. Matandirotya, E. Measuring Geomagnetically And Induced Modelling Of Currents (GIC) In Power Lines. Ph.D. Thesis, Cape Peninsula University of Technology, Cape Town, South Africa, 2016. [Google Scholar]
  5. Nishiura, R.; Yamashita, S.; Kano, S. Simulation analysis of geomagnetically-induced currents (GIC) effects on shell-form transformers. In Proceedings of the 2013 IEEE Power & Energy Society General Meeting, Vancouver, BC, Canada, 21–25 July 2013; pp. 1–5. [Google Scholar]
  6. Latiff, Z.I.A.; Anuar, N.M.; Jusoh, M.H.; Ab Rahim, S.A.E. Latitudinal Investigation on the Variation of Solar Wind Parameters towards Geomagnetically Induced Currents during 7–8 September 2017 Disturbed Period. In Proceedings of the 2018 IEEE 8th International Conference on System Engineering and Technology (ICSET), Bandung, Indonesia, 15–16 October 2018; pp. 123–127. [Google Scholar]
  7. Ramírez-Niño, J.; Haro-Hernández, C.; Rodriguez-Rodriguez, J.H.; Mijarez, R. Core saturation effects of geomagnetic induced currents in power transformers. J. Appl. Res. Technol. 2016, 14, 87–92. [Google Scholar] [CrossRef]
  8. Abu Hussein, A.; Ali, M.H. Suppression of geomagnetic induced current using controlled ground resistance of transformer. Electr. Power Syst. Res. 2016, 140, 9–19. [Google Scholar] [CrossRef]
  9. Kappenman, J. A perfect storm of planetary proportions. IEEE Spectr. 2012, 49, 26–31. [Google Scholar] [CrossRef]
  10. Ngwira, C.M.; Pulkkinen, A.A.; Bernabeu, E.; Eichner, J.; Viljanen, A.; Crowley, G. Characteristics of extreme geoelectric fields and their possible causes: Localized peak enhancements. Geophys. Res. Lett. 2015, 42, 6916–6921. [Google Scholar] [CrossRef]
  11. Kasran, F.A.M.; Jusoh, M.H.; Rahim, S.A.E.A.; Abdullah, N. Geomagnetically Induced Currents (GICs) in Equatorial Region. In Proceedings of the 2018 IEEE 8th International Conference on System Engineering and Technology (ICSET), Bandung, Indonesia, 15–16 October 2018; pp. 112–117. [Google Scholar]
  12. Koen, J.; Gaunt, C.T. Geomagnetically induced current at mid-latitude. Int. Union Radio Sci. Gen. Assem. Maastricht 2002. Available online: http://citeseerx.ist.psu.edu/viewdoc/download?doi=10.1.1.467.4138&rep=rep1&type=pdf (accessed on 21 June 2020).
  13. Gaunt, C.T.; Coetzee, G. Transformer failures in regions incorrectly considered to have low GIC-risk. In Proceedings of the 2007 IEEE Lausanne Power Tech, Lausanne, Switzerland, 1–5 July 2007; pp. 807–812. [Google Scholar]
  14. Ghoddousi-Fard, R.; Lahaye, F. High latitude ionospheric disturbances: Characterization and effects on GNSS precise point positioning. In Proceedings of the 2015 International Association of Institutes of Navigation World Congress (IAIN), Prague, Czech Republic, 20–23 October 2015; pp. 1–6. [Google Scholar]
  15. Falayi, E.; Ogunmodimu, O.; Bolaji, O.; Ayanda, J.; Ojoniyi, O. Investigation of geomagnetic induced current at high latitude during the storm-time variation. NRIAG J. Astron. Geophys. 2017, 6, 131–140. [Google Scholar] [CrossRef]
  16. Marusek, J. Solar Storm Threat Analysis; Impact: Bloom, IN, USA, 2007; pp. 1–29. Available online: https://www.jumpjet.info/Emergency-Preparedness/Disaster-Mitigation/NBC/EM/Solar_Storm_Threat_Analysis.pdf (accessed on 15 May 2020).
  17. Cliver, E.W.; Svalgaard, L. The 1859 Solar–Terrestrial Disturbance And the Current Limits of Extreme Space Weather Activity. Sol. Phys. 2004, 224, 407–422. [Google Scholar] [CrossRef]
  18. Ngwira, C.M.; Pulkkinen, A.; Mays, M.L.; Kuznetsova, M.M.; Galvin, A.B.; Simunac, K.; Baker, D.N.; Li, X.; Zheng, Y.; Glocer, A. Simulation of the 23 July 2012 extreme space weather event: What if this extremely rare CME was Earth directed? Space Weather 2013, 11, 671–679. [Google Scholar] [CrossRef] [Green Version]
  19. Evans, R.M.; Pulkkinen, A.; Zheng, Y.; Mays, M.L.; Taktakishvili, A.; Kuznetsova, M.M.; Hesse, M. The SCORE Scale: A Coronal Mass Ejection Typification System Based On Speed. Space Weather 2013, 11, 333–334. [Google Scholar] [CrossRef] [Green Version]
  20. Ray, S.; Roy, B.; Paul, K.S.; Goswami, S.; Oikonomou, C.; Haralambous, H.; Chandel, B.; Paul, A. Study of the effect of 17–18 March 2015 geomagnetic storm on the Indian longitudes using GPS and C/NOFS. J. Geophys. Res. Sp. Phys. 2017, 122, 2551–2563. [Google Scholar] [CrossRef]
  21. Pulkkinen, A.; Hesse, M.; Habib, S.; Van Der Zel, L.; Damsky, B.; Policelli, F.; Fugate, D.; Jacobs, W.; Creamer, E. Solar shield: Forecasting and mitigating space weather effects on high-voltage power transmission systems. Nat. Hazards 2009, 53, 333–345. [Google Scholar] [CrossRef]
  22. Overbye, T.J.; Hutchins, T.R.; Shetye, K.; Weber, J.; Dahman, S. Integration of geomagnetic disturbance modeling into the power flow: A methodology for large-scale system studies. In Proceedings of the 2012 North American Power Symposium (NAPS), Champaign, IL, USA, 9–11 September 2012; pp. 1–7. [Google Scholar]
  23. Birchfield, A.B.; Gegner, K.M.; Xu, T.; Shetye, K.S.; Overbye, T.J. Statistical Considerations in the Creation of Realistic Synthetic Power Grids for Geomagnetic Disturbance Studies. IEEE Trans. Power Syst. 2016, 32, 1. [Google Scholar] [CrossRef]
  24. Rodger, C.J.; Mac Manus, D.H.; Dalzell, M.; Thomson, A.W.P.; Clarke, E.; Petersen, T.; Clilverd, M.A.; Divett, T. Long-Term Geomagnetically Induced Current Observations From New Zealand: Peak Current Estimates for Extreme Geomagnetic Storms. Space Weather 2017, 15, 1447–1460. [Google Scholar] [CrossRef] [Green Version]
  25. Matandirotya, E.; Cilliers, P.J.; Van Zyl, R.; Oyedokun, D.T.; Villiers, J. Differential magnetometer method applied to measurement of geomagnetically induced currents in Southern African power networks. Space Weather 2016, 14, 221–232. [Google Scholar] [CrossRef] [Green Version]
  26. Barbosa, C.D.S.; Hartmann, G.A.; Pinheiro, K.J. Numerical modeling of geomagnetically induced currents in a Brazilian transmission line. Adv. Space Res. 2015, 55, 1168–1179. [Google Scholar] [CrossRef]
  27. Gope, G.; Dax, K.; Reju, S.A.; Cilliers, P. Geomagnetically induced current model for the Namibian High Voltage Network. In Proceedings of the AFRICON 2015, Addis Ababa, Ethiopia, 14–17 September 2015; pp. 1–7. [Google Scholar]
  28. Zois, I.P. Solar activity and transformer failures in the Greek national electric grid. J. Space Weather Space Clim. 2013, 3, A32. [Google Scholar] [CrossRef] [Green Version]
  29. Marshall, R.A.; Smith, E.A.; Francis, M.J.; Waters, C.L.; Sciffer, M.D. A preliminary risk assessment of the Australian region power network to space weather. Space Weather 2011, 9, 1–18. [Google Scholar] [CrossRef] [Green Version]
  30. Watari, S. Estimation of geomagnetically induced currents based on the measurement data of a transformer in a Japanese power network and geoelectric field observations. Earth Planets Space 2015, 67, 77. [Google Scholar] [CrossRef]
  31. Myllys, M.; Viljanen, A.; Rui, Ø.A.; Ohnstad, T.M. Geomagnetically induced currents in Norway: The northernmost high-voltage power grid in the world. J. Space Weather Space Clim. 2014, 4. [Google Scholar] [CrossRef] [Green Version]
  32. Caraballo, R.; Bettucci, L.S.; Tancredi, G. Geomagnetically induced currents in the Uruguayan high-voltage power grid. Geophys. J. Int. 2013, 195, 844–853. [Google Scholar] [CrossRef]
  33. Zhang, J.J.; Wang, C.; Sun, T.; Liu, C.M.; Wang, K.R. GIC due to storm sudden commencement in low-latitude high-voltage power network in China: Observation and simulation. Space Weather 2015, 13, 643–655. [Google Scholar] [CrossRef] [Green Version]
  34. Ngwira, C.M.; Pulkkinen, A.; Wilder, F.D.; Crowley, G. Extended study of extreme geoelectric field event scenarios for geomagnetically induced current applications. Space Weather 2013, 11, 121–131. [Google Scholar] [CrossRef]
  35. Carter, B.A.; Yizengaw, E.; Pradipta, R.; Weygand, J.M.; Piersanti, M.; Pulkkinen, A.; Moldwin, M.B.; Norman, R.; Zhang, K. Geomagnetically induced currents around the world during the 17 March 2015 storm. J. Geophys. Res. Space Phys. 2016, 121, 10–496. [Google Scholar] [CrossRef]
  36. Ngwira, C.M.; Pulkkinen, A.; McKinnell, L.-A.; Cilliers, P.J. Improved modeling of geomagnetically induced currents in the South African power network. Space Weather 2008, 6, 1–8. [Google Scholar] [CrossRef]
  37. Carter, B.A.; Yizengaw, E.; Pradipta, R.; Halford, A.J.; Norman, R.; Zhang, K. Interplanetary shocks and the resulting geomagnetically induced currents at the equator. Geophys. Res. Lett. 2015, 42, 6554–6559. [Google Scholar] [CrossRef]
  38. Adebesin, B.O.; Pulkkinen, A.; Ngwira, C.M. The interplanetary and magnetospheric causes of extreme dB/dt at equatorial locations. Geophys. Res. Lett. 2016, 43, 11–501. [Google Scholar] [CrossRef]
  39. Thomson, A.W.; Gaunt, C.; Cilliers, P.; Wild, J.A.; Opperman, B.; McKinnell, L.-A.; Kotzé, P.; Ngwira, C.; Lotz, S. Present day challenges in understanding the geomagnetic hazard to national power grids. Adv. Space Res. 2010, 45, 1182–1190. [Google Scholar] [CrossRef] [Green Version]
  40. Alias, M.Z.M.; Homam, M.J.; Noh, F.H.M. Review on solar disturbance studies and electric power transmission line fault in Malaysia. Indones. J. Electr. Eng. Comput. Sci. 2020, 17, 118–125. [Google Scholar] [CrossRef]
  41. Barbosa, C.; Alves, L.R.; Caraballo, R.; Hartmann, G.; Papa, A.R.; Pirjola, R.J. Analysis of geomagnetically induced currents at a low-latitude region over the solar cycles 23 and 24: Comparison between measurements and calculations. J. Space Weather Space Clim. 2015, 5, A35. [Google Scholar] [CrossRef]
  42. Ibrahim, S.N.; Jusoh, M.H.; Sulaiman, A.A.; Ahmad, S.N.; Makmud, M.Z.; Musta, B.; Abdullah, M.; Asillam, M.F.; Bhoo, N.; Pathy, M.H.; et al. First geomagnetic observation at sabah, Malaysia by using MAGDAS array. Int. J. Simul. Syst. Sci. Technol. 2017, 17, 30.1–30.8. [Google Scholar]
  43. Umar, R.; Natasha, S.F.; Aminah, S.S.N.; Juhari, K.N.; Jusoh, M.H.; Hamid, N.S.A.; Hashim, M.H.; Radzi, Z.M.; Ishak, A.N.; Hazmin, S.N.; et al. Magnetic Data Acquisition System (MAGDAS) Malaysia: Installation and preliminary data analysis at ESERI, UNISZA. Indian J. Phys. 2018, 93, 553–564. [Google Scholar] [CrossRef]
  44. Chulliat, A.; Macmillan, S.; Alken, P.; Beggan, C.; Nair, M.; Hamilton, B.; Woods, A.; Ridley, V.; Maus, S.; Thomson, A. The US/UK World Magnetic for 2015–2020. 2015. Available online: http://www.geomag.bgs.ac.uk/documents/WMM2015_Report.pdf (accessed on 2 May 2019).
  45. Kasztenny, B.; Taylor, D.; Fischer, N. Impact of Geomagnetically Induced Currents on Protection Current Transformers. In Proceedings of the 13th International Conference on Developments in Power System Protection, Edinburgh, UK, 7 March 2016; pp. 218–222. [Google Scholar]
  46. Zheng, K.; Pirjola, R.J.; Boteler, D.H.; Liu, L.-G. Geoelectric Fields Due to Small-Scale and Large-Scale Source Currents. IEEE Trans. Power Deliv. 2012, 28, 442–449. [Google Scholar] [CrossRef]
  47. Fan, R.; Liu, Y.; Umana, A.; Tan, Z.; Sun, L.; An, Y. The impact of solar storms on protective relays for saturable-core transformers. IEEE Power Energy Soc. Gen. Meet. 2017, 1–5. [Google Scholar] [CrossRef]
  48. IEEE. IEEE Guide for Establishing Power Transformer Capability while under Geomagnetic Disturbances. IEEE Stand. 2015, C57. [Google Scholar] [CrossRef]
  49. Berge, J.; Varma, R.K.; Marti, L. Laboratory validation of the relationship between Geomagnetically Induced Current (GIC) and transformer absorbed reactive power. In Proceedings of the 2009 IEEE Electrical Power & Energy Conference (EPEC), Winnipeg, MB, Canada, 3–5 October 2011; Volume 9, pp. 491–495. [Google Scholar]
  50. Boteler, D.H.; Bradley, E. On the Interaction of Power Transformers and Geomagnetically Induced Currents. IEEE Trans. Power Deliv. 2016, 31, 1. [Google Scholar] [CrossRef]
  51. Zheng, T.; Chen, P.; Lü, T.; Jin, Y.; Liu, L. Effects of Geomagnetically Induced Currents on current transformer and differential protection. In Proceedings of the 2013 IEEE Power & Energy Society General Meeting, Vancouver, BC, Canada, 21–25 July 2013; pp. 1–5. [Google Scholar]
  52. Girgis, R.; Vedante, K.; Gramm, K. Effects of Geomagnetically Induced Currents on Power Transformers and Power Systems. In Proceedings of the Cigre PES T&D 2012, Orlando, FL, USA, 7–10 May 2012; pp. A2–A304. [Google Scholar]
  53. Rajapakse, A.; Perera, N.; Faxvog, F.R.; Jensen, W.; Nordling, G.; Fuchs, G.; Jackson, D.B.; Volkmann, T.L.; Ruehl, N.; Groh, B. Power grid stability protection against GIC using a capacitive grounding circuit. In Proceedings of the PES T&D, Orlando, FL, USA, 7–10 May 2012; pp. 1–6. [Google Scholar]
  54. Ma, X.L.; Wen, J.; Liu, L.G.; Wang, J.; Wang, C. Simulation study on converter transformer saturation characteristics due to GIC. In Proceedings of the 2010 China International Conference on Electricity Distribution, Nanjing, China, 13–16 September 2010; pp. 1–6. [Google Scholar]
  55. Yagoub, M.A.; Tao, Z. Modeling & Mitigation of Geomagnetically Induced Currents (GICs) for Single-Phase Power Transformer. In Proceedings of the 2018 International Conference on Computer, Control, Electrical, and Electronics Engineering (ICCCEEE), Khartoum, Sudan, 12–14 August 2018; pp. 1–6. [Google Scholar]
  56. Gérin-Lajoie, L.; Mahseredjan, J.; Guillon, S.; Saad, O. Simulation of voltage collapse caused by GMDs—Problems and solutions. In Proceedings of the CIGRE Session 45—45th International Conference on Large High Voltage Electric Systems, Paris, France, 24–29 August 2014; pp. 1–10. [Google Scholar]
  57. Zirka, S.; Moroz, Y.; Elovaara, J.; Lahtinen, M.; Walling, R.; Høidalen, H.; Bonmann, D.; Arturi, C.; Chiesa, N. Simplified models of three-phase, five-limb transformer for studying GIC effects. Int. J. Electr. Power Energy Syst. 2018, 103, 168–175. [Google Scholar] [CrossRef]
  58. Oyedokun, D.T. Geomagnetically Induced Currents (GIC) In Large Power Systems Including Transformer Time Response. Ph.D. Thesis, Cape Town University, Cape Town, South Africa, 2015. [Google Scholar]
  59. Muller, C. Applications of PSCAD/EMTDC; Manitoba HVDC Research Centre: Winnipeg, MB, Canada, 2008; pp. 41–49. [Google Scholar]
  60. Energy Commission. Grid Code For. Peninsular Malaysia; Energy Commission: Putrajaya, Malaysia, 2016.
  61. Radasky, W.A. Overview of the impact of intense geomagnetic storms on the U.S. high voltage power grid. In Proceedings of the 2011 IEEE International Symposium on Electromagnetic Compatibility, Long Beach, CA, USA, 14–19 August 2011; pp. 300–305. [Google Scholar] [CrossRef]
  62. Kappenman, J. Geomagnetic Storms and Their Impacts on the U.S. Power Grid; Metatech: Goleta, CA, USA, 2010; pp. 1–196. [Google Scholar]
  63. Vijapurapu, S.K. Contingency Analysis of Power Systems in Presence of Geomagnetically Induced Currents. Master’s Thesis, UKnowledge University, Lexington, KY, USA, 2013. [Google Scholar]
  64. Berge, J.E. Impact of Geomagnetically Induced Currents on Power Transformers. Ph.D. Thesis, Faculty of Engineering, Western University, London, ON, Canada, 2011. [Google Scholar]
  65. CIGRE WG C4.32. Understanding of geomagnetic storm environment for high voltage power grids. CIGRE Tech. Broch. 2019, 780, 1–147. [Google Scholar]
  66. Mousavi, S.A. Electromagnetic Modelling of Power Transformers for Study and Mitigation of Effects of GICs. Ph.D. Thesis, KTH Royal Institute of Technology, Stockholm, Sweden, 2015. [Google Scholar]
  67. IEEE Power & Energy Society. Geomagnetic disturbances (GMD) impacts on protection systems, PES TR72. In Proceedings of the IEEE Power & Energy Society General Meeting 2019, Atlanta, GA, USA, 4–8 August 2019; pp. 1–47. [Google Scholar]
Figure 1. Overview on the impact of GIC on transformer [13].
Sustainability 12 09225 g001
Figure 2. Waveform of GIC.
Sustainability 12 09225 g002
Figure 3. Developed model of GIC using PSCAD.
Sustainability 12 09225 g003
Figure 4. Schematic diagram of the 275 kV subpower system network.
Sustainability 12 09225 g004
Figure 5. Instantaneous voltage under steady state condition.
Sustainability 12 09225 g005
Figure 6. Current under steady state condition.
Sustainability 12 09225 g006
Figure 7. Active power under steady state condition.
Sustainability 12 09225 g007
Figure 8. Reactive power under steady state condition.
Sustainability 12 09225 g008
Figure 9. Hysteresis curve under steady state condition.
Sustainability 12 09225 g009
Figure 10. Graph of GIC vs. voltage level at T5.
Sustainability 12 09225 g010
Figure 11. Hysteresis curve for T5.
Sustainability 12 09225 g011
Figure 12. Magnetizing current for T5.
Sustainability 12 09225 g012
Figure 13. Flux linkage for T5.
Sustainability 12 09225 g013
Figure 14. Active power for T5.
Sustainability 12 09225 g014
Figure 15. Reactive power for T5.
Sustainability 12 09225 g015
Figure 16. Hysteresis curve for T5.
Sustainability 12 09225 g016
Figure 17. Flux linkage for T5.
Sustainability 12 09225 g017
Figure 18. Magnetizing current for T5.
Sustainability 12 09225 g018
Figure 19. Active power for T5.
Sustainability 12 09225 g019
Figure 20. Reactive power for T5.
Sustainability 12 09225 g020
Figure 21. Hysteresis curve for T5.
Sustainability 12 09225 g021
Figure 22. Flux linkage for T5.
Sustainability 12 09225 g022
Figure 23. Magnetizing current for T5.
Sustainability 12 09225 g023
Figure 24. Active power for T5.
Sustainability 12 09225 g024
Figure 25. Reactive power for T5.
Sustainability 12 09225 g025
Table 1. Past event on space weather activity.
Past EventsYearEffects on the Power Grid
The Carrington Event [11,12,13,14]1859Largest reported geomagnetic disturbance.
Telegraph operations in North America were disrupted.
The Halloween Solar Storm [15,16]2003Geomagnetic Induced Current (GIC) with high magnitude of 330 A led to a large-scale blackout
Harmonics caused 130 kV line to disconnect.
IP Shock [17,18]2012Very high solar wind speeds up to 2000 km/s were very rare.
Power systems could have been exposed to large scale GIC.
St. Patrick’s Day storm [19,20]2015Largest storm in more than 15 years.
Planetary Index (Kp) reached 8 out of 9.
Efficiency of the GPS receivers was impaired and gave inaccurate measurements.
Table 2. Summary of GIC studies in others countries.
NoAuthorsCountryGIC Research Area
1.Rodger et al.New Zealand [24]Analyzed the impact of severe storms as a threat to the New Zealand power system.
2.Matandirotya et al.South Africa [25]Using differential magnetometer method (DMM) to predict GIC in a transmission line.
3.Hartmann et al.Brazil [26]Use the theory of plane wave and a one-dimensional electrical resistivity model of the area.
4.Gope et al.Namibia [27]The model was tested using EPRI OpenDSS (Open Distribution Simulation Software).
5.Zois et al.Greece [28]Test performed on a large transformer which was 150 kV and 400 kV for the impacts of solar activity.
6.Marshall et.alAustralia [29]Australian magnetometer data indicated that a moderate risk was identified only in the southern Australian region.
7.Watari et al.Japan [30]The probabilities of extremely large GIC values seemed to be low.
8.Myllys et al.Norway [31].The model was for an expected future grid in 2030. The main results obtained will still be valid in the future.
9.Caraballo et al.Uruguay [32]A plane wave approach combined with a ground conductivity model was used to measure GIC.
Table 3. Locations of magnetometer in Malaysia [42,43,44].
LocationsAreaGeographic CoordinateGeomagnetic Coordinate
Langkawi National Observatory, LangkawiNorth Malaysia(6.30°, 99.78°)(−3.30°, 172.44°)
Universiti Malaysia Sabah, SabahBorneo Island(6.02°, 116.07°)(−3.56°, 188.66°)
Universiti Penguruan Sultan Idris, PerakNorth Malaysia(3.72°, 101.53°)(−5.92°, 174.14°)
Agensi Angkasa Negara ANGKASA, BantingSouth Malaysia(2.78°, 101.53°)(−6.86°, 174.10°)
Universiti Teknologi MARA, JohorSouth Malaysia(1.53°, 103.87°)(−7.99°, 176.79°)
Universiti Sultan Zainal Abidin (UnisZa), TerengganuEast Coast Malaysia(5.23°, 103.04°)(−4.21°, 175.91°)
Table 4. Summary of the impacts of GIC on Transformer.
Author (s)MethodsAdvantagesDisadvantagesFindings
David Boteler et al. [50]Step-by-step methodVersatile and fast method for modeling the effect of transformer inductance on GIC.Not suitable to apply at other parts of transformer.Step by step method provides a fast method to model the transformer interaction with GIC.
Tao Zheng et al. [51]Power System Computer Aided Design (PSCAD
/EMTDC)
Easy to find literature exampleLimited model to designIt indicates the different effects of GIC on current transformer transfer characteristic and transformer differential protection.
Vedante et al. [52]PSCAD
/EMTDC
Used actual measurementsShould have added more results as they used actual measurementSystem instability is the main impact of GIC because of high levels of reactive power.
A. D. Rajapakse [53]Electromagnetic Transients Program (EMTP-RV)Simple and easy to implement.Does not compared the results with previous researchers.Results show that the use of the capacitor in the grounding circuit can prevent GIC flowing into the system.
X. Ma et al. [54]PSCAD/
EMTDC
Easy to find literature example Limited model to designDC bias due to GIC affecting the safe operations of the converter transformer.
J. Ramirez et al. [7]MATLAB SimulinkEasy to understand and find suitable modelLimited to generate more resultsBy simulating GIC using a reduced scale transformer, it is possible to provide insight into the impact of parameters including magnetic flux, voltage, and power.
M. Yaqoub et al. [55]MATLAB SimulinkEasy to understand and find suitable modelLimited to generate more results It indicates that the capacitor can eliminate and reduce GIC in the power system especially in the transformer.
L. Gerin et al. [56]EMTP-RVCapable of handling complex designFewer literature examplesIt concludes that the installation of shunt capacitors can avoid voltage collapse and perform better compared to series compensation.
Zirka et al. [57]EMTP-RVSimple and easy to implement.Did not compared the results with previous researchers.It shows the importance of incorporating network representation and eliminate those assumptions about the influence of the hysteresis properties.
Table 5. Monitored Active Power, Reactive Power and Voltage under Steady State Conditions at Substation A.
Substation A
L1T1T2T3T4T5T6T7
P (MW)4.2333.1030.7790.7790.7790.7792.1222.122
Q (MVAR)0.0000.7430.1600.1600.1600.1600.5510.555
V (kV)31.340100.000273.100273.100273.100273.100130.200130.200
Table 6. Comparison between Steady State, without neutral earthing resistor (NER) and with NER for Long Time Condition and High Magnitude of GIC at T5.
STEADY STATE L1T1T2T3T4T5T6T7
Substation AP (MW)4.2333.1030.7790.7790.7790.7792.1222.122
Q (Mvar)0.0000.7430.1600.1600.1600.1600.5510.555
V (kV)31.340100.00273.100273.100273.100273.100130.200130.200
WITHOUT NER L1T1T2T3T4T5T6T7
Substation AP (MW)3.8902.7010.4400.4400.4400.4401.9671.967
Q (Mvar)0.0008.9800.1900.1900.1900.1900.8110.811
V (kV)30.220100.000250.000250.000250.000250.000122.100122.100
WITH NER L1T1T2T3T4T5T6T7
Substation A P (MW)3.9712.7860.7590.7590.7590.7591.9861.986
Q (Mvar)0.0007.5780.1800.1800.1800.1800.5170.517
V (kV)30.360100.000265.100265.100265.100265.100125.700125.700
Publisher’s Note: MDPI stays neutral with regard to jurisdictional claims in published maps and institutional affiliations.

