Abstract
Land use/land cover (LULC) change widely occurs during urbanization and can affect the functionality of soil ecosystems by altering soil physicochemical properties. However, few studies have evaluated the impacts of LULC change on soils in arid regions. This study investigates LULC change patterns during 2010–2017 in Lanzhou New Area, China based on remotely sensed data (Chinese GaoFen-1 and Advanced Land Observing Satellite). We identified five main land use change types and reference native grassland and farmland to determine soil properties at different depths. Principal component analysis and scatter matrix were employed to evaluate the effect of LULC change on soil properties. The results showed that LULC changes that occurred in Lanzhou New Area were characterized by the rapid growth of construction and bare land (increased by 13.06% and 5.97%, respectively) at the expense of farmland (decreased by 25.38%). The conversion of native grassland to artificial grassland and bare land, and farmland to bare land had similar effects on soil properties; i.e., a significant decline and a lower level in total nitrogen and soil organic carbon. The farmland to construction land transition deteriorated soil nutrients and increased soil compaction by both increasing bulk density (BD, mean = 1.63 g cm−3) and enhancing sand content by 69.21%. All land use change types increased BD and decreased soil water content and saturated soil water content when compared to the reference areas. These results indicate that changes in LULC have significant impacts on soil physicochemical properties. Thus, it is essential to optimize land planning and improve soil quality in arid ecosystems to ensure sustainable resource management and ecosystem conservation.
1. Introduction
Land use/land cover (LULC) changes are mostly induced by human activities and driven by socioeconomic and environmental conditions. LULC changes extensively occur during agricultural activities (e.g., deforestation for agricultural expansion and land management) [1,2,3], resource mining activities [4,5], and urbanization [6,7]. As a crucial driver of environmental change, LULC changes can contribute to climate change, soil erosion, and biodiversity loss by altering the carbon cycle and soil quality [8,9,10,11,12], and thus can affect soil functionality and deteriorate ecosystem services [13]. Given the importance of soil in regulating runoff, biomass productivity, carbon storage, and biodiversity maintenance, it is essential to monitor changes in LULC and evaluate their impacts on soil properties.
The variations in soil properties associated with land use change depend on the land use purpose, land management, climatic conditions, and intrinsic characteristics of the soil [14,15,16]. Land use for cultivation or construction along with the removal of native vegetation and disturbance of soil profile may lead to soil degradation [11]. The conversion of native vegetation to cropland can decrease soil nutrient and organic carbon levels [17] while increasing bulk density (BD) [15,18] and the sand fraction [1]. Moreover, soil genetic horizons in urban areas are greatly altered leading to soil sealing and soil organic carbon (SOC) loss [19,20]. On the contrary, urban soils are considered as carbon sinks by Weissert et al. [21]. Human management practices, such as long-term irrigation, can increase soil carbon and nitrogen content and improve soil quality [22]. In addition, farmland abandonment can increase soil carbon and nitrogen sequestration [23].
Nevertheless, in arid areas, the changes in the soil organic carbon and nutrient contents due to the shift from farmland to abandoned land are mostly determined by soil and climate conditions [14]. Evans and Belnap [24] showed that arid ecosystems experience loss of soil nutrients due to land use changes. As a result, soil quality deteriorates and soil becomes ecologically vulnerable can cause soil degradation [25], weakening its resistance to erosion [12,26,27]. Jeong and Dorn [28] observed that LULC changes related to urbanization, in an area with a desert climate, accelerated soil erosion. The effects of LULC changes (e.g., from forests or natural grasslands to cropland and pasture) on the soil carbon and other nutrients are well documented [1,29]. In addition, studies mostly focused on urban pollution characteristics and their related soil properties, such as SOC, pH, and soil nitrogen, after land use change [30,31]. However, urban has been viewed as the highly disturbed ecosystem, and the responses of soil properties to these extreme disturbances in the arid region remain unknown. To understand the drastic LULC changes and their effects on ecosystems, further investigation is required to explore the extent to which LULC changes affect soil properties in arid environments. Increasing our knowledge of these effects is essential for optimizing land utilization and soil conservation and for minimizing land degradation, particularly in fragile ecosystems.
Located in an arid desert region of Northwest China, the Lanzhou New Area, which was established in 2012, has experienced intensive LULC changes due to rapid urbanization in recent years, providing a unique case study opportunity to assess the impacts on soil structure and soil nutrients during early-stage urbanization in an arid environment. A large area of farmland was turned into abandoned land and construction land. Moreover, a significant amount of native vegetation was removed, and soil profiles and genetic horizons have been greatly altered by intensive human disturbance. Basins, hills, and gullies are the basic geomorphic landforms of the study area. However, hilly areas have been leveled by moving upper soil layers to form flat terrain [32] that is conducive to urban construction. In addition, improper land management practices have increased the risk of soil erosion by altering the physicochemical properties of the soil. Vegetation restoration is hampered by limited resources, such as water and soil nutrients, that restrict plant growth. Soil is the most important resource to support biomass productivity and environmental purification. The local government aims to achieve eco-urban construction that emphasizes the importance of the ecological environment in an urban ecosystem; to meet this goal, both ecosystem conservation and social-economic development should be taken into account in a sustainable manner [13]. Actions and policies should be developed to sustain soil function and enhance soil quality. However, there are no data available on historical LULC changes and soil properties of the study area.
We present 2010 (past) and 2017 (near-present) maps to better understand LULC changes in the Lanzhou New Area during urbanization. We hypothesize that intensive LULC changes have led to significant differences in soil physicochemical properties, such as BD, SOC, total nitrogen (TN), total phosphorous (TP), soil water content (SWC), soil saturated water content (SSWC) and sand, silt, and clay content, among different land use change types. This study aims to (1) detect spatial patterns of LULC in 2010 and 2017, (2) identify the impact of rapid and intensive LULC changes on soil properties in the upper 30 cm of soil in an arid-desert region, and (3) quantify variations in soil properties for different LULC change types.
2. Materials and Methods
2.1. Study Area
The Lanzhou New Area (36°17′9″–36°43′30″ N and 103°29′20″–103°50′45″ E), the fifth National New Area, is located on the northwest Longzhong Loess Plateau, Gansu Province, China (Figure 1). The region is a typical inland basin with poor soil due to water and wind erosion. Irrigated agriculture has been developed in this area since the completion of “Lead into the Qin Engineering” in 1994 [32]. Before urbanization, the largest LULC type was farmland, followed by native grassland. Drastic changes in LULC occurred when the Lanzhou New Area was established in 2012 with a total planned area of 806 km2; there were 57,989 inhabitants in the urban area in 2017.
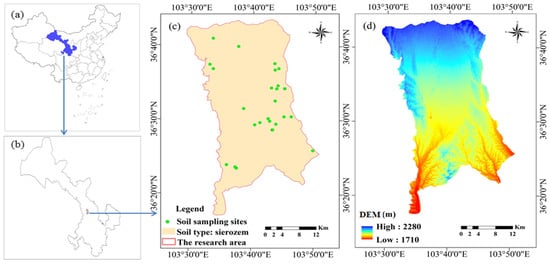
Figure 1.
Location of the research area (Gansu province of China (a), the research area (b), soil sampling sites (c), and digital elevation model (DEM) (d)).
Characterized by a typically arid continental monsoon climate, the mean annual temperature in the region is approximately 5.9 °C and the mean annual precipitation is 266 mm; most of the rainfall occurs from June to September, causing severe soil erosion. Annual evaporation ranges from 1880 to 2000 mm, while the average relative humidity is 56%. The elevation from south to north is in the range 1710–2280 m above sea level and the slope of the ground surface ranges from 1/80 to 1/100.
The landscape is a flat alluvial plain surrounded by low loess hills. The main soil type is sierozem, which is mainly sandy loam with a depth of 1–4 m. The dominant vegetation types are artificial forest, and arid and desert steppe [33]. The main crops are wheat and maize, whose cultivation is mainly distributed within the central basin. During urbanization, farmlands were abandoned and turned into grassland.
2.2. Remote Sensing Data
2.2.1. Pre-Processing of Remote Sensing Images
The spatial and temporal dynamics of different LULC classifications were investigated using high-resolution remote sensing images and the related auxiliary data. The pan-sharpened images included Chinese Gaofen (GF)-1 data for 31 July 2017, (resolution of 2 m) and Advanced Land-Observing Satellite (ALOS) data for 1 September 2010 (resolution of 2.5 m). The related auxiliary data included a digital elevation model (DEM), topographic maps, vector boundary data, and land use plans for the Lanzhou New Area (2015–2030).
Remote sensing image processing included radiometric correction, atmospheric correction, and geometric correction. Images were resampled into a pixel size of 2.5 × 2.5 using the nearest neighbor method. Then, images for 2010 and 2017 were set to the same Albers projection (Albers equivalent conical projection, central meridian of 105° E, double standard parallels of 25° N and 47° N). All images were corrected to the Xian_1980_3_Degree_GK_CM_35E coordinate system (Xi’an, China) before further analysis. The image from 2010 was rectified using the image from 2017.
2.2.2. Classification of LULC type
Based on the main LULC types in the study area, six classes were considered for the land use classification system (Table 1): forest (FT), grassland (GL), farmland (FL), water area (WA), bare land (BL), and construction land (CL). Land use in the Lanzhou New Area was classified through visual interpretation in ArcGIS 10.2. To validate land classifications for 2010 and 2017 based on the field survey and high-resolution images, the kappa coefficient K representing the interpretation accuracy was calculated, according to [34], as follows:
where N refers to the total number of samples, and Ppi and Pli refer to the total number of samples of LULC types in the row and rank, respectively.

Table 1.
The land use/land cover (LULC) classification system.
2.2.3. Analysis of Land Use Change
Variations in the area of land use (), single land use dynamic degree (R1), and land use transition matrix model (Sij) were used to analyze LULC changes due to urbanization as follows:
where Al and Ap refer to the sum of a certain LULC type converted to another and sum of other LULC types converted to a certain type in the study area, respectively; R1 is the change rate and change range of the LULC type in the study area during a certain period of time; T is the study duration (T = 7 years); Ua and Ub are the number of LULC types at the beginning and end of the study period, respectively; S refers to the area; and i and j are the LULC types before and after the transition, respectively (i = 1, 2, 3, ..., m and j = 1, 2, 3, ..., n) [35].
2.3. Soil Sampling and Analysis
Considering the differences in land management practices and human influences in the study area, grasslands were further divided into three categories: native grassland, artificial grassland, and abandoned land. Then, five main LULC change types were identified based on the LULC change patterns, including the conversion from native grassland to artificial grassland and bare land, and from farmland to bare land, abandoned land, and construction land. To compare the impacts of these LULC change types on soil properties, unchanged farmland and native grassland were selected as reference areas, the photographs of LULC change types are shown in Figure 2.
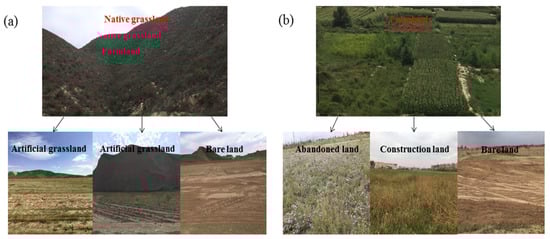
Figure 2.
Land use/land cover types changed from native grassland in Lanzhou New Area during urbanization (a), Land use/land cover types changed from farmland (b).
A total of 30 sites (15 converted types and 15 unconverted farmland and native grassland site) were sampled across the Lanzhou New Area. We collected disturbed soil samples from the 0–10, 10–20, and 20–30 cm soil layers to measure SOC, TN, TP, SWC, and sand, silt, and clay content. In addition, undisturbed soil cores were collected with core rings to determine the SSWC and BD. At each sampling site, at least five soil samples from each soil depth were collected and mixed to form a pooled sample. Geographic coordinates of all sampling sites were recorded using a Global Positioning System (GPS) receiver with 5.0-m precision. Sampling sites are shown in Figure 1c.
Soil samples were collected, transported to the laboratory, air dried, and passed through 1.0 mm and 0.25 mm sieves before physical and chemical analyses. The particle size distribution was measured using the wet sieving method, and the SOC, TN, and TP contents were measured using the potassium dichromate external heating method, micro-Kjeldahl method [36], and sulfuric acid–perchloric acid heating digestion method [37], respectively. SWC was determined gravimetrically, by weight loss during oven drying at 105 °C for 24 h [38] and BD for each core sample was determined from the volume–dry mass relationship [39]. SSWC was measured by quantifying the water loss from saturated soil samples; soil samples were first dried in an oven at 105 °C (>24 h) until at a constant weight, and then the mass of the lost water was calculated.
2.4. Statistical Analysis
One-way analysis of variance and the least significant difference (LSD) method were used to test differences in the variation in soil properties among different land use change types compared to reference areas. A biplot of principal component analysis (PCA) and a scatter matrix were constructed in R (packages of ggplot2) to estimate the effects of land use change types on soil properties. Statistical analysis was performed in Excel (2010) and SPSS 24. ArcGIS software (ESRI®ArcMapTM10.2) was used for classifying and mapping spatial patterns and locations of sampling sites.
3. Results and Discussion
3.1. Classification Accuracy and Land Use/Land Cover Changes
Figure 3a,b show classified maps of LULC types in 2010 and 2017 in the Lanzhou New Area. According to the confusion matrix (Table 2), the kappa coefficients of classification accuracy of the remote sensing images for 2010 and 2017 were 90.55% and 89.33%, respectively. The maps met the minimum 85% accuracy requirements to be used for subsequent post-classification analysis [40].
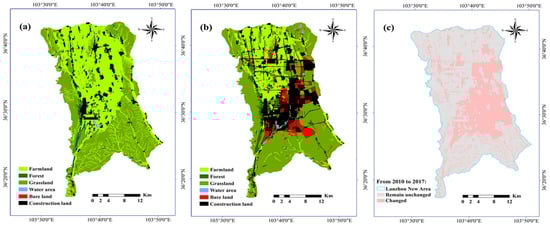
Figure 3.
LULC types of the study area in 2010 (a), 2017 (b), and the changed areas between 2010 and 2017 (c).
Table 2.
Cross-tabulation matrix of classified vs. reference data between 2010 and 2017.
LULC changes greatly altered the characteristics of the study area from 2010 to 2017. The main change was the expansion of construction land at the expense of farmland. Farmland declined from 47.23% in 2010 to 21.85% in 2017, while construction land and bare land increased from 8.65% to 21.77% and from 0.03% to 6.00%, respectively. In addition, grassland and forest areas increased from 41.74% and 1.98% in 2010 to 46.03% and 3.69% in 2017, respectively. Therefore, the overall trend in LULC change was the reduction in farmlands and the increase in other LULC types, as shown in Figure 4a. Supported by government policies, for the construction of the New District, urbanization with intensive human activities was the dominant process that caused LULC changes in the study area. As a crucial connection point in China’s Silk Road Economic Belt and as a region with a fragile eco-environment, the study area requires more land resources for construction and ecological restoration purposes.
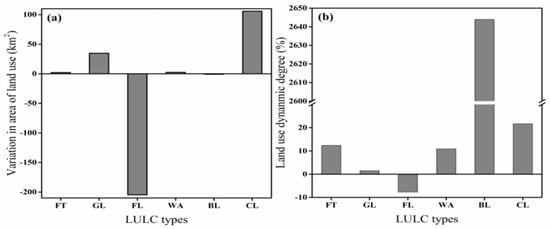
Figure 4.
Change in area of land use (a) and land use dynamic degree (b) in Lanzhou New Area in 2010 and 2017. FT, GL, FL, WA, BL and CL refer to forest, grassland, farmland, water area, bare land and construction land, respectively.
The LULC transmission matrix presents a dynamic changing trend of different LULC types between 2010 and 2017 (Table 3). The reduction in farmland was 204.59 km2, of which 42.04% was transformed into construction land and 40.83% was transformed into grassland (Table 3). Farmland accounted for the largest area of all LULC types in 2010, whereas grassland accounted for the largest area in 2017. Most of the new grasslands were converted from abandoned farmland during 2010–2017, as reported in other developed and developing countries [41,42]. The increase in bare land area was 48.12 km2, of which 48.11% was converted from farmlands and 46.46% was converted from grasslands. Additionally, of the newly formed construction land, 81.32% and 19.86% were converted from farmland and grassland, respectively. The variations in the area of land use show that the decline in the farmland area and the increase in the construction land were the highest, followed by the increase in grassland area (Figure 4a), indicating that significant loss of high-quality farmland accompanied urbanization.
Table 3.
LULC change matrix between 2010 and 2017.
The land use dynamic degree explains the variations in a certain LULC type (Figure 4b). Bare land was mostly converted from farmland and grassland and showed the highest variability (2644%), followed by construction land (22%). Grassland was relatively stable compared with the other LULC types because its roll-in (converted from the other LULC types) and roll-out (converted to the other LULC types) area were similar between 2010 and 2017. Grasslands and farmlands are the main land resources exploited for urban development and industrial construction, and a major problem in the future will be effective land management and land restoration.
3.2. Soil Properties under Different Land Use Change Types
The physical and chemical properties of soil exhibited different variations under different land use change types (Figure 5). In the 0–10, 10–20, and 20–30 cm soil layers, TN contents in different land use change types were in the order of farmland to abandoned land > farmland to construction land > native grassland to artificial grassland, native grassland to bare land, and farmland to bare land. This reflects two factors. First, the change in vegetation coverage, as vegetation has a significant impact on the accumulation of soil nutrients [14]. Land abandonment is favorable for vegetation recovery and soil quality improvement [43], and thus increases the N content in soils.
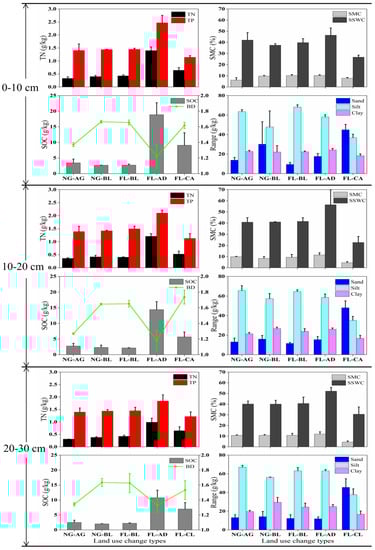
Figure 5.
Soil properties at different depths for different land use change types. Values are given as Mean ± SD. NG, FL, AG, BL, AD and CL refer to native grassland, farmland, artificial grassland, bare land, abandoned land and construction land. TN, TP, SOC, SWC, BD and SSWC refer to total nitrogen, total phosphorus, soil organic carbon, soil water content, bulk density and soil saturated water content.
However, the removal of the original soil, and vegetation of farmland and natural grassland will result in TN loss. Second, construction sites in the study had planted vegetation for environmental purposes (mainly prevent soil and water loss) before the structures start to build in the study area, and thus the use of exogenous organic fertilizer increased the soil TN content in the farmland to construction land transition. The variations in the TP content in different land use change types were similar to those in the TN content and exhibited the highest value in the transition of farmland to abandoned land; the lowest values occurred in the farmland to construction land transition. The soil profile of the construction land varied when the land was filled with gravel and sand, resulting in a decrease in the TP content. Both TN and TP contents decreased with increasing soil depth in farmland to abandoned land areas; however, there were no significant differences in other land use change types, indicating that soil homogeneity increased with land rearrangement in the study area.
Soil is considered as a major carbon pool of terrestrial ecosystems [44]; however, soil carbon sequestration is greatly affected by LULC changes [45,46]. SOC values were highest in the farmland to abandoned land transition, with 14.44, 11.54, and 10.82 g kg−1 in the 0–10, 10–20, and 20–30 cm soil layers, respectively. Similar to TN content, the native grassland to bare land and farmland to bare land transitions had the lowest SOC values. SOC content in the native grassland to artificial grassland transition was higher than that in the native grassland to bare land transition, revealing the essential role of vegetation coverage in SOC accumulation and soil structure improvement. However, SOC content in the farmland to construction land transition was higher than that in farmland to artificial grassland areas, which can be primarily attributed to the input of external organic fertilizers. The shift from other land use types to bare land increased the loss of soil carbon, indicating that the removal of vegetation and surface soil significantly decreased soil nutrient levels and vegetation growth; this further weakens the soil carbon storage capacity and increases the risk of soil erosion.
The lowest BD values (1.24, 1.18, and 1.33 g cm−3 for the 0–10, 10–20, and 20–30 cm soil layers, respectively) were detected in the farmland to abandoned land transition. However, the conversion of other LULC types into bare land led to the highest BD. Bare land was mostly used for construction, which continuously increased soil compaction and decreased soil nutrient content. The values of BD varied from 1.53 to 1.74 g cm−3 in the 0–10, 10–20, and 20–30 cm soil depths, with a mean value of 1.63 g cm−3 for the farmland to construction land transition, leading to soil compaction.
The soil particle size distribution in the study area is primarily a silt fraction, exhibiting small variations among all land use transitions except for the farmland to construction land transition, which was dominated by the sand fraction and had the lowest clay content. Soil particle size distribution is mostly affected by parent materials [14], and soil physical properties were more stable in the farmland to fallow land transition (i.e., natural revegetation) [17]. However, the percentage of sand fraction increased in urban areas, in relation to human activities, through soil profile alteration and the introduction of soil fills; this is consistent with past studies [11]. Higher BD combined with lower clay content has a remarkable impact on soil nutrient retention, owing to soil compaction and poor soil structure, which affect the accumulation of SOC and TN [17]. In addition, soil physical properties have a great impact on soil water capacity [14]. In this study, the farmland to construction land transition had the lowest mean value for SSWC and SWC, while farmland to abandoned land had the highest value. There was no significant difference in SSWC and SWC in the transition from native grassland to bare land, native grassland to artificial grassland, and farmland to bare land, indicating that these land use change types have a similar impact on soil hydrologic properties.
The conversion from farmland to abandoned land was beneficial for the enhancement of soil quality. However, land use changes related to the removal of native soil and vegetation (e.g., bare land) decreased soil nutrient levels. Moreover, the farmland to construction land transition increased the percentage of sand fraction and BD. Increases in coarse fractions (stone and sand) degrade soil structure [47]. The high sand content combined with low SOC resulted in poor soil structure, which in turn reduced soil fertility and water holding capacity. Additionally, BD, as an indicator of compactness [48], showed that soil compaction increased owing to the use of heavy machinery and the discharge of building waste and cement into the soil during urbanization. Compacted soils have detrimental effects on urban ecosystems [47]. For instance, soil compaction can interrupt nutrient water flow [29], which, in turn, affects biomass and net primary productivity, and leads to runoff, erosion, floods, and reduced biodiversity and groundwater recharge. Morel et al. [49] suggested that it is crucial to restore urban soils for the delivery of essential ecosystem services (e.g., water and air regulation, C sequestration, food productivity, temperature moderation, and biodiversity protection). Soil management and conservation, and the provision of ecosystem services would benefit from a better understanding of soil physicochemical properties related to land use change types.
3.3. Relationship between LULC Changes and Soil Properties
Soil properties that are susceptible to land use, climate change, vegetation type, and land management practices are used as tools to assess the effects of LULC change [18,34]. A scatter matrix and PCA were used to identify differences in the effects of land use change types on soil properties. The scatter matrix (Figure 6) shows that significant correlations (two-tailed test, 0.01 level) in soil properties exist between each land use change type, except for the farmland to abandoned land and farmland to construction land transitions, indicating that the impact of these land transitions on soil properties are considerably different from those of the other land use transitions.
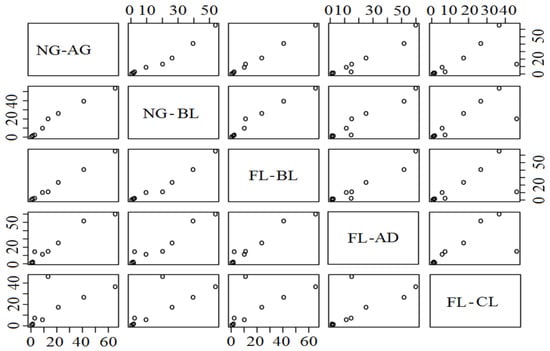
Figure 6.
Scatter matrix of soil properties for different land use change types. NG, FL, AG, BL, AD and CL refer to native grassland, farmland, artificial grassland, bare land, abandoned land and construction land.
PCA demonstrated that changes in LULC can significantly affect soil properties. The farmland to construction land transition was positively correlated with soil sand content and negatively correlated with SWC, silt, and clay content. Conversely, the farmland to abandoned land transition contributed to higher SSWC, TP, TN, SOC, and clay contents and lower BD. The transition of farmland to bare land, native grassland to artificial grassland, and native grassland to bare land had similar effects on soil properties (decreased SOC and TN content; Figure 5 and Figure 7). The transition to construction land is the most affected, with significant alteration in both soil structure and soil nutrient levels. These results is in agreement with those of Khaledian et al. [10].
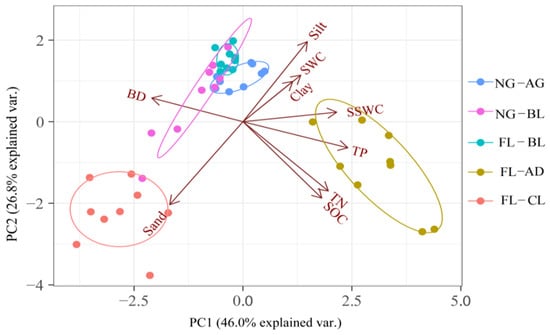
Figure 7.
A biplot of principal component analysis on soil properties for different land use change types. PC is the extracted principle component. Dot is sampling sites and circle is land use change types. NG, FL, AG, BL, AD and CL refer to native grassland, farmland, artificial grassland, bare land, abandoned land and construction land.
3.4. Variations in Soil Properties Compared with Reference Areas
Soil properties altered by LULC changes are shown in Figure 8. Compared with the reference area, TP increased significantly in the transition of farmland to abandoned land; however, it decreased by 27% and 42% in the transition from farmland to bare land and construction land. TN and SOC contents decreased in all land use change types except for the farmland to abandoned land transition. Sand content increased while silt and clay contents decreased when farmland was transformed into construction land. However, clay content increased when the land became bare and abandoned. These results are consistent with those of previous studies [23,43], which reported that the abandonment of land could increase soil TP, TN, and SOC. In this study, the soil clay content of abandoned land increased because of the increase in vegetation coverage by natural revegetation, which mitigated soil erosion and limited the loss of soil nutrients and clay content [50].
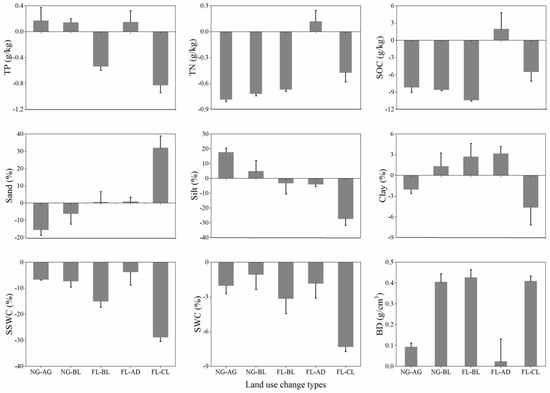
Figure 8.
Variation in soil properties under different land ue change types. NG, FL, AG, BL, AD and CL refer to native grassland, farmland, artificial grassland, bare land, abandoned land and construction land. TN, TP, SOC, SWC, BD and SSWC refer to total nitrogen, total phosphorus, soil organic carbon, soil water content, bulk density and soil saturated water content.
Long-term vegetation restoration can increase the nutrient content and improve soil structure with the help of litter and root system [23]. However, the shift from farmland to bare land and construction land decreased the TN, TP, and SOC levels. This result is consistent with the study of Li et al. [51], which reported that land use changes in farmlands reduced C sequestration. Furthermore, TN and SOC levels decreased by 69% and 64%, respectively, for native grassland to artificial grassland and by 75% and 78%, respectively, for native grassland to bare land. This indicates that the conversion of native grassland resulted in the largest loss of TN and SOC. This result is in agreement with that of Willy et al. [52]. Most studies have focused on the impacts of human-induced agricultural erosion causing SOC loss; SOC loss remains uncertain for rapid and intensive LULC change in large-scale farmlands and native grasslands associated with urbanization [53,54]. The reduction in SOC under different land use change types will lead to soil erosion and accelerate the rate of C emission in fragile arid-desert regions. Land use changes in the early urbanization stage cause SOC loss, and the degree of disturbance during LULC change and the urban soil age are key factors that affect the soil chemical properties [19].
Compared with the reference farmland, the sand and clay contents of the farmland to construction land transition were significantly affected by human disturbance and exhibited higher sand and lower silt and clay contents; the sand content increased by 69.21%, whereas the clay content decreased by 26.82%. Most studies have shown that the contents of sand, silt, and clay fractions significantly vary with land use type [55,56,57,58]. In addition, BD increased in all land use change types, whereas SWC and SSWC decreased. In general, soil BD increases and soil porosity decreases in abandoned farmland (without plow tillage). This, then, influences soil hydraulic characteristics [59,60,61]. The decrease in SWC in abandoned farmland could be due to the vegetation restoration and the increased consumption of water by plants. Understanding the response of these soil chemical and physical properties to intensive and rapid LULC change would provide insights into the effects of land use change and aid in the formulation of corresponding adaptive management measures.
4. Conclusions
Urbanization is the predominant process that leads to large-scale LULC change; it is important to monitor soil quality induced by these changes for better land planning and ecosystem conservation in ecologically fragile areas. In this study, taking the Lanzhou New Area as a case study area, both PCA and scatter matrix were used to explore the effects of LULC changes on soil properties in an arid region. The main conclusions are as follows:
The LULC pattern drastically changed between 2010 and 2017, during urbanization. The main LULC change was the expansion of construction land at the expense of farmland and the exploitation of native grassland. There was a significant correlation between land use change type and soil properties. The conversion of farmland to abandoned land increased the accumulation of TN, TP, and SOC, whereas the exploitation of farmland and native grassland (the farmland to bare land, farmland to construction land, native grassland to bare land, and native grassland to artificial grassland transitions) deteriorated the soil nutrient levels. Moreover, the transformation from farmland to construction land increased soil compaction by enhancing sand content and BD. When compared with the reference areas, all land use change types increased BD and decreased SWC and SSWC. Long-term monitoring of LULC changes and soil physical and chemical properties in arid regions with rapid and extensive land use change is beneficial for the assessment of regional ecological risks. It also provides theoretical guidelines for proper land use management and regional ecological risk alleviation.
Author Contributions
R.Z. and X.Z. conceived and designed the experiment, R.Z. and J.L. performed the sample collection; R.Z. and C.Z. analyzed the data; R.Z. wrote the paper. X.Z. and C.Z. reviewed and revised the manuscript. All authors have read and agreed to the published version of the manuscript.
Funding
This work is supported by the National Natural Science Foundation of China (Y911021001), the Youth Science and Technology Foundation of Gansu province (Grant No. 18JR3RA027) and the Experimental Research of Water Conservancy and Technology Extension project of Gansu Province (Grant No. [2020] 46).
Conflicts of Interest
The authors declare no conflict of interest.
References
- Biro, K.; Pradhan, B.; Buchroithner, M.; Makeschin, F. Land Use/Land Cover Change Analysis and Its Impact on Soil Properties in the Northern Part of Gadarif Region, Sudan. Land Degrad. Dev. 2013, 24, 90–102. [Google Scholar]
- Schweizer, S.A.; Fischer, H.; Häring, V.; Stahr, K. Soil structure breakdown following land use change from forest to maize in Northwest Vietnam. Soil Tillage Res. 2017, 166, 10–17. [Google Scholar]
- Ferreira, A.C.C.; Leite, L.F.C.; de Araújo, A.S.F.; Eisenhauer, N. Land-Use Type Effects on Soil Organic Carbon and Microbial Properties in a Semi-arid Region of Northeast Brazil. Land Degrad. Dev. 2016, 27, 171–178. [Google Scholar]
- Ahirwal, J.; Maiti, S.K. Assessment of soil properties of different land uses generated due to surface coal mining activities in tropical Sal (Shorea robusta) forest, India. Catena 2016, 140, 155–163. [Google Scholar]
- Zhou, W.; Yang, K.; Bai, Z.K.; Cheng, H.X.; Liu, F. The development of topsoil properties under different reclaimed land uses in the Pingshuo opencast coalmine of Loess Plateau of China. Ecol. Eng. 2017, 100, 237–245. [Google Scholar]
- Deng, J.S.; Wang, K.; Hong, Y.; Qi, J.G. Spatio-temporal dynamics and evolution of land use change and landscape pattern in response to rapid urbanization. Landscape Urban Plan. 2009, 92, 187–198. [Google Scholar]
- Liu, W.; Zhan, J.Y.; Zhao, F.; Yan, H.M.; Zhang, F.; Wei, X.Q. Impacts of urbanization-induced land-use changes on ecosystem services, A case study of the Pearl River Delta Metropolitan Region, China. Ecol. Indic. 2019, 98, 228–238. [Google Scholar]
- Fan, X.G.; Ma, Z.G.; Yang, Q.; Han, Y.H.; Mahmood, R.; Zheng, Z.Y. Land use/land cover changes and regional climate over the Loess Plateau during 2001–2009. Part I, observational evidence. Clim. Chang. 2014, 129, 427–440. [Google Scholar]
- Moriyama, M.; Numata, H. Urban soil compaction reduces cicada diversity. Zool. Lett. 2015, 1, 19. [Google Scholar]
- Khaledian, Y.; Kiani, F.; Ebrahimi, S.; Brevik, E.C.; Aitkenhead-Peterson, J. Assessment and Monitoring of Soil Degradation during Land Use Change Using Multivariate Analysis. Land Degrad. Dev. 2017, 28, 128–141. [Google Scholar]
- Shekhovtseva, O.G.; Mal’tseva, I.A. Physical, chemical, and biological properties of soils in the city of Mariupol, Ukraine. Eurasian. Soil Sci. 2015, 48, 1393–1400. [Google Scholar]
- Khalili Moghadam, B.; Jabarifar, M.; Bagheri, M.; Shahbazi, E. Effects of land use change on soil splash erosion in the semi-arid region of Iran. Geoderma 2015, 241–242, 210–220. [Google Scholar]
- Wang, Z.; Deng, X.Z.; Wong, C. Integrated Land Governance for Eco-Urbanization. Sustainability 2016, 8, 903. [Google Scholar]
- Kosmas, C.; Gerontidis, S.; Marathianou, M. The effect of land use change on soils and vegetation over various lithological formations on Lesvos (Greece). Catena 2000, 40, 51–68. [Google Scholar]
- Zucca, C.; Canu, A.; Previtali, F. Soil degradation by land use change in an agropastoral area in Sardinia (Italy). Catena 2010, 83, 46–54. [Google Scholar]
- Zhang, Y.; Wei, L.Y.; Wei, X.R.; Liu, X.T.; Shao, M.A. Long-term afforestation significantly improves the fertility of abandoned farmland along a soil clay gradient on the Chinese Loess Plateau. Land Degrad. Dev. 2018, 29, 3521–3534. [Google Scholar]
- Braimoh, A.K.; Vlek, P.L.G. The impact of land-cover change on soil properties in northern Ghana. Land Degrad. Dev. 2004, 15, 65–74. [Google Scholar]
- Khresat, S.E.; Al-Bakri, J.; Al-Tahhan, R. Impacts of land use/cover change on soil properties in the Mediterranean region of northwestern Jordan. Land Degrad. Dev. 2008, 19, 397–407. [Google Scholar]
- Liu, X.L.; Li, T.; Zhang, S.R.; Jia, Y.X.; Li, Y.; Xu, X.X. The role of land use, construction and road on terrestrial carbon stocks in a newly urbanized area of western Chengdu, China. Landsc. Urban Plan. 2016, 147, 88–95. [Google Scholar]
- Zambon, I.; Benedetti, A.; Ferrara, C.; Salvati, L. Soil Matters? A Multivariate Analysis of Socioeconomic Constraints to Urban Expansion in Mediterranean Europe. Ecol. Econ. 2018, 146, 173–183. [Google Scholar]
- Weissert, L.F.; Salmond, J.A.; Schwendenmann, L. Variability of soil organic carbon stocks and soil CO2 efflux across urban land use and soil cover types. Geoderma 2016, 271, 80–90. [Google Scholar] [CrossRef]
- Fiorini, A.; Boselli, R.; Maris, S.C.; Santelli, S.; Ardenti, F.; Capra, F.; Tabaglio, V. May conservation tillage enhance soil C and N accumulation without decreasing yield in intensive irrigated croplands? Results from an eight-year maize monoculture. Agric. Ecosyst. Environ. 2020, 296, 106–926. [Google Scholar] [CrossRef]
- Deng, L.; Wang, G.L.; Liu, G.B.; Shangguan, Z.P. Effects of age and land-use changes on soil carbon and nitrogen sequestrations following cropland abandonment on the Loess Plateau, China. Ecol. Eng. 2016, 90, 105–112. [Google Scholar] [CrossRef]
- Evans, R.D.; Belnap, J. Long-term consequence of disturbance on nitrogen dynamics in an arid ecosystem. Ecol. Evol. 1999, 80, 150–160. [Google Scholar] [CrossRef]
- Lal, R. Restoring soil quality to mitigate soil degradation. Sustainability 2015, 7, 5875–5895. [Google Scholar] [CrossRef]
- Nunes, J.S.; Araujo, A.S.F.; Nunes, L.A.P.L.; Lima, L.M.; Carneiro, R.F.V.; Salviano, A.A.C.; Tsai, S.M. Impact of land degradation on soil microbial biomass and activity in Northeast Brazil. Pedosphere 2012, 22, 88–95. [Google Scholar] [CrossRef]
- Dunjó, G.; Pardini, G.; Gispert, M. Land use change effects on abandoned terraced soils in a Mediterranean catchment, NE Spain. Catena 2003, 52, 23–37. [Google Scholar] [CrossRef]
- Jeong, A.; Dorn, R.I. Soil erosion from urbanization processes in the Sonoran Desert, Arizona, USA. Land Degrad. Dev. 2019, 30, 226–238. [Google Scholar] [CrossRef]
- Smith, P.; House, J.I.; Bustamante, M.; Sobocka, J.; Harper, R.; Pan, G.; West, P.C.; Clark, J.M.; Adhya, T.; Rumpel, C.; et al. Global change pressures on soils from land use and management. Glob. Chang. Biol. 2016, 22, 1008–1028. [Google Scholar] [CrossRef]
- Yang, H.; Xiong, H.G.; Chen, X.G.; Wang, Y.Q.; Zhang, F. Identifying the influence of urbanization on soil organic matter content and pH from soil magnetic characteristics. J. Arid Land 2015, 7, 820–830. [Google Scholar] [CrossRef]
- Zhu, W.X.; Hope, D.; Cries, C.; Grimm, N.B. Soil Characteristics and the Accumulation of Inorganic Nitrogen in an Arid Urban Ecosystem. Ecosystems 2006, 9, 711–724. [Google Scholar] [CrossRef]
- Chen, G.; Zhang, Y.; Zeng, R.Q.; Yang, Z.K.; Chen, X.; Zhao, F.M.; Meng, X.M. Detection of Land Subsidence Associated with Land Creation and Rapid Urbanization in the Chinese Loess Plateau Using Time Series InSAR, A Case Study of Lanzhou New District. Remote Sens. 2018, 10, 270. [Google Scholar] [CrossRef]
- Jiang, F.C.; Li, Y.L.; Yang, S.; Yang, G.D. Source analysis, distribution and pollution assessment of the soil heavy metals in the Qinwangchuan Basin. China Environ. Sci. 2018, 38, 2243–2252. (In Chinese) [Google Scholar]
- Jiang, P.H.; Cheng, L.; Li, M.C.; Zhao, R.F.; Duan, Y.W. Impacts of LUCC on soil properties in the riparian zones of desert oasis with remote sensing data, a case study of the middle Heihe River basin, China. Sci. Total Environ. 2015, 506–507, 259–271. [Google Scholar] [CrossRef]
- Liu, Y.Q.; Long, H.L. Land use transitions and their dynamic mechanism, The case of the Huang-Huai-Hai Plain. J. Geogr. Sci. 2016, 26, 515–530. [Google Scholar] [CrossRef]
- Fu, X.L.; Shao, M.A.; Wei, X.R.; Horton, R. Soil organic carbon and total nitrogen as affected by vegetation types in Northern Loess Plateau of China. Geoderma 2010, 155, 31–35. [Google Scholar] [CrossRef]
- Ryan, J.; Stroehlein, J.L. Use of Sulfuric Acid on Phorphorus Deficient Arizona Soils. Prog. Agric. Ariz. 1973, 25, 11–13. [Google Scholar]
- Gardner, W.H. Water content. In Methods of Soil Analysis: Part 1. Physical and Mineralogical Properties, 2nd ed.; Klute, A., Ed.; ASA; SSSA: Madison, WI, USA, 1986; pp. 493–544. [Google Scholar]
- Blake, G.R. Bulk density. In Methods of Soil Analysis, Part 1. Physical and Mineralogical Properties, including Statistics of Measurement and Sampling; Black, C.A., Ed.; American Society of Agronomy, Inc.: Madison, WI, USA, 1965. [Google Scholar]
- Anderson, J.R.; Hardy, E.E.; Roach, J.T.; Witmer, R.E. A Land Use and Land Cover Classification System for Use with Remote Sensor Data; United States Government Printing Office: Washington, DC, USA, 1976.
- Li, S.F.; Li, X.B. Global understanding of farmland abandonment, A review and prospects. J. Geogr. Sci. 2017, 27, 1123–1150. [Google Scholar] [CrossRef]
- Estel, S.; Kuemmerle, T.; Alcántara, C.; Levers, C.; Prishchepov, A.; Hostert, P. Mapping farmland abandonment and recultivation across Europe using MODIS NDVI time series. Remote Sens. Environ. 2015, 163, 312–325. [Google Scholar] [CrossRef]
- Romero-Díaz, A.; Ruiz-Sinoga, J.D.; Robledano-Aymerich, F.; Brevik, E.C.; Cerdà, A. Ecosystem responses to land abandonment in Western Mediterranean Mountains. Catena 2017, 149, 824–835. [Google Scholar] [CrossRef]
- Chen, Y.L.; Zhang, Z.S.; Zhao, Y.; Hu, Y.G.; Zhang, D.H. Soil carbon storage along a 46-year revegetation chronosequence in a desert area of northern China. Geoderma 2018, 325, 28–36. [Google Scholar] [CrossRef]
- Strey, S.; Boy, J.; Strey, R.; Weber, O.; Guggenberger, G. Response of soil organic carbon to land-use change in central Brazil, a large-scale comparison of Ferralsols and Acrisols. Plant Soil 2016, 408, 327–342. [Google Scholar] [CrossRef]
- Gao, X.D.; Meng, T.T.; Zhao, X.N. Variations of Soil Organic Carbon Following Land Use Change on Deep–Loess Hillsopes in China. Land Degrad. Dev. 2017, 28, 1902–1912. [Google Scholar] [CrossRef]
- Yang, J.L.; Zhang, G.L. Formation, characteristics and eco-environmental implications of urban soils—A review. Soil Sci. Plant Nutr. 2015, 61, 30–46. [Google Scholar] [CrossRef]
- Trabaquini, K.; Formaggio, A.R.; Galvão, L.S. Changes in Physical Properties of Soils with Land Use Time in the Brazilian Savanna Environment. Land Degrad. Dev. 2015, 26, 397–408. [Google Scholar] [CrossRef]
- Morel, J.L.; Chenu, C.; Lorenz, K. Ecosystem services provided by soils of urban, industrial, traffic, mining, and military areas (SUITMAs). J. Soils Sediments 2014, 15, 1659–1666. [Google Scholar] [CrossRef]
- Feng, Q.; Zhao, W.W.; Wang, J.; Zhang, X.; Zhao, M.Y.; Zhong, L.N.; Liu, Y.X.; Fang, X.N. Effects of Different Land-Use Types on Soil Erosion Under Natural Rainfall in the Loess Plateau, China. Pedosphere 2016, 26, 243–256. [Google Scholar] [CrossRef]
- Li, B.J.; Chen, D.X.; Wu, S.H.; Zhou, S.L.; Wang, T.; Chen, H. Spatio-temporal assessment of urbanization impacts on ecosystem services, Case study of Nanjing City, China. Ecol. Indic. 2016, 71, 416–427. [Google Scholar] [CrossRef]
- Willy, D.K.; Muyanga, M.; Mbuvi, J.; Jayne, T. The effect of land use change on soil fertility parameters in densely populated areas of Kenya. Geoderma 2019, 343, 254–262. [Google Scholar] [CrossRef]
- Huang, Z.H.; Du, X.J.; Castillo, C.S.Z. How does urbanization affect farmland protection? Evidence from China. Resour. Conserv. Recycl. 2019, 145, 139–147. [Google Scholar] [CrossRef]
- Li, W.B.; Wang, D.Y.; Li, H.; Liu, S.H. Urbanization-induced site condition changes of peri-urban cultivated land in the black soil region of northeast China. Ecol. Indic. 2017, 80, 215–223. [Google Scholar] [CrossRef]
- Sun, J.M.; Huang, C.H.; Han, G.N.; Wang, Y.F. Effects of cover on soil particle and associated soil nutrient redistribution on slopes under rainfall simulation. J. Soils Sediments 2018, 19, 729–740. [Google Scholar] [CrossRef]
- Qi, F.; Zhang, R.H.; Liu, X.; Niu, Y.; Zhang, H.D.; Li, H.; Li, J.Z.; Wang, B.Y.; Zhang, G.K. Soil particle size distribution characteristics of different land-use types in the Funiu mountainous region. Soil Till. Res. 2018, 184, 45–51. [Google Scholar] [CrossRef]
- Wang, Y.F.; Shao, M.A.; Gao, L. Spatial Variability of Soil Particle Size Distribution and Fractal Features in Water-Wind Erosion Crisscross Region on the Loess Plateau of China. Soil Sci. 2010, 175, 579–585. [Google Scholar] [CrossRef]
- Zhao, P.P.; Shao, M.A.; Zhuang, J. Fractal Features of Particle Size Redistributions of Deposited Soils on the Dam Farmlands. Soil Sci. 2009, 174, 403–407. [Google Scholar] [CrossRef]
- Sokolowski, A.C.; Prack McCormick, B.; De Grazia, J.; Wolski, J.E.; Rodríguez, H.A.; Rodríguez-Frers, E.P.; Gagey, M.C.; Debelis, S.P.; Paladino, I.R.; Barrios, M.B. Tillage and no-tillage effects on physical and chemical properties of an Argiaquoll soil under long-term crop rotation in Buenos Aires, Argentina. Int. Soil Water Conserv. Res. 2020, 8, 185–194. [Google Scholar] [CrossRef]
- Mitchell, J.P.; Shrestha, A.; Mathesius, K.; Scow, K.M.; Southard, R.J.; Haney, R.L.; Schmidt, R.; Munk, D.S.; Horwath, W.R. Cover cropping and no-tillage improve soil health in an arid irrigated cropping system in California’s San Joaquin Valley, USA. Soil Till. Res. 2017, 165, 325–335. [Google Scholar] [CrossRef]
- Ren, Z.P.; Zhu, L.J.; Wang, B.; Cheng, S.D. Soil hydraulic conductivity as affected by vegetation restoration age on the Loess Plateau, China. J. Arid Land 2016, 8, 546–555. [Google Scholar] [CrossRef]


Publisher’s Note: MDPI stays neutral with regard to jurisdictional claims in published maps and institutional affiliations. |
© 2020 by the authors. Licensee MDPI, Basel, Switzerland. This article is an open access article distributed under the terms and conditions of the Creative Commons Attribution (CC BY) license (http://creativecommons.org/licenses/by/4.0/).