Abstract
This study compared the competitiveness of the Commonwealth Independent State Airlines (Azerbaijan Airlines, Air Astana, Aeroflot) with Korean airlines (Asiana Airlines, Korean Air) using customer online reviews through big data analytics. The purpose of this study was to get the understanding of airline issues, especially the relationship between airline traveler experience and satisfaction. This study also shows which group has a better service and is more developed and provides significant and social network-oriented suggestions for another group of airlines. Data were collected from Skytrax and the collected reviews were written from January 2011 to March 2019. The size of the dataset was 1693 reviews, and a total of 199,469 words were extracted. As part of the qualitative analysis method, semantic network analysis through text mining was performed, and linear regression analysis was conducted using SPSS as part of the quantitative analysis method. This study shows which group of airlines has a better service and provides significant and social network-oriented suggestions for another group of airlines. The common concerns, as well as special features for different airlines, can also be extracted from online review data.
1. Introduction
Airlines have continuously been classified as one of the more intangible benefit businesses. The airline segment has gotten to be the foremost vital portion within the financial improvement market [1]. It plays a crucial part in moving individuals or items from one point to another, be it household or worldwide, particularly when the separations included are distant. Airlines’ quick development is based on decreases in driving, leading to operations that are more effective. During the last 35 years, the airline industry has expanded beyond any other form of public transportation. Its rate of technological change has been exceptional [2]. This has resulted in a drop in costs and fares, which have stimulated a very rapid growth in demand for its service. In other words, it has seemingly been unsatisfactory for demand. In addition, for most of the time, booking airlines have enjoyed considerable protection from both internal and external competition [3].
Nowadays, the competition among businesses working within the airline industry has gotten to be exceedingly strong. This has brought about distinctive sorts of impediments for the airline industry. For instance, companies are presently required to contribute large sums of assets in promoting and advancement activities to attract more clients. Moreover, the airline companies are required to offer high quality administrations that take a toll to attract new customers, which is not a straightforward errand [4]. Within the cutting edge period, the bartering control of clients within the industry is exceptionally tall as there are a few choices and options accessible for them. Expanding and serious competition may be a danger, since these factors strengthen the existing business to always center on moving forward benefit quality and advancement, which is never easy when the benefit edges are moot. Achieving a high degree of client fulfillment within the long run has ended up exceptionally complicated for the companies working within the airline industry.
That is why many airlines are using customer relationship management (CRM) as a tool for managing relationships with customers. Unfortunately, in many cases, they failed to recognize CRM as a holistic strategy instead of viewing it as synonymous with their frequent flyer programs. As airlines struggle to grow their market and share and sustain profitability in today’s fiercely competitive and economically demanding environment, it is essential to develop new ways to manage their customer relationships to optimize customer loyalty. Therefore, eWOM (electronic word of mouth) is an important tool to have in appropriate CRM, because eWOM brings some direct communications between customers and airline companies. Additionally, eWOM supports the collection of valuable customer information by suppliers, such as airlines who do not want to share with third parties [5]. Knowledge of customer behavior, including purchase of related products (such as accommodation and rental cars) and buying profiles, is important information that serves as the basis for developing marketing strategies; the information collected on their frequent flyers is an example [6].
In particular, the Korean tourism market was also low due to the recession in Japan, which was the main focus of the Korean tourism industry. Therefore, the Korea Tourism Organization opened a branch office in Moscow to explore the Russian tourism market and planned an in-depth analysis of the Russian market to develop full-fledged marketing activities. In addition, the number of Korean tourists visiting Russia has increased tenfold in five years [7]. Therefore, it is necessary to compare Korean major airlines with Commonwealth of Independent States’ (CIS) major airlines to provide basic data for the vitalization of the tourism industry between Korea and Russia. The main aim of this study was to compare the airlines between CIS (Commonwealth of Independent States) and Korea through the big data, which demonstrate the utility and processing program of to better understand airline issues, especially the relationship between airline traveler experiences and satisfaction. This study also shows which group has better service and is more developed and provides significant and social network-oriented suggestions for another group of airlines. Particular objectives of this research included the following:
- Understanding the airline traveler experience based on the top frequency words concluded from the textual reviews on Skytrax (airlinequality.com);
- Conduct semantic network analysis based on airline traveler online reviews;
- Show the connectivity, segmentations, and differences of the top frequency words with visualization and convergence of iterated correlation;
- Investigate the factors that consist of airline traveler experience;
- Identify the relationship between airline traveler experience and satisfaction through linear regression analysis.
2. Literature Review
2.1. Airline Industry
The airlines industry is an industry that provides air transportation for passengers and cargo service by using aircrafts such as airplanes or helicopters [8]. Just like other transportation services, airline services have all the characteristics of services distinguished from goods or visible items. Air transport is an industry that can create utilities for both time and place. The place utility is created by transferring goods or passengers to a promised location. The time utility is created when goods or passengers arrive on time. Delays may result in additional costs [9].
Nowadays, the competition among businesses working within the airline industry has gotten to be exceedingly strong. This has brought about distinctive sorts of impediments. For instance, companies are presently required to contribute large sums of assets in promoting and advancement activities to attract more clients. Moreover, the airline companies are required to offer high quality administrations to attract new customers, which is not a straightforward errand [4]. Within the cutting edge period, the bartering control of clients within the industry is exceptionally tall as there are a few choices and options accessible for them. Expanding and serious competition may be a danger, since it strengthens the existing business to always center on moving forward benefit quality and advancement, which is never easy when the benefit edges are moot. Achieving a high degree of client fulfillment within the long run has ended up exceptionally complicated for the companies working within the airline industry [10].
Considering the high growth in airline industry, the literature and research works are rapidly increasing to this industry. Table 1 synthesizes the prominent research works conducted in this field. As shown in Table 1, studies of the airline industry continue steadily, indicating the need for research into the airline industry.

Table 1.
Recent research works related to the airline industry.
Over the past decade, as the worldwide airline market the global economy has improved well, airlines have developed in profitability, matured in terms of utilizing better capacity administration and fetched controls, and have benefitted from the blast in demand for traveler air travel. Airframe and motor manufacturers have booked orders and detailed record conveyances, with plans to further push up production to historically high levels [14].
However, service failures are unavoidable within the airline industry and airlines should attempt to minimize the conceivable damaging impact thereof by putting service recuperation strategies in place. The way in which airlines respond to service failures might, subsequently, possibly impact whether a customer will remain with an airline or defect to a competitor. For now, literally every worldwide airline revenue is under the influence of COVID-19, whereby 2020 has been under tremendous pressure for about nine months. Asian countries like China, Republic of Korea, Singapore, etc. made significant efforts to contain the transmission of the virus, although, it has spread to other districts of the world [15]. The airline industry, which has suffered a major recession due to the dying tourism industry, will need stronger marketing fundamentals.
2.2. Skytrax
“Skytrax” contains daily airline customer reviews. It has their own “Best Airline” and “Best Airport” awards every year. Skytrax is a site where customers who have experienced a particular airline directly evaluate their feelings about the airline in an online environment [16]. Skytrax contains online reviews of more than 150 airlines around the world, from the world’s largest airline to smaller ones. Specifically, it is a globally recognized brand that provides professional auditing and service benchmarking programs on the quality of products and services of airlines. They employ professional auditors to assess the service and material quality of in-flight and airport terminals. These assessments are based on consistent criteria [17].
The world’s top airlines highly value these quality awards given by Skytrax. Once an airline is awarded the “Skytrax rating” or advanced to a higher ranking, it will immediately issue a press release and post it on the most visible spot on its website. Both the overall star ranking and detailed quality evaluation results are available on the Skytrax website [18]. This material has also been used in various academic studies, as shown in Table 2.
Table 2.
Academic studies using Skytrax.
Korean Air has 533 total reviews with an 8 out of 10 overall rating. It also got four stars out of five in all five parts of judging, same as Air Astana. Asiana Airlines got 476 total reviews and has become one of the top airlines in the world market. It has four stars out of five for four clusters, which are food and beverages, seat comfort, staff service, and value for money, and three stars for inflight entertainment.
If the CIS airlines started to cancel the flights from the beginning of 2020, then Korean airlines still had flights until the March of 2020 and cancelled them due to closing the borders, not only of Republic of Korea, also other countries like the United States of America, Canada, France, the United Kingdom, etc. According to the Skytrax airlines reviews, Air Astana is the most customer friendly airline among all the airlines we used for this study. As Figure 1 has shown, Air Astana replies to every review and tries to solve the challenges of every customer.
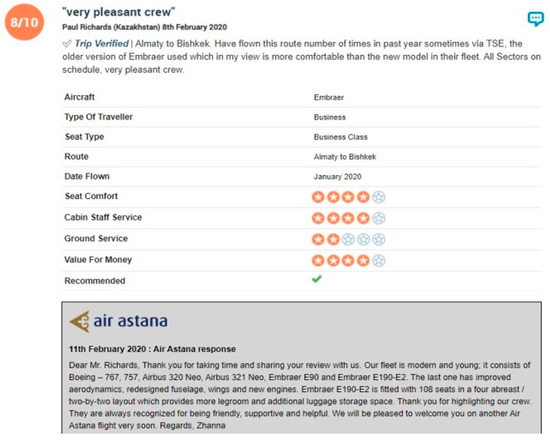
Figure 1.
Online review of Air Astana.
According to Skytrax (airlinequality.com) and Airline Ratings (airlineratings.com):
- ✓
- Condition of park for airlines are: Aeroflot—6/7, Air Astana—6/7, Azerbaijan Airlines—5/7, Korean Air—7/7, Asiana Airlines—7/7.
- ✓
- Route network for airlines are: Aeroflot—59 countries and 176 cities, Air Astana—20 countries and 38 cities, Azerbaijan Airlines—23 countries and 47 cities, Korean Air—45 countries and 116 cities, Asiana Airlines—24 countries and 76 cities.
- ✓
- Frequency of flights of airlines are: Aeroflot—6/7, Air Astana—6/7, Azerbaijan Airlines—5/7, Korean Air—7/7, Asiana Airlines—7/7.
- ✓
- Safety ratings for airlines are: Aeroflot—6/7, Air Astana—5/7, Azerbaijan Airlines—6/7, Korean Air—7/7, Asiana Airlines—7/7.
- ✓
- Quality of service of airlines are: Aeroflot—4/5, Air Astana—4/5, Azerbaijan Airlines—4/5, Korean Air—4/5, Asiana Airlines—4/5.
- ✓
- Tariffs and price characteristics of airlines are: Aeroflot—4/5, Air Astana—4/5, Azerbaijan Airlines—4/5, Korean Air—4/5, Asiana Airlines—4/5.
- ✓
- Company image and marketing image for airlines are: Aeroflot—6/10, Air Astana—8/10, Azerbaijan Airlines—7/10, Korean Air—8/10, Asiana Airlines—8/10.
- ✓
- Land infrastructure for airlines are: Aeroflot—6/7, Air Astana—6/7, Azerbaijan Airlines—5/7, Korean Air—7/7, Asiana Airlines—7/7.
2.3. Online Customer Reviews
We live in a digital century, where the online reviews play a major role in service systems. For example, unsatisfied online reviews of airline travelers can be a minus for the airline company and gives them clarity as to which sector should be more developed. Using the big data in tourism management, we can find textual reviews, pictures, and all kinds of reviews with overall ratings in online traveler reviews, which serve as vital segments and help, not only for the airline industry, but also for researchers working on analyzing the impact of the features contributing the user satisfaction [25]. Extant studies in this stream investigated, among others, customer motivation to take an interest in eWOM (electronic word of mouth). eWOM is experiencing high growth with the emergence of new technology tools that show the opinions that customers express through the online reviews [26,27,28].
Recent researchers have highlighted the role of substance analysis of travelers’ online reviews on service quality. Analysts have perceived these reviews as a normal setting for the study of travelers’ lived encounters. With the rise of Skytrax and social media platforms, clients can now effectively put their feedback online for everyone to see. In general, Skytrax reviews are seen as open, dependable, credible, and readily accessible data by both customers and researchers. For managers, online reviews provide a budget and time-efficient way to gather consumer feedback [13,19].
Researchers have already analyzed Skytrax travel reviews to distinguish the main measurements of customers’ overall experiences in different areas of the hospitality and tourism industry [20]. In spite of the fact that the relation between review scores and customer satisfaction and its consequent effect on sales is broadly investigated within the context of eWOM literature, its data substance is limited by the accumulation of the measurements of fulfillment in a generic score, as well as the imperatives imposed by the preselection of the individual service quality measurements. Subsequently, as a service quality signal, online reviews carry a few of the impediments found on conventional overviews where the multidimensionality of the quality makes their use risky since they are planned to reflect particular predefined measurements, leading to significant data loss [29,30].
3. Materials and Methods
The data were collected by Web crawlers. The Web crawler used for data collection was written in Python 2.7, and the server operating system was Ubuntu 16.04 LTS. For the basis of comprehending worldwide airline experience and satisfaction, the reviews utilized for this research were assembled from Skytrax (airlinequality.com) since it is the leading airline reviews and statistics site, which hosts the largest airline community in the world. To achieve the purpose of this paper, understanding the characteristics of airline industry and comparing the differences with these two representative groups, the semantic network analysis with big data was performed.
Various types of data were utilized, including brand of airlines, departure location and destination, type of aircraft, variety seat type, flown date, and type of traveler. In addition, rating information was available, with seat comfort, staff, F & B (food and beverage), inflight entertainment, ground service, value for money, and overall evaluation included. The main content was textual reviews with titles and contents with recommendations. The customer’s satisfaction was defined as an overall satisfaction rating score in this study. Figure 2 shows the screenshot of airline traveler reviews page on the Skytrax.
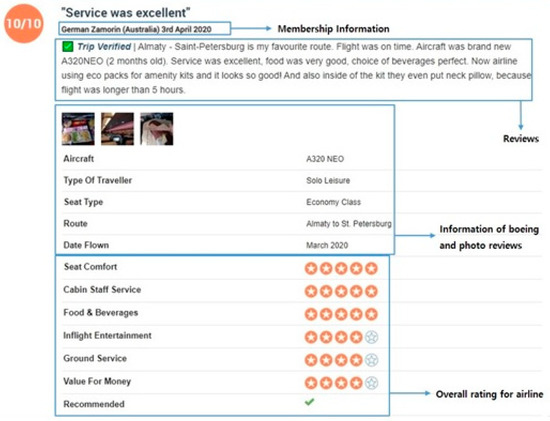
Figure 2.
Screenshot of airline traveler reviews on Skytrax.
This study was based on a previous research [30], which consisted of data extracted from airline travelers’ online reviews on the Skytrax. The previous research collected and analyzed reviews from the world’s top 10 airlines, but this survey collected online reviews from the following five airlines for comparison between CIS and Korean airlines. The collected online reviews were written from January 2011 to March 2019. The size of the dataset was 1693 reviews, and 199,469 words were collected. As shown in Table 3, Korean Air had the largest number of reviews (495), because it has the largest market share in the airline industry, and it was followed by Aeroflot (490), Asiana Airlines (445), Air Astana (205), and Azerbaijan Airlines (58). Aeroflot’s satisfaction score was the lowest at 6.72, while Asiana Airlines had the highest satisfaction score.
Table 3.
Characteristic of sample.
3.1. Qualitative Data Analysis
Qualitative data analysis analyzes data that are not easily diminished by numbers, which are also related to customer’s concepts, opinions, values, decisions, and behaviors. In this study, the analysis process was carried out as shown in Figure 3 to identify the frequency and importance of keywords concerning the recognition of airline passengers. In the first phase of the study, online review data were collected and refined for data analysis. The collected text was analyzed using the packaged UCINET 6.0 version with the Netdraw visualization tool. The Netdraw tool is an illustration program that describes how high-frequency words connect with other words through specific interactions. Finally, they are grouped through CONCOR (CONvergence of iteration CORrealtion) analysis to determine important factors.
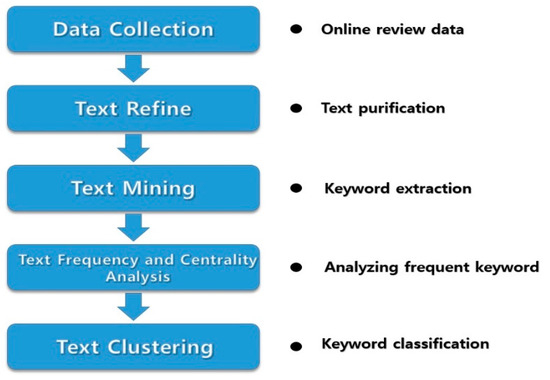
Figure 3.
Qualitative research process.
3.2. Quantitative Data Analysis
Quantitative data analysis is an efficient approach to investigations, amid which numerical data are collected and an analyst transforms what is collected or perceived into numerical data. It frequently describes a circumstance or event, answering the “what” and “how many” questions and often is a research process that involves measuring or counting properties. So, for this study, quantitative analysis was used for the evaluation of data on six dimensions (seat comfort, staff, food and beverage, entertainment, ground service, value for money), which were collected from Skytrax (airlinequality.com) with recommendations and customer satisfaction. Regression analysis was conducted based on the data that the customer scored according to the variables set by Skytrax. After that, we used the SPSS Statistics (IBM, Armonk, NY, USA) program, which managed a linear regression analysis and confirmed the effect of each factor and customer satisfaction. Also, the relationship between customer satisfaction and recommendation was analyzed additionally. Meanwhile, a research model was performed in Figure 4.
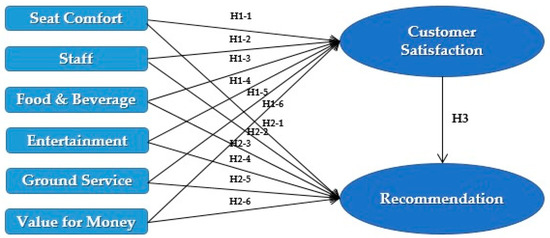
Figure 4.
Quantitative research model.
The hypotheses designed according to the research model were as follows:
Hypothesis (H1-1).
Seat comfort has a positive effect on the airline’s customer satisfaction.
Hypothesis (H1-2).
Staff has a positive effect on the airline’s customer satisfaction.
Hypothesis (H1-3).
F & B has a positive effect on the airline’s customer satisfaction.
Hypothesis (H1-4).
Entertainment has a positive effect on the airline’s customer satisfaction.
Hypothesis (H1-5).
Ground service has a positive effect on the airline’s customer satisfaction.
Hypothesis (H1-6).
Value for money has a positive effect on the airline’s customer satisfaction.
Hypothesis (H2-1).
Seat comfort has a positive effect on the airline’s recommendation.
Hypothesis (H2-2).
Staff has a positive effect on the airline’s recommendation.
Hypothesis (H2-3).
F & B has a positive effect on the airline’s recommendation.
Hypothesis (H2-4).
Entertainment has a positive effect on the airline’s recommendation.
Hypothesis (H2-5).
Ground service has a positive effect on the airline’s recommendation.
Hypothesis (H2-6).
Value for money has a positive effect on the airline’s recommendation.
Hypothesis (H3).
Customer satisfaction has a positive effect on the airline’s recommendation.
4. Results
4.1. Frequency Analysis
We extricated constructed data from the text data posted by airline travelers in Skytrax (airlinequality.com) for the linear regression analysis to investigate airline traveler experience and satisfaction. The number of extracted online reviews was 1693, and the number of total words was 199,469 words in total. The text mining was utilized for unstructured text data to structured data and collected words were sorted by frequency, whereby the top 100 of them were extracted and organized for each of the groups, 300 in total, shown in Table 4 and Table 5. The collected keywords were categorized as matrix data and were used for semantic network analysis. Within the process of picking the keywords, the articles, copulative elements as prepositions, and relative pronouns were eliminated and the keywords related to airline traveler experience were covered within the refined data by deleting redundant, repeated, or unnecessary words such as didn, bh, th, I, have, etc.
Table 4.
The top 100 frequency words from airline traveler reviews for Korean airlines.
Table 5.
The top 100 frequency words from airline traveler reviews for Commonwealth of Independent States’ (CIS) airlines.
The results represented by Table 4, top keywords frequency of Korean airlines, were as follows. First of all, words related to experience in airline services included the airline and destinations like ‘Asiana’, ‘Seoul’, ‘Incheon’, ‘aircraft’, and ‘Sydney’, which had the frequency rank of 7, 11, 18, 34, 46, and words related with food and beverage like ‘food’, meal’, ‘drink’, and ‘wine’, had 8, 16, 32, 53, frequency rank. The words meaning seat comfort, such as ‘seat’, ‘system’, ‘arrival’, and ‘blanket’, also had high occurrence. There were words for entertainment, such as ‘entertain’, ‘custom’, and ‘service’. The words regarding ground service, like ‘flight’, ‘time’, ‘problem’, ‘passenger’ were as well included in the comments on their airline experience. Words connected with value for money ‘airline’, ‘air’, ‘review’, and ‘money’ were seen a lot of times.
Table 5 shows the distribution of the top 100 words based upon frequency for CIS airlines. The words such as ‘airline’, ‘Aeroflot’, ‘Moscow’, ‘Incheon’, and ‘Sydney’ that straightly connected to the airline and destinations had high web visibility. Words demonstrating the ground service, like ‘flight’, ‘passenger’, ‘check’, and ‘problem’, also happened frequently from frequency analysis. Additionally, there were represented keywords directly concerned to food and beverage, for example, ‘food’, ‘meal’, ‘breakfast’, and ‘snack’. On top of that, ‘review’, ‘money’, ‘trip’, and ‘hour’ were also related to the value for money cluster. To add, there was a seat comfort cluster consisting of ‘staff’, ‘seat’, ‘time’, and ‘comfort’ that showed high frequency. Also, ‘custom’, ‘service’, ‘class’, and ‘crew’ were included in the entertainment cluster, which demonstrates the connection of the reviews of customers.
4.2. Semantic Network Analysis
Semantic network analysis identifies the relationship between words and expresses a meaningful relationship. For semantic network analysis, the centrality of keywords was schemed and CONCOR analysis corresponding to cluster analysis was performed. CONCOR analysis is an analysis that performs continuous correlation to discover the relativity of similarity groups, the same as identifying node blocks according to the correlation coefficients of concurrent keywords and forming clusters containing similar keywords.
The CONCOR analysis has been represented in Figure 5. In addition, the CONCOR of CIS airlines has been presented in Figure 6. As a result, they consist of “seat comfort”, “entertainment”, “airlines and destination”, “ground service”, “food and beverage”, and “value for money”. Additionally, the CONCOR conclusions were quite similar to the result factors represented by Skytrax. To make it simpler to notice which words belong to which group, the words clustered into the group and the ones to be noticed, the cluster name was used, as comes next considering the characteristics of the words. The airline and destination part refers to the airline, airbus, and destination, which are the parts of the airlines that we used for this study.
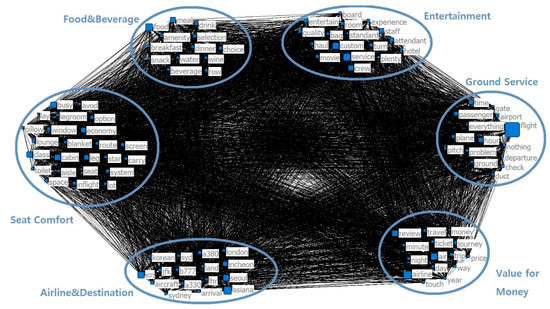
Figure 5.
Visualization of CONCOR analysis of Korean airlines.
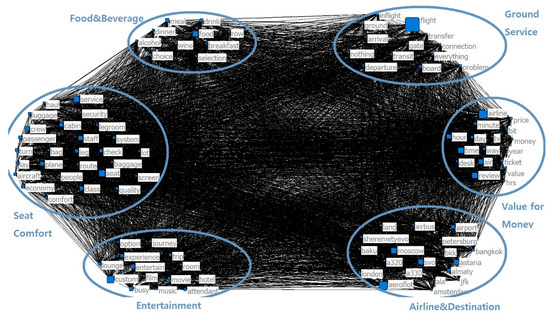
Figure 6.
Visualization of CONCOR analysis for CIS airlines.
The Azerbaijan airlines is not the only airline organization that did not appear in the airline and destination cluster. It means that related words with Azerbaijan airlines (except “Baku”) are not in the top 100 frequent words. The cluster of seat comfort has ‘seat’, ‘legroom’, ‘cabin’, and ‘luggage’. The food and beverage cluster contains ‘wine’, ‘food’, ‘drink’, ‘alcohol’, and ‘snack’, which are directly associated with airline catering issues. The other peculiar word is ‘nothing’ in the cluster of ground service, while ‘everything’, ‘transfer’, ‘transit’, and ‘inflight’ are also represented by ground service. The value for money cluster consists of ‘money’, ‘price’, ‘ticket’, ‘journey’, etc., which are directly associated with airline traveler value issues.
The results of CONCOR analysis only can generally disclose the cognition and understanding of a specific item, for a more expounded unscrambling of the content, more profound information examination required. Words summary of CONCOR analysis is demonstrated in Table 6. It shows comparison between top frequency words of CIS airlines and Korean airlines through the CONCOR analysis. According to Table 6, CIS airlines and Korean airlines had a quite big difference in top frequency words in all six clusters. For example, in the seat comfort cluster, a lot of words are common between the airlines but, for Korean airlines we found a couple of other words like “blanket”, “pillow”, “carry”, and “space” which were not mentioned for CIS airlines. The most significantly different cluster was airline and destination, as names of cities and airports were divided into the places.
Table 6.
The CONCOR analysis comparison between CIS airlines and Korean airlines.
4.3. Linear Regression Analysis
The linear regression analysis was performed with the airline travelers’ “customer satisfaction“ of CIS airlines as the dependent variable and the six airline traveler result factors as independent variables. They were: seat comfort, staff, food and beverage, entertainment, ground service, and value for money. The results of linear regression analysis can be seen in Table 7. The overall variance explained by the six predictors was 89.4% (R2 = 0.894) and all six factors were significant at p < 0.05 level. In particular, according to the standardized coefficient values, seat comfort (β = 0.233, p < 0.001), staff (β = 0.184, p < 0.001), food and beverage (β = 0.134, p < 0.05), entertainment (β = 0.074, p < 0.05), ground service (β = 0.109, p < 0.05), and value for money (β = 0.354, p < 0.001); these factors positively related to outcome variables. The value for money variable held the largest standardized coefficients, which means the air travel experience aspect of airline travel is the most important factor associated with airline customer satisfaction. Reviews like: “The major reason behind traveling in Aeroflot is cheaper fare for the last minute booking. Although the service quality was not very good it gave me value for money.” and “I was flying from Prague to Cairo via Moscow, the staff are professional and nice, very good value for money, the price for ticket was so low and satisfying, food was nice, cabin was clean, Aeroflot improved a lot.” were related to airline experience based upon value for money attributes. The second largest standardized coefficient was for seat comfort, which means the airline customers were satisfied with inflight comfort according to these online reviews: “The seats are wide and comfortable, uncomparable with pitiful masquerading of business class by other European airlines.” and “Very pleasant surprise, one of the best flights I’ve recently had. Aircraft was a bit dated but very comfy with a decent legroom.” Thus, H1-1, H1-2, H1-3, H1-4, H1-5, and H1-6 were supported.
Table 7.
Results of linear regression analysis of CIS airlines (dependent variables: customer satisfaction).
Table 8 demonstrates the results of the linear regression analysis with customer satisfaction of Korean airlines as the dependent variable and it has six independent variables: seat comfort, staff, food and beverage, entertainment, ground service, and value for money. The overall variance explained by the six predictors was 89.2% (R2 = 0.892) and all five factors were significant at p < 0.05 level, except entertainment (β = 0.036, p < 0.166) factor. Five factors were positively related to customer satisfaction according to their standardized coefficient values—seat comfort (β = 0.110, p < 0.001), staff (β = 0.184, p < 0.001), food and beverage (β = 0.093, p < 0.05), ground service (β = 0.194, p < 0.001), and value for money (β = 0.469, p < 0.001). Thus, H1-1, H1-2, H1-3, H1-5, and H1-6 were supported, however, H1–4 was rejected.
Table 8.
Results of linear regression analysis of Korean airlines (dependent variables: customer satisfaction).
Table 9 demonstrates the results of the linear regression analysis with recommendation of CIS airlines as the dependent variable and it has six independent variables: seat comfort, staff, food and beverage, entertainment, ground service, and value for money. The overall variance explained by the six predictors was 68% (R2 = 0.680) and only two factors were significant at ρ < 0.05 level, they were: seat comfort (β = 0.191, p < 0.05), and value for money (β = 0.566, p < 0.001). Also, food and beverage (β = 0.147, p < 0.10) was significant at p < 0.10 level. Another three factors were insignificant: staff (β = 0.065, p < 0.409), entertainment (β = 0.008, p < 0.892), and ground service (β = –0.095, p < 0.157). Therefore, only seat comfort and value for money were positively related to recommendation and they were very important, based on reviews. Thus, H2-1, H2-3 and H2-6 were supported, however, H2-2, H2-4, H2-5 were rejected.
Table 9.
Results of linear regression analysis conclusion of CIS airlines (dependent variables: recommendation).
Table 10 shows the results of a linear regression analysis using the Korean airlines recommended as a dependent variable. There were six independent variables as follows: seat comfort, staff, food and beverage, entertainment, ground service, and value for money. The overall variance explained by the six predictors was 71.3% (R2 = 0.713) and only three factors were significant at ρ < 0.001 level, they were: staff (β = 0.234, p < 0.001), ground service (β = 0.207, p < 0.001), and value for money (β = 0.438, p < 0.001). Also, food and beverage (β = 0.084, p < 0.10) and entertainment (β = –0.080, p < 0.10) were significant at p < 0.10 level. Only one factor was not significant, which was seat comfort (β = 0.047, p < 0.297). Consequently, H2-2, H2-3, H2-4, H2-5 and H2-6 were supported, however, H2-1 was rejected.
Table 10.
Results of linear regression analysis conclusion of Korean airlines (dependent variables: recommendation).
The third linear regression analysis was demonstrated to verify the responsible part of H3. The result is shown in Table 11 with recommendation as the dependent variable and it has independent variables of customer satisfaction. The overall variance was 69.4%, which is R2 = 0.694. The customer satisfaction was significant and positively related to the recommendation for both of the groups of airlines and according to their standardized coefficient values: (β = 0.772, p < 0.001), (β = 0.785, p < 0.001). Therefore, H3 was supported.
Table 11.
Results of linear regression analysis (dependent variables: recommendation).
The independent samples t-test results provided in Table 12 indicate whether there was significance between Korean airlines and CIS airlines in relation to six clusters, like seat comfort, staff, food and beverage, entertainment, ground service, and value for money, as well as for two factors such as recommendation and rating. Factors influencing airline passengers’ satisfaction were examined according to frequency of use, five out of six clusters were found to be significantly different. There was significance found between Korean airlines and CIS airlines in seat comfort (t = 4.320, sig. < 0.001), staff (t = 8.158, sig. < 0.001), food and beverage (t = 3.126, sig. = 0.002), entertainment (t = 2.315, sig. = 0.021), and value for money (t = 3.647, sig. < 0.001). The other significant result corresponded to the recommendation (t = 3.651, sig. < 0.001) and rating (t = 5.623, sig. < 0.001) between Korean airlines and CIS airlines. Nevertheless, the difference in the ground service cluster was not significant at the 0.05 level (t = 1.779, sig. = 0.076).
Table 12.
Independent t-test of overview total.
5. Discussion
Over the past decade, as the worldwide economy has progressed, airlines have progressed in profitability, developed in terms of utilizing way better capacity administration and fetched control, and have benefitted from the explosion in demand for passenger air travel. The airline industry continues to develop more significantly than other parts of tourism management. This study was conducted with the aim of comparing the airlines between Commonwealth Independent States airlines (Aeroflot, Air Astana, Azerbaijan Airlines) with Korean airlines (Korean Air, Asiana Airlines), while also improving the quality of customer service, their satisfaction and recommendations through a qualitative and quantitative analysis of passenger online reviews in Skytrax (airlinequality.com). To analyze the data received by airline passengers, the first process was to extract keywords using text analysis, and the second was to group them using CONCOR analysis. In addition, two consecutive linear regression analyzes were performed during the study to understand the relationship between customer satisfaction and the recommendations presented on the customer feedback website. Interestingly, the six clusters (airlines and destinations, seat comfort, staff service, entertainment, ground service, and value for money) received from qualitative semantic network analysis were quite similar to the six assessment points (seat comfort, food and beverage, entertainment, ground service, and value for money) that Skytrax asks customers to evaluate on the website. Thus, this study quantitatively analyzed the impact of the relationship between the six Skytrax assessment clusters, customer satisfaction, and recommendations.
The coming implications can be predicted by taking both qualitative and quantitative analysis.
Firstly, in the linear regression analysis of CIS airlines for customer satisfaction as a dependent variable, the group showing the highest beta coefficient was value for money, and the related words were price, money, value, and cost, as shown through the semantic network analysis. This group contained less words than the other group. It was still the most crucial factor to find out the customer experience of airlines, although customers did not often mention the words related with value for money on the online review. Value for money is the key point as a category for negative and positive eWOM. To be precise, the airline passengers who consideed value for money as very good and excellent also gave satisfied eWOM about the airlines’ places, staff, food, and entertainment. Additionally, the influence of value for money was discovered with quality service on consumer satisfaction and recommendation. Therefore, the airline should pay attention to the most important intangible and tangible sources on the value for money.
The second highest beta value in linear regression was staff, and the related words were crew, staff, cabin, attendant, smile, kind and attitude, as shown through the semantic network analysis. Services made from well-trained employees have been a crucial key point in creating a good image in the service industry. Therefore, it is important to raise the character of employees through systematic service training because it can be seen as part of a company that must always be managed to maintain the company’s image. In addition, increasing employee satisfaction with airlines may be another solution to provide a better working environment for consumers.
Thirdly, the entertainment group received from the CONCOR analysis included two points (entertainment, F & B) of passenger evaluation factors on the Skytrax website. The words relating with entertainment, as concluded in the online review context, were service, food, entertain, economy, mean, quality, class, drink, premium, breakfast, wine, dinner, and movie, as shown through the semantic network analysis. As the result of regression analysis shows, the evaluation factor on the Skytrax of entertainment had no influence on consumer satisfaction and recommendation. But, the other evaluation factor of F & B had an influence on consumer satisfaction and recommendation. To be precise, the conclusions related to F & B are important, and found out in the recent study as a critical consumer satisfaction key in the tourism industry.
Fourthly, the place took 15th place in the list of 100 most popular words, and related words were flight, place, time, hour, path, leg, plane, travel, legroom, comfort, board, room, route, and option, shown by analyzing the semantic network. In addition, seat comfort influenced customer satisfaction and recommendations through linear regression analysis. The airline industry is characterized by a narrow space with many people, so seat comfort can have a significant impact on customer satisfaction and recommendations.
Fifthly, the words related to ground handling were lounge, bag, bus, and ticket. If “seat comfort is the physical environment in the room”, the ground service can be a physical external environment providing a comfortable environment outside the aircraft. Therefore, airlines have to provide extra care in the lounge. Most importantly, the lounge for waiting and the waiting time will be good opportunities to provide good service for passengers. F & B that is served in the lounge is totally necessary for a comfortable stay in the room. Ground services are represented in linear regression results, which have a crucial positive impact on both customer satisfaction and their recommendations. Airlines can satisfy passengers and create positive images by paying attention to the quality of baggage claim services, ticket services needed to board an airplane, and the quality of service provided on limousine buses.
In the end, comparing the results of the online review analysis about CIS airlines and Korean airlines, the flow of words from frequency analysis were generally similar. At the top of the list, the words seat and food stood out, and in common, the words entertain were also seen. On the other hand, CIS airlines ranked much higher on drink than Korean airlines, and words such as security and baggage were also at the top of the list, indicating that customers who use CIS airlines are more likely to mention it than entertainment and care about security. In addition, both airlines need to implement promotions in which the amount of money is the most important factor in value associated with the amount, and the importance of employee training is all in common.
This study presents an academic sense that the study expanded its scope of semantic network analysis. When given the importance of the airline part in the tourism industry, this research discovered airline experience, consumer satisfaction, and the advice of big data analytics. In addition, the airlines have the opportunity to take an understanding of the factors on the review website in order to penetrate this market and create appropriate marketing strategies for their strong advantages. Understanding online reviews as a manifestation of passenger experience can help airlines identify key characteristics needed to achieve positive postpurchase behavior and minimize negative intentions. Thus, online reviews not only provide airlines with an effective way to collect feedback from passengers, but also provide an opportunity to learn how to generate positive intentions after the experience. To make a high consumer rates and a positive eWOM rating, airlines may think of seat comfort, staff, F & B, ground service, and value for money. Among all of them, value for money was the most impactful part of regression analysis. These key factors can be used to test customer satisfaction or to test theoretical models to better understand airline passenger behavior.
In practice, analysis of online reviews can also be utilized by managers as a diagnostic tool, because consumer feedback is crucial for airlines to enhance services and products, and also to take action regarding services. The analysis as well represents the level of significance of these service attributes, so that airlines can appropriately use their resources. Online reviews are able to provide a satisfactory rating for airline companies. Companies may also utilize this practice to analyze passenger reviews of their competitors so that they can compare themselves with competitors in terms of customer satisfaction. These comments may be used for sustainable strategic marketing conclusions against competitors.
6. Conclusions
The implications of this research can be suggested from theoretical and practice. Regarding the theoretical implications of this study, big data analytics with text mining analysis, semantic network analysis with the top 100 frequency words, frequency analysis, and linear regression analysis are shown in the research with a methodology. Unlike the traditional research methodology, big data analysis for big data processing is more complicated. There are more and more programs, methods, and advanced algorithms for big data analysis. This study largely provides new methods of data analysis for big data using a variety of statistical programs, like UCINET, SPSS, etc.
More importantly, the development of data analysis in this study was strongly based on the previous literature, which can be a guide for future research. While given the great economic influence on the destination, practitioners associated with the destination, based upon the results of the analysis, should take measures to enhance these issues. On top of that, the creation of channels without language restrictions for customers expressing their experience on cruises will be necessary and useful, so it becomes more convenient and possible to provide new and promising opportunities for tourism marketers to better comprehend their consumers and, finally, the chance to connect with potential customers.
The conclusions of this study help to better understand how to discover and improve the quality of services, as well as increase customer satisfaction. More fundamentally, cruise lines and tourism-related companies, such as CLIA, FFIA, will have a deeper understanding of how to explore and expand their world market. To complete this thesis successfully, some of the limitations of the research we encountered during the research process should be more explained. First of all, for the database, we used airline travelers’ online reviews on the Skytrax website, which is based mainly in English. There were also many comments about this site on other social networks and forums that discussed the employees of Skytrax. In total, 80% of comments discussed that writing the review is simple, but not since the wait for it to be officially published on the network. Skytrax have pretty clear rules for everyone to write an online review.
This study can be improved by adding more types of airlines to the analysis target and dividing them according to geographical area. This step will help make the sample more reliable, and research that extends and compares the study to other airlines may produce more comprehensive implications. Last but not least, due to COVID-19, worldwide quarantining mode is on for now, so the airline industry stopped their work in case with boarders closing. Right now, we cannot count the damage for airline industry, but it still grows and makes the airline industry weaker.
Author Contributions
H.-J.B. and A.S. designed the research model. H.-J.B. analyzed online review data, and H.-J.B. and A.S. wrote the paper. H.-S.K. was in charge of review and editing the paper. All authors have read and agreed to the published version of the manuscript.
Funding
This work was supported by the Ministry of Education of the Republic of Korea and the National Research Foundation of Korea (NRF-2019S1A5A2A03049170).
Conflicts of Interest
The authors declare no conflict of interest.
References
- Chen, L.; Li, Y.Q.; Liu, C.H. How airline service quality determines the quantity of repurchase intention-Mediate and moderate effects of brand quality and perceived value. J. Air Trans. Manag. 2019, 75, 185–197. [Google Scholar] [CrossRef]
- Aircraft Aerodynamics and Design Group Stanford University. The Airline Industry. Available online: http://adg.stanford.edu/aa241/intro/airlineindustry.html (accessed on 20 May 2020).
- Arjomandi, A.; Dakpo, K.H.; Seufert, J.H. Have Asian airlines caught up with European Airlines? A by-production efficiency analysis. Trans. Res. Part A Policy Prac. 2018, 116, 389–403. [Google Scholar] [CrossRef]
- Heriyanto, D.S.N.; Putro, Y.M. Challenges and opportunities of the establishment ASEAN open skies policy. Padjadjaran J. Law 2019, 6, 466–488. [Google Scholar]
- Belarmino, A.M.; Koh, Y. How E-WOM motivations vary by hotel review website. Int. J. Contemp. Hosp. Manag. 2018, 30, 2730–2751. [Google Scholar] [CrossRef]
- Rajaguru, R. Role of value for money and service quality on behavioural intention: A study of full service and low cost airlines. J. Air Trans. Manag. 2016, 53, 114–122. [Google Scholar] [CrossRef]
- Korean Tourism Organization. Russian Tourism Market Analysis. Available online: https://kto.visitkorea.or.kr/kor/notice/data/report/org/board/view.kto?id=306350&rnum=289 (accessed on 18 October 2020).
- Sampson, R.J. Great American City: Chicago and the Enduring Neighborhood Effect; University of Chicago Press: Chicago, IL, USA, 2012. [Google Scholar]
- Knorr, A. Big data, customer relationship and revenue management in the airline industry: What future role for frequent flyer programs? Rev. Integr. Bus. Econo. Res. 2019, 8, 38–51. [Google Scholar]
- Muturi, D.; Sagwe, J.; Namukasa, J. The influence of airline service quality on passenger satisfaction and loyalty. TQM J. 2013, 25, 520–532. [Google Scholar]
- Hausladen, I.; Schosser, M. Towards a maturity model for big data analytics in airline network planning. J. Air Trans. Manag. 2020, 82, 101721. [Google Scholar] [CrossRef]
- Brochado, A.; Rita, P.; Oliveira, C.; Oliveira, F. Airline passengers’ perceptions of service quality: Themes in online reviews. Inter. J. Contemp. Hosp. Manag. 2019, 31, 855–873. [Google Scholar] [CrossRef]
- Pérezgonzález, J.D.; Gilbey, A. Predicting Skytrax airport rankings from customer reviews. J. Airpt. Manag. 2011, 5, 335–339. [Google Scholar]
- Scotti, D.; Volta, N. Profitability change in the global airline industry. Trans. Res. Part E Log. Trans. Rev. 2017, 102, 1–12. [Google Scholar] [CrossRef]
- Amankwah-Amoah, J. Stepping up and stepping out of COVID-19: New challenges for environmental sustainability policies in the global airline industry. J. Clean. Product. 2020, 271, 123000. [Google Scholar] [CrossRef]
- Siering, M.; Deokar, A.V.; Janze, C. Disentangling consumer recommendations: Explaining and predicting airline recommendations based on online reviews. Decis. Support Syst. 2018, 107, 52–63. [Google Scholar] [CrossRef]
- Song, C.; Guo, J.; Zhuang, J. Analyzing passengers’ emotions following flight delays-a 2011–2019 case study on SKYTRAX comments. J. Air Trans. Manag. 2020, 89, 101903. [Google Scholar] [CrossRef]
- Adeniran, A.; Fadare, S.O. Relationship between passengers’ satisfaction and service quality in murtala muhammed international airport, Lagos, Nigeria. Int. J. Res. Ind. Eng. 2018, 7, 349–369. [Google Scholar]
- Jeong, E.Y. Analyze of Airlines Online-reviews: Focusing on Skytrax. J. Tour. Leis. Res. 2017, 2, 261–276. [Google Scholar]
- Yayla-Kullu, H.M.; Tansitpong, P. A critical evaluation of US airlines’ service quality performance: Lower costs vs. satisfied customers. J. Manag. Strategy 2013, 4, 1. [Google Scholar] [CrossRef]
- Lohmann, G.; Albers, S.; Koch, B.; Pavlovich, K. From hub to tourist destination–An explorative study of Singapore and Dubai’s aviation-based transformation. J. Air Transp. Manag. 2009, 15, 205–211. [Google Scholar] [CrossRef]
- Mason, K.J.; Morrison, W.G. Towards a means of consistently comparing airline business models with an application to the ‘low cost’ airline sector. Res. Transp. Econ. 2008, 24, 75–84. [Google Scholar] [CrossRef]
- Park, J.W.; Robertson, R.; Wu, C.L. The effects of individual dimensions of airline service quality: Findings from Australian domestic air passengers. J. Hosp. Tour. Manag. 2006, 13, 161–176. [Google Scholar] [CrossRef]
- Gillen, D.; Lall, A. Competitive advantage of low-cost carriers: Some implications for airports. J. Air Transp. Manag. 2004, 10, 41–50. [Google Scholar] [CrossRef]
- Kim, S.; Kandampully, J.; Bilgihan, A. The influence of eWOM communications: An application of online social network framework. Comput. Human Behav. 2018, 80, 243–254. [Google Scholar] [CrossRef]
- Bhandari, R.S.; Bansal, A. A study of characteristics of e-WoM affecting consumer’s social media opinion behavior. J. Indian Manag. Strategy 2019, 24, 33–43. [Google Scholar] [CrossRef]
- Kim, H.S.; Noh, Y. Elicitation of design factors through big data analysis of online customer reviews for washing machines. J. Mech. Sci. Technol. 2019, 33, 2785–2795. [Google Scholar] [CrossRef]
- Ban, H.J.; Kim, H.S. A study on the TripAdvisor review analysis of restaurant recognition in Busan 1: Especially concerning English reviews. Culi. Sci. Hosp. Res. 2019, 25, 1–11. [Google Scholar]
- Skytrax. World Airline Awards. Available online: http://www.worldairlineawards.com/ (accessed on 20 March 2019).
- Ban, H.J.; Kim, H.S. Understanding customer experience and satisfaction through airline passengers’ online review. Sustainability 2019, 11, 4066. [Google Scholar] [CrossRef]


Publisher’s Note: MDPI stays neutral with regard to jurisdictional claims in published maps and institutional affiliations. |
© 2020 by the authors. Licensee MDPI, Basel, Switzerland. This article is an open access article distributed under the terms and conditions of the Creative Commons Attribution (CC BY) license (http://creativecommons.org/licenses/by/4.0/).