Abstract
The municipality of Bergen in Norway aims to densify fifty per cent of new housing within the city’s central parts. The Ministry of Local Government and Modernisation ordered and financed an investigation to be carried out by the Western Norway University of Applied Sciences and the consulting firm Asplan Viak to give research-based input to the densification strategy debate in Bergen. This article demonstrates how the Space Syntax method can be applied to urban densification strategies in urban planning and policy making. The Geographical Information System (GIS) is used to obtain, select, and aggregate operational information. First, the spatial attributes that constitute an area’s attractiveness were registered. Then, this analysis was modelled after the Spacescape® method. Next, the Space Syntax methodology was applied to predict to-movement and through-movement flow potentials. Finally, through weighting the relevant parameters, including impediments such as land ownership, twelve areas were identified as having major potential for transformation based on their overall score. As it turns out, the spatial structure of the street and road network is the underlying driver for how and where to densify. Now, the challenge is how to apply this knowledge into current planning practice.
1. Introduction
What kind of scientifically grounded analysis tools can be used for making densification strategies in cities? At present, the municipality of Bergen in Norway has launched a new urban development strategy of densification, that is, fifty per cent of the total needs for new housing should be realised within Bergen’s central parts. This strategy is radically different from previous strategies that facilitated urban sprawl, car dependency and, consequently, low socioeconomic interaction and anti-urban neighbourhoods. These strategies have been generally employed in most Norwegian towns and cities. The recent shift in policy reflects a global trend of moving towards low-carbon, low-emission cities in the battle against climate change, global warming, and dwindling resources. Subsequent national and local objectives aim at reducing urban sprawl into the countryside, as well as transporting energy usage by investing in public transport and increasing the building intensity and land-use mix around these public transport lines. In the following, first, we provide an overview of the recent planning history of Bergen. Next, we present the current planning challenges and approaches to deal with them. Finally, we present the results with the Space Syntax approach.
After thirty years of urban planning with an emphasis on facilitating private car accessibility, in 1990, the Bergen Municipality in Norway changed their planning focus on urban public space by transforming the inner-city public spaces from car-dominated to pedestrian-friendly areas. The challenge was to identify the basic spatial characteristics that could generate urban areas with pedestrian-friendly public spaces and street life. A study was conducted showing the overall and local relationships among the natural landscape, built-up environment, and public spaces. The method had a place-phenomenological approach, inspired by the work of Christian Norberg-Schulz [1,2]. The place analyses of Bergen consisted of handmade sketches carried out by various architects [3], as shown in Figure 1. The knowledge gained was important for establishing a successful long-term process of transforming dilapidated public areas into attractive, lively urban places with a view to understand and strengthen Bergen’s place identity. The municipality of Bergen received several national awards for this turn-around operation, such as the Bolig og byplanprisen (1994), Norsk forms hederspris (1995), Statens byggeskikkspris for byrom i Bergen (2002), and the new light rail was awarded with the following prizes: Kollektivprisen (2012), Boby - byutviklingspris (2012), Vegdirektørens pris for vakre veger (2012), and the international award Worldwide project of the year (2011).
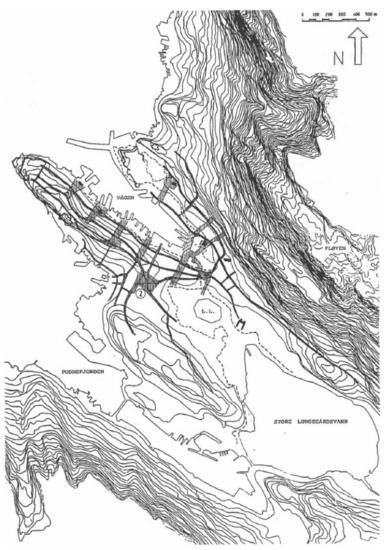
Figure 1.
The character of Bergen’s public spaces and landscapes.
Today, new planning challenges and opportunities are emerging. On the one hand, in light of sustainable urban development, the task is to discover where and how to densify the built mass in a sensible and environmentally friendly manner, whilst maintaining profitability. On the other hand, a revolution has taken place regarding the automation and availability of data and digital maps. In addition, a number of scientifically grounded spatial analysis methods and tools have been developed. Thus, instead of registrations on handmade maps, we have a number of electronic tools at our disposal for analysing complex environmental situations.
In Bergen, several resolutions have been adopted to improve the urban environment. The primary goals are to stop the growth of private car use and reduce greenhouse gas emissions [4]. The municipality tries to achieve these goals by changing their policies from an urban sprawl strategy to a compact city strategy focusing on the city’s central parts, as shown in Figure 2 (left). This is meant to improve walkability and support effective and reliable public transport. The reasoning is that short walking distances and a well-functioning public transport system yield high numbers of users, which in turn requires high building densities and a high degree of land use diversity.
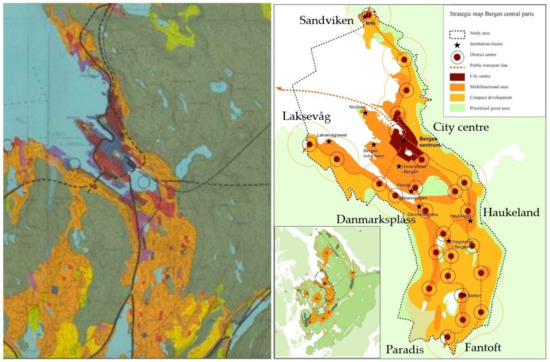
Figure 2.
(right) Municipal land use plan from 1980; (left) Strategic spatial planning map for Bergen’s central parts from 2016.
The central areas of Bergen, shown in Figure 3, make up 12% of the total built-up areas in the Bergen municipality. At present, the population density of the whole municipality of Bergen is 630 inhabitants per km2, whilst the central areas have a population density of 2111 inhabitants per km2. The municipality of Bergen has 281,190 inhabitants, of which 83,669 live in these central areas.
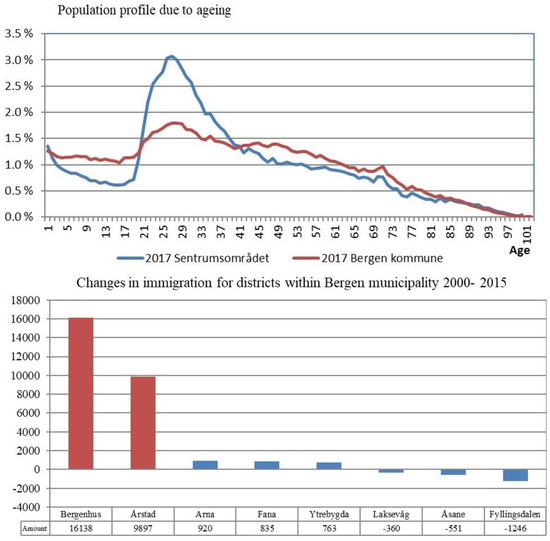
Figure 3.
(Top) Population profile due to aging for the study area (red) and Bergen municipality (blue); (Bottom) Changes in immigration for districts within Bergen municipality 2000–2015.
The central parts of Bergen are expected to facilitate almost half of the new housing stock, which would account for approximately 10,000 new dwellings by 2030. This area is already largely filled with different building types and a large variation of urban functions. Bergen’s city centre contains protected heritage objects of local, national, and international importance. The city centre’s dense structure results from its topographical situation, sandwiched between steep mountains and the fjord. This forms the basis for Bergen’s unique place identity that is treasured and admired by visitors and locals alike. The remainder of the densification area covers the areas from Sandviken and Laksevåg on the seafront to Fantoft and Paradis up into the valley. These neighbourhoods have a predominantly suburban settlement pattern with many low-density buildings surrounded by trees and vegetation. There are few urban centres outside the historic city core, and the low-density residential neighbourhoods are heavily car dependent.
2. Current Paradigm in Urban Planning
Current planning policies in Europe put “smart” growth, high building density, and high diversity of urban functions within short walking distances on the agenda to create compact cities (see for example [5,6]). However, the social and environmental sustainability of building a compact urban form is disputed [7] (p. 385). The compact city has the advantage of providing short walking distances between destinations. The ecological footprint for mobility per capita is relatively small as compared with sprawling urban areas. There are advantages to social and economic intensity, such as a high number of people living relatively close to each other paves the way for more social and economic interaction and, from an environmental perspective, less infrastructure is needed per user, and energy usage for transport between destinations in compact cities is low. However, compact urban form often leads to a lack of green spaces for recreation, biodiversity, runoff water management, and food production.
Conversely, the concept of a green city carries positive connotations in terms of well-being and attractiveness. A green city has the advantage of being able to provide its inhabitants with space for outdoor recreation and the possibility to enjoy nature, produce food, and manage water runoff. However, since green cities tend to have low building density, they contribute to urban sprawl into the countryside as the city expands. Moreover, the amount of infrastructure per user is high, and the potential for social and economic activity is low. The contradictions between green cities and compact cities continue to cause a lack of understanding about what constitutes a sustainable city within the fields of urban design and planning to this day [7].
If density is one of the requirements for urban quality, namely high social and economic interaction, then urban development projects should always facilitate maintaining, and where desirable increasing, the level of building density. High building density is considered to contribute to sustainable development because, on the one hand, it implies the sharing of buildable space, facilities, and infrastructure, and on the other hand, the reduction of travelling distances. This sharing implies that the amount of land and energy resources required to perform all urban activities is reduced. Therefore, the degree of this sharing’s success can be seen as an indicator of urban quality. Jane Jacobs [8] and Jan Gehl [9] argued that sufficient density with a large variation of land use was one requirement for life between buildings. More importantly, life between buildings was ”potentially a self-reinforcing process”, in which, ”once this process has begun, the total activity is nearly always greater and more complex than the sum of the originally involved component activities” [9] (p. 73). In other words, a successful urban area is self-propelling by merit of the amount and duration of outdoor activities that it generates.
The Local Context
The background for the research is a project initiated by the Bergen municipality that intends to explore where and how to densify existing urban areas. The aim is to use the outcomes in future land use and policy planning as a strategy for densification in the central areas of Bergen. On the basis of the “Denser Stockholm” project, an analysis was made to identify both the need for densification and the suitable places for densification. With the GIS-based method, various types of densification were identified and classified depending on different driving forces such as political and legal systems, the need for space versus available space, and accessibility to adjacent functions and services [10].
Successful densification is determined by natural movement patterns that result from the spatial configuration of the street network and public transport coverage. Streets with high amounts of people moving through them are most suitable for densification. Space Syntax methodology can make predictions of movement patterns and, as such, determine where natural urban transformation is likely and desirable to occur [11,12].
The Norwegian Ministry of Local Government and Modernisation financed this inquiry to test out the analysis tools on Bergen and reveal various densification potentials. The Ministry expressed particular interest in whether or not, and how, the Space Syntax and Spacescape methods could be integrated into one common method for identifying densification potential in the study area. Because context-independent methods were used, it was possible to conduct an independent comparison of data to search for possible co-relations between spatial configuration and socioeconomic parameters related to city planning. The study formed the background and outcome for a feasibility study, on the densification strategy of the central parts of Bergen [13].
Complex legal issues related to private property rights pose a serious problem for large scale urban planning and transformation of urban areas in Norway. As stated in paragraph 105 of the Norwegian Constitutional Law of 1814, “no one should be dispossessed of their private property, and if so, they should be given full compensation” [14] (p. 12). This explains why urban expansions in Norway tend to take place on large plots where one only has to deal with a few property owners. Conversely, large-scale urban renewal or transformation projects involve time-consuming negotiations with property owners. In some cases, property borders need to be adjusted.
Since 1980, Bergen’s demographics have changed dramatically. Between 1980 and 2000, the centre population decreased by 7000, despite large investments for upgrading and renewing the city centre. However, between 2000 and 2017, the population of Bergen’s inner-city areas increased by 15,000. This was a result of improved housing standards during the 1980s and 1990s, which contributed to an improvement in Bergen’s city centre image. In addition, various environmental measures were carried out from 2000 onward, and a number of higher education institutions were reinforced or established. All these efforts contributed to an increase in the number of residents living in Bergen’s city centre.
Figure 3 shows a survey of migration within the municipality. The municipality of Bergen consists of eight districts. Two of these districts are situated within the study area (Bergenhus and Årstad). The vast majority of people moving to the municipality prefer to live in one of these two districts. For the other six, the net population changes between 2000 and 2015 were marginal. Most of the new inhabitants are students, young couples, and single households [13].
During this inquiry, a change took place in the municipality’s land use policy. Figure 2 shows two different proposals for the municipality’s land use strategy for Bergen’s central areas. Figure 2 (right) is the land use strategy from 1980 [15] and Figure 2 (left) is the current strategy from 2016 [13]. The 1980′s plan still supported car-based urban sprawl by proposing building sites in the peripheral areas (coloured in light yellow). There was no plan for a public transport network. In the years leading up to the current strategy from 2016, a proposal was made to densify in existing built-up areas instead. A new light rail line was opened in 2010 and extended in 2013 and 2017. Thus, strategies were put in place to open up for densification around areas served by light rail transport. Most of these areas are already urbanised.
If density is a prerequisite for sustainable use, and the number of outdoor activities is an indicator of the degree of success for performing these activities, then, a spatially integrated urban street network is the primary generator of sustainability in the context presented here [16]. In this inquiry, we show how the degree of street network and public transport accessibility play a role in the natural urban transformation process. The effect of the light rail, for example, is that property prices near the stops are increasing. Presently, however, these densification processes are taking place without an overall plan.
3. Current Theories and Methods on Urban Space
The approach for finding densification possibilities in Bergen was to consult work from similar studies and apply current urban research practices on the relationships among urban space, urban morphology, and land use. First, a baseline study was made of the existing situation to assess the relation between the spatial configuration of the street and road network, as well as the type of built mass density and the degree of land use diversity. Next, the results from the baseline study were used to formulate sustainable, strategic densification proposals.
3.1. Space Syntax
At present, there are two theories on how cities transform based on Space Syntax research, i.e., the theory of the natural movement economic process [17,18] and the theory of the natural urban transformation process [12]. The theory of the natural movement economic process states that the degree of the street and road network’s spatial integration affects patterns of movement, as well as the location of commercial activities such as shops and retail. The theory of the natural urban transformation process states that the degree of building density and land use diversity is also affected by the degree of the street and road network’s spatial integration. Figure 4 shows diagrams of these two theories, which are able to explain the relationship between cause and effect based on the spatial configuration of the street and road network [19]. The higher the degree of spatial integration of the street network, the higher the density of the built mass and degree of land use mixture. Measuring the degree of the street network’s spatial integration is done by applying the Space Syntax methodology.
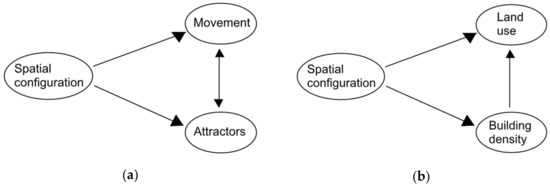
Figure 4.
(a) The theory of the natural movement economic process; (b) The theory of the natural urban transformation process.
Space Syntax is a form of accessibility analysis. The Space Syntax method allows for calculating how every street segment relates to all others based on the total number of directional changes (called topological distance) and the degree of angular deviation (called geometrical distance). This can be analysed on different scale levels, i.e., local centralities and main centres can be identified by calculating topological distance with respectively low or high metric radii. This is the street and road network’s “to-movement potential”. Likewise, the main routes for pedestrians and car traffic can be identified by calculating the geometrical distance with various metric radii. This yields the network’s “through-movement potential”. For both analyses, a radius of 500 m is used to identify the most vital pedestrian-based streets, whereas a radius of 5000 m will detect the main routes, which are mainly car-based streets or potential main routes for public transport. These two radii correspond with approximately 5–6 min walking (500 m) or driving (5000 m).
Figure 5a shows an example of four street segments and Figure 5b,c shows two different justified graphs. Both justified graphs show how street segment A relates to the other street segments B, C. and D. Figure 5a,b is redrawn from Turner [20], while Figure 5c is taken from van Nes and Yamu [21]. The graph in Figure 5b shows the degree of angular deviation, whereas the graph in Figure 5c shows only the number of direction changes from segment A to the other three street segments.
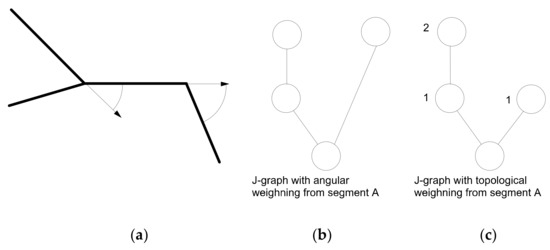
Figure 5.
Two different manners of weighting distance in Space Syntax methodology. (a) Example of four street segments A–D; (b) Justified graph with angular weighting from segment A; (c) Justified graph with topological weighting from segment A.
The most recent Space Syntax calculations applied in this project are the angular choice and angular integration analyses for each street and road segment [22]. These calculations are based on the angular weighting from Figure 5. The formula of angular choice C of a segment i is as follows [23] (p. 64):
where gjk (i) is the number of shortest paths between segment j and k containing i, and gjk is the number of all shortest paths between j and k. The angular choice shows the through-movement potentials for each street segment in relation to all others.
The formula for the angular integration (AI) of a segment x is:
where n is the number of segments and dθ the angle between any two segments on the shortest path on a segment x and when adding the length l of segments [23] (p. 66):
The angular integration analyses show the potential to-movement potentials. Shops and commercial activities tend to seek for locations with both high to-, as well as through-movement, potentials [21].
3.2. Urban Morphology: Spacematrix
The latest contribution to the urban morphology approach is Johan Rådberg’s method of simultaneously quantifying building density and building form. Rådberg created a matrix where building intensity (or Floor Space Index, FSI) was correlated with plot coverage (or Ground Space Index, GSI). With this matrix, a classification of various types of building morphology could be made [7]. Through later application of the methodology in PhD research, the method was renamed Spacematrix [24].
Depending on the number of floors, building density is categorised into low-rise, mid-rise, and high-rise density. The categories of building type are furthermore separated into point type, strip type, and block type, depending on the building’s form. Therefore, the entire built environment can be divided into nine categories, as described in Table 1.

Table 1.
Categorisation of the built environment.
Figure 6a shows a simple illustration of how types of building volumes in relation to their plots are placed in a Spacematrix scheme. Figure 6b shows a Spacematrix analysis applied on Bergen’s city centre. Most of these building types can be found in every major town or city. The analysis is conducted manually, with the help of Google Earth and Google Street view, or by querying two georeferenced shapefiles containing FSI (building) and GSI (plot) data. Then, Spacematrix describes both the intensity of the built mass (through FSI) and plot coverage (through GSI), as well as the spaciousness of the non-built space (through OSR, open space ratio), quantitatively. This makes differentiating between urban forms more accurate and more efficient than before [7].
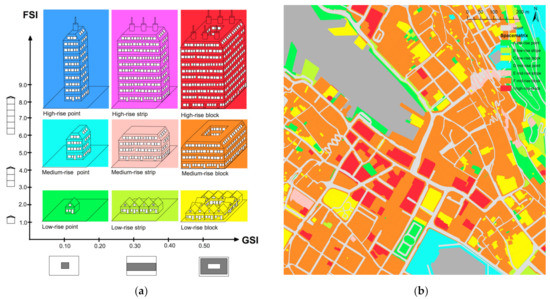
Figure 6.
(a) The principles of the Spacematrix method. (b) An analysis of Bergen’s city centre (right).
Figure 7 is adapted from Rådberg [7] and shows how different building types can be accurately and objectively categorised according to building intensity (FSI, on the y-axis), plot coverage (GSI, on the x-axis), and the total number of floors (L).
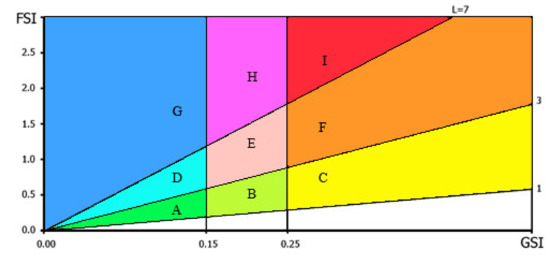
Figure 7.
Building morphology categorisation based on FSI (y-axis), GSI (x-axis), and number of floors (L).
3.3. Functional Diversity: The Mixed Land Use Index
Van der Hoek developed a triangle matrix with that could be used to quantify land use diversity. The method is named the mixed land use index (MXI). Buildings that have only a single function, such as dwellings, working places (industrial areas or offices parks), or amenities (leisure activities such as sports, shopping, etc.) are defined to be monofunctional. Buildings are bifunctional when two of these three functions are present, and they are multifunctional when all three functions are present [25].
The original MXI model measures the percentage of housing, working space, and amenities occupying urban blocks. The function “housing” includes various residential dwellings, such as apartments, condominiums, and townhouses. The function “working” encompasses workplaces such as offices, factories, and laboratories. The function “amenities” covers commercial facilities such as shops, leisure facilities such as sporting arenas, cinemas, concert halls, and museums, and social amenities such as healthcare facilities, educational institutions, and community centres. Consisting of three variables, MXI is defined as the percentage of each variable and sums to a constant:
MXI = (%Housing/%Working/%Amenities)
The weakness of this matrix is that the categorisation can be ambiguous. For example, a shop or a sports centre can be considered to be an amenity for the customers, whereas it is a workplace for the employees. As Dovey and Pavka also pointed out, a distinction between the level of attraction or the temporal distribution of activities was lacking [26] (p. 255). Improvements are needed to fine-tune this definition for the MXI method. Despite its shortcomings, however, the mixed land use index is a useful method for describing the degree of monofunctionality versus multifunctionality. Figure 8a is a ternary plot, a graphic depiction of the ratios of the three MXI variables as positions in an equilateral triangle. Monofunctional areas wind up at the edges of the triangle, whereas multifunctional areas are categorised in the middle of the triangle. Historical town or city centres tend to have a balanced mixture of dwellings, working places, and amenities; this is also the case in Bergen’s city centre. As can be seen in Figure 8b, there are various multifunctional buildings in the historic centre, as well as many amenities and workplaces. Conversely, many modernist urban areas tend to have a strict separation of functions, resulting in predominantly monofunctional areas.
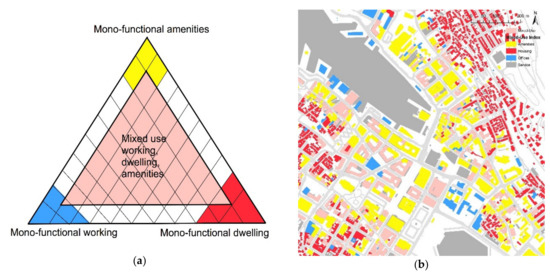
Figure 8.
(a) The principle of the MXI method; (b) The analysis of Bergen’s city centre.
4. Approach and Application for Bergen
The project started with an identification of the types of densification actions. Following Sandkjær Hansen [27], three types were identified, i.e., intensification, transformation and expansion. Intensification entails densifying the built mass in existing urban areas by, for example, enlarging building volumes upon renewal or renovation. The transformation strategy concerns identifying and assessing the densification potentials of larger urban areas that would require a comprehensive functional transformation, such as harbour fronts, goods terminals, and industrial estates. The expansion strategy utilises densification opportunities in previously unbuilt areas within city limits. In the Bergen case, the latter were often found on mountain slopes, where development had not previously been considered due to costly technical challenges. The area of investigation is located in a valley of about 7 km in length and 2 km across, between steep mountainsides and the fjord. All major communication lines are located at the lower parts of the valley. It proved to be difficult to establish suitable areas for city expansion on the mountainsides. Regarding expansion towards the waterfront, most suitable areas have already come under development expansion projects. Possibilities for intensification are addressed at a later stage (see Section 6). The task for this study was, therefore, to focus on identifying and analysing potential transformation areas.
A base map was created from 160 basic statistic units (called grunnkrets). Each of these units could be referred to and conveyed data from the National Statistics Agency and planning and property information with the municipality of Bergen as a source. Maps based on these statistical units made it possible to compare the results of various spatial analyses. One challenge was to assess what kind of information was relevant for co-relating, with a view to gain relevant new knowledge. The second challenge related to the amount of information that could be shown in one map. A map that contained too much information lost its meaning and readability.
The results from the baseline studies followed the theories on the natural movement economic process and natural urban transformation process. The highest densification pressure was found around the spatially integrated main routes, the various spatially integrated local centres, and near the public transport stops. This densification pressure was reflected in the average square meter price in the property market. Currently, the average square meter price for an apartment in the city centre is approximately 57,000 NOK (€5760) and in the suburbs around 35,000 NOK (€3500). Locally, discrepancies may be found, which can likely be attributed to unique landscape elements such as the mountain slopes and fjords surrounding the city. This challenging topography is also responsible for the characteristic capricious road pattern, which follows height lines to keep gradients acceptable from a road-engineering point of view.
5. Results
In the following, we present the results from the Spacescape report and various spatial analyses, i.e., Space Syntax, Spacematrix and function mix (MXI), for Bergen’s central areas. The methods used in the Spacescape report consist of overlapping thematic GIS registrations using an aggregate map that summarises the results of all these themes. Topics that were examined included the density of working places and housing, frequency of public transport, local axial integration of the street network, and commercial and service activities. Figure 9 shows the most useful thematic maps. The higher the concentration of various facilities, the higher the attractiveness and desirability to live in or near these areas. This is mirrored in the property prices, where the highest square meter prices can be found in the city centre.
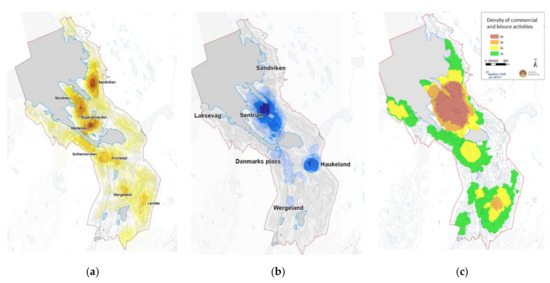
Figure 9.
(a) Housing density; (b) Workplace density; (c) Density of amenities.
Three thematic maps that address functionality and density were juxtaposed with each other. Figure 9 shows housing density (Figure 9a), density of working activities (Figure 9b), and density of commercial and leisure activities such as trade, public and private service, culture, and education (Figure 9c). According to most writings on compact cities, a compact city has a high density of built mass, a high degree of land use diversity, a high number of services, and a high accessibility and frequency of public transport [28,29,30]. The maps of Figure 9 seem to confirm that the historical city centre is the most compact part within the study area, followed by Danmarksplass. These areas also have good public transport accessibility.
To analyse the attractiveness of Bergen, eight variables were mapped. These are listed in Table 2. The Spacescape method operates with seven variables. The difference is that, contrary to Bergen, sun conditions were deemed irrelevant for Stockholm. Furthermore, a regular street structure was considered to be important for Stockholm, whilst Bergen has a more pluralistic urban structure. In addition, the population’s socioeconomic status and living conditions were considered to be relevant for Bergen but not for Stockholm.
Table 2.
Attractiveness variables.
Twelve major transformation areas were identified through overlapping the attractiveness variables from Table 2. These areas were analysed according to attractiveness, ongoing planning activities, ownership, potential obstructions related to implementation, and capacity. The total capacity for the twelve development areas was summed up. The potential turned out to be considerable, with room for realising approximately 10,000 new dwellings and a 1,000,000 m2 public programme. On the basis of a discretionary assessment, a division was made into 50% dwellings and 50% urban functions. This could increase the total housing stock by as much as 25%, which would, in turn, trigger the need for new social and commercial amenities.
When it comes to implementation, all densification projects are difficult. Moreover, some areas face critical obstructing factors such as unclear ownership or underlying diffuse agreements outside the power and authority of the municipality. Such areas are considered to be immature with regard to starting a planning process, let alone programming. Figure 10a provides an overview of land ownership in Bergen, with the twelve development areas marked out. In some development areas, the public sector is the dominant owner. Regarding the others, the land is predominantly privately owned. When it comes to planning and implementation, the strategy that deals with privately owned land is quite demanding with respect to fulfilling public goals, in this case cross-sectoral goals specified by the municipality. A challenge the municipality faces is that the central government has organised its activities into a large number of companies acting as if they are private and with economic income as a prime objective. Due to the strong property rights in Norway, it is the local owners who decide whether they will densify or not. However, if property prices rise due to the increased accessibility of the road, street, and public transport network, it acts as an incitement for property owners to densify.
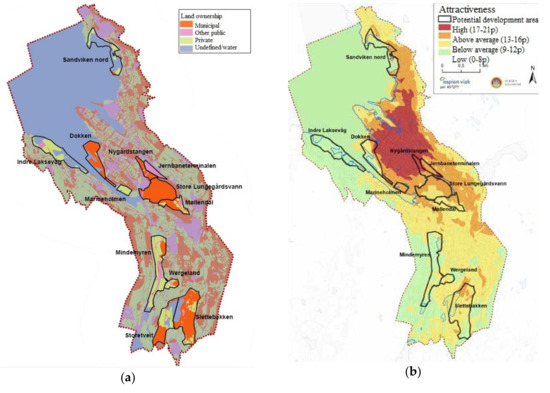
Figure 10.
(a) Development areas overlapped on land ownership; (b) Summary map of attractiveness variables.
The summary map of all themes, shown in Figure 10b, demonstrates a great variety in the attractiveness of the twelve development areas. According to the overall score, the centre and its immediate surroundings to the north and east have high and above average attractiveness. The other areas, in yellow, have below average attractiveness, with the lowest attractiveness found to the west and southwest. There is a clear concurrence between the most attractive areas and the compactness of Bergen, i.e., the more compact the area, the higher the overall score on the scale of attractiveness. Furthermore, Bergen has a clear, more attractive “east end” and less attractive “west end”. Especially in winter, the east side has far better sun exposure than the neighbourhoods on the shaded slopes to the west. This is reflected by the area’s socioeconomic performance.
So far, twelve densification areas were identified around the city centre. The next step is to find out how to densify. Here a more robust and objective method is required than the discretionary assessment method used earlier. To that end, the latest Space Syntax analyses of to-movement and through-movement potentials [30] were added to this inquiry.
According to the theory of the natural movement economic process and theory of the natural urban transformation process, the spatial configuration of the street and road network matters. When the street network is integrated on all scale levels, the densification pressure is higher, and if a high degree of land use diversity is facilitated, walking distances between the various functions become shorter. To this end, we wanted to add a more objective approach to identify how and where to densify, in addition to the subjective discretionary approaches used previously. For this, we aggregate the land use mix, building density, and spatial integration of the street and road network into one model. The basis for these three analysis methods is the Space Syntax analyses. Where the spatial integration of the street network is high, on both a citywide and local scale, the degree of building density and land use diversity is also high.
Figure 11 shows the through-movement potential on a citywide scale with a radius of 5000 m, or 5–6 min driving at 50 km/h (Figure 11a), and on a local scale with a radius of 500 m, or 5–6 min walking at 5 km/h (Figure 11b). The red, orange, and yellow streets are the most integrated streets. This indicates that these streets are expected to have relatively high amounts of through traffic. Green and blue shades indicate streets that are relatively segregated from the rest of the street network. On the citywide scale, the main routes stand out. These main routes run largely parallel to the valley and connect the different districts with each other. Car traffic is dominant on these streets. On the local scale, small clusters of locally well-integrated streets are highlighted by the analysis. These streets are likely to be used by pedestrians. Most well-integrated streets are found in the city centre, especially in the Stølen/Indre Sandviken area. Conversely, the dominant green and blue street segments outside the city centre indicate that the street pattern here does not favour pedestrian traffic.
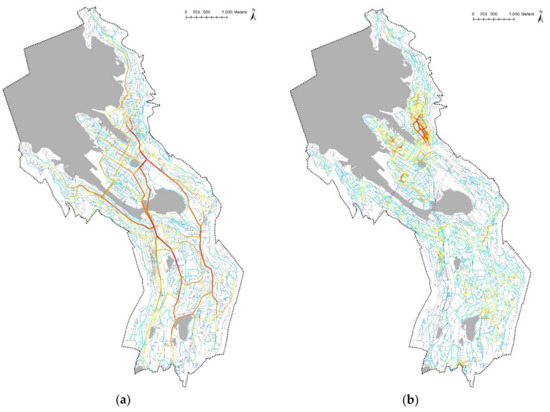
Figure 11.
Space Syntax analyses of through-movement potentials. (a) Angular choice with high radius (R = 5000 m); (b) Angular choice with low radius (R = 500 m).
Figure 12 shows to-movement potentials for Bergen’s city centre with a radius of 5000 m, or 5–6 min driving at 50 km/h (Figure 12a), and a radius of 500 m, or 5–6 min walking at 5 km/h (Figure 12b). Here, too, the analysis with a high radius shows the to-movement potentials on a citywide scale, whereas the analysis with a low radius shows the to-movement potentials on a local scale. Whereas the through-movement potential analyses indicate the potential for the flow of movement throughout a city, the to-movement potential indicates streets that, based on the spatial configuration of the street pattern, are likely to be a destination. On a citywide scale, many streets adjacent to or near the main routes that lead out of the city centre have high to-movement potential. Locally, the orthogonal street network in the city centre scores high, as well as the Stølen/Indre Sandviken area that is highlighted in the local Angular Choice analysis of Figure 11b.
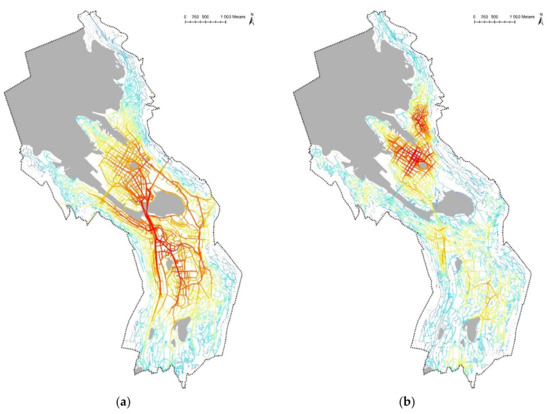
Figure 12.
Space Syntax analyses of to-movement potentials. (a) Angular segment integration with high radius (R = 5000 m); (b) Angular segment integration with low radius (R = 500 m).
The Spacematrix analysis, shown in Figure 13, reveals that the city centre has medium to high density and predominantly closed building blocks. The areas outside the centre core are a mix of low and medium building densities with a large variation in building types. The greater the distance from streets with high through- and to-movement potential, the lower the building density. The analysis shows that the highest FSI and GSI are found in areas with the highest values on all Space Syntax analyses.
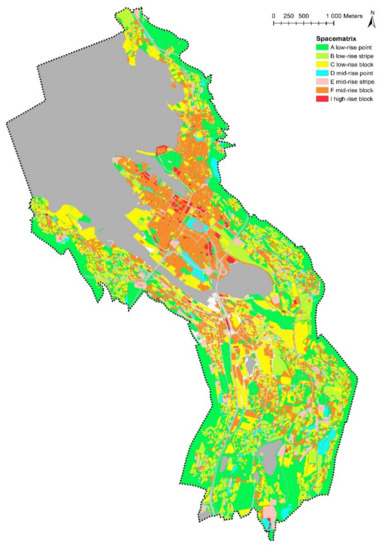
Figure 13.
Spacematrix analysis of building densities and typologies.
Through the MXI analysis shown in Figure 14, it becomes clear that the city centre, with its high to-movement potential on different scale levels, also has the highest concentration of amenities and multifunctional buildings. Outside the centre core, most amenities are situated around Haukeland university hospital, Sletten, and Danmarksplass. Offices and industry are concentrated along the waterfront, the railway line, and at Mindemyren.
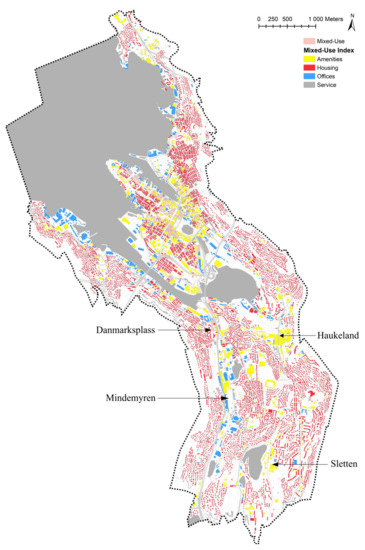
Figure 14.
Mixed land use index analysis of the distribution of functions.
As the Space Syntax, Spacematrix, and MXI analyses of the baseline study of Bergen’s city centre show, the spatial configuration of the street and road network seems to affect the degree of land use mixture and building densities. These results shape the basis for new densification strategies in a more informed and refined manner than proposed in earlier reports.
6. A New Approach for Making Densification Strategies
If the street network really matters for how cities transform naturally [12], how can the Space Syntax approach be used to formulate densification strategies? Here, we aggregate the angular choice value measures with two different radii with one another using the latest Space Syntax method. Building density takes place on plots located along streets. Therefore, the various Space Syntax variables were added to each adjacent plot for every street segment. For the plots surrounded with several street segments with different integration values, the segment with the highest integration value decided the plot value. The next step was to aggregate the Space Syntax measures with low and high metrical radii.
These correlations became useful for formulating recommendations to the Bergen municipality on where and how to densify. If the street network configuration influences how cities transform naturally, some long-term strategies can be made. Evidently, the street network configuration influences the degree of building density and degree of function mix [11,12]. Figure 15 shows how the following four types of densification strategies were identified based on street network integration on the local level (vertical axis) and citywide level (horizontal axis):
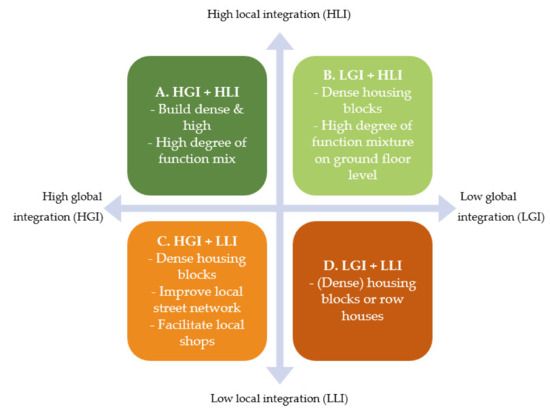
Figure 15.
Strategic densification matrix.
Type A, high local and high citywide integration of the street and road network
Where extra space becomes available, these areas can be transformed with a high density of built mass. The aim is to provide land use plans that allow intensive utilisation of space with a wide range of different public functions, particularly on the ground floor level. Areas suitable for this kind of development in Bergen are the city centre, the harbour areas around the city centre, Danmarksplass, and the industrial area Mindemyren.
Type B, high local, but low citywide integration of the street and road network
Where there is space, these areas can facilitate the high density of dwellings with ground floor spaces for shops, small businesses, and services. Depending on the local circumstances, high-rise buildings can be considered to be an option. As an example, the Sandviken area has many two to three floor high old wooden houses. The type and style of buildings give this area a particular place identity. New buildings will have to adjust to the existing building stock in scale and style to avoid damaging the place identity of the area. Areas suitable for this kind of densification are the various local centres outside Bergen’s city centre. Most of these small local centres are situated along the main routes leading through various urban areas. Areas located along the light rail line also belong in this category.
Type C, low local, but high citywide integration of the street and road network
These locations are suitable for high densities of housing. Where possibilities exist to improve the local street network by improving connections or densifying the street network, local shops on the ground floor can be facilitated. An example of such an area is the southern part of the transformation area Mindemyren.
Type D, low local and low citywide integration of the street and road network
Where there is space to develop, increased densities of only dwellings are desirable. These areas with a low degree of accessibility do not likely have many users, and therefore are not very attractive to shop owners. Examples of these kinds of areas are found on the sloped parts on the edges of the study area.
Figure 16 shows the principles on where and how to densify in one map. It shows that the most highly accessible areas on both scale levels (coloured in dark green) are located in the historic city centre and local centres in the suburbs. Where land is available inside these areas, the pressure to build from various project developers is high. Conversely, in areas with low values (coloured in red), the densification pressure is low due to the high costs of constructing roads up in the mountains and steep hills. On the one hand, for the areas with high global integration but low local integration, the challenge is to make a local, inter-accessible street network with the intention to establish pedestrian-friendly neighbourhoods. This responsibility must be taken on the municipal level. On the other hand, areas with high local integration values but low global integration values, require strategies to enhance social infrastructure before densification can take place.
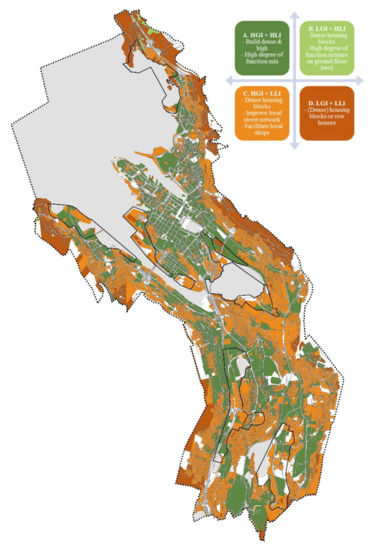
Figure 16.
Strategies for where and how to densify based on the street network configuration.
The launched densification strategy offers new opportunities for politicians and citizens within the municipality to discuss expectations, preferences, and priorities, and subsequently build programmes for each of the development areas seen in a long-term and holistic perspective. By using the latest Space Syntax calculations and aggregating the results with one another, we have attempted to contribute to the densification debate with new knowledge in line with the theory of the natural urban transformation process.
7. Conclusions
In comparison with other European cities that have a similar number of inhabitants, Bergen has a small urban core. Therefore, attention should be paid to areas outside, but adjacent to, the compact city centre, specifically, the three semi-compact areas, public transportation hubs, and low-density neighbourhoods in general.
The first recommendation for the local government is to concentrate attention and efforts for densification strategies on the identified twelve major development areas. This is where the greatest potentials for development are and where the long-term benefits will be the highest. This applies to the use of administrative competence and capacity, as well as the effect of planning efforts. Second, a systematic implementation strategy with a timeline is recommended. The areas that are facing critical obstacles concerning implementation do not have this priority. The time horizon for implementation is recommended to be extended from 2030 to 2050.
Setting a hard target of densifying the compact urban valley by building 10,000 new dwellings, and thus increasing the number of residences in the Bergen valley by 25% within ten years, could have a negative impact on the standards of quality that are desired. There are still too many examples of densification projects with poor urban qualities being implemented. Building permissions are given on the ground that they are in line with the overall aim to densify, but an overall plan is lacking. Furthermore, a long-term strategy ought to be rooted in coordinated, long-term public budgets. In Norway, many planning activities are initiated by the private sector, leading to an increasing number of ”bad” densification projects with anti-urban properties and a lack of proper social infrastructure. If the initial densification projects fail to manifest good urban qualities and create enthusiasm among citizens, decision makers, and politicians, the whole densification strategy can fall and end up propelling an anti-urban sprawl practice. Given that the real estate market is getting more market driven, in combination with strong property rights in Norway, the most significant challenge in current planning practice is to negotiate towards an equitable solution for all stakeholders, property owners, and users.
The map showing great varieties of attractiveness within the twelve development areas (Figure 10b) sends an important message to the involved stakeholders, both investors and planning authorities. By deconstructing the attractiveness map, we can uncover which factors score high or low, and thereby which factors should be refined or strengthened to raise the attractiveness of the various densification areas. While topological aspects such as steep slopes, as well as reduced sun exposure and view are difficult to alter, others, such as accessibility, diversity, and access to amenities, public transport, and green areas can be improved. For areas with lower attractiveness, these factors deserve extra attention, higher economic efforts, and creative, widely supported solutions.
All the aspects mentioned above raise a major challenge. One basic prerequisite for urban transformation in the Norwegian planning context is that developers, mostly private parties, are obliged to cover the expenses of necessary new infrastructure. This is enshrined in a so-called predictability decision, a decision that gives the municipality a mandate to demand financial contributions from the developers through a formalised economic development deal. Here, one is confronted with a dilemma. For the most attractive areas, it is expected that the developer is willing to accept relatively large investments in new infrastructure. Attractive areas will become more attractive. The situation is different for areas with low attractiveness. It is expected that the opportunities for profit are lower and, as a result, the opportunities for greater joint contributions to lift the quality of the public domain could be lower. This can result in a negative spiral where the areas that require the most efforts and resources will receive the least. This finding can contribute to the debate on relations between transformation, the predictability of decisions, and living conditions.Previously, the central government had a policy and rather high budget for improving living conditions. Grants for public investment in socioeconomically vulnerable areas were considerable. Now, however, the central governments have almost abdicated their earlier obligations and left the responsibility for planning and financing almost entirely to the municipalities and private investors. This could lead to a fragmented and incoherent urban densification process with poor urban qualities, a shortage of social infrastructure, and private car dependent street profiles. Seemingly, compact urban forms promote social equity, giving access to jobs for those who cannot afford a car. Creating compact cities with lively urban streets, therefore, requires an overall plan and spatial strategies, something which must be organised on both the national and municipal level. To that end, scientifically grounded spatial tools such as those recommended in this inquiry are needed, both for making strategic plans and for evaluating submitted densification proposals from project developers.
Author Contributions
Conceptualization, all; methodology, R.E.d.K. and A.v.N.; software, R.E.d.K.; validation, all; formal analysis, R.E.d.K.; investigation, R.E.d.K.; resources, H.J.R.; data curation, R.E.d.K.; writing—original draft preparation, all; writing—review and editing, all; visualization, all; supervision, A.v.N. and H.J.R.; project administration, H.J.R.; funding acquisition, H.J.R. All authors have read and agreed to the published version of the manuscript.
Funding
This research was funded by the Municipality of Bergen, Norway.
Acknowledgments
We would like to acknowledge Trygve Andresen, of Asplan Viak, for his contribution of thematic maps for the project and report Strategi for fortetting innenfor Bergens sentrale deler and Yu Ye for helping us with the GIS analyses.
Conflicts of Interest
The authors declare no conflict of interest.
References
- Norberg-Schulz, C. Mellom Jord Og Himmel. In Bok Om Steder Og Hus; Universitetsforlaget: Oslo, Norway, 1971. [Google Scholar]
- Norberg-Schulz, C. Genius Loci; Rizzoli International Publications INC: New York, NY, USA, 1980. [Google Scholar]
- Hansteen, H.J. (Ed.) Bergen Byform; Bergen Kommune, Etat for Byutvikling: Bergen, Norway, 1991. [Google Scholar]
- Bergen Kommune. KPA2016: Kommuneplanens Arealdel: Høringsutkast: Planbeskrivelse; Plan-og bygningsetaten, Bergen Kommune: Bergen, NJ, USA, 2017. [Google Scholar]
- Statlige Planretningslinjer for Samordnet Bolig-, Areal- og Transportplanlegging. Available online: https://www.regjeringen.no/no/dokumenter/Statlige-planretningslinjer-for-samordnet-bolig--areal--og-transportplanlegging/id2001539/ (accessed on 4 November 2020).
- United Nations. Transforming Our World: The 2030 Agenda for Sustainable Development. 2015. Available online: https://sustainabledevelopment.un.org/post2015/transformingourworld/publication (accessed on 4 November 2020).
- Rådberg, J. Towards a theory of sustainability and urban quality; A new method for typological urban classification. In Proceedings of the 14th Conference of the International Association for People-environment Studies, Stockholm, Sweden, 30 July–3 August 1996; pp. 384–392. [Google Scholar]
- Jacobs, J. The Death and Life of Great American Cities; Pimlico: London, UK, 2000. [Google Scholar]
- Gehl, J. Life Between Buildings: Using Public Space; Island Press: Washington DC, USA, 2011. [Google Scholar]
- Spacescape. Stockholm stads utbyggnadspotensial. En analys av 100k och översiktsplanens stadsutvecklingsstrategier; Spacescape & Stockholm Stad: Stockholm, Sweden, 2013. [Google Scholar]
- van Nes, A.; Berghauser Pont, M.; Mashhoodi, B. Combination of space syntax with spacematrix and the mixed use index. The Rotterdam south test case. In Proceedings of the Eight International Space Syntax Symposium, Santiago de Chile, Chile, 2–6 January 2012; pp. 1–29. [Google Scholar]
- Ye, Y.; van Nes, A. Quantitative tools in urban morphology: Combining Space Syntax, Spacematrix and Mixed-Use Index in a GIS framework. Urban. Morphol. 2014, 18, 97–118. [Google Scholar]
- Bergen Kommune. Strategi For Fortetting Innenfor Bergens Sentrale Deler, Rapport 1: Analyse Av Planområdet. Mulighetsstudie Av Store Utviklingsområder. Plan-Og Bygningsetaten; Bergen Kommune: Bergen, Norway, 2018. [Google Scholar]
- Backer, I.L.; Bull, H. Norges Lover 1687-2015; Fagbokforlaget: Bergen, Norway, 2016. [Google Scholar]
- Roald, H.J. Byplanen, en Historie om Utviklingen av Bergen by; Scandinavian Academic Press: Oslo, Norway, 2010. [Google Scholar]
- van Nes, A. The spatial conditions for a vital compact city. The structure of the street net and its impact on urban sustainability. In Proceedings of the 8th Nordic Environmental Social Science Research Conference (NESS) conference, Norwegian Institute for Urban and Regional Research (NIBR), Oslo, Norway, 18–20 June 2007; pp. 28–45. [Google Scholar]
- Hillier, B.; Penn, A.; Banister, D.; Xu, J. Configurational modelling of urban movement networks. Environ. Plan. B Plan. Des. 1998, 25, 59–84. [Google Scholar]
- Hillier, B.; Penn, A.; Hanson, J.; Grajewski, T.; Xu, J. Natural Movement: Or, configuration and attraction in urban pedestrian movement. Environ. Plan. B Plan. Des. 1993, 20, 29–66. [Google Scholar] [CrossRef]
- van Nes, A.; Yamu, C. Exploring Challenges in Space Syntax Theory Building: The Use of Positivist and Hermeneutic Explanatory Models. Sustainability 2020, 12, 7133. [Google Scholar] [CrossRef]
- Turner, A. Angular Analysis. In Proceedings of the 3rd International Space Syntax Symposium, Atlanta, GA, USA, 6–11 May 2001; pp. 30.11–30.31. [Google Scholar]
- van Nes, A.; Yamu, C. Introduction to Space Syntax in Urban. Studies; Springer Nature (forthcoming): Berlin, Germany, 2021. [Google Scholar]
- Hillier, B.; Yang, T.; Turner, A. Normalising least angle choice in Depthmap and how it opens new perspectives on the global and local analysis of city space. J. Space Syntax 2012, 3, 155–193. [Google Scholar]
- Rashid, M. The Geometry of Urban Layouts; Springer: Berlin, Germany, 2017. [Google Scholar]
- Berghauser Pont, M.Y.; Haupt, P.A. Space, density and urban form. Ph.D. Thesis, Technical University Delft, Delft, The Netherlands, 2009. [Google Scholar]
- van den Hoek, J. The mixed use index (MXI) as planning tool for (new) towns in the 21st century. In New Towns for the 21st Century: The Planned vs the Unplanned City; SUN: Amsterdam, The Netherlands, 2009; pp. 198–207. [Google Scholar]
- Dovey, K.; Pafka, E. What is functional mix? An assemblage approach. Plan. Theory Pract. 2017, 18, 249–267. [Google Scholar] [CrossRef]
- Sandkjær Hansen, G.; Hofstad, H.; Saglie, I.-L. (Eds.) Kompakt Byutvikling—Muligheter og utfordringer; Universitetsforlaget: Oslo, Norway, 2015. [Google Scholar]
- Jenks, M.; Burton, E.; Williams, K. The Compact City. A sustainable Urban. Form? E & FN Spon: New York, NY, USA, 1996. [Google Scholar]
- Rogers, R. Towards an Urban Renaissance, Urban Task Force; E & FN Spon: New York, NY, USA, 1999. [Google Scholar]
- Hillier, B.; Turner, A.; Yang, T.; Park, H.T. Metric and Topo-Geometric Properties of Urban Street Networks: Some convergiences, divergences and new results. In Proceedings of the 6th International Space Syntax Symposium, Istanbul Technical University, Istanbul, Turkey, 11–16 June 2007; pp. 001.001–001.021. [Google Scholar]


Publisher’s Note: MDPI stays neutral with regard to jurisdictional claims in published maps and institutional affiliations. |
© 2020 by the authors. Licensee MDPI, Basel, Switzerland. This article is an open access article distributed under the terms and conditions of the Creative Commons Attribution (CC BY) license (http://creativecommons.org/licenses/by/4.0/).