Abstract
Countries differ in terms of their socio-economic development, population growth, and energy consumption. Many countries still depend on conventional energy to supply enough energy source for their demand, while some have made considerable progress in making the transition to renewable/sustainable energy sources. Owing to the increasing demand and drawbacks of conventional energy sources, policies can play a major role in encouraging and increasing the uptake of renewable energy (RE) technologies. In this paper, a general overview on the RE activities in the three leading countries—China, Brazil, and the United States of America (USA)—is presented. Moreover, a comparative analysis on the implementations of the RE support policies is conducted. The linear regression analysis technique is applied to develop several models for the three countries in order to investigate the effect of different policies on RE. The main contributions of this study are establishing a link between RE support policies and RE development (in terms of the installed capacity) in the three countries under study, and providing models that can be used in estimating RE development using RE policy data. In addition to this, some models are developed to investigate the relationship between RE installed capacity and the patents. The linear regression analyses suggest that RE policies promote the development of RE installed capacity in the three countries in different proportions. For example, it is found that each additional wind policy will increase the RE wind capacity in China, Brazil, and the USA by 1.63, 0.689, and 1.576 GW, respectively. Moreover, the economic instruments turn out to be more effective in promoting the RE installed capacity in the USA and Brazil, while the policy support and regulatory instruments are the most influential policy categories in China. Furthermore, the linear regression analyses indicate the existence of a positive significant relation between the number of patents and the total RE installed capacity in the three countries.
1. Introduction
Zahedi [1] highlighted that the security and sustainability of energy supply as well as access to energy are among the main global energy considerations. Hua et al. [2] stated that the energy consumption, which represents 60% of global emissions, has significantly contributed to climate change. Therefore, the mitigation of the carbon intensity of energy is crucial in handling climate change in the future. Utilizing renewable energy (RE) is a suitable method to meet the energy demand without environmental degradation. Authorities in several countries are devoted to reducing their emissions by promoting RE. In addition, Hua et al. [2] showed that RE policies have been adopted in these countries to encourage renewable power production. Abdmouleh et al. [3] and Kim et al. [4] presented that the national and state-level policies play major roles in effective RE deployment and promotion due to the cost disadvantage of RE compared to conventional energy sources.
According to Zyadin et al. [5] and Ren21 [6], the lack of governmental policies is a seriously limiting factor for the development of RE globally. Although not all the countries currently have RE policies, there are many countries in the world which have adopted various RE support policies. These policies include economic instruments such as fiscal and financial incentives, policy support related to strategy planning, and regulatory measures. Among these policies, feed-in tariffs (FITs), renewable portfolio standards (RPS), and quotas are the most widely adopted ones. FIT, RPS, and quota policies are applied globally at either state/provincial or national levels. Polzin et al. [7] demonstrated that governments have also started introducing more FITs in cities.
Especially in the last few decades, the electricity sector has been experiencing a period of fast deployment of RE generation technologies. Since 2012, new global RE capacity additions have accounted for more than half of new power capacity additions. International Renewable Energy Agency (IRENA) [8] stated that, at the end of 2017, the total RE power capacity exceeded 2178 GW, indicating that it had more than doubled within nine years. It also indicated that the new global capacity additions of renewables in 2017 reached almost 167 GW, including a combined 1 GW from concentrating solar power (CSP), geothermal, and marine energy; 22 GW of hydropower; 93 GW of photovoltaic (PV); 46 GW of wind power; and 5 GW of bioenergy.
According to [9], the top countries for total installed renewable capacity at the end of 2017 were China, the USA, Brazil, Germany, India, and Canada, respectively. In order to illustrate this, Figure 1 was constructed for this study using the data available in the IRENA database [9].
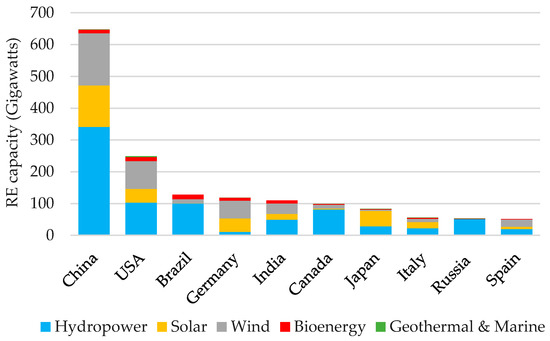
Figure 1.
Total installed renewable capacity (data source: [9]).
Many researchers have tried to investigate the effect of RE policies on RE development. However, most research studies have taken into account only some policies and overlooked the rest. Moreover, many countries (20 to 40) have been involved in the studies over long time spans. Therefore, the econometric treatment could not be trustworthy due to the following reasons:
- Some countries involved in the studies did not implement all the policies considered.
- The proposed techniques dealt with the data package of involved countries as a whole, which caused multidimensional problems, such as cross-sectional dependency and heterogeneity.
The present study aims at investigating the effect of different policies on the installed RE capacity of the top three countries (shown in Figure 1) over a period of 18 years (2000 to 2017). In addition, the individual effect of policies on the installed capacity of solar, wind, hydro, and bio energies has been explored. Furthermore, the relationship between RE development and patents is evaluated. The main motivation behind this study is to understand if RE policies can be the main drivers of RE development, and, if so, which type of policies are more effective in supporting the development. The authors believe that analyzing the case of the leader countries in the world (in terms of installed RE capacity) would reveal the secret behind their success. Time series linear regression analyses are carried out (using the SPSS software) to establish econometric models for each country. To avoid multidimensional problems, the analyses are performed on the data of each country individually.
The rest of this paper is organized as follows: Section 2 presents the related literature review and highlights the contribution of this paper. Section 3 introduces country reviews, including the fossil fuel reserves and electricity generation for China, the USA, and Brazil. In Section 4, RE policies are demonstrated. The methodology of this study is provided in Section 5. Section 6 presents the results of the study, while Section 7 outlines the concluding remarks.
2. Literature Review
2.1. Studies Related to the USA
Several studies have been conducted on the relationship between economic instrument policies and RE development in the USA. In fact, the economic instruments include three main policies named direct investments, financial incentives, and market-based instruments. For example, Barbose et al. [10] studied the benefits and impact of one category of financial incentives, called Renewable Portfolio Standards (RPS). The study showed that RPS-based new RE generation represented 2.4% of the nationwide electricity generation and an almost 59 Million tons (Mt) CO2 equivalent reduction in greenhouse gas emissions in 2013. The study also stated the additional benefits of this policy. It was noted that the adopted RPS supported nearly 200,000 jobs in the country and reduced the wholesale electricity and natural gas prices, saving consumers a combined $1.3–4.9 billion. Additionally, Maguire [11] examined the impact of economic instrument policies on the wind energy generation capacity across the USA from 1994 to 2012. The study focused on determining the influence of green power purchase (market-based category) agreements and RPS on the wind generation capacity. The author indicated that the average effect of RPS across the USA was insignificant, while green power purchase (GPP) showed a positive and statistically significant effect on the wind generation capacity across the states. Furthermore, the study showed that, for each additional GPP program, there is an approximately 7 MW of additional wind energy capacity across the USA. The authors of Rickerson et al. [12] reviewed the application of FIT policies in six USA states, including California, Michigan, Illinois, Minnesota, Rhode Island, and Hawaii. The study focused on several criteria such as generation cost, adopting different technologies and incentives based on different technologies. The authors revealed that FIT in the USA presented a dramatic shift in the policy landscape and could signal the beginning of a new trend of more aggressive RE policies at state and national levels.
2.2. Studies Related to China
Wang 2010 [13] reviewed the main RE policy support regarding China’s wind power, such as the RE law, the Wind Power Concession Program, and other laws and regulations. It was noted that such policies effectively reduced the cost of wind power, stimulated the localization of wind power-related manufacturing, and drove private sector investment in wind power. The study revealed that the Wind Power Concession Program had a significant effect on Chinese success in the promotion and development of wind power. Hua et al. [2] compared RE deployment between China and Australia. The authors compared management mechanisms in terms of RE grid-connection/coordination, incentives, and funding between different levels of governments in both countries. The study concluded that China had shown a better commitment to RE development, while Australia had a more effective RE certificate mechanism. The study also revealed that the Chinese government provided a significant amount of incentives for RE manufacturers, while the manufactures in Australia received little support from the Australian government.
2.3. Studies Related to Brazil
Aquila et al. [14] discussed some economic instrument policies that encouraged the spread of RE in Brazil. They focused on the application of long-term incentive policies such as FITs, auctions, and net metering, along with their advantages and disadvantages. The study also highlighted the incentive initiatives that helped to promote Renewable Energy Sources (RES) in Brazil. The authors showed that the Alternative Sources Incentive Program (PROINFA) could be applied in the promotion of solar PV.
Similarly, Maier and Oliveira [15] analyzed the implications of Brazil’s national policy on solid waste for the economic feasibility of different municipal solid waste (MSW) treatment facilities. The authors examined the Rio de Janeiro municipality’s current state of MSW management and 20 hypothetical future investment projects for three different MSW treatment technologies. Maier and Oliveira [15] revealed that financial incentives were required to have a vital impact on investment decisions for waste plant constructions.
Additionally, de Martino and de Melo [16] presented a prospective analysis of grid-connected solar photovoltaic (PV) systems in the Brazilian residential sector. The study evaluated scenarios of technology diffusion up to 2030 considering policy mechanisms to foster the development of grid-connected PV generation. The assessed mechanisms are the net metering compensation scheme, FIT, and direct subsidies to PV installations. The results showed that PV distributed technology offers good opportunities for Brazil to diversify its energy matrix with potential economic and environmental benefits.
2.4. Studies Related to Other Countries
In [17], the RE technology and diffusion of geothermal, wind, biomass, and solar PV across 26 countries of the Organization for Economic Co-operation and Development (OECD) were studied. The study used the list of patents for each of these technologies to assess the effect of technological change on investment in RE. In [17], the study showed that a 10% increase in knowledge stock in wind and biomass increases investment by 0.6% and 2.6%, respectively. Additionally, the authors revealed that technological changes lead to greater RE investment. Nicolli and Vona [18] investigated the empirical effect of RE policies and market regulation on the innovation activity in different RE technologies. The authors focused on European Union (EU) countries, and the adopted dataset covers eight different technologies, RE policies, and proxies of market regulation. The study revealed that reducing entry barriers to innovation activities is a major driver in RE innovation, with varying effects for different technologies. In [19], the effects of environmental policies on innovation under various levels of competition were investigated. A pre-sample mean count data econometric specification (which accounts for the endogeneity of policies) was developed using RE policies, competition, and green patents for OECD countries. The study revealed that RE policies are more effective in the promotion of green innovation in countries with modern energy markets. In addition, Nesta et al. [19] concluded that competition promotes the generation of low-quality green patents, whereas environmental policies are important for the generation of high-quality green patents.
Other studies in the literature have focused on the use of panel data regression analyses to test the effect of RE policies on the RE development [20,21,22]. These research studies involved many countries over long time spans. For example, Marques and Fuinhas [20] focused on a panel of 23 European countries for the time span of 1990–2007; Aguirre and Ibikunle [21] focused on 38 countries for the period of 1990–2010; while, in Liu et al. [22], the panel dataset was 29 countries analyzed during the period 2000–2015. The panel data techniques used in these studies were the corrected standard errors estimator [20], fixed effects vector decomposition [21], and variable intercept panel model [22]. However, all these research studies suffered from the demerit that many the countries involved in the studies did not implement some of the RE policies. Therefore, the econometric treatment could not be trustworthy. Moreover, the presence of unobserved heterogeneity, contemporaneous correlation, and cross-sectional dependency must be adequately addressed. Otherwise, the estimation of the model coefficients would be erroneous. This situation was obvious in the results obtained in [21], which found a negative effect of fiscal and financial incentives on RE development, while the results reported in [20,22] were the opposite.
Throughout the literature, a variety of different studies have tried to show the relationship between RE policies and RE development. However, most of the above-mentioned studies focus on specific policies or policy types, while some others focus on specific countries. This study, on the other hand, focuses on general RE policies using RE policy categories, and the main focus is on the countries which had the highest installed capacity at the end of 2017. As the selected countries (China, USA, Brazil) are very different from each other, the analysis also reveals the diversity of similar policy type applications. Additionally, this study provides a time-series analysis, covering an 18-years period. In order to avoid the problems that arose from the multidimensional panel dataset, such as cross-sectional dependency and heterogeneity, as found in [20,21,22], the time series analysis is applied here to each country individually. To the authors’ best knowledge, none of the above-mentioned studies focus on evaluating the relationship between different RE policy categories and RE development, and the relationship between different RE policy categories on different types of RE development (such as solar, hydro, wind, etc.) in leader countries (in terms of their installed RE capacity). Moreover, unlike other studies, the models developed in this study (to evaluate the relationship) consider the following independent variables: the number of RE policies in each year and the number of RE patents in each year. Hence, this study differs from the other studies available in literature, and the authors believe that the results of this study will help policy-makers and implementers to select the best policies/methods according to the specifications of each country.
3. Country Reviews
This section will provide background information about the countries that will be analyzed in this study. The reasons for providing such information can be explained as follows: Each country adopts different kind of RE policies. There may be many reasons behind their selection. However, it is highly probable that the country’s fossil fuel reserves and energy mix have an effect on the policy selection. Hence, this part of the study will be dedicated to informing the reader about the nature of fossil fuel reserves and the types energy sources adopted in the energy mix in each of the selected three countries. Among the chosen countries, China is the leader in fossil fuel reserves, with about 105,605 million tons of oil equivalent (Mtoe), followed by the USA and Brazil with 15,067 and 6819 Mtoe, respectively. As shown in Figure 2, coal represents the majority of fossil fuel reserves in China, Brazil, and the USA, with 92 %, 68 %, and 91 %, respectively. Oil is another major fossil fuel resource for China, Brazil, and the USA [23]. The data used to plot Figure 2 and Figure 3 were retrieved from [23].
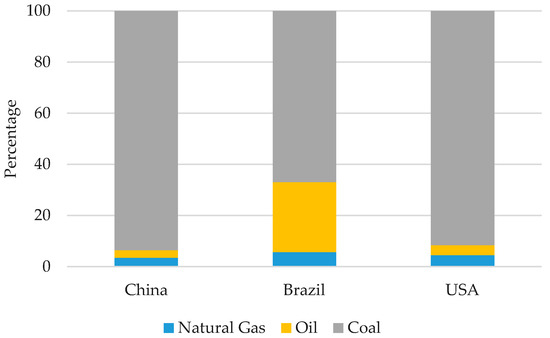
Figure 2.
Fossil fuel reserves for China, Brazil, and the USA (data source: [23]).
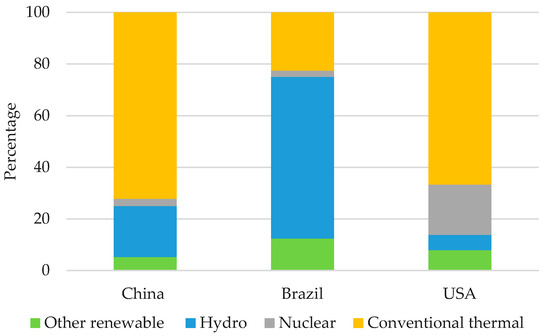
Figure 3.
Electricity mix for China, Brazil, and the USA (data source: [23]).
Figure 3 illustrates the primary sources of the electricity mix in the three countries. As seen from the figure, although these countries are the world leaders in terms of their installed RE capacity, conventional thermal plays an essential role in their electricity generation, especially in China and the USA. Brazil, on the other hand, seems to be more successful in integrating more renewables into their electricity mix. The hydro contribution to electricity is the highest in Brazil. Additionally, the current contribution of other renewables is the highest in Brazil with 12.5%, while the others are comparably low. It should be noted that nuclear energy is also utilized in all the three countries and has the highest contribution in the USA, although it is still not comparable to the fossil fuels [23].
4. Policy Reviews
There is common agreement that RE should have a more significant role in energy generation than it currently has. This has led to an increase in research and development for RE technologies, and an increase in RE policies (e.g., regulatory, legislation-based, incentives/subsidies, and carbon taxes) [24]. According to International Energy Agency (IEA)/IRENA [25], since 2000 more and more countries have been working on RE policies that support RE development; such policies include market-driven policies, incentives and subsidies, FIT, and policy support. For detailed information about each of the policies, the interested reader is referred to the IEA RE policy database [25].
The three countries under study—China, the USA, and Brazil—were initially late in adopting policies to promote RE because of having large fossil fuel reserves (coal, oil, and natural gas) and because of the high cost of RE deployment compared to conventional fuels. In the last two decades, the authorities in these countries have adopted different policies to quickly integrate RE into their electricity mix according to the economic plans in each country. The policies which has been taken by each country are illustrated in Section 4.1, Section 4.2, Section 4.3, Section 4.4, Section 4.5 to Section 4.6.
Table 1 summarizes the different types of RE support policies (RE policy categories and corresponding sections in accordance with the classification provided in reference [25]), which are generally applied in most countries and are hence considered in this study. Moreover, Table 1, Table 2, Table 3, Table 4, Table 5, Table 6, Table 7 and Table 8 were constructed for this study using the data provided in [25].

Table 1.
Summary of the different types of RE support policies.
Table 2.
Examples of the EI policies adopted in China, Brazil, and the USA.
Table 3.
Examples of the PS policies adopted in China, Brazil, and the USA.
Table 4.
Examples of the information and education policies for China, Brazil, and the USA.
Table 5.
Examples of the regulatory instruments for China, Brazil, and the USA.
Table 6.
Examples of the Research Development and Deployment instruments for China, Brazil, and the USA.
Table 7.
Examples of the VA for China, Brazil, and the USA.
Table 8.
The total number of RE policies considered for each country (2000–2017).
The next subsections will provide basic information about the RE policy categories mentioned above, along with examples of the related policies adopted in the three countries under study: China, Brazil, and the USA. Each subsection will provide a different amount of examples for each country, and their numbers will differ according to the categories. At this point, it should be noted that examples are chosen based on the number of policies in each country and the different RE sources.
4.1. Economic Instruments
The government regulators administered these instruments by providing economic/monetary incentives for promotion and the adaptation of risk management. Economic instruments (EI) play a crucial role in cost reduction and innovation deployment in RE production. EI policies are classified into three main groups that include [25]:
- Direct investments: These are designed to reduce the capital cost of RE investment.
- Fiscal/financial incentives: This is a type of financial support provided to investors for accelerating the development of RE projects and reducing the risk to investors.
- Market-based instruments: These are instruments of environmental policies in which a change in technology or products is encouraged through financial incentives.
Some examples of the EI policies are listed in Table 2 for the three countries under study: China, Brazil, and the USA, respectively.
In order to provide better understanding, brief explanations for some of the policies seen in Table 2 are listed below. For more detailed information on each one of the above-listed policies, the interested reader is referred to [25].
- China:
- The RE law (released in 2009) introduced the FIT to support solar photovoltaic, wind, biomass, and other renewables with subsidies [26].
- In the 2010 and 2020 targets, hydroelectric represents 80% of all renewable capacity [26]. In order to support hydropower development, a unified and standardized large-scale hydropower corporation tax policy was set.
- The Golden Sun Program provided capital subsidies for solar PV installations [27].
- The Wind Power Concession Program reduced the cost of wind power and drove private sector investment [13].
- In the environmental field, China had taken many steps, such as a national GHG trading market for vehicle manufacturers [28].
- Brazil:In Brazil, the existence of several rivers aids the predominance of hydroelectric power-generating sources. However, large hydropower dams have significant environmental impacts. Since the 2000s, Brazil has given greater attention to other RE sources in addition to hydropower.
- In 2002, Brazil released the PROINFA. In that program, FITs were used to produce 3300 MW from the RES (wind, biomass, and hydro plants) [14].
- In 2009, the government introduced an auction regime. The auctions system together with the loans system and guaranteed purchase contracts caused the wind power installation to become 5300 MW in 2013 [3].
- In 2012, the Electricity Regulatory Agency sets the legal framework for the use of solar PV energy systems connected to the electricity grid, including net metering, FIT, and cash incentives which promoted solar PV distributed technology [29].
- Tax exemptions and reductions reduced the installation costs of RE projects and, thereby, the cost of RE through the market [14].
- USA:Although nuclear energy has a large participation rate in the United States, in order to improve the diversity of resources the country has also supported other RE energy sources as follows:
- In 2009, capital subsidies and grants were given to RE projects for producing 188 MW from concentrated solar power and 95 MW from hydropower [21].
- The American Recovery and Reinvestment Act of 2009 supplemented over $80 billion to support clean energy-related Research, Development and Deployment (RD&D) [25].
- Solar America cities is an energy department initiative to promote solar energy at the local level through city programs [25].
4.2. RE Policy Support
Most support policies worldwide promote power generation through institutional creation and strategic planning. These policies have been developed to encourage the introduction of RE technologies into the electricity sector [24]. Policy support (PS) has two categories, which include institutional creation (such as the implementation of an energy agency) and strategic planning. Some of these policies are reported in Table 3 for the three countries under study.
Some of the above-mentioned policies are explained as follows:
- China:
- The 13th 5-year plan for 2016–2020 including geothermal, solar, wind, hydro, and ocean power provided a strategy for sustainable energy and resource management. The activities focused on three areas, including green actions, the implementation of energy-saving projects, and improved safeguarding measures [30].
- The solar industry 12th 5-year plan aimed to increase solar production and reduce the cost of electricity generation from solar installations to make them more competitive with conventional power production [29].
- In 2012, the government planned the construction of six onshore, two offshore, and coastal wind power plants (under the 12th 5-year plan) for wind technology development. The target was to add 10 MW of offshore wind prototypes by 2015 [25].
- Brazil:
- The Ministry of Mines and Energy approved the 2010–2019 Plan for Energy Expansion, which adopted a reduction in fossil fuel power plant construction and expected major expansions in the hydro and wind grid-connected power sectors. The installed capacity targets for RES by 2019 were 116.7 GW hydro, 6 GW wind, and 8.5 GW biomass power [31].
- The Light for All program (2003) improved rural electrification through network expansion, distributed RE generating systems, and reduced the GHG [31].
- USA:
- Executive Order 13,514 expands the energy reduction and environmental requirements by making GHG management a priority for the federal government [32].
- The Solar America Initiative was a Department of Energy effort to make solar PV energy a cost-competitive with conventional form of electricity by 2015 [33].
- The State Climate and Energy Partnership Program was designed to help states review and adopt policies that integrate clean energy into a low-cost and reliable system [34].
- The Energy Policy Act of 2005 provided tax incentives and loan guarantees for various types of energy production to mitigate climate change [35].
- The National Biodiesel Education Program provided information about the benefits of biodiesel, focused on market barriers to biodiesel commercialization, and developed strategies to eliminate these barriers [25].
4.3. Information and Education
These policies seek to introduce several new approaches to address the needs of the 21st century for sustainable energy supply systems. They also include courses in RE engineering, RE technician training, and RE policy and planning [25]. The information and education (IE) policies are divided into four categories, which include advice/aid in implementation, information provision, performance label, and professional training and qualification. In addition, the performance label has two different types: a comparison label and an endorsement label. Some examples of the information and education policies are listed in Table 4 for the three countries under study.
The following points in the above table include:
- China:
- In 2015, the National Energy Administration (NEA) provided direction to improve electric power functionality and ease the further development of clean energy [25].
- In order to promote advanced PV technology application and industrial upgrading, the NEA implements the “leader” projects every year by arranging a special market scale [25].
- The Ministry of Science and Technology has initiated the International Science and Technology Cooperation Program in RE to boost Chinese technological development [36].
- Brazil:
- Inova Energy Plan program provided support in the form of grants and soft loans to boost cooperation sharing between companies and technology institutes in the field of RE [31].
- USA:
- The Center of Geothermal Technology was set up (2008) to collect information on the best practices in all areas relating to developing and utilizing geothermal resources [25].
- In 2007, the project of Solar America Cities committed with 25 cities to accelerate the adoption of solar energy technologies at the local level [25].
- The Solar Energy Technology Office/SunShot facilitated the purchase of solar energy and helped consumers, businesses, and utilities to make informed decisions [31].
- The Water Power Technologies Office (2016) developed, evaluated, and tested innovative renewable water power technologies and removed market barriers to deployment [25].
4.4. Regulatory Instruments
These policies discuss the preferred approaches to support low-carbon energy technologies from a regulatory point of view. Regulatory instruments (RI) directly measure the risk and return profile of RE projects. Combining these with regulatory measures (that include long-term strategic planning and, codes and standards) could further enhance RE investments [3,7]. The policy categories under regulatory instruments comprise of auditing, codes and standards, monitoring, obligation schemes, and other mandatory requirements. Meanwhile, standard codes include building codes and standards, product standards, sectoral standards, and vehicle fuel economy and emissions. A brief summary of the regulatory instruments for the three countries is shown in Table 5.
Some of the above instruments are depicted as follows:
- China:
- In 2008, the Shandong Province Village RE Regulations provided subsidies for specified RE technologies in farming villages [25].
- In 2012, the Ministry of industry and Information Technology announced a plan to reduce the cost of solar power and increase the production of solar panels [31].
- The RE Law covers wind, solar, water, biomass, geothermal, and ocean energy [25].
- Brazil:
- The electric power biomass and wind auctions were organized by Brazil’s electricity regulatory agency in 2008 and 2009 [25].
- In 2002, Brazil released the Program of Incentives for Alternative Electricity Sources [14].
- USA:
- Energy Independence and Security Act (2007) expanded the production of renewable fuels, reduced dependence on oil, increased energy security, and addressed climate change [37].
- Smart from the Start Initiative ensured the process of providing contracts for RE development on the shores of Atlantic Ocean [25].
- In 2009, an updated law was signed to expand Nevada’s previous RPS. The new RPS required 25% of electricity to come from RES by 2025 [31].
- In 2002, California established its RPS Program, with the goal of increasing the percent of RE in the state’s electricity mix to 20 % by 2017 [25].
- In 2014, the California government introduced an energy efficiency obligation to achieve an energy saving of 6092 GWh per year [25].
4.5. Research, Development, and Deployment
These policies support the development of facilities that aim at developing and deploying clean energy technologies in developing countries [38]. The Research, Development, and Deployment (RD&D) policies are divided into two groups that include a demonstration project and research program, which in turn is subdivided into technology deployment and diffusion and technology development [25]. The RD&D policies for China, Brazil, and the USA are reported in Table 6.
Some of the policies are illustrated as follows:
- China:
- The modification to the 2006 RE Law initiated a special fund for RD&D and supported mini and off-grid RE projects in rural and remote areas [25].
- The International Science and Technology Program aimed to introduce latest technologies, attract scientists, and develop an exchange program with international research centers [31].
- Brazil:
- In 2011, Brazil invested more than 1% of its GDP in RD&D. The business sector contributes a considerable share of total RD&D expenditures [39].
- The Scientific Research and Technological Development used incentives to encourage public private partnerships and raised the participation of research institutions in innovation [39].
- USA:
- The Solar Energy Technologies Office/Sun (2016) conducted RD&D on solar energy technologies, including improving the efficiency and performance of solar cells [25].
- In 2009, the public investment and loans in the USA allocated $ 30 billion to produce a 3.1 GW geothermal project [20].
- The American Reinvestment Law supported clean energy RD&D by $ 80 billion [31].
- The Wind Energy Technologies Office accelerated the deployment of wind technologies through improved performance, low costs, and reduced market barriers [25].
- The Water Power Program identifies and undertakes RD&D to facilitate the development and deployment of RE from rivers and marine waters [31].
4.6. Voluntary Approaches
This policy type aims to considerably increase the share of RE. Hence, voluntary approaches (VA) encourage countries to execute programs and policies voluntarily to accelerate the deployment of RE on the basis of national circumstances and to promote proactive plans and actions [24]. Voluntary approaches cover negotiated agreements (public-private sector), public voluntary schemes, and unilateral commitments (private sector). Table 7 summarizes a sample of the voluntary approaches applied in the three leading countries: China, the USA, and Brazil.
The main points of the above table are explained as follows:
- China:
- The results of the market transformation project established in 2006 were summarized in a group of recommendations [25].
- The 13th 5-year plan for geothermal energy summarized the achievements and challenges of the geothermal sector in 2015 and stated the plan of the development of the sector between 2016 and 2020. The objectives of the plan were to achieve by 2020 [31]:
- ●
- The addition of 1.1 billion m2 of new geothermal heating (cooling) areas.
- ●
- Increasing the geothermal power installed capacity by 500 MW.
- Brazil:
- In 2015, the Alliance program was carried out through voluntary agreements between the National Confederation of Industry and large energy companies (consumption > 20MW) [25].
- In 2010, the Voluntary Governance Development Authority released technical regulations for the energy efficiency of buildings (non-residential) [31].
- USA:
- In 2009, the Department of Energy released a technical assistance program to provide state and local officials with quick RE experts at national laboratories [25].
- In 2008, the American Society of Heating, Refrigerating, and Air-Conditioning Engineers formed an association to encourage the development of green buildings [25].
- The Federal Electronics Challenge partnership program (established in 2007) encouraged federal facilities and agencies to purchase green electronic products [25].
- The Global Bioenergy Partnership (2006) promoted bioenergy and provided a mechanism for partners to organize, coordinate, and implement targeted international research [31].
5. Methodology
According to the IRENA database [9], the three leading countries for the total installed renewable capacity (at the end of 2017) were chosen as China, the United States, and Brazil. This study explores the effect of the supporting policies adopted by these countries on their installed RE capacity over the period of 2000 to 2017. The study uses the following data in order to perform the analyses:
- The total RE installed capacity.
- The solar, wind, hydro, and bio installed capacities.
- The total number of RE policies.
- The individual number of policies in each category (EI, RD&D, IE, RI, PS, and VA).
- The total number of patents.
- The number of solar, wind, hydro, and bio patents.
Various time series linear regression analyses were carried out (using the SPSS software) to establish 33 models (11 for each country). These analyses were carried out for each country individually to avoid multidimensional problems. The dependent variables were chosen either as the total installed RE capacity or the installed RE capacity per type of technology. The independent variables were chosen either as the total number of RE policies, the individual number of policies in each category, the total number of patents, or the number of patents per technology. All the diagnostic tests were performed to check the robustness of the models using the SPSS software.
5.1. Data Collection
The data used in this study were collected from the International Energy Agency (IEA) [25], International Renewable Energy Agency (IRENA) [9], and World Energy Council (WEC) databases [23]. The type of data that was collected from each source can be stated as follows: [25] was used for obtaining the data on policies. The RE installed capacities and the number of RE patents data were gathered from [9]. The data related to fossil fuel reserves and the diversity of electricity generation for each country were derived from [23]. At this stage, it should be noted that, in this study, policy refers to an RE policy/law applied by a country. The examples of these policies can be seen in almost all the tables provided in the previous section (Table 2, Table 3, Table 4, Table 5, Table 6 and Table 7). For example, in Table 7 China and Brazil have two policies each, while the USA has four policies. Policy data were gathered both for in-force policies and ended policies for the period of 2000–2017 using [25]. However, due to the unavailability of data about some ended policies (the date that the policy entered in force and the date that the policy ended) in the IEA database, some policies were excluded, including 2 policies for Brazil, 10 policies for China, and 20 policies for the USA. Table 8 presents the total no. of RE policies considered in this study for each country of analysis.
In addition to the data provided above, the RE installed capacities were gathered from [9] for China, the USA, and Brazil for the period 2000–2017. The technology-specific installation capacities were also recorded for the same period. However, it should be noted that, in this study, only four RE technologies were considered due to their high installed capacities when compared to others (marine and geothermal). These technologies are hydropower (renewable hydropower and pumped storage), wind (offshore and onshore), solar (photovoltaic and concentrated solar power), and bioenergy (solid biofuels, liquid biofuels, and biogas), while the data related to fossil fuel reserves and diversity of electricity generation for each country were derived from [23]. Figure 4 demonstrates the development of RE capacity for the 2000–2017 periods, along with the number of adopted RE policies for the countries of analysis. It can be seen from the figure that the policies have promoted the development of RE, especially for China, followed by the USA and Brazil. Table 9 provides descriptive statistics of the installed RE capacity and the number of RE policies used in the analyses. The table also shows the descriptive statistics of the RE policy categories used in this paper: EI + RD&D, IE + VA, and PS + RI. Each category actually covers two sub-categories which are grouped into one (due to having similar concepts) to provide a more accurate analysis (by having more data in each category). In addition, Figure 4 was constructed for this study using the data provided in [9,25].
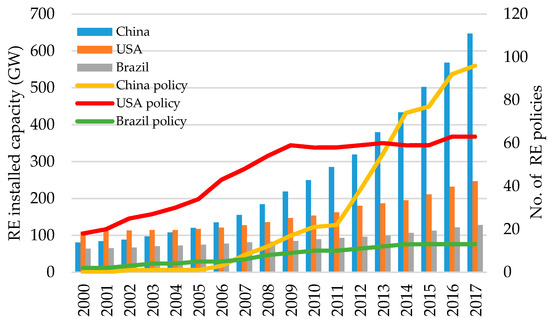
Figure 4.
The total RE installed capacity and total numbers of RE policies (2000–2017). Note: the bars are RE installed capacities and the lines are the no. of RE policies (data source: [9,25]).
Table 9.
Descriptive statistics: policies and RE installed capacity (2000–2017).
The RE patent data were also needed in analyses in order to investigate the effect of technology-related details. Hence, for the above-mentioned four technologies, the number of RE patents data (excluding marine and geothermal patents) were derived from [9] for China, the USA, and Brazil for the period of 2000–2016, as the number of patents data for 2017 were not available. Figure 5 presents the development of RE capacity with the number of patents for the countries of analysis. As shown in the figure, patents have promoted RE development especially in China and the USA. Table 10 presents the descriptive statistics of the RE patents. Additionally, the data that were used to plot Figure 5 were taken from reference [9].
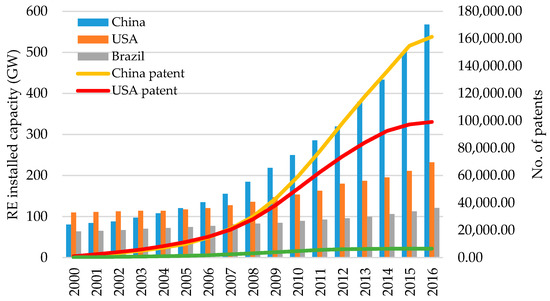
Figure 5.
The total RE installed capacity and the total number of patents (2000–2016). Note: the bars are the RE installed capacities and the lines are the no. of patents (data source: [9]).
Table 10.
Descriptive statistics: patents (2000–2016).
5.2. Problem Setup
Linear regression analysis is a statistical method that utilizes one or more independent variables in predicting the outcome of the response variable [40]. It is used in modeling the relationship between variables by fitting a linear equation to the data. The related model is presented in Equation (1):
where the represent the original unknown parameters, the represent the independent variables, represents the dependent variable, and is the residual error of estimation. The subscript j represents the observation number.
In this study, linear regression is used in order to measure the effect of the policies and patents on the RE development in the three countries under study. Time series regression analyses are performed for each country. The following relations were considered for analysis in this study:
5.2.1. Total RE Installed Capacity vs. Total No. of Policies
In this analysis, the relationship between the total RE installed capacity and the total number of policies is examined. Simple linear regression analyses are applied for each country. The total RE installed capacity is chosen as the dependent variable, while the total number of policies is chosen as the independent variable.
5.2.2. Total RE Installed Capacity for each Technology vs. Total No. of Policies
These relations investigate the effect of total number of policies on the growth of RE capacity for each technology (bioenergy, hydro, solar, and wind). The total RE installed capacity for a specific technology is selected as the dependent variable for that technology-specific analysis, while the total number of policies is chosen as the independent one. The analysis is performed for each technology. Additionally, simple linear regression analyses are used in this case.
5.2.3. Total RE Installed Capacity vs. Different Policies
Multiple linear regression analyses are used here to model the relation between , the total installed RE capacity (dependent variable), and , the number of RE policies in different categories (independent variables) for the three countries under study. These categories are as follows: . policies, policies, and policies.
5.2.4. Total RE Installed Capacity vs. Total No. of Patents
In this situation, the simple linear regression analysis is employed to detect the effect of increasing the total number of patents on the total installed RE capacity for the three countries under study.
In the present paper, the total number of patents is taken as the sum of the hydro, solar, wind, and bioenergy patents during the period 2000–2016, as the number of patents data for 2017 were not available. The dependent variable is assumed as the total installed RE capacity (GW), and the independent variable is chosen as the total number of patents.
5.2.5. Total RE Installed Capacity/Technology vs. Total No. of Patents/Technology
These relationships depict the connection between hydro, wind, solar, and bio installed capacities (dependent variables) and the corresponding number of patents for each technology (independent variables). The simple linear regression method is used to illustrate such relationships individually (for example, the relation between the total installed wind capacity versus the total number of wind patents and so on). The solar energy results in Brazil are excluded because all the data are reported as zero in the IRENA database over the period 2000–2016.
All the regression analyses provided in this study were performed using the SPSS-20 software. Several tests/criteria are used to show the success of each model developed for each case, such as:
- The value (coefficient of determination), which is a statistical tool that measures how the regression line fits the data and ranges from 0 to 1, with 0 representing the worst model and 1 the best model.
- The adjusted which is also known as , is the rescaling of by a degree of freedom and gives a more realistic indication of its predictive power.
- The p-value, which is the probability of the observed result to show how the changes in the independent variables affect the dependent variable. The p-value must be <0.05 for a significant result.
- The standard error, which is the mean distance that the observed values fall from the regression line [41].
- The F-stats, which compare the joint effect of all the variables together. The probability must be less than 0.05 for a significant result [42].
- Autocorrelation refers to the degree of correlation between the values of the same variables across different observations in the data. To test for the data auto correlation, the Durbin–Watson test is used. If there is no autocorrelation, the Durbin–Watson factor lies between the values 1.5 and 2.5 [43].
- Multicollinearity in regression analysis occurs when two or more predictor variables are highly correlated with each other, such that they do not provide unique or independent information in the regression model [43]. The variance inflation factor (VIF) measures the correlation between independent variables. If the degree of correlation between variables is high enough (VIF > 5) [43], it can cause problems in the model fit [43].
- Normality, which means that the prediction errors are normally distributed in the population [43].
- Homoscedasticity, which means that the variance of the errors is constant in the population [43].
In the following section, the results of the five relations (Section 5.2.1, Section 5.2.2, Section 5.2.3, Section 5.2.4 to Section 5.2.5,) given above are presented and discussed. The related statistical tests are carried out to validate the established models. Only the important results, such as the model coefficients, adjusted , p-value, and F stats, are provided in the results. The application of the normality, autocorrelation, multicollinearity, and homoscedasticity tests is illustrated in one of the multiple regression cases (Section 6.3.1) only, due to space requirements.
6. Results
The results obtained for the cases explained above are presented in this section. The models are econometrically satisfactory, as shown through Table 11, Table 12, Table 13, Table 14, Table 15, Table 16, Table 17, Table 18, Table 19 and Table 20. Specifically, the models passed all the econometric tests mentioned above.
Table 11.
Relationship between the total RE installed capacity and the total policies.
Table 12.
Relationship between the total RE installed capacity for each technology and the total policies.
Table 13.
Statistics of the model of China.
Table 14.
Statistics of the model of Brazil.
Table 15.
Statistics of the model of the United States.
Table 16.
Relationship between the total RE installed capacity and the total no. of patents.
Table 17.
Relationship between the total hydro installed capacity and the total no. of hydro patents.
Table 18.
Relationship between the total wind installed capacity and the total no. of wind patents.
Table 19.
Relationship between the total solar installed capacity and the total no. of solar patents.
Table 20.
Relationship between the total bioenergy installed capacity and the total no. of bioenergy patents.
6.1. Total RE Installed Capacity vs. Total no. of Policies
Table 11 depicts a brief summary for the linear regression results, relating the total RE installed capacity and total policies. The correlation coefficients of the China, Brazil, and USA models are 0.985, 0.962, and 0.82, respectively. All the coefficients are positive, have large values, and are statistically significant in the 1% confidence level. This emphasizes the existence of a strong positive relation between the RE development and the total number of policies. The F-statistics for all three countries are statistically significant (having p-values < 0.01), which gives credence to the fitness of the model. Additionally, the adjusted R2 for the three countries lie between 0.651 and 0.968, which indicates that the total number of policies explain from 65.1% to 96.8% of the total RE capacity variation. It should be indicated that China has a larger capacity per policy ratio than Brazil and the USA (because the slope of the linear relation is the largest for China; coefficient = 4.967). It is worth noting that the correlation coefficient and R2adj in the USA model are less than the corresponding values for China and Brazil. This may mainly be due to the fact that there are many states with different regulations in the USA, and the policies are not the main drivers of RE installations.
6.2. Total RE Installed Capacity for Each Technology vs. Total No. of Policies
Table 12 presents the relations between the total number of policies and the total RE installed capacity of each technology for the three countries under study. All the coefficients, correlation factors, and F stats lie within the 1% significant level, except the solar case in Brazil. The solar energy in Brazil is excluded because its data are reported to be zero in the IRENA database during the period 2000–2016. It should be indicated that China has a larger capacity per policy in solar and wind RES than the USA or Brazil. On the other hand, Brazil has larger capacity/policy in hydro and bio sources.
For example, each additional policy will increase the RE hydro capacity in China, Brazil, and the USA by 2.588, 2.718, and 0.0781 GW, respectively.
6.3. Total RE Installed Capacity vs. Different Policies
The linear regression analysis is used here to model the relation between the total installed RE capacity with the three groups of the RE policies for each country. The resulted statistics of the models of the three countries under study are listed in Table 13, Table 14 and Table 15. These statistics include the standard deviation, correlation factors, R-Squared, and F-stats. The significance level of the F-stats is less than 0.01, which proves that the null hypothesis is rejected and the model is a good fit. It is concluded from the results of the SPSS program that the residuals are found to be distributed normally about the predicted response, having a constant variance and zero mean (not shown in the table). Thus, the variances of the residuals in the three countries are said to have homoscedasticity.
6.3.1. Results of the Total RE Installed Capacity vs. Different Policies Analysis for China
The linear model for China can be written as follows, due to the results provided in Table 13:
The coefficients of Equation (2) are positive and statistically significant, with p-values less than 0.05.
The correlation factors are 0.986, 0.925, and 0.974, respectively. This depicts that there are positive and strong relations between the total installed RE capacity and the three variables. In addition, the adjusted R2adj is 0.99, which indicates that 99% of the total RE capacity variation is explained by the RE policy variables and only 1% is due to random errors. Moreover, the significance level of F-stats is less than 0.01, which indicates that the null hypothesis is rejected and the model is good fit. Additionally, the standardized coefficients in Table 13 show that the third policy (PS + RI) has a larger weight with respect to the other policies. Therefore, the PS + RI category is more effective on the total RE capacity in China. This is due to the RE law released in China (revised 2009), which covers wind, solar, water, biomass, geothermal, and ocean energy [25]. Additionally, it is due to the plan of the Ministry of Industry, 2012, that reduced the cost of solar power and increased the production of solar panels [31]. In addition, the 13th 5-year plan (2016–2020) provided a strategy for sustainable energy and focused on green actions and the implementation of energy-saving projects [30].
In addition, the results in Table 13 indicate that there is no autocorrelation between the data because the Durbin–Watson factor equals 1.7 (as seen in Section 5). Moreover, the low values of VIF in the same table (<5) show that the multicollinearity does not occur in the regression analysis, which proves the fitness of the established model.
The normality test has been performed on the predicted China model by examining the normal Predicted Probability (P-P) plot shown in Figure 6. It has been shown in the figure that the residuals are normally distributed and conform to the diagonal normality line.
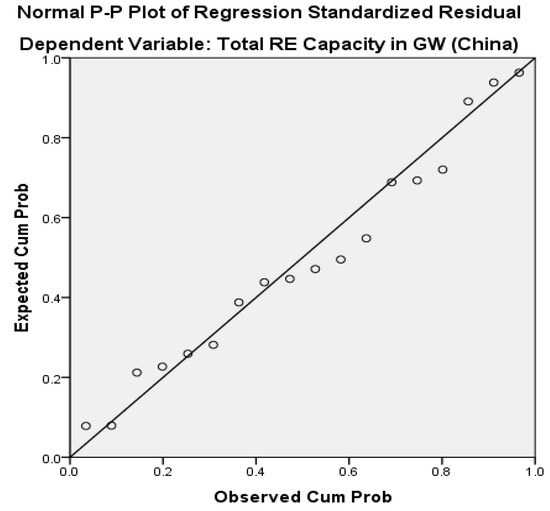
Figure 6.
The normality test of the predicted China model.
In order to test for the homoscedasticity, the scatterplot shown in Figure 7 of the residuals against the fitted values is examined. If the model is well fitted, the scatterplot of the residuals does not have an obvious pattern, which is obvious in the figure. Thus, the variances of the residuals in the China model are said to have homoscedasticity.
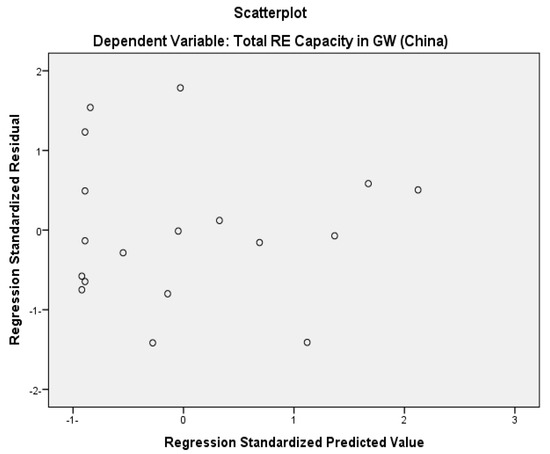
Figure 7.
Homoscedasticity of the China model.
6.3.2. Results of the Total RE Installed Capacity vs. Different Policies Analysis for Brazil
The model equation for the Brazil is described as shown in Table 14:
Brazil does not have any policy in the RD&D and VA category during the period 2000–2017, as reported in the IRENA database [25], thereby it is not included in that model. The coefficients of and are positive and statistically significant, with a p-value ≤ 0.01. On the other hand, the PS + RI policy () has a p-value > 0.1; therefore, it has no significant relation with the total RE capacity. The correlation factors are 0.942, 0.840, and 0.891, respectively, which depict a direct and strong linear relation between the total RE capacity and the RE policy variables. Moreover, the value of R2adj is 0.923, which indicates that 92.3% of the total RE capacity variation is accounted for by the policy variables. In addition, the significance level of F-stats is less than 0.01, which shows a good fit for the model.
It has been indicated in Table 14 that the first category EI has a larger weight than the others; therefore, it has a positive effect on the total RE capacity in Brazil. This may be due to introducing the PROINFA program, the auctions system, or setting the legal framework for the use of solar PV energy systems and tax exemptions in this country.
6.3.3. Results of the Total RE Installed Capacity vs. Different Policies Analysis for the USA
The USA regression model can be depicted as illustrated in Table 15:
The coefficients of and are positive while has a negative coefficient. This means that the EI, RD&D, PS, and RI policies have a positive effect on the installed total RE capacity, while the remaining policy (IE + VA) has a negative effect. The coefficients of Equation (4) have p-values equal to 0.007, 014, and 0.078, respectively, which point to a statistical significance level <0.1. Additionally, the correlation factors are 0.814, 0.723, and 0.795, respectively, which indicate the existence of linear relations between the total RE capacity and the policy variables. Moreover, R2adj is found to be 0.889, which indicates that 88.9% of the total RE capacity variation is explained by the policy variables and 11.1% is due to random errors. Additionally, it is indicated that the significance level of F-stats is less than 0.01, which shows a good fit for the model. It is worthy to indicate that the first category (EI + RD&D) has the largest weight; therefore, it is a more effective policy for the total RE capacity in the United States. This is attributed to allocating $30 billion to produce 3.1 GW from a geothermal project using the public investment and loans [21]. Additionally, subsidies and grants were given to RE projects to produce 188 MW from concentrated solar power and 95 MW from hydropower [21]. In addition, over $80 billion was provided to support clean energy RD&D [25].
6.4. Total RE Installed Capacity vs. Total No. of Patents
The SPSS regression results are listed in Table 16. The coefficients of the linear model are statistically significant and make perfect intuitive sense. The p-values of these coefficients lie in the 1% confidence level. The values of adjusted R2 lie in the range from 0.897 to 0.985 for the three countries, which means that the total number of patents accounts for 89.7% to 98.5% of the total installed RE capacity and the remaining are due to random errors. The correlation between the total RE capacity and the total number of patents lies in the range 0.951 to 0.993 with a 1-tailed significance of less than 1%, which suggests that strong relationships exist between the total installed RE capacity and the total number of patents. The significance level of F-stats is less than 0.01 for the three countries; therefore, the null hypothesis is rejected, and the alternate one is accepted at the 1% level. The residuals are distributed normally about the predicted response, have a constant variance, and have zero mean. Thus, the variance of the residuals is said to be homoscedasticity, and the model is fully predicted. The total RE installed capacity increased in China, Brazil, and the USA by 2.686, 6.503, and 1.058 GW, respectively, per 1000 patents during the period under consideration.
6.5. Total RE Installed Capacity/Technology vs. the Total No. of Patents/Technologies
Table 17, Table 18, Table 19 and Table 20 show the relationships between the hydro, wind, solar, and bio installed capacities and the corresponding patents for each technology. The solar energy results (Table 19) in Brazil are excluded because all the data are reported to be zero in the IRENA database during the period 2000–2016. The correlations between the dependent and independent variables are positive and large, which emphasizes the existence of strong positive relations between them. The models satisfied all the statistical tests, which proved to be perfect. The following remarks are drawn from the tables:
- The total hydro installed capacity in Brazil increases by 40.221 GW for one thousand additional hydro patents against 24.044 GW in China and 1.073 GW in the USA.
- Table 18 depicts that the wind capacity increases in China by 4.225 GW for 1000 added wind patents against 3.918 and 3.614 GW in the USA and Brazil.
- The solar capacity increases in China by 496 MW/1000 solar patents versus 392 MW in the USA.
- Table 20 illustrates that the bio energy patents have a strong effect on the bio energy capacity in Brazil, while weak effects are detected for China and the USA. The increase in Brazil’s bio energy capacity is found to be 4011 MW/1000 patents against 297 MW in China and 18 MW in the USA.
7. Conclusions
Several barriers exist in RE development. These barriers can be overcome by enacting some RE support policies such as economic instruments, policy support, and regulatory instruments. In this study, linear regression analysis was used to assess the relationship between RE development and RE policies in the USA, China, and Brazil. The results can be summarized in the following points:
- A significant and positive relationship between the RE development and the total number of policies exists in the three countries under study, especially in China.
- The installed solar and wind capacities are greatly enhanced by the RE policies taken in China. On the other hand, Brazil has the largest capacity per policy ratio in hydro and bio sources. Therefore, countries that want to improve their solar and wind energy capacities should be aware of the policies that China has adopted in those fields. Similarly, countries may benefit from the hydro and bio policies adopted in Brazil.
- There are strong positive relationships between the RE installed capacity and the different policies in China, but the PS + RI policies have the strongest impact on the total RE capacity, followed by the EI + RD&D policies. This is attributed to the dependence of the Chinese government on time-limited strategic plans and legislations in promoting advanced renewable technology applications (such as the RE law, 2009; the plan of the Ministry of Industry, 2012; and the 13th 5-year plan, 2016–2020). In addition, China has used EI policies via introducing subsidies and FITs to renewables.
- In the USA, the EI+RD&D and PS+ RI policies have had positive effects on the total installed RE capacity, while the IE+VA policies have had a negative effect on the total installed RE capacity. On the other hand, the major focus in the USA was on EI policies such as giving subsidies, grants, tax exemptions, and incentives to RE projects (such as the subsidies and grants given to RE projects to produce 188 MW from concentrated solar power and 95 MW from hydropower). Additionally, RD&D policies have the second priority in the USA due to the supporting research programs.
- The EI policy in Brazil has had a strong impact on its installed RE capacity. This may be attributed to the many EI policies considered in Brazil, including the PROINFA program, auctions system, net metering, FIT, tax exemption, and cash incentives (Section 4). It is obvious from the above points that the EI policy is a common factor in the three leading countries and has had a strong impact on RE development. On the other hand, the IE+ VA policies have had a weak or negative impact on the RE development.
- The linear regression results revealed that the patents have had a positive impact on the RE installed capacity in the three countries under study. Thus, the total RE installed capacity increased in China, Brazil, and the USA by 2.686, 6.503, and 1.058 GW, respectively, per 1000 patents during the period 2000 to 2016. In addition, the following points are concluded with respect to patents:
- Hydro patents have had a strong positive influence on the hydro capacity in Brazil, while the impact is less for the United States and China.
- The wind capacity in China has been more positively affected by wind energy patents when compared to the United States or Brazil.
- Solar patents have had a larger positive effect on the installed solar capacity in China when compared to the USA.
- Bio energy patents have had a strong effect on the bio energy capacity in Brazil, while weak effects are detected for China and the USA.
In addition to the beneficial results provided above, this study also has limitations. The results provided in this study may not be generalized to all countries. This is because each country has its specific factors and models associated with the promotion of the RE development. Additionally, the models established for each country depend upon aggregated general policies but not on detailed policies. For example, the EI policy contains 3 categories and 16 subcategories. One of the obtained results proved that the EI policy in Brazil has had a strong impact on its installed RE capacity, but it did not determine which subcategory is involved in that effect. The third limitation lies in the unavailability of data for some ended policies in the IEA database, which may affect the designed models. The excluded policies are 2 policies for Brazil, 10 policies for China, and 20 policies for the USA. Perhaps these shortcomings may be corrected in the future. Additionally, for further future work, this study could be improved on by using more policy categories in measuring the relationship between a policy and RE development and by focusing on other countries with a good RE installed capacity.
Author Contributions
Conceptualization, G.M. and N.T.-E.; methodology, G.M. and N.T.-E.; validation, N.T.-E.; formal analysis, G.M.; writing—original draft preparation, G.M.; writing—review and editing, G.M. and N.T.-E.; supervision, N.T.-E. Both authors have read and agreed to the published version of the manuscript.
Funding
This research received no external funding.
Conflicts of Interest
Both authors declare no conflict of interest.
References
- Zahedi, A. Australian renewable energy progress. Renew. Sustain. Energy Rev. 2010, 14, 2208–2213. [Google Scholar] [CrossRef]
- Hua, Y.; Oliphant, M.; Hu, E.J. Development of renewable energy in Australia and China: A comparison of policies and status. Renew. Energy 2016, 85, 1044–1051. [Google Scholar] [CrossRef]
- Abdmouleh, Z.; Alammari, R.A.; Gastli, A. Review of policies encouraging renewable energy integration & best practices. Renew. Sustain. Energy Rev. 2015, 45, 249–262. [Google Scholar]
- Kim, K.; Kim, Y. Role of policy in innovation and international trade of renewable energy technology: Empirical study of solar PV and wind power technology. Renew. Sustain. Energy Rev. 2015, 44, 717–727. [Google Scholar] [CrossRef]
- Zyadin, A.; Halder, P.; Kähkönen, T.; Puhakka, A. Challenges to renewable energy: A bulletin of perceptions from international academic arena. Renew. Energy 2014, 69, 82–88. [Google Scholar] [CrossRef]
- REN21, Renewables. Global Status Report; REN21 Secretariat: Paris, France, 2018. [Google Scholar]
- Polzin, F.; Migendt, M.; Täube, F.A.; von Flotow, P. Public policy influence on renewable energy investments—A panel data study across OECD countries. Energy Policy 2015, 80, 98–111. [Google Scholar] [CrossRef]
- International Renewable Energy Agency (IRENA). Renewable Capacity Statistics 2018. Report of 2018. Available online: http://www.irena.org/menu/index.aspx?mnu=Subcat&PriMenuID=36&CatID=141&SubcatID=1719 (accessed on 18 January 2019).
- International Renewable Energy Agency (IRENA). Data and Statistics. 2018. Available online: http://resourceirena.irena.org (accessed on 11 December 2018).
- Barbose, G.; Wiser, R.; Heeter, J.; Mai, T.; Bird, L.; Bolinger, M.; Carpenter, A.; Heath, G.; Keyser, D.; Macknick, J. A retrospective analysis of benefits and impacts of US renewable portfolio standards. Energy Policy 2016, 96, 645–660. [Google Scholar] [CrossRef]
- Maguire, K. What’s powering wind? The effect of the US state renewable energy policies on wind capacity (1994–2012). Appl. Econ. 2016, 48, 5717–5730. [Google Scholar]
- Rickerson, W.; Bennhold, F.; Bradbury, J. Feed-in Tariffs and Renewable Energy in the USA—A Policy Update; North Carolina Solar Center: Raleigh, NC, USA; Heinrich Böll Foundation: Hamburg, Germany; World Future Council: Washington, DC, USA, 2008. [Google Scholar]
- Wang, Q. Effective policies for renewable energy—The example of China’s wind power—Lessons for China’s photovoltaic power. Renew. Sustain. Energy Rev. 2010, 14, 702–712. [Google Scholar] [CrossRef]
- Aquila, G.; de Oliveira Pamplona, E.; de Queiroz, A.R.; Junior, P.R.; Fonseca, M.N. An overview of incentive policies for the expansion of renewable energy generation in electricity power systems and the Brazilian experience. Renew. Sustain. Energy Rev. 2017, 70, 1090–1098. [Google Scholar] [CrossRef]
- Maier, S.; Oliveira, L.B. Economic feasibility of energy recovery from solid waste in the light of Brazil’s waste policy: The case of Rio de Janeiro. Renew. Sustain. Energy Rev. 2014, 35, 484–498. [Google Scholar] [CrossRef]
- de Martino Jannuzzi, G.; de Melo, C.A. Grid-connected photovoltaic in Brazil: Policies and potential impacts for 2030. Energy Sustain. Dev. 2013, 17, 40–46. [Google Scholar] [CrossRef]
- Popp, D.; Hascic, I.; Medhi, N. Technology and the diffusion of renewable energy. Energy Econ. 2011, 33, 648–662. [Google Scholar] [CrossRef]
- Nicolli, F.; Vona, F. Heterogeneous policies, heterogeneous technologies: The case of renewable energy. Energy Econ. 2016, 56, 190–204. [Google Scholar] [CrossRef]
- Nesta, L.; Vona, F.; Nicolli, F. Environmental policies, competition and innovation in renewable energy. J. Environ. Econ. Manag. 2014, 67, 396–411. [Google Scholar] [CrossRef]
- Marques, A.C.; Fuinhas, J.A. Are public policies towards renewables successful? Evidence from European countries. Renew. Energy 2012, 44, 109–118. [Google Scholar] [CrossRef]
- Aguirre, M.; Ibikunle, G. Determinants of renewable energy growth: A global sample analysis. Energy Policy 2014, 69, 374–384. [Google Scholar] [CrossRef]
- Liu, W.; Zhang, X.; Feng, S. Does renewable energy policy work? Evidence from a panel data analysis. Renew. Energy 2019, 135, 635–642. [Google Scholar]
- World Energy Council. Energy Trilemma Index. 2018. Available online: https://trilemma worldenergy.org/country profile (accessed on 22 December 2018).
- Tükenmez, M.; Demireli, E. Renewable energy policy in Turkey with the new legal regulations. Renew. Energy 2012, 39, 1–9. [Google Scholar] [CrossRef]
- International Energy Agency. IEA/IRENA Joint Policies and Measures Database. 2018. Available online: http://www.iea.org/policiesandmeasures/renewableenergy (accessed on 23 December 2018).
- Feng, W.; Haitao, Y.; Shoude, L. China’s renewable energy policy: Commitments and challenges. Energy Policy 2010, 38, 1872–1878. [Google Scholar]
- Lo, K. A critical review of China’s rapidly developing renewable energy and energy efficiency policies. Renew. Sustain. Energy Rev. 2014, 29, 508–516. [Google Scholar] [CrossRef]
- Craig, H.; Zhu, J.; Ying, J. Mapping China’s Climate & Energy Policies. Available online: https://www.gov.uk/government/publications/report-mapping-chinas-climate-and-energy-policies (accessed on 12 December 2019).
- Technical Training for Renewable Energies and Energy Efficiency in Brazil—Energypedia.info. Available online: https://energypedia.info/wiki/Technical_Training_for_Renewable_Energies_and_Energy_Efficiency_in_Brazil (accessed on 15 December 2019).
- Michel, A.; Guo, B. China’s 13th Five-Year Plan. Available online: http://www.cepii.fr/CEPII/en/publications/pb/abstract.asp?NoDoc=9474 (accessed on 15 December 2019).
- New Climate Policy Database. Available online: http://climatepolicydatabase.org/index.php/Climate_Policy_Database (accessed on 17 December 2019).
- Executive Order 13514 Federal Leadership in Environmental, Energy, and Economic Performance, Comprehensive Federal Fleet Management Handbook. 2014. Available online: https://www.energy.gov/sites/prod/files/2017/01/f34/eo13514_fleethandbook.pdf (accessed on 18 December 2019).
- US Department of Energy. Solar Energy Technologies Program FY 2007 Annual Report. Available online: https://www1.eere.energy.gov/solar/pdfs/39081.pdf (accessed on 20 December 2019).
- United States, Environmental Protection Agency. Energy and Environment Guide to Action. 2015 Edition. Available online: https://www.epa.gov/sites/production/files/2015-08/documents/guide_action_full.pdf (accessed on 20 December 2019).
- Description of the Energy Policy Tax Incentives Act of 2005. Available online: https://www.finance.senate.gov/imo/media/doc/leg061405a.pdf (accessed on 22 December 2019).
- International Science and Technology Cooperation Program on New and Renewable Energy. Available online: https://mnre.gov.in/international-cooperation (accessed on 24 December 2019).
- United States, Environmental Protection Agency. Summary of the Energy Independence and Security Act. Available online: https://www.epa.gov/laws-regulations/summary-energy-independence-and-security-act (accessed on 22 December 2019).
- Jennings, P. New directions in renewable energy education. Renew. Energy 2009, 34, 435–439. [Google Scholar] [CrossRef]
- International Energy Agency IRENA RD&D for Renewable Energy Technologies: Cooperation Latin America and the Caribbean. Available online: https://www.irena.org/publications/2015/Jul/RDD-for-Renewable-Energy-Technologies-Cooperation-in-Latin-America-and-the-Caribbean (accessed on 5 December 2019).
- Rencher, A.C.; Schaalje, G.B. Linear Models in Statistics; John Wiley & Sons: New Jersey, NJ, USA, 2008. [Google Scholar]
- Chatterjee, S.; Simonoff, J.S. Handbook of Regression Analysis; John Wiley & Sons: New Jersey, NJ, USA, 2013; Volume 5. [Google Scholar]
- Hastie, T.; Tibshirani, R.; Friedman, J. The Elements of Statistical Learning: Data Mining, Inference and Prediction; Springer: New York, NY, USA, 2009. [Google Scholar]
- Testing Assumptions of Linear Regression in SPSS—Statistics Solutions. Available online: https://www.statisticssolutions.com/testing-assumptions-of-linear-regression-in-spss (accessed on 2 October 2020).


Publisher’s Note: MDPI stays neutral with regard to jurisdictional claims in published maps and institutional affiliations. |
© 2020 by the authors. Licensee MDPI, Basel, Switzerland. This article is an open access article distributed under the terms and conditions of the Creative Commons Attribution (CC BY) license (http://creativecommons.org/licenses/by/4.0/).