Article

Phenotypic Dairy Cattle Trait Expressions in Dependency of Social-Ecological Characteristics along Rural–Urban Gradients

1
Institute of Animal Breeding and Genetics, Justus Liebig University Giessen, Ludwigstraße 21 b, 35390 Gießen, Germany
2
Group Animal Husbandry in the Tropics and Subtropics, University of Kassel, Steinstrasse 19, 37213 Witzenhausen, Germany
3
Group Animal Husbandry in the Tropics and Subtropics, Georg-August-University Göttingen, Albrecht-Thaer-Weg 3, 37075 Göttingen, Germany
4
National Institute of Animal Nutrition and Physiology (NIANP), Hosur Rd, Chennakeshava Nagar, Adugodi, Bengaluru, Karnataka 560030, India
*
Author to whom correspondence should be addressed.
Sustainability 2020, 12(21), 9021; https://doi.org/10.3390/su12219021
Submission received: 31 July 2020 / Revised: 17 September 2020 / Accepted: 28 October 2020 / Published: 30 October 2020
(This article belongs to the Special Issue Urban Social-Ecological Systems for Sustainability)

Abstract

:
The aim of the present study was to infer phenotypic trait expressions via mixed modeling considering both social and ecological continuous descriptors simultaneously. In this regard, we selected a challenging heterogeneous social-ecological environment, with focus on the rising megacity Bangalore, located in southern India. Dairy traits from 517 dairy cattle were recorded in 121 herds, equally distributed along a southern and a northern rural–urban gradient of Bangalore, distinguishing between urban, mixed, and rural areas. Repeated records from three visits per herd included production traits (daily milk yield in liter: MY), energy efficiency indicators (body condition score: BCS), cow wellbeing indicators (udder hygiene score: UddHS, upper leg hygiene score: ULHS, hock assessment score: HAS, rectal temperature in °C: RT), and health traits (locomotion score: LS, subclinical mastitis: SubMast). Associations between a continuous rural–urban gradient and phenotypic trait expressions were analyzed via mixed modeling, additionally considering “classic” environmental explanatory variables such as climatic conditions. MY and BCS were higher in urban than in rural areas, associated with reduced SubMast and improved hygiene scores for UddHS and ULHS. Scores for wellbeing indicators HAS and LS were unfavorable for cows in urban areas, indicating poor leg health conditions in that area. In rural areas, least-squares means for RT were quite large, probably due to the scarcity of shading and heat insulation of the barns. To the best of our knowledge, this is the first study disentangling phenotypic trait expressions in the context of social-ecological heterogeneity, contributing to a deeper understanding of physiological mechanisms underlying genotype by environment interactions.

1. Introduction

Traditional dairy cattle breeding focuses on improving milk yield or protein content, but with antagonistic impacts on functional traits such as fertility and health [1]. However, high yielding breeds like Holstein Friesian (HF) are notably sensitive to environmental changes. In this regard, climate impacts due to global warming are a major current challenge for the dairy industry. Klinedinst et al. [2] observed extended summer periods resulting in increased heat stress and detrimental effects on milk production and conception rate. Heat stress is also associated with reduced protein yield [3] and impaired female fertility [4]. In addition to summer season or heat stress impacts, management characteristics [5], feeding systems [6], and heterogeneous grassland conditions [7] are associated with phenotypic trait expressions in harsh environments. Social components such as farm management characteristics and human–animal relationships (as well as their interactions) also influence susceptibility to disease infections [8], productivity, and animal behavior [9,10]. Manivannanan and Tripathi [11] found that urban dairy farms have developed a more efficient dairy management through better and wider social contacts, better availability of inputs (veterinary services, concentrate feed), and a high commercial orientation [12]. Such economic motivation is the result of the union between the producer and the consumer. On one hand, the urban consumer prefers fresh, raw milk and relies on direct producer–consumer market, and on the other hand, the producer benefits from a more profitable sales channel. Moreover, the union between the producer and the consumer is strengthened by the sociocultural services provided by the cows to the Indian society, because as a sacred animal, it is still part of many religious ceremonies [13,14]. In contrast, rural farmers have based their management on lower commercial orientation, traditionalism, and scarcity of resources thus affecting their efficiency [11]. The combination of social and environmental components, within a so-called social-ecological system, has recently been introduced for livestock farming systems’ classification [15]. Rising megacities represent “hot spots” of complex and dynamic social-ecological systems because they are more vulnerable to environmental and anthropogenic hazards, and their socio-economic components are more diverse than those of smaller urban areas [16]. The social-ecological heterogeneity along rural–urban gradients in rising megacities might influence dairy production, a vital livestock sector in many regions of Asia and Africa [17,18].
World milk production will substantially increase in the next decade due to population and income growth [19]. India especially will contribute to this development by 2027, with a global milk market share of 25% [19]. In consequence, the Indian cattle population is continuously increasing, currently comprising more than 61 million dairy cattle [20]. Productivity of dairy cattle is however low, ranging for example from 1.5 to 7 L per cow and day for Indian local Zebu cattle [21]. To improve milk yields, exotic breeds, mainly Jersey and Holstein Friesian (HF), have been imported during the past decades and used in pure breeding or crossbreeding schemes with local Zebu. In contrast to local Zebu cattle, high yielding Jersey and HF populations have mainly been selected for European and North American indoor production systems and are less adapted to harsh environments, while Zebu cattle have improved body temperature regulation abilities in response to heat stress [22]. Likewise, Al-Kanaan [23] identified stronger environmental sensitivity (i.e., obvious productivity changes with environmental alterations) for HF compared to local dual-purpose populations in Germany. In terms of environmental sensitivity, trait responses have been studied in dependency of specific descriptors such as climate [24], feeding strategies [25], and husbandry systems [26], without modeling descriptor combinations or interactions.
The aim of the present study was to extend the concept of environmental sensitivity through additional consideration of social descriptors. Against this background, we focused on novel functional trait recording along rural–urban gradients, choosing the rising megacity of Bangalore with its challenging environmental conditions and social complexity.

2. Materials and Methods

2.1. Study Area

The study was carried out in the megacity of Bangalore, where population size doubled during the past 15 years, and 16 million inhabitants are expected in 2021 [27]. Bangalore is located in the southern Indian state of Karnataka at 12.97° northern latitude and 77.59° eastern longitude, 920 m above sea level. The climate is of tropical savannah type with two main periods: dry and humid. The humid monsoon period included June, July, August, and September. According to records from the Indian Meteorological Department [28], the wettest month is September with an average total rainfall of 212.8 mm. The driest month is January with an average of only 1.9 mm rainfall. Two seasons can be distinguished in the dry period: a summer season including March, April, and May (daily temperatures between 20 and 34 °C), and a winter season including December, January and February (daily temperatures between to 16 and 31 °C) [28]. As October and November are in-between the humid and dry period, both months were considered as autumn season.

2.2. Farm Selection and Description

To capture a variety of social-ecological settings, farms were randomly sampled from 31 different villages located along a northern and southern transect cutting through the city [29], following the survey stratification index (SSI) developed by Hoffmann et al. [29] to characterize the rural–urban interface of Bangalore (Figure 1). The SSI considers build-up density (houses and infrastructures) and the distance to the city centre and suggests the existence of three strata: “urban” (SSI < 0.3), “rural” (SSI > 0.5), and “peri-urban” or “mixed” (SSI: 0.3–0.5).
A total of 517 dairy cows, from 121 dairy farms in Bangalore, were considered in the present study. A two-step approach was applied to select the 121 dairy farms. In a first step, villages were selected semi-randomly, considering predefined percentages per SSI. In a second step, 20 to 30% dairy cow herds were randomly selected per village (300 herds), based on the latest vaccination list for foot-and-mouth disease. Only dairy cow herds with two or more dairy cows were sampled. The original 300 dairy cow herds were reduced to 121 herds after clustering into 4 groups based on coordinates for herd location, feeding strategies, and predominant herd genotypes. Aiming for a longitudinal trait data structure, each farm was visited three times between June 2017 and April 2018 in intervals of four months. Hence, the same cow was monitored at different lactation stages. Breeds present on the farms included HF, Jersey, native Zebu, “All Black” (synthetics breed from the cross between exotic (HF) sires with native cows), and a mixture of crossbreeds. All breeds were present in the three strata: urban, mixed, and rural. In the urban district, the number of cows per breed ranged from 5 for native and native crossbred to 40 for HF. The number of Jersey crossbred was lowest in the mixed district (7 cows); however, HF counted 80 cows. Moreover, HF was the dominant breed in the rural district (125 cows), and only seven native cows were observed in the same area. Herd size, at the time of selection, ranged from 2 to 12 dairy cows. The mean and range for herd size for the urban, the mixed, and rural district were 5.7 (2 to 12), 3.9 (2 to 8), and 3.7 (2 to 8), respectively. The average lactation number was 2.28. Daily temperature and humidity were recorded punctually on-farm at the time of visit with a weather station (HAMA 87682 LCD THERMO-/HYGROM. TH-200). The average temperature was 26.83 °C, ranging between 15.2 and 36.6 °C. Humidity ranged from 20% to 88%, with an average of 51.21%.

2.3. Cattle Trait Recording

Trait recording included daily milk yield (MY, in liters), body condition score (BCS), hygiene score of the udder (UddHS) and of upper legs (ULHS), hock assessment score (HAS), locomotion score (LS), subclinical mastitis (SubMast), and rectal temperature (RT, in °C). Body condition scores were assigned according to Ferguson et al. [30] ranging from 1 (thin) to 5 (fat) with an increment of 0.25. According to Schreiner and Ruegg [31], UddHS and ULHS ranged between 1 (completely clean) and 4 (completely covered with manure). Following Lombard et al. [32], HAS score 1 was recorded for hocks with hair and without swelling, score 2 for hocks with hair loss and without swelling, and score 3 for hocks with hair loss and swelling. LS ranged from 1 to 5, with a higher score indicating poorer mobility and clinical lameness from 3 onward [33]. Subclinical mastitis (SubMast) was detected utilizing the California Mastitis Test and followed the recording protocol of Kandeel et al. [34]. Hence, SubMast as a somatic count indicator was a binary trait, with a score = 0 for healthy cows and a score = 1 for abnormal milk reactions (sick cows). Descriptive trait statistics are summarized in Table 1. One trained person was responsible for all trait recordings.

2.4. Statistical Models

A variety of linear mixed models, as implemented using the ‘lmer’ function in the lme4 package in R [35], were applied to analyze trait pattern in dependency of the continuous variable SSI. The model variety addressed investigations on the continuous variable SSI, which was studied via linear to quartic regressions. The general model 1, as defined for MY and BCS, is defined as follows:
y ijklmnop = L i + DIM j + B k + YS l + m = 0 q α m ( SSI ) + F n + cow o + e ijklmnop
where yijklmnop = MY or BCS; Li = fixed effect for lactation number (1, 2, 3, 4, ≥5); DIMj = fixed effect for days in milk classes (<3 months, 3–7 months, 7–12 months, >12 months); Bk = fixed effect for breeds (native Zebu, HF, Jersey, All Black and their crossbreeds); YSl = fixed effect for year-season (2017-Monsoon, 2017-Autumn, 2017-Winter, 2018-Winter, 2018-Summer); αm = fixed regression coefficients (first to fourth orders Legendre polynomials (LP) in consecutive runs) for SSI, ranking from 0 to 1; Fs = random farm effect; cowt = random cow effect for repeated measurements; and eijklmnop = random residual effect. Residuals for MY from model 1 were defined as adjusted MY for ongoing trait modeling strategies. Three milk yield classes (MYC) were defined based on adjusted milk yield: low, medium and high MYC, with a respective average (unadjusted) milk yield per class of 6.77, 9.96, and 15.52 L per cow and day.
Model 2 was designed for the health and wellbeing indicator traits, additionally considering interactions between productivity (MYC) and SSI. Temperature and humidity were only considered for the analysis of RT:
y ijklmnprstu = L i + DIM j + B k + YS l + H m + T n + p = 0 q α rp MYC r ( SSI ) + F s + cow t + e ijklmnprstu
where yijklmnoprstu = UddHS, ULHS, HAS, LS, SubMast or RT; Hm = fixed effect for environmental humidity classes (“low” = 0 to 30%, “medium” = 31 to 60%, and “high” = 61 to 90%); Tn = fixed effect for environmental temperature classes (“comfortable” ≤ 24 °C, “stress” = 24 to 28 °C, and “high stress” ≥ 28 °C); MYCr = fixed effect for adjusted MY classes (high, medium and low); and αrp = fixed regression coefficients (first to fourth orders LP in consecutive runs) for MYC nested within SSI.
The Bayesian information criterion (BIC) derived from maximum likelihoods was used for model evaluations. Variance components and estimates for fixed effects from model 1 and 2 were based on restricted maximum likelihood.

3. Results

3.1. SSI Modeling Evaluations and General SSI Impact

Models 1 and 2 showed the smallest BIC (indicating model superiority) when modeling continuous SSI with LP1 and LP4 (see Table S1 in Supplementary Materials). The quartic function (LP4) was associated with the largest BIC values for all traits. Hence, regarding the following interpretations of trait pattern, we focus on results from LP1 and LP4 modeling. LP1 modeling for SSI was significant for MY, BCS, UddHS, ULHS, HAS, and RT (p < 0.05). None of the modeling strategies for SSI identified significant associations with the traits LS and SubMast. The breed effect significantly (p < 0.05) influenced MY, BCS, UddHS, ULHS, and HAS (p < 0.05; Table 2). However, the sampled number of native cattle was quite small with only 22 native cows in total (5 cows from the urban, 10 cows from the mixed, and 7 cows from the rural area).

3.2. SSI Impact on Milk Yield and Body Condition Score

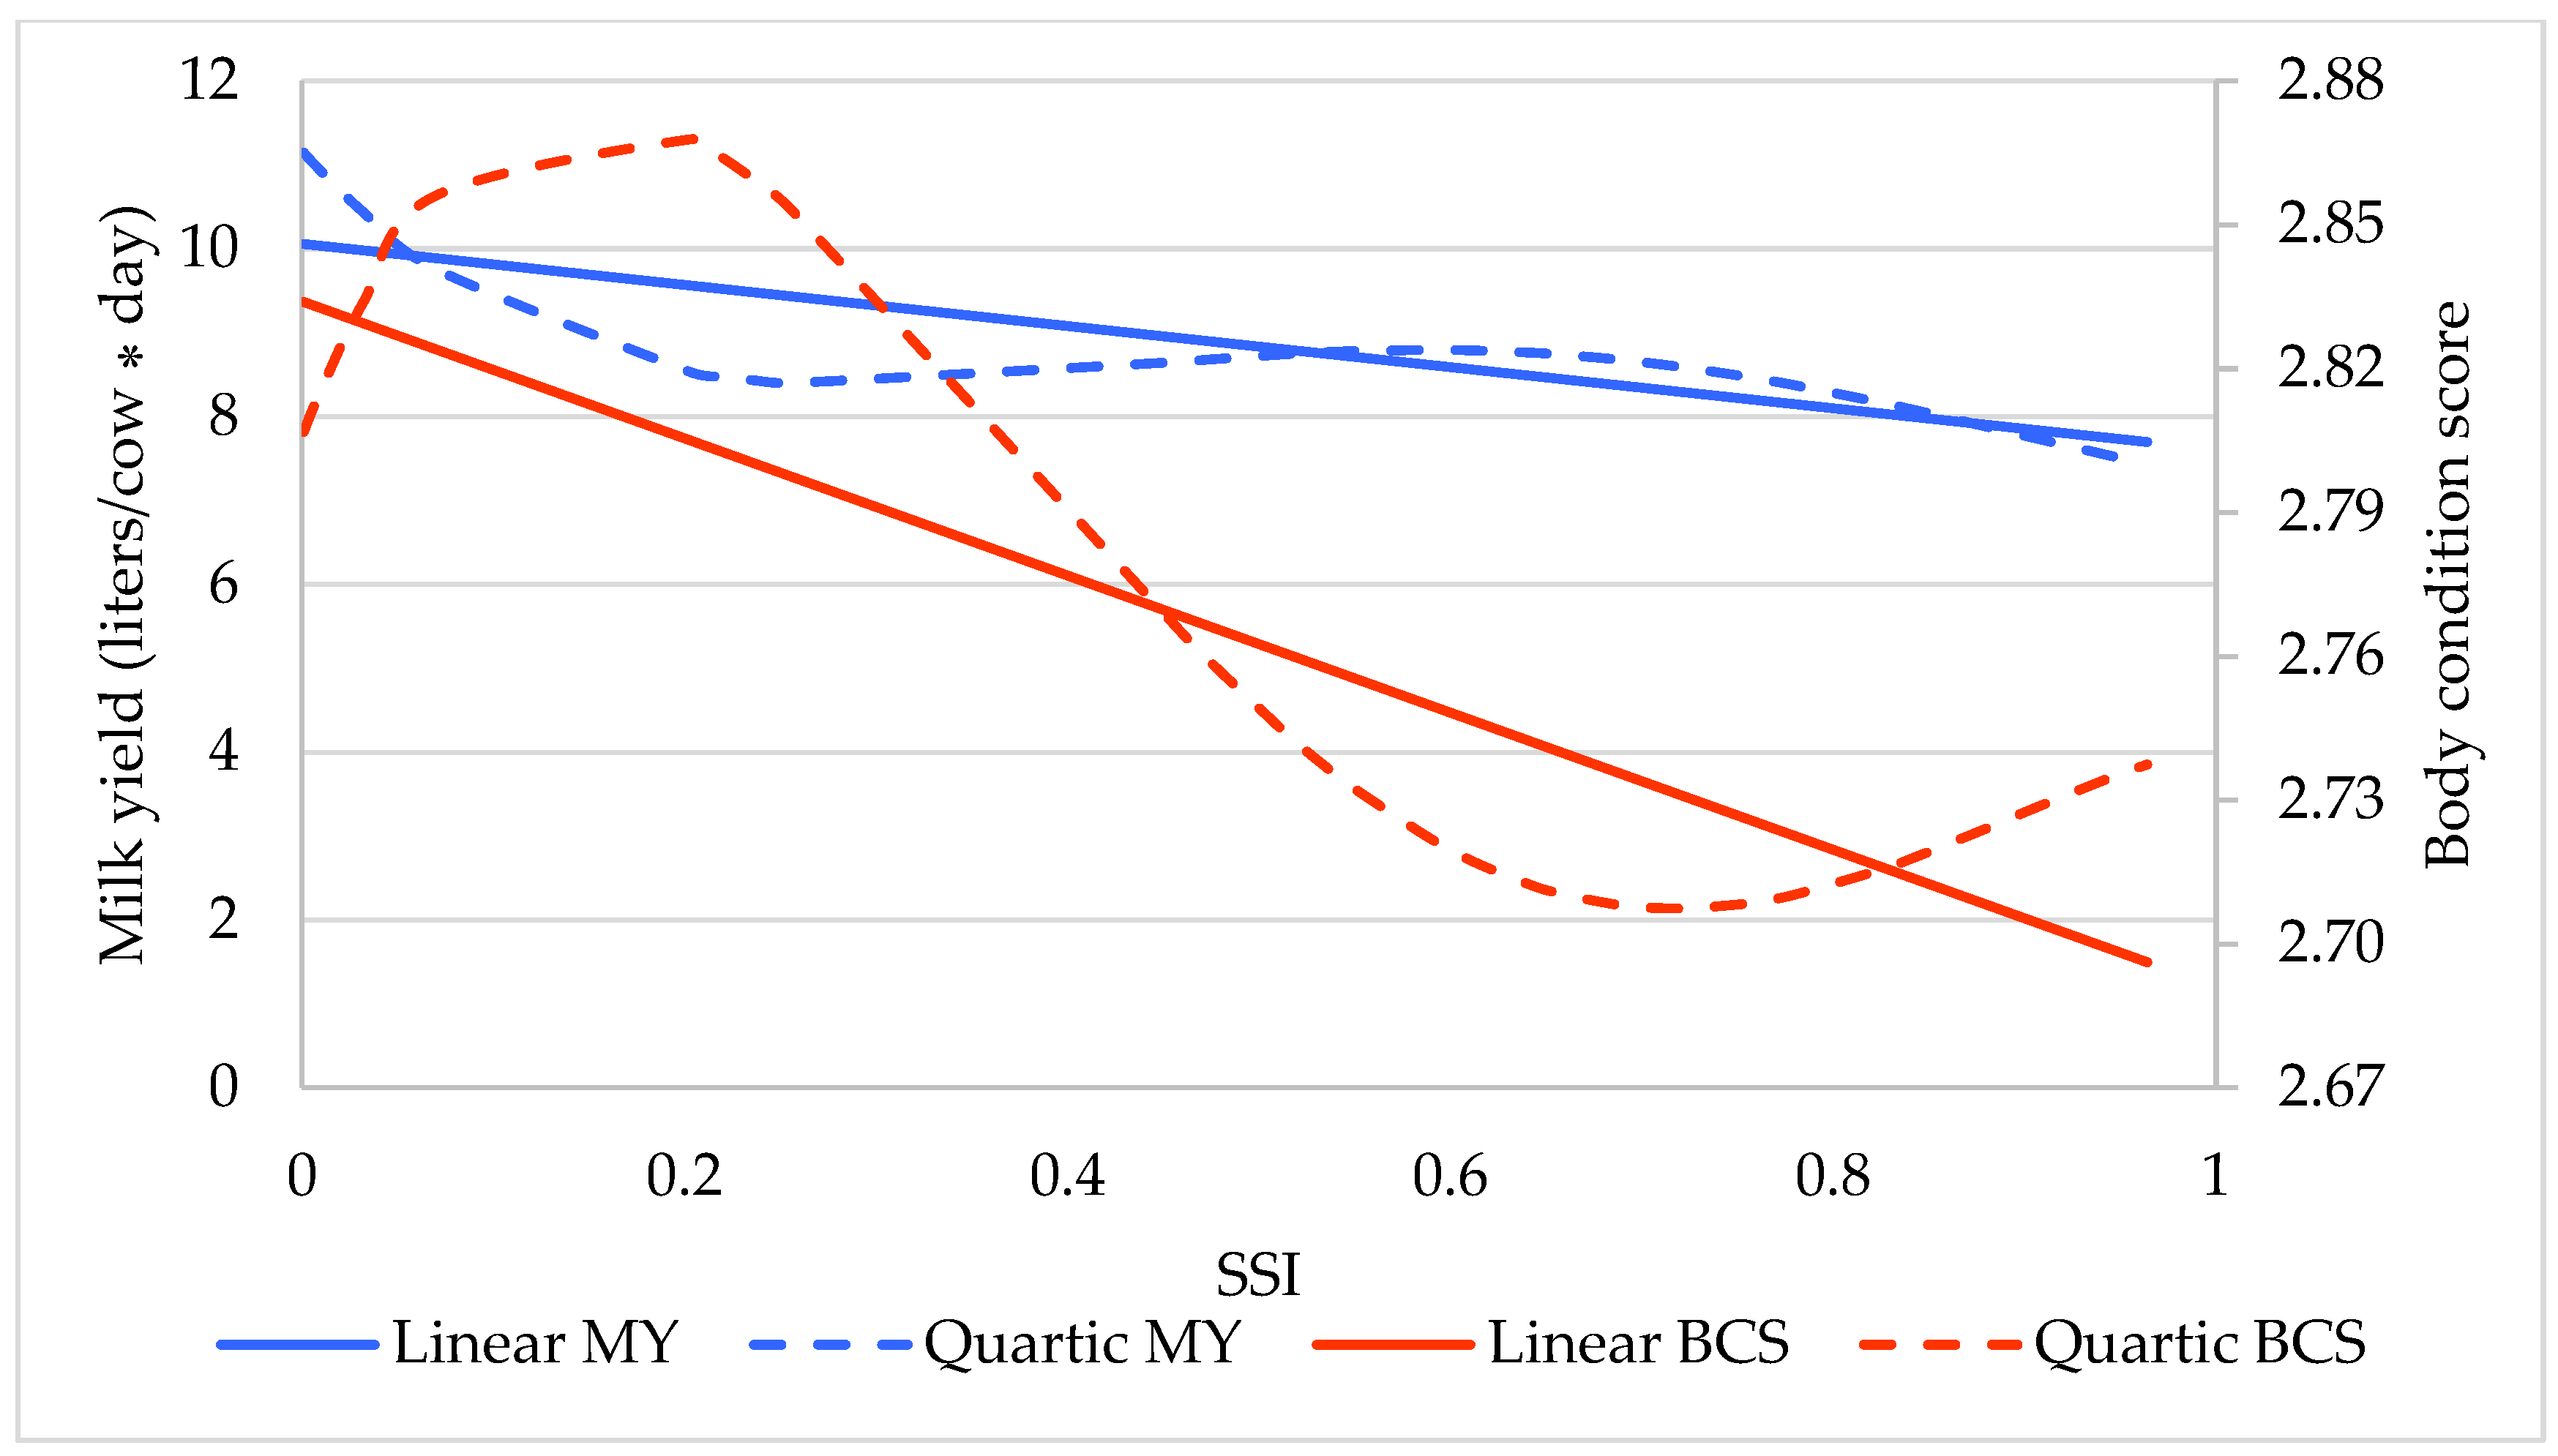
Least square means for MY decreased along the SSI for both modeling strategies LP1 and LP4 (Figure 2, results from model 1). According to the linear SSI modeling, cows in urban areas produced an average of 10.04 L of milk per day, but cows in rural areas produced only 7.69 L per day. Likewise, the quartic SSI function (i.e., LP4) indicated a significant decline in MY for cows kept in rural areas. Within the urban areas, MY was at its lowest (8.40 L per day) for SSI 0.26. However, MY was lowest (7.44 L per day) across the quartic curve pattern in the very remote rural areas (SSI = 0.97). Variance components for MY and BCS using LP1 were 2.95 and 0.06 for the cow effect, 6.89 and 0.01 for the farm effect, and 11.44 and 0.04 for the residual effect, respectively. When changing the modeling strategies to LP4, the variance components were very similar.
As inferred for MY, the linear regression line (LP1) in model 1 for BCS decreased (Figure 2) with increasing SSI (from 2.83 at SSI 0 to 2.69 at SSI 1). However, the quartic curve pattern (LP4) showed a partly different trait response for MY and BCS in dependency of SSI. One example for the opposite BCS and MY trait responses is the highest BCS (2.87) at 0.2 and the lowest BCS (2.71) at SSI 0.7, while daily MY was similar at both SSI levels (8.53 L at SSI 0.2 and 8.59 L at SSI 0.7).

3.3. Impact of SSI on Health and Hygienic Score

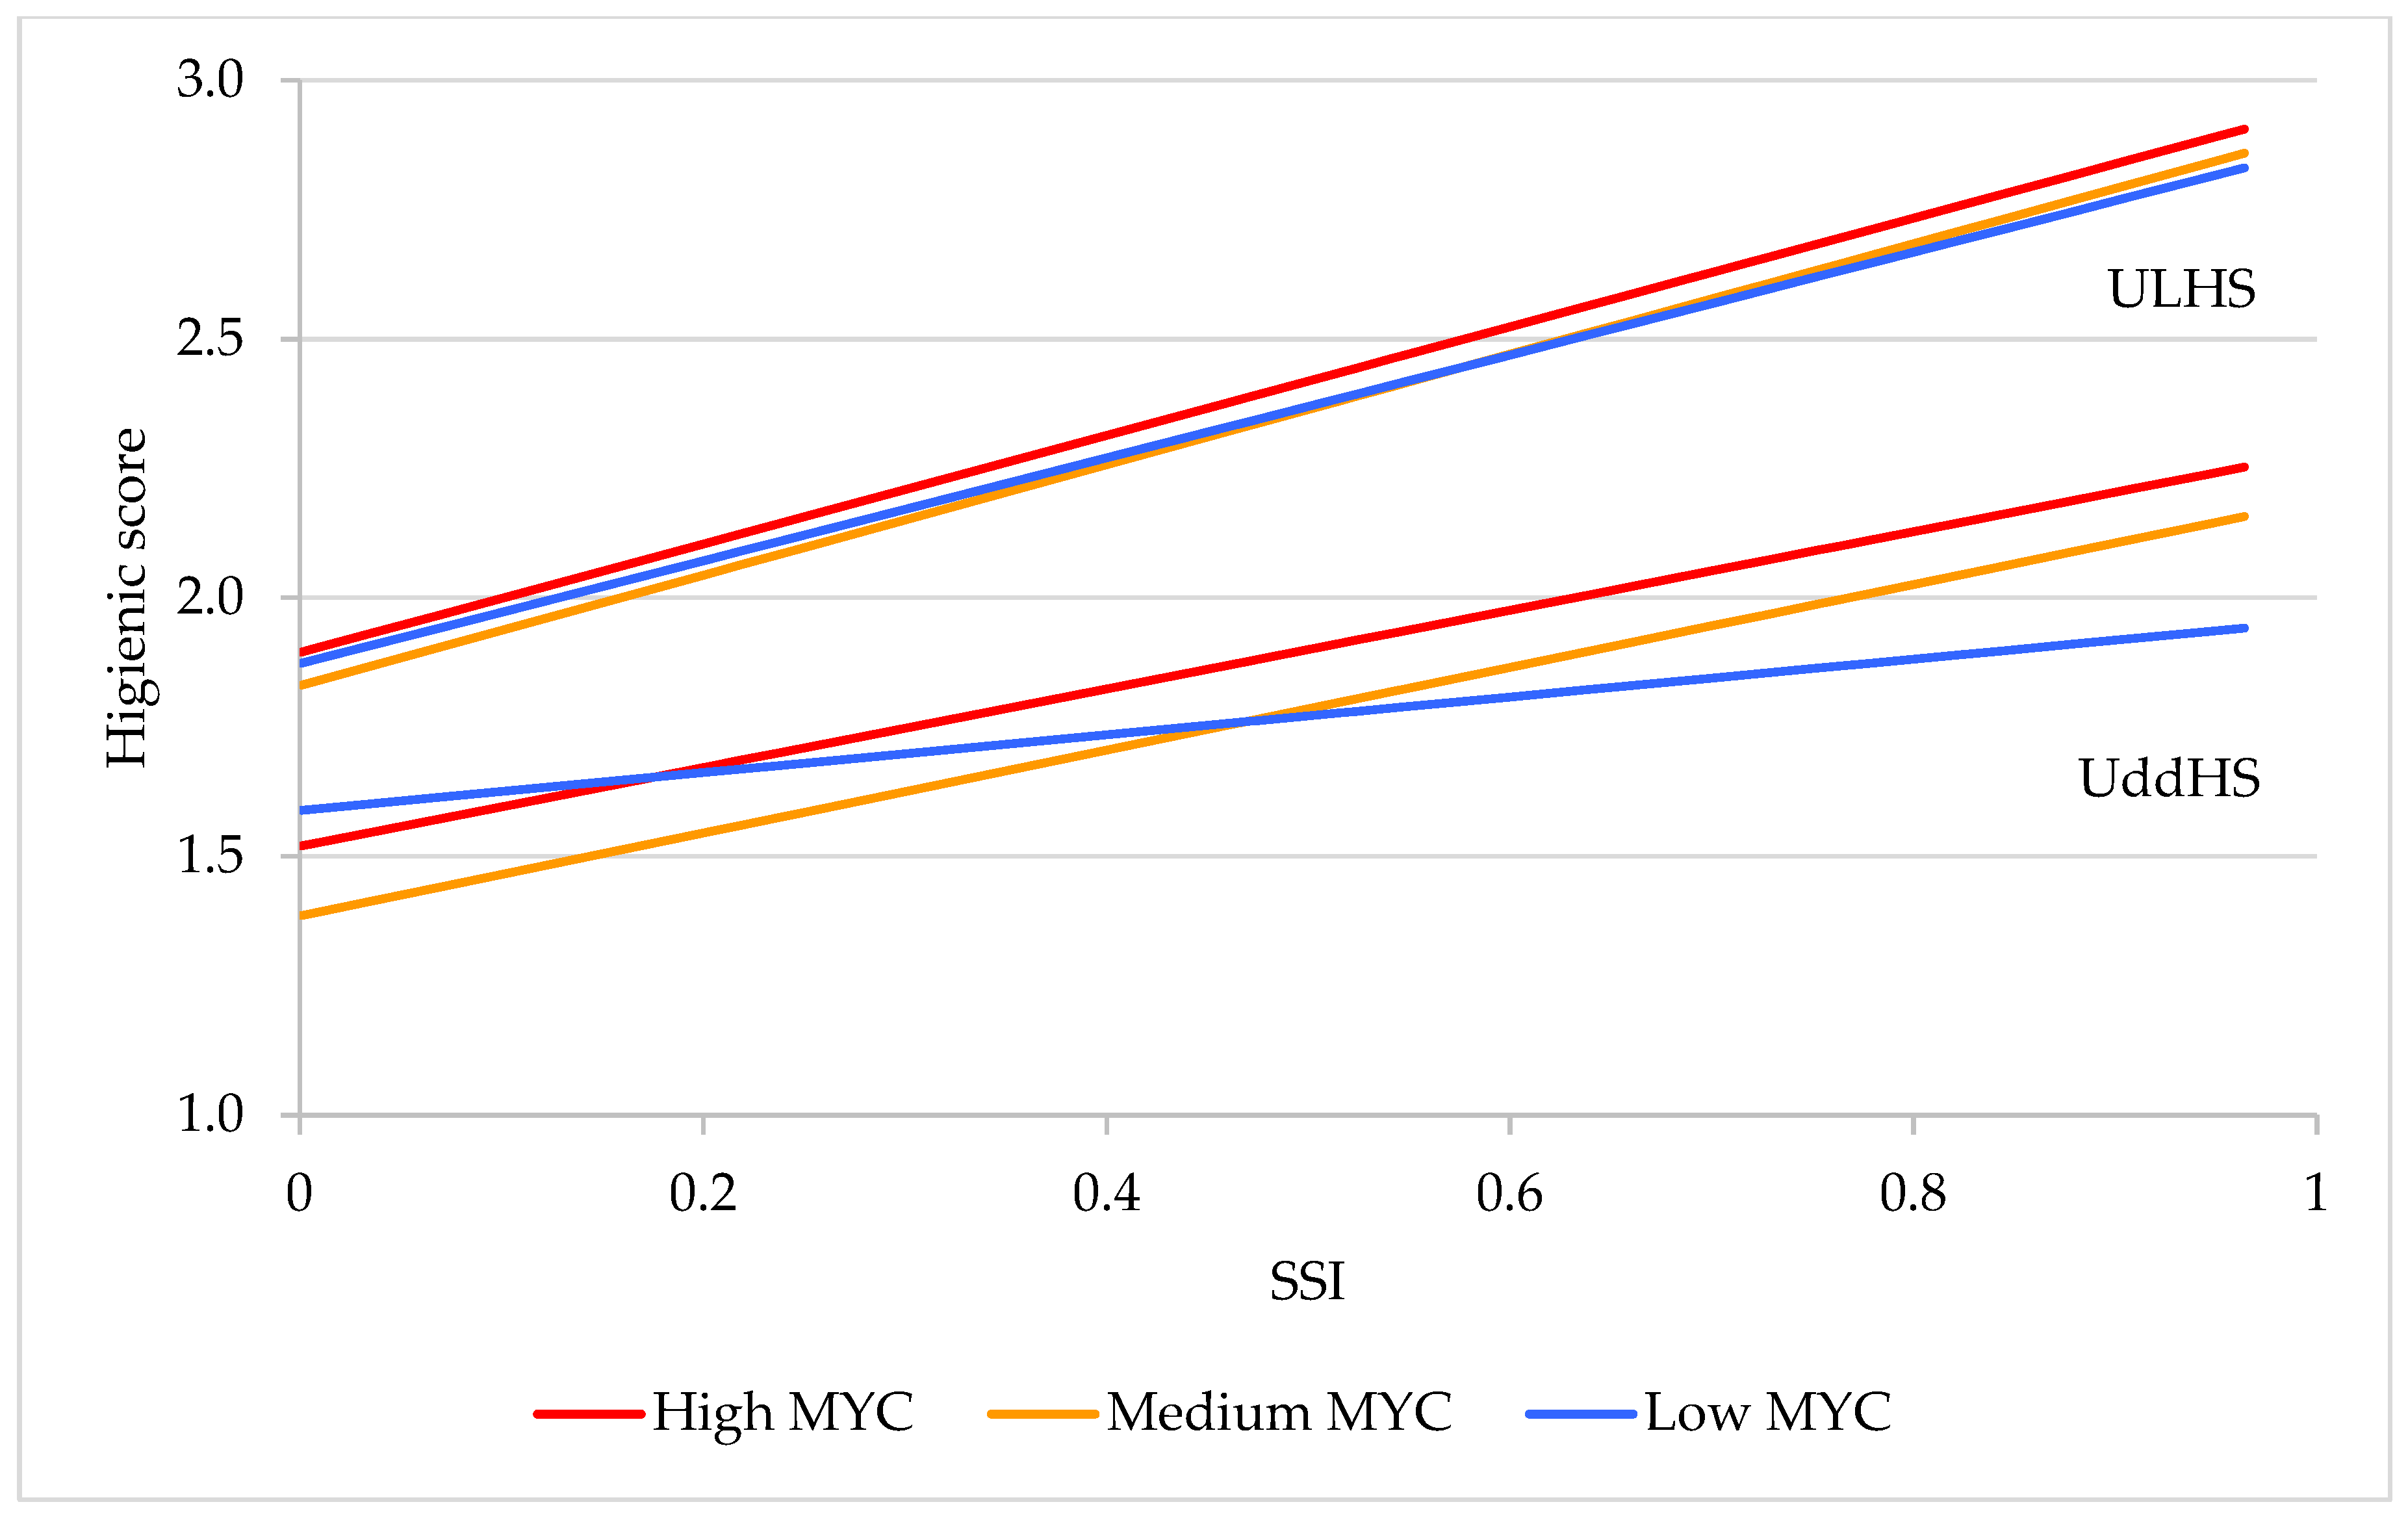
Both hygiene scores UddHS and ULHS showed similar trait responses to SSI, with increasing SSI, UddHS, and ULHS, indicating that cattle were cleaner in urban than in rural areas (Figure 3, results from model 2). Linear regression lines for UddHS and ULHS in high and medium MYC were parallel, with the scores for UddHS smaller than ULHS. Variances explained by the cow, farm, and residual effects were 0.06, 0.36, and 0.57 for UddHS, respectively, and 0.00, 0.53, and 0.58 for ULHS, respectively.
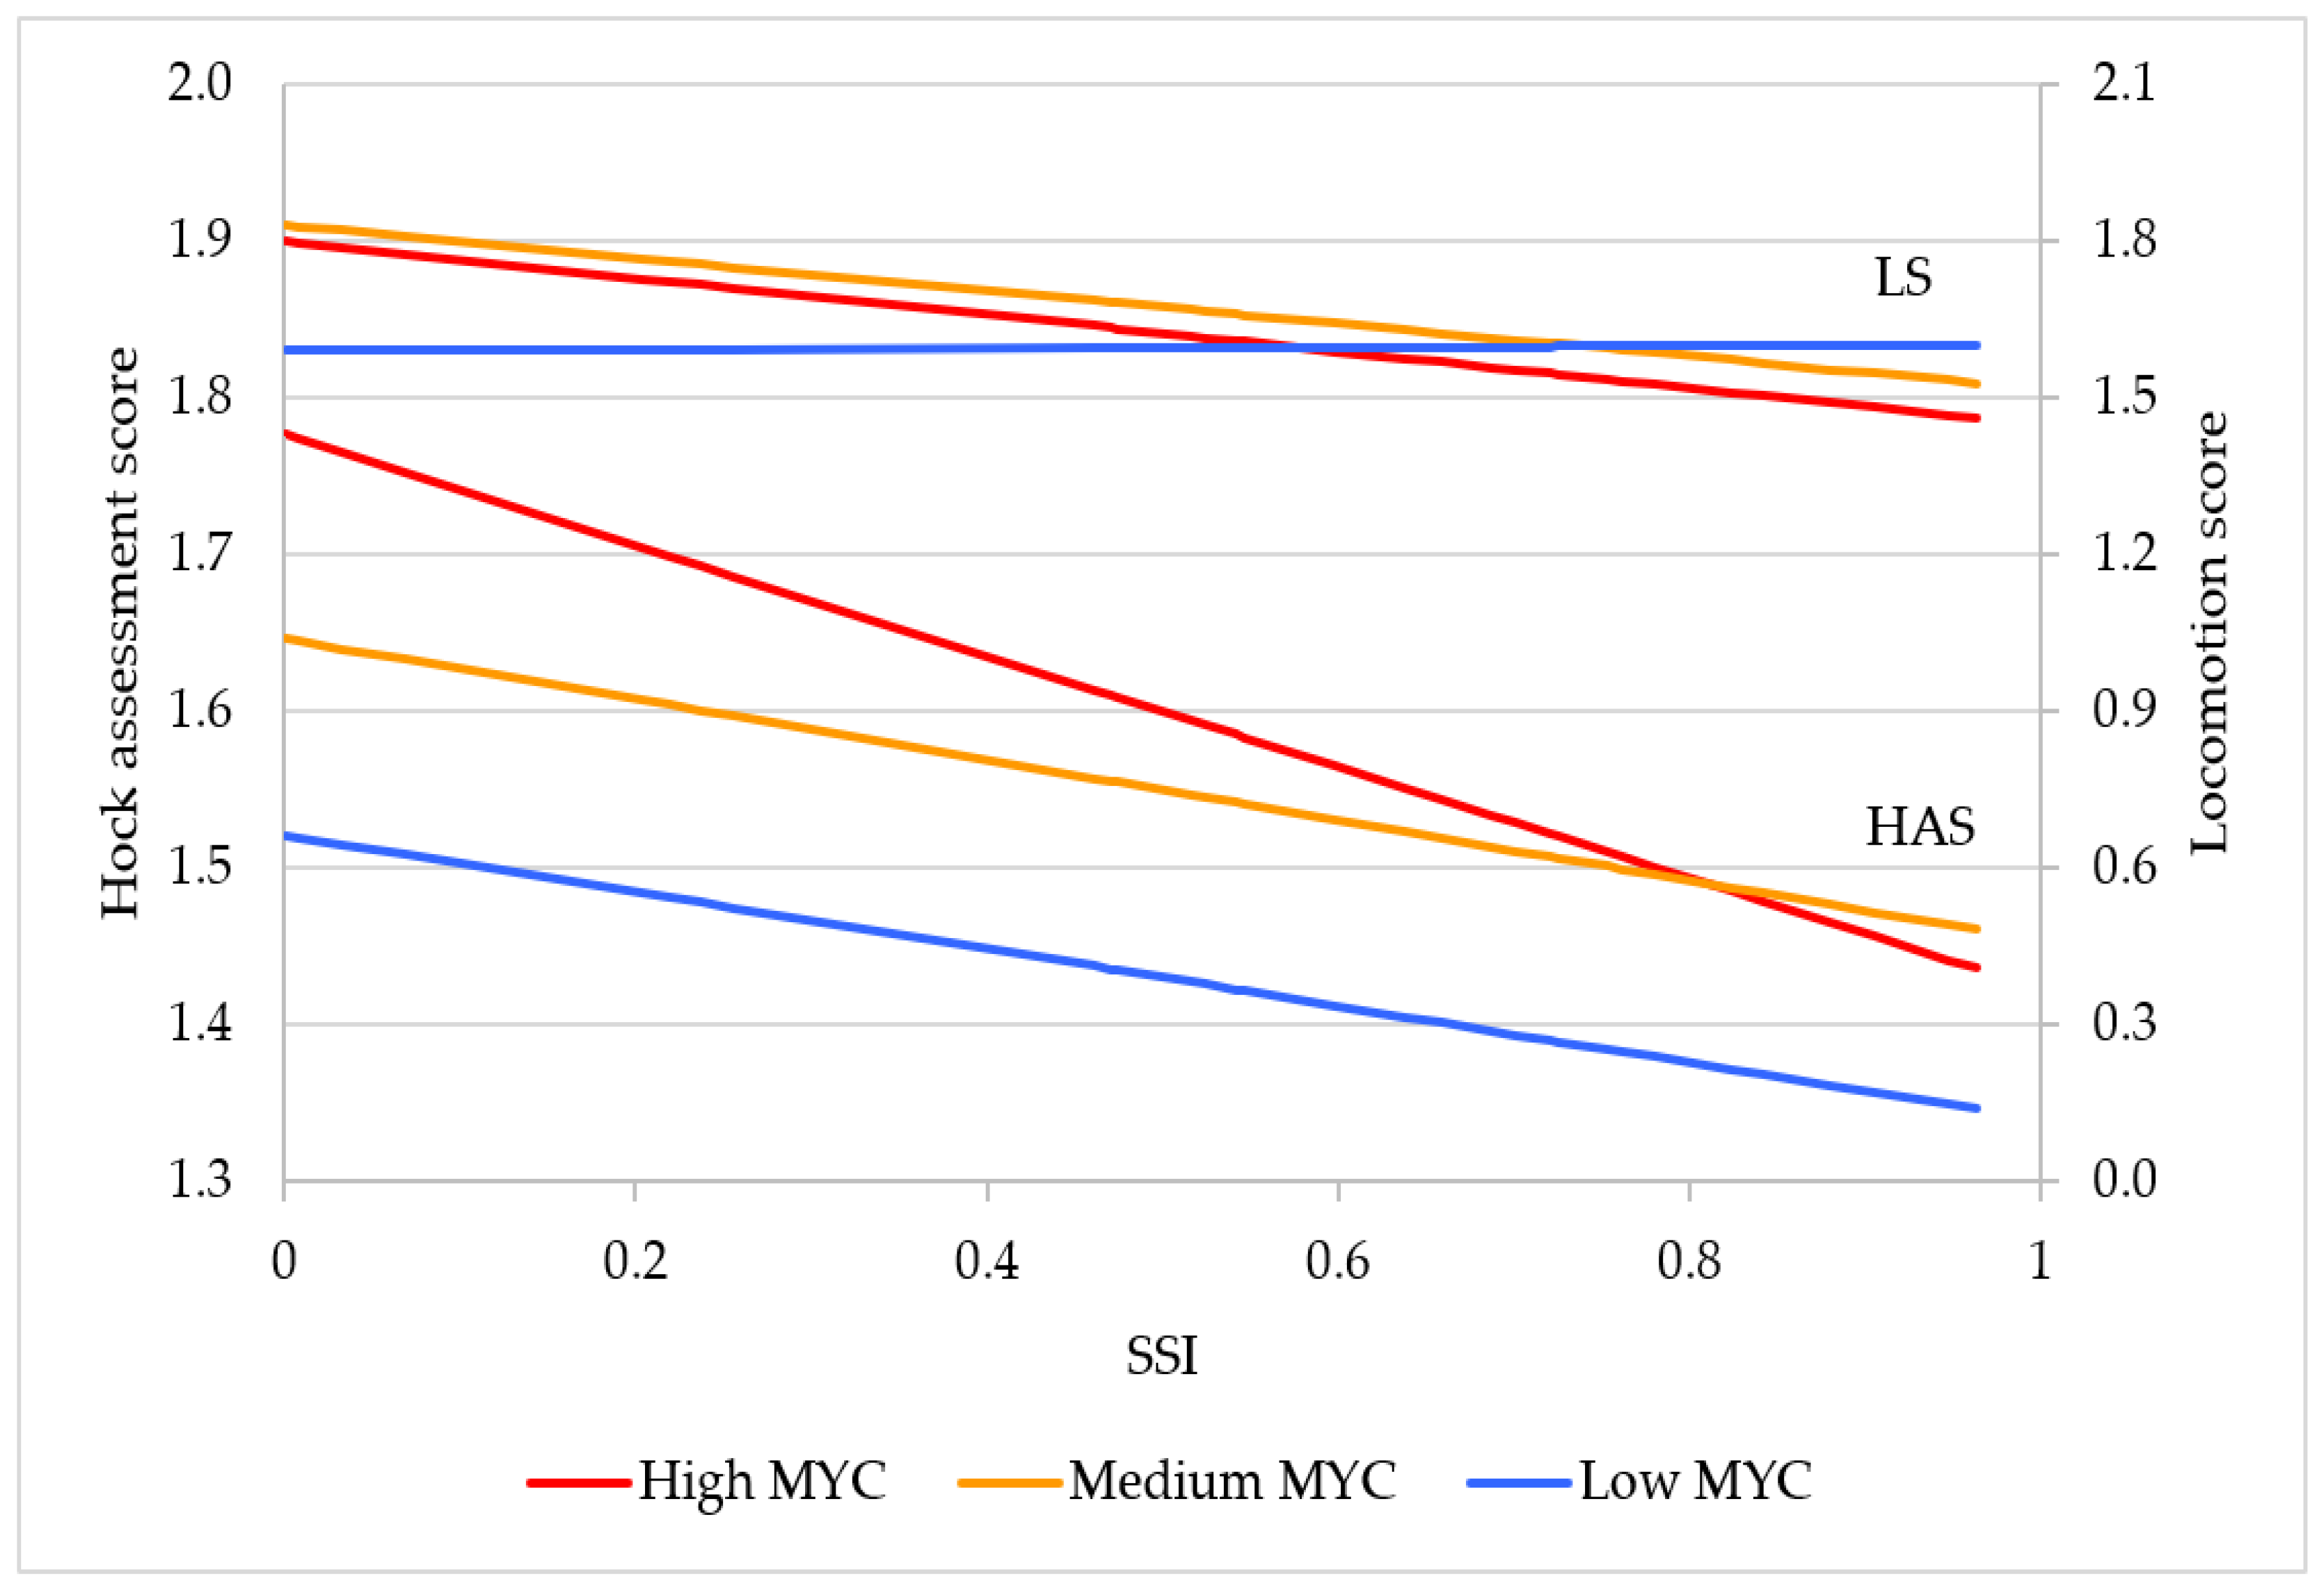
According to the linear modeling using model 2, HAS decreased gradually from urban to rural areas, indicating an improved leg health status for cattle kept in rural areas (Figure 4). Considering cow productivity, cows in the low MYC had a low prevalence for hock injuries across the SSI. HAS was the highest in urban district for cows in the high MYC, followed by cows in the medium MYC. As SSI increased, difference in HAS values between cows in the high and medium MYC decreased, reaching an equal HAS score in rural areas (SSI 0.82). Estimated variances for the cow, farm, and residual effects were 0.07, 0.04, and 0.16, respectively.
Model 2 was also used to analyze LS responses. With regard to the linear SSI modeling, LS for cows in the low MYC equaled 1.6 and was quite constant across the SSI (Figure 4). At SSI 0, LS was 1.83 for cows in the medium MYC and 1.80 for cows in the high MYC and decreased to 1.53 and 1.46 at SSI 1. Interactions between MYC and SSI were not significant for LS. Variances were 0.45 for the cow effect, 0.14 for the farm effect, and 0.15 for the residual effect.
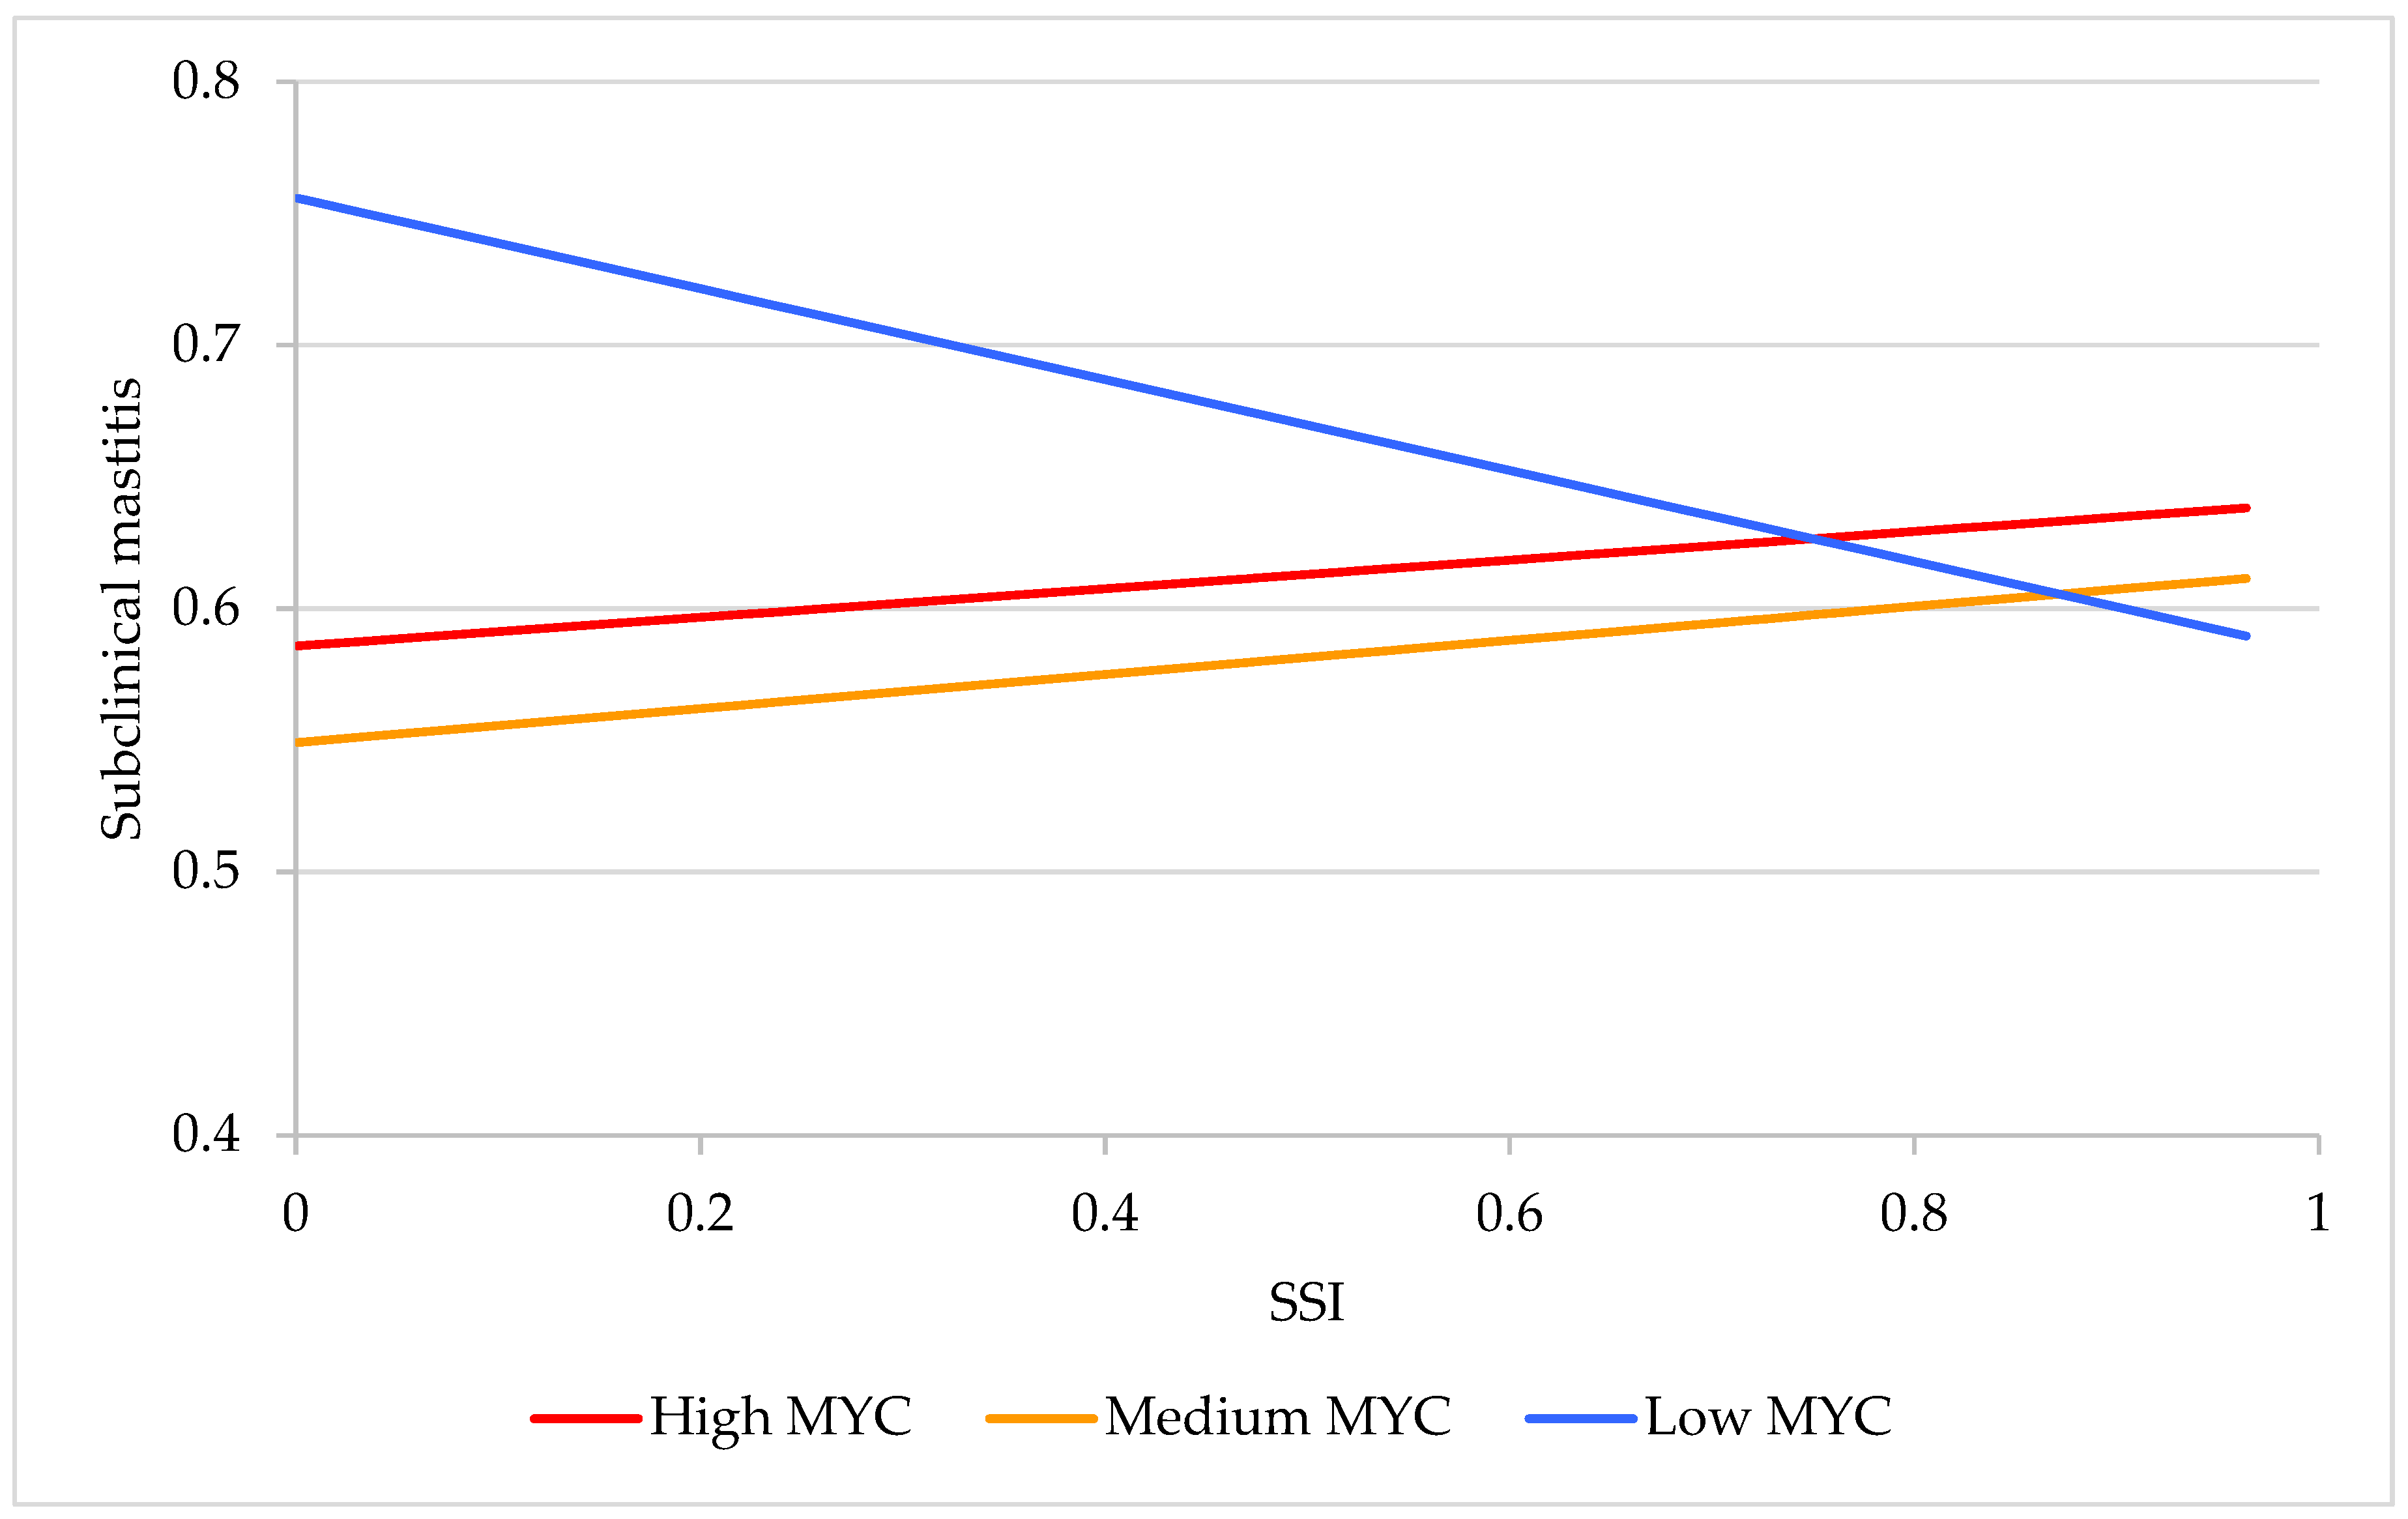
For SubMast, no significant interactions (p > 0.05) between MYC and SSI were identified. For cows in the high and medium MYC, the incidence of SubMast increased by 5% from SSI 0 to SSI 1 (Figure 5). Similar SubMast responses along the SSI (from 0 to 1) were observed for cows in the high and the medium MYC, i.e., an obvious increase of disease incidence from 0.59 to 0.64 and from 0.55 to 0.61, respectively. In urban areas, disease incidence was significantly higher for cows in the low MYC compared to cows in the high MYC (+16.99%). However, in rural areas, opposite effects were observed, i.e., lower disease incidences for the low MYC cow group (−4.86%). Variance components for SubMast were 0.08, 0.01, and 0.15 for the cow, farm, and residual effects, respectively.

3.4. Impact of SSI on Rectal Temperature

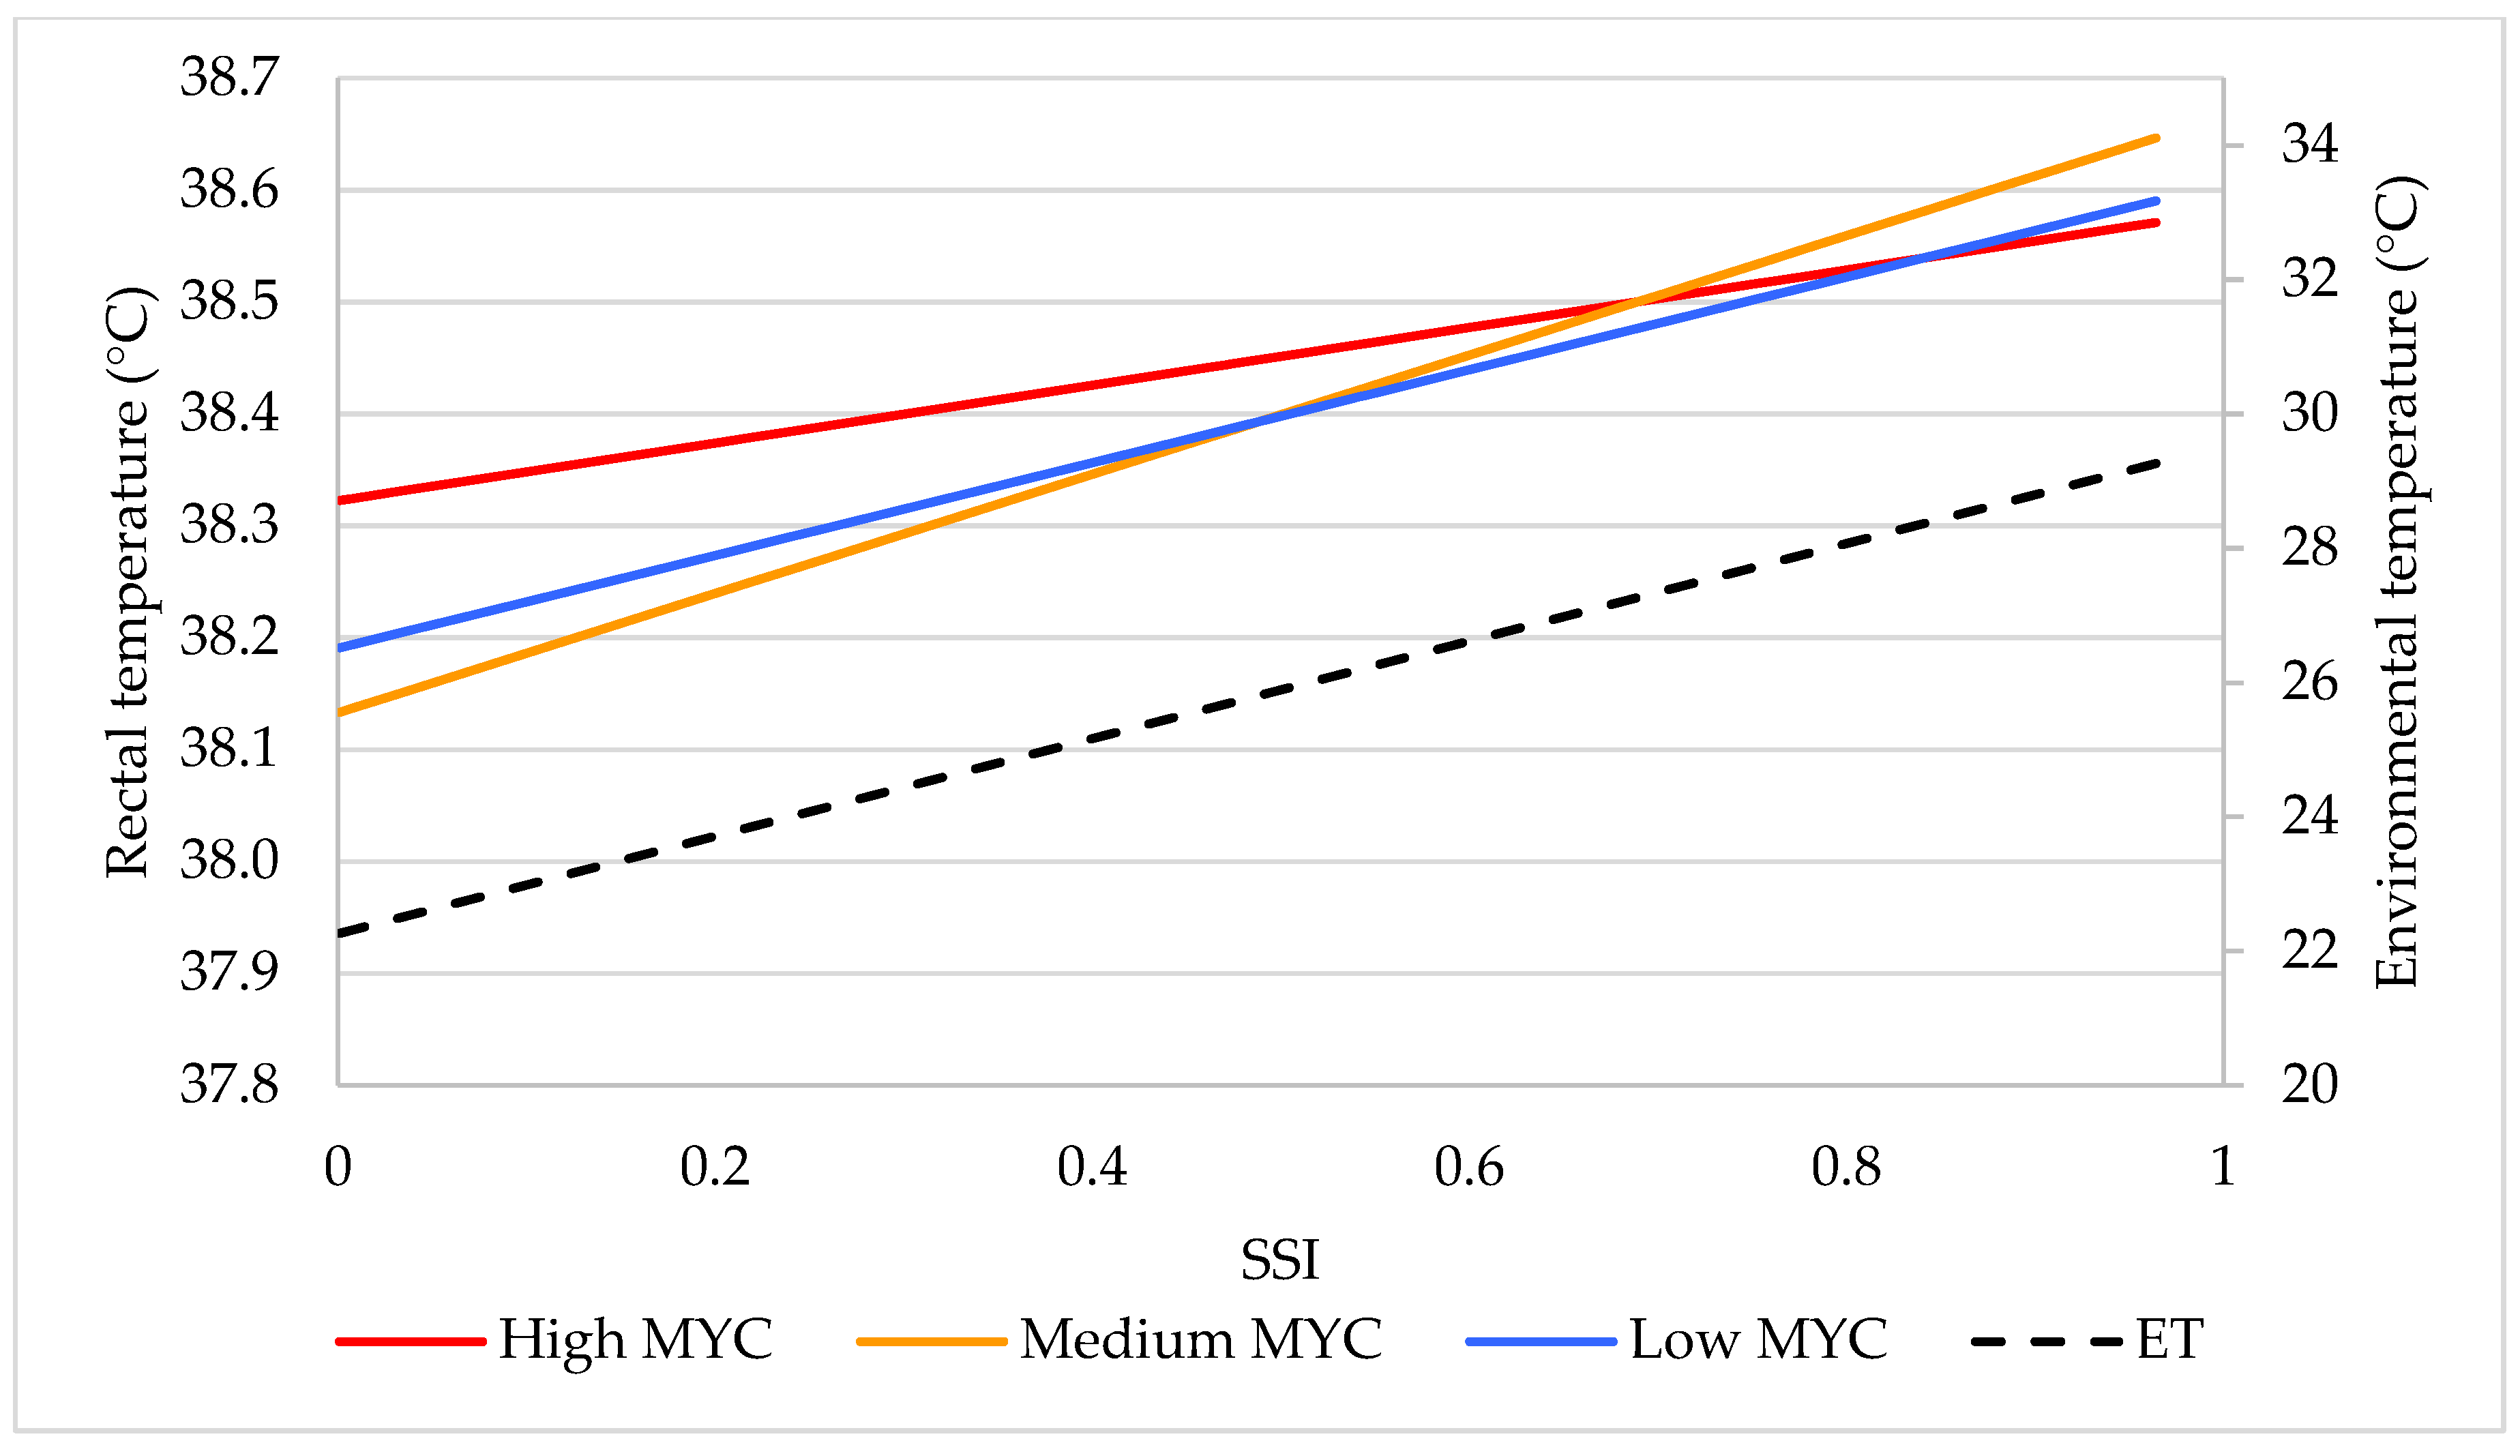
RT increased in dependency of SSI. This was the case for all MYC (Figure 6, results from model 2). In urban areas, least squares mean for RT of cows in the high MYC was highest (38.34 °C), followed by cows from the low (38.20 °C) and medium (38.14 °C) MYC. Between SSI 0.6 and SSI 0.8, trait response for RT was within the same range but diverged again slightly in rural areas ranging between 38.67 °C (medium MYC) and 38.57 °C (high MYC). Cow, farm, and residual variances for the RT were 0.00, 0.10, and 0.24, respectively.

4. Discussion

4.1. Milk Yield and Body Condition Score in Dependency of SSI

Across the whole SSI, MY was low with an average of 10.67 L per cow and day (Table 1), which is well below HF kept in European indoor production systems and reflects the harsh environment of Bangalore. However, the recorded MY is similar to the 7.1 kg of MY per day and crossbreed cow kept in India for the 2011/14 period [36]. A higher MY in urban areas compared to rural or mixed ones is not a particularity for Bangalore, in the capital of Lesotho, the average MY per cow and day in urban farms was 12.77 L compared to 11.3 L in mixed farms [37]. However, in contrast to Bangalore, the price of milk was higher in mixed areas compared to urban ones [37]. Although urban and mixed dairy farmers face challenges like lack of space, fodder scarcity, labor shortage, and inappropriate disposal of animal excreta, they implement alternative management strategies to overcome such challenges. In this regard, they, e.g., focus on “free cattle feed” strategies, using organic kitchen waste from shops and neighbors with high nutritional value. These farmers have the freedom to set their own milk price, and the urban milk market is continuously increasing. Farmers in urban areas sell their milk directly to customers and decide their own price (0.35–0.45 €/L), whereas the milk collection centers in rural areas pay fixed milk prices in the narrow range from 0.29–0.31 €/L (own unpublished data). Despite the above-mentioned constraints, such social influences act as a stimulant for higher productivity in urban areas. Moreover, Indian urban dairy farms have developed an efficient dairy management through a commercial orientation and through consideration of veterinary services [11]. The commercial success of urban dairy cow farming is related to consumer preferences for fresh dairy products. Furthermore, milk quality is improved through consumer impact on the milk production chain [12].
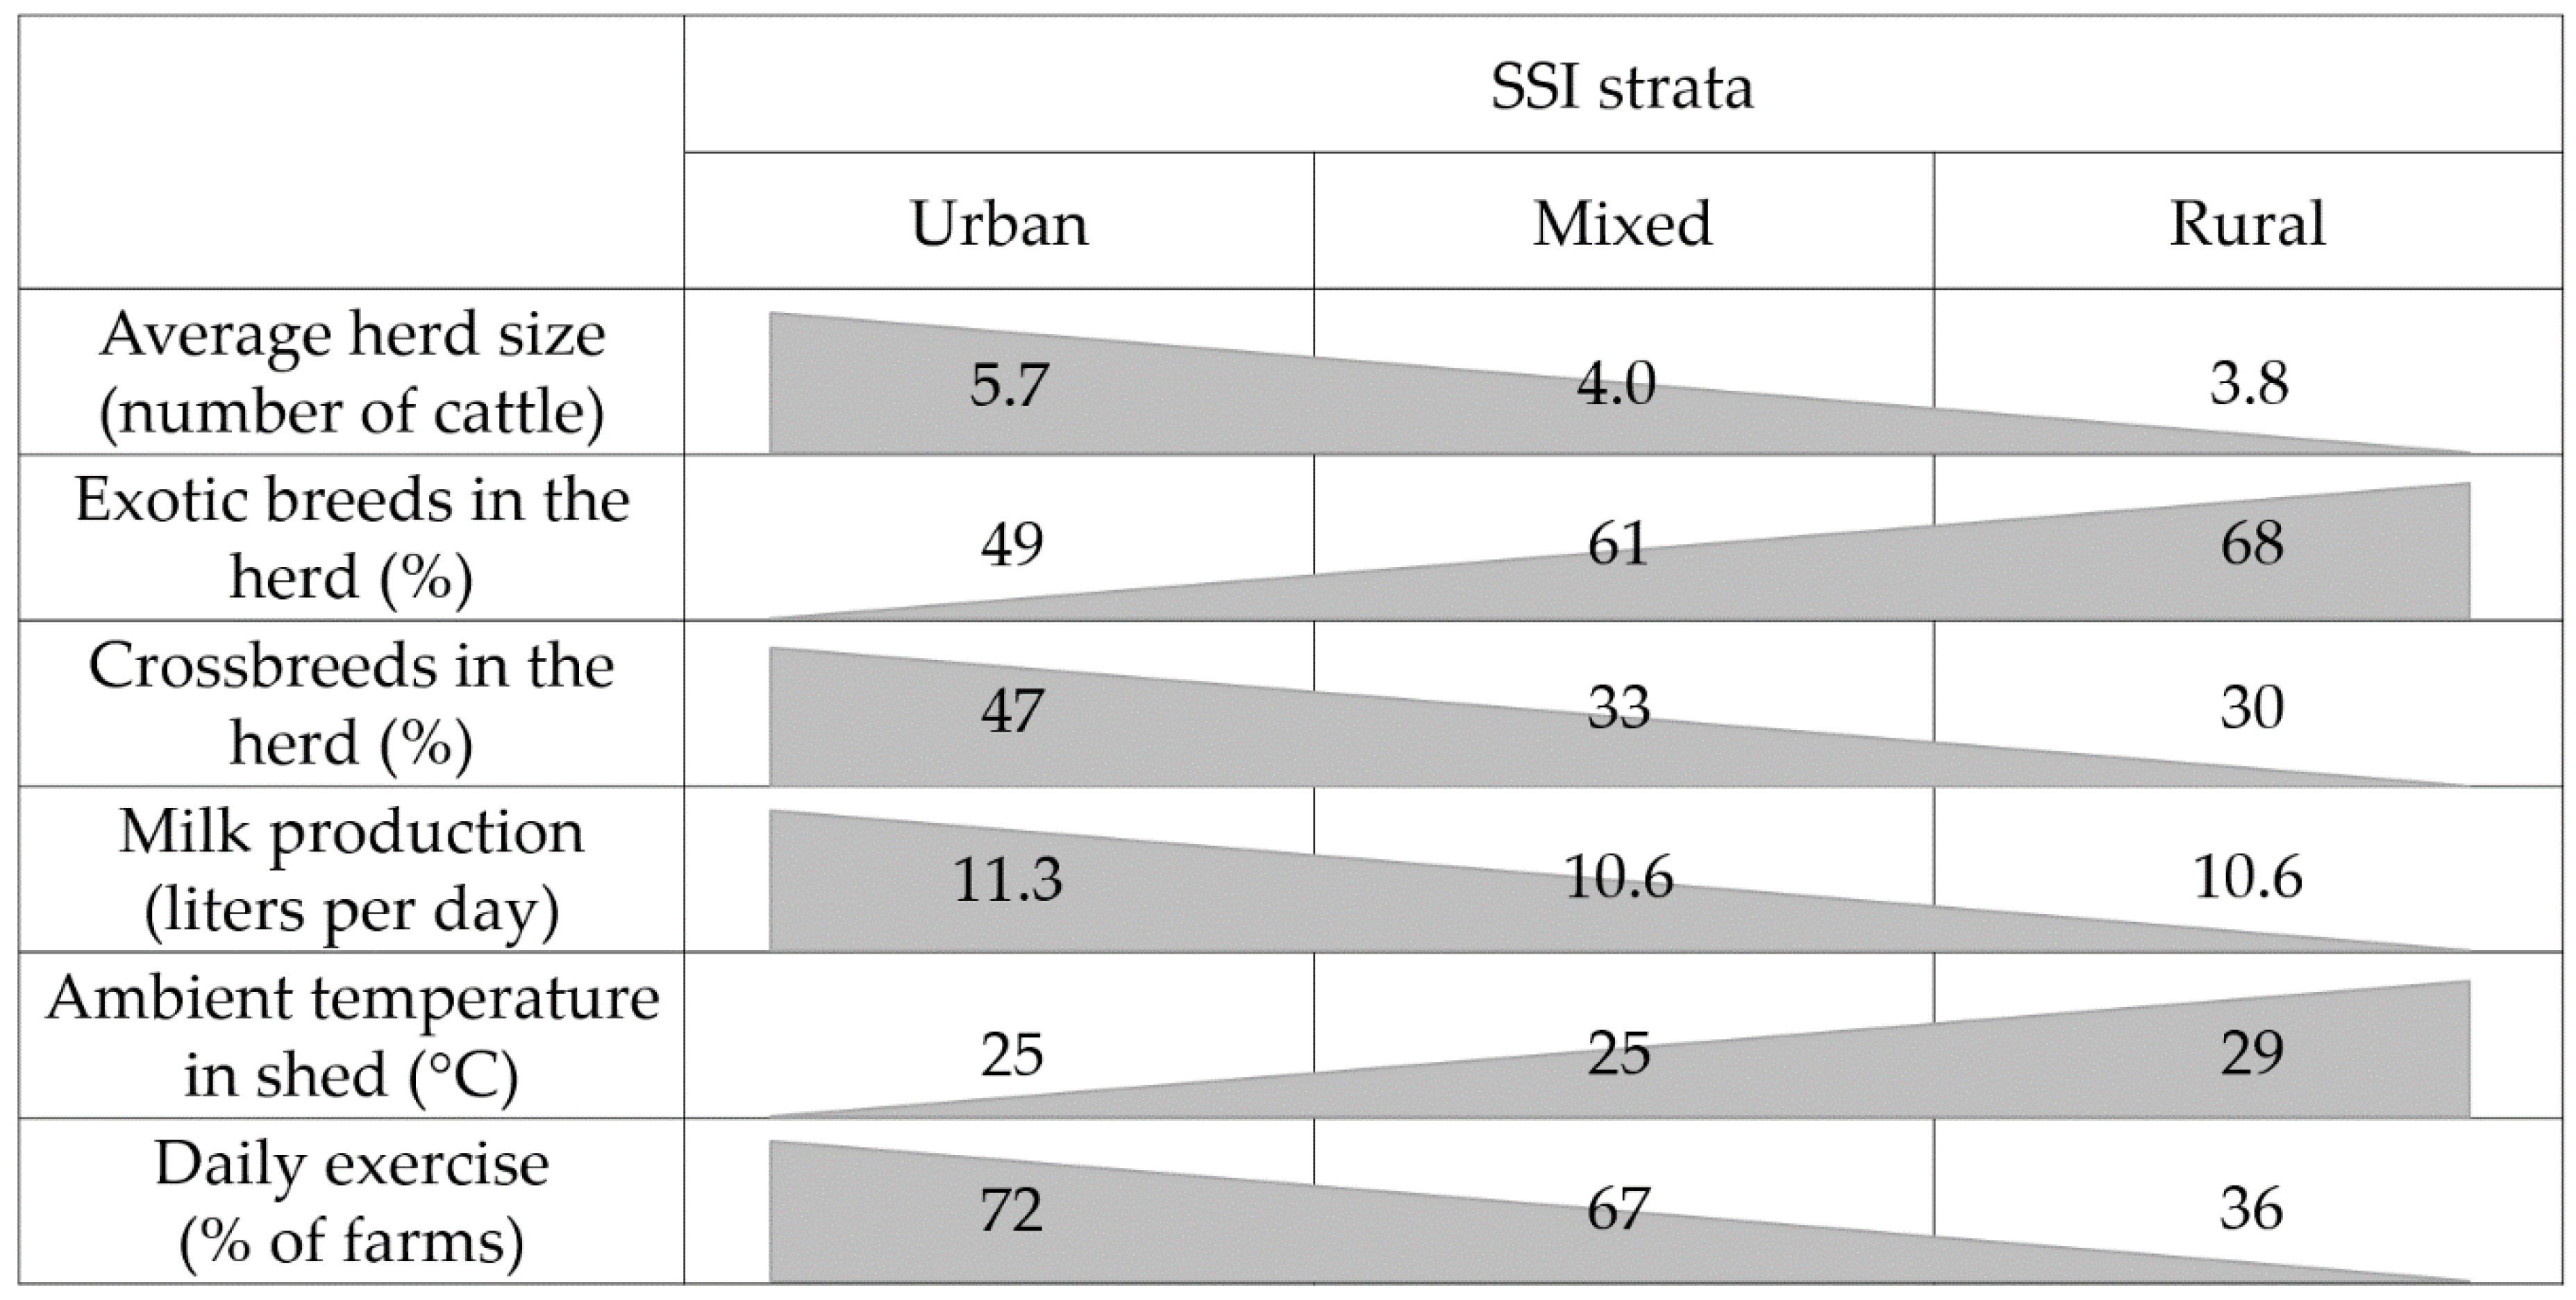
Despite the high MY in urban areas (Figure 2), exotic (49.2%) and crossbreed cows (47.3%) comprise a large percentage of milking cows. Jersey and HF with ancestors from Europe and North America are kept at the Livestock Breeding and Training Centre, Hesaraghatta, Bangalore [38], to produce frozen semen, since artificial insemination (AI) is the most common practice along Bangalore’s rural–urban gradient. Cattle pasturing without supervision in urban areas was common, implying an increasing risk of uncontrolled mattings, which could explain the higher percentage of crossbreeds.
Parallel to MY, cattle kept in urban areas had an optimal BCS, supporting the notion that dairy farming is a rewarding business. Consequently, urban farmers put attention on health, nutrition, genetics, and management of their cows and have access to better inputs, with positive impacts on BCS, MY, UddHS, and ULHS. Moreover, compared to the rural areas, the share of illiterate herd owners in urban areas decreased by 50% between 1993 and 2009 [39]. Kumbhakar et al. [40] pointed out that well-educated farmers tend to enhance the productivity of their dairy cows. Partly opposite curve pattern for MY and BCS (quartic regressions) in response to SSI might reflect physiological associations, i.e., lower BCS for high yielding cows due to the mobilization of body fat depots [41].

4.2. Hygiene and Health in Dependency of SSI

Hygiene is of great importance for dairy farming, especially in urban areas, where the authorities want to restrict undesired by-products from dairy cattle farming, e.g., spread of diseases or environmental impact such as odor pollution and sewage [42]. Correspondingly, cows from dairy farms located in urban areas had superior hygiene scores, indicating that urban farmers were indeed paying more attention to hygiene, animal health, and wellbeing. Close spatial cohabitation of cows and humans was observed in the urban areas of Bangalore, which encourages farmers to improve hygiene and health management. In contrast, cows in the low MYC had poor scores for UddHS and ULHS at SSI 0, but were very clean at SSI 1. Atasever and Erdem [43] reported similar hygiene scores and productivity of Holstein cows in response to social-ecological alterations in Turkey: both UddHS and ULHS were negatively correlated with daily MY.
The decrease of HAS and LS along the urban-to-rural gradient for all MYC might be related to stocking density, because increasing stocking density is associated with hock damages and lameness [44]. In our study, the farms with higher herd size were located in urban areas, where land availability is scarce. Therefore, this could lead to a higher stocking density, which would explain that urban cows had poorer scores for HAS and LS. Moreover, the type of floor strongly influences hock health as well. In Bangalore, the floor of the sheds changed from mostly concrete floors in urban areas to sandy floors in rural areas. Singh et al. [45] affirmed that prolonged standing time on concrete floors increases the predisposition to lameness. Norring et al. [46] stated that the susceptibility to claw diseases and to hock lesions was lower on sand floors, compared to production systems with concrete floor and straw cover. Cows in high and medium MYC had higher incidences of hock lesions, supporting the antagonistic relationship between health and productivity [47,48]. In this regard, trait responses for HAS and LS were similar, confirming the strong and positive correlation between both traits [49]. Mastitis is the most prevalent production disease in dairy herds [50]. Swami et al. [51] reported an incidence of subclinical mastitis of 35.0% in 60 lactating cows from the Maharashtra state, India. Bangar et al. [52] reviewed 25 articles on subclinical mastitis in dairy cows in India and reported a high variation for the incidence of subclinical mastitis between studies and geographical locations, in the range of 20.73 to 78.55%. In our study, the incidence of 55% fits the review of Bangar et al. [52], who estimated a prevalence of 46.35% of subclinical mastitis in 6344 dairy cows from 25 studies in 12 Indian states. Variations in subclinical mastitis prevalence are attributed to differences in herd size, animal management, farmer education, feeding strategy, agroclimatic conditions, and milk marketing [53]. In the present study, the SubMast incidence slightly increased with increasing SSI for cows in the high and medium MYC, also reflecting the curve pattern for the two hygiene scores. Accordingly, Schreiner and Ruegg [31] identified strong associations between hygiene scores and somatic cell counts for Holstein and Jersey populations located in Wisconsin, USA. For cows from the low MYC, the SubMast incidence was higher in urban than in rural areas. Strong detrimental impact of SubMast on cow production traits was reported in some previous studies [54,55].

4.3. Rectal Temperature in Dependency of SSI

Narayan et al. [56] measured an average RT of 38.6 °C for lactating HF x Sahiwal crossbred cows in an ambient temperature range between 23.2 and 34.2 °C in India. Burfeind et al. [57] measured RT from 20 cows before and after defecation in Canada, and values were similar, i.e., 38.6 °C and 38.5 °C, respectively. In the present study, average RT was 38.5 °C, independent from the measurement date and herd location. Theoretically, RT increases with an increase of environmental temperature [58]. Along Bangalore’s rural–urban gradients, ambient temperature in cow location increased with increasing SSI, because of the differences in shed type or the location where the cows rest. In urban areas, cattle are predominantly kept in the basement or ground floor of the house or in front of the house under a proper cement roof. In rural areas, only a simple wooden structure with some hay on top is used as shed, offering little protection against heat stress. In consequence, the increase of ambient shed temperature and RT in rural areas might be due to the scarcity of shadow and heat insulation [59,60]. RT is also influenced by MY [61]. Hence, an intensified metabolism at higher MY could explain the higher RT of cows in the high MYC in urban and mixed areas in comparison to lower RT of cows in medium and low MYC in the same areas.

4.4. Overall Social-Ecological Impacts on Dairy Cattle Farming

Results from the present study showed an impact of SSI on a variety of important cow traits including productivity and functionality, such as MY, BCS, UddHS, ULHS, HAS, and RT. The SSI was constructed based on spatial information on buildings density and distance to the city center [29] and was thereby able to capture characteristics also relevant for dairy farming. While urban dairy production is common in India [17], the breeding strategy of dairy farmers according to their location along rural–urban gradients is overlooked: in India, bulls are allowed to freely roam the city because of the social and cultural status of the cow and it is common for urban dairy farmers to let their cattle pasture in the city too, which increases the opportunities of uncontrolled mating. Thus, sociocultural norms influence the breeding of urban dairy cattle as captured by prevalence of exotic genotypes and crossbreed along the rural–urban gradients of Bangalore (Figure 7). Genotype interacts with further parameters of dairy production: on one hand, in urban areas, crossbreeds benefited from better management and health care, thus having a higher MY. Exotics genotypes, on the other hand, were more common in rural areas and had a lower MY despite better genetic potential, partly because of heat stress (Figure 7). Crossbreeds indeed benefited from more shadows in urban areas, but urban crossbreeding could be an advantageous strategy to tackle some of the harsher environmental conditions of urban areas. However, poorer HAS and LS scores in urban areas still need to be tackled, either through breeding or improvement of husbandry conditions.
The impact of the rural–urban gradients on traits of dairy cows shows the relevance of the underlying parameters of herd management and environmental conditions; their summary in an index such as the SSI allows for the creation of more complete and accurate socioecological models for the analysis of livestock production systems. If those models are established and the daily costs and revenues for a specific social-ecological level of livestock production are known, its economic efficiency can also be addressed in a location-specific manner [62]. Authors should discuss the results and how they can be interpreted in perspective of previous studies and of the working hypotheses. The findings and their implications should be discussed in the broadest context possible. Future research directions may also be highlighted.

5. Conclusions

Differences in phenotypic trait expressions in dairy cows were identified along the rural–urban gradients of Bangalore. The additional consideration of SSI in trait analyses contributed to a deeper understanding of cow trait reactions on social-ecological challenges. Cows from rural farms showed an increased body temperature, which might indicate scarcity of shadow in these areas. In contrast, urban farms were characterized by the presence of dairy cows with higher MY, more optimal BCS, and better hygienic conditions, which reflects better management and an intensified market-oriented dairy production. However, cows on urban farms also showed poorer hock heath, particularly those with higher MY. This suggests that dairy intensification in urban areas leads to higher productivity through better management but at the detriment of animal welfare.

Supplementary Materials

The following are available online at https://www.mdpi.com/2071-1050/12/21/9021/s1. Table S1. Model comparison from first to fourth orders Legendre polynomials (linear, quadratic, cubic and quartic) for milk yield (MY), body condition score (BCS), hygiene score of udders (UddHS) and of upper legs (ULHS), hock assessment score (HAS), locomotion score (LS), subclinical mastitis (SubMast) and rectal temperature (RT, in °C) via Bayesian information criterion (BIC).

Author Contributions

Conceptualization and methodology, S.K.; data collection, A.P. and M.R.; data curation and investigation, A.P.; software, T.Y.; validation, S.K. and T.Y.; resources, R.B.; writing—original draft preparation, A.P.; writing—review and editing, S.K., M.R. and E.S. All authors have read and agreed to the published version of the manuscript.

Funding

This research was funded by the German National Science Foundation, DFG, grant number KO 3520/5-1.

Acknowledgments

The authors gratefully acknowledge the kindness, patience, and help of the dairy farmers involved in the fieldwork as well as the logistic and scientific support offered by our Indian partners at the ICAR-National Institute of Animal Nutrition and Physiology (ICAR-NIANP). The authors acknowledge the financial support provided by the German National Science Foundation, DFG, through grant number KO 3520/5-1, and by the Indian Department of Biotechnology (DBT), through grant number DBT/IN/German/DFG/14/BVCR/2016, as part of the Indo-German consortium of DFG Research Unit FOR2432/1 and DBT (The Rural-Urban Interface of Bangalore: A Space of Transitions in Agriculture, Economics, and Society).

Conflicts of Interest

The authors declare no conflict of interest. The funders had no role in the design of the study; in the collection, analyses, or interpretation of data; in the writing of the manuscript, or in the decision to publish the results.

References

  1. Egger-Danner, C.; Cole, J.B.; Pryce, J.E.; Gengler, N.; Heringstad, B.; Bradley, A.; Stock, K.F. Invited review: Overview of new traits and phenotyping strategies in dairy cattle with a focus on functional traits. Animal 2015, 9, 191–207. [Google Scholar] [CrossRef] [PubMed] [Green Version]
  2. Klinedinst, P.L.; Wilhite, D.A.; Hahn, G.L.; Hubbard, K.G. The potential effects of climate change on summer season dairy cattle milk production and reproduction. Clim. Chang. 1993, 23, 21–36. [Google Scholar] [CrossRef] [Green Version]
  3. Brügemann, K.; Gernand, E.; von Borstel, U.U.; König, S. Genetic analyses of protein yield in dairy cows applying random regression models with time-dependent and temperature x humidity-dependent covariates. J. Dairy Sci. 2011, 94, 4129–4139. [Google Scholar] [CrossRef] [PubMed] [Green Version]
  4. Wolfenson, D.; Roth, Z.; Meidan, R. Impaired reproduction in heat-stressed cattle: Basic and applied aspects. Anim. Reprod. Sci. 2000, 60–61, 535–547. [Google Scholar] [CrossRef]
  5. König, S.; Dietl, G.; Raeder, I.; Swalve, H.H. Genetic relationships for dairy performance between large-scale and small-scale farm conditions. J. Dairy Sci. 2005, 88, 4087–4096. [Google Scholar] [CrossRef]
  6. Kolver, E.S.; Roche, J.R.; de Veth, M.J.; Thorne, P.L.; Napper, A.R. Total mixed rations versus pasture diets: Evidence for a genotype x diet on the concentration of amino acid-derived volatiles in milk. Proc. N. Z. Soc. Anim. Prod. 2002, 62, 246–251. [Google Scholar]
  7. Jäger, M.; Brügemann, K.; König, S. Genetic relationships and trait comparison between and within selected lines of local dual purpose cattle. In Proceedings of the Book of Abstracts EAAP-67th Annual Meeting, Belfast, UK, 29 August–2 September 2016; p. 307. [Google Scholar]
  8. Ivemeyer, S.; Knierim, U.; Waiblinger, S. Effect of human-animal relationship and management on udder health in Swiss dairy herds. J. Dairy Sci. 2011, 94, 5890–5902. [Google Scholar] [CrossRef]
  9. Breuer, K.; Hemsworth, P.H.; Barnett, J.L.; Matthews, L.R.; Coleman, G.J. Behavioural response to humans and the productivity of commercial dairy cows. Appl. Anim. Behav. Sci. 2000, 66, 273–288. [Google Scholar] [CrossRef]
  10. Hemsworth, P.H.; Coleman, G.J.; Barnett, J.L.; Borg, S. Relationships between human-animal interactions and productivity of commercial dairy cows. J. Dairy Sci. 2000, 78, 2821. [Google Scholar] [CrossRef]
  11. Manivannanan, C.; Tripathi, H. Management efficiency of dairy entrepreneurs. Indian Res. J. Ext. Educ. 2007, 7, 9. [Google Scholar]
  12. Lapar, M.L.A.; Choubey, M.; Patwari, P.; Kumar, A.; Baltenweck, I.; Jabbar, M.A.; Staal, S. Consumer preferences for attributes of raw and powdered milk in Assam, Northeast India. In Demand for Livestock Products in Developing Countries with a Focus on Quality and Safety Attributes: Evidence from Asia and Africa; ILRI (ILCA and ILRAD): Adis Ababa, Ethiopia, 2010; pp. 103–115. ISBN 978-92-9146-256-8. [Google Scholar]
  13. Reichenbach, M. Dairy Production in an Urbanizing Environment. A System Approach in Bengaluru, India. Ph.D. Dissertation, Faculty of Organic Agricultural Sciences, University of Kassel, Witzenhausen, Germany, April 2020. [Google Scholar]
  14. Kennedy, U.; Sharma, A.; Phillips, C.J.C. The sheltering of unwanted cattle, experiences in India and implications for cattle industries elsewhere. Animals 2018, 8, 64. [Google Scholar] [CrossRef] [PubMed] [Green Version]
  15. Martin-Collado, D.; Soini, K.; Mäki-Tanila, A.; Toro, M.A.; Díaz, C. Defining farmer typology to analyze the current state and development prospects of livestock breeds: The Avileña-Negra Ibérica beef cattle breed as a case study. Livest. Sci. 2014, 169, 137–145. [Google Scholar] [CrossRef]
  16. Kraas, F. Megacities and global change: Key priorities. Geogr. J. 2007, 173, 79–82. [Google Scholar] [CrossRef]
  17. Prasad, C.S.; Anandan, S.; Gowda, N.K.S.; Schlecht, E.; Buerkert, A. Managing nutrient flows in Indian urban and peri-urban livestock systems. Nutr. Cycl. Agroecosyst. 2019, 115, 159–172. [Google Scholar] [CrossRef]
  18. Roessler, R.; Mpouam, S.E.; Schlecht, E. Genetic and nongenetic factors affecting on-farm performance of peri-urban dairy cattle in west Africa. J. Dairy Sci. 2019, 102, 2353–2364. [Google Scholar] [CrossRef]
  19. OECD-FAO Agricultural Outlook 2018–2027. Dairy and Dairy Products. Available online: http://www.agri-outlook.org/commodities/Agricultural-Outlook-2018-Dairy.pdf (accessed on 17 October 2019).
  20. National Dairy Development Board Dairying in Karnataka. A Statistical Profile. 2015. Available online: https://www.scribd.com/document/362262588/NDDB-Karnataka-10-March-2015-pdf (accessed on 17 October 2019).
  21. Nivsarkar, A.E.; Vij, P.K.; Tantia, M.S. Animal Genetic Resources of India: Cattle and Buffalo; Indian Council of Agricultural Research: New Delhi, India, 2000. [Google Scholar]
  22. Hansen, P.J. Physiological and cellular adaptations of zebu cattle to thermal stress. Anim. Reprod. Sci. 2004, 82–83, 349–360. [Google Scholar] [CrossRef]
  23. Al-Kanaan, A.J.J. Heat Stress Response for Physiological Traits in Dairy and Dual Purpose Cattle Populations on Phenotypic and Genetic Scales. Ph.D. Thesis, Kassel University, Kassel, Germany, 2016. [Google Scholar]
  24. Bouraoui, R.; Lahmar, M.; Majdoub, A.; Djemali, M.; Belyea, R. The relationship of temperature-humidity index with milk production of dairy cows in a Mediterranean climate. Anim. Res. 2002, 51, 479–491. [Google Scholar] [CrossRef] [Green Version]
  25. Friggens, N.C.; Andersen, J.B.; Larsen, T.; Aaes, O.; Dewhurst, R.J. Priming the dairy cow for lactation: A review of dry cow feeding strategies. Anim. Res. 2004, 53, 453–473. [Google Scholar] [CrossRef] [Green Version]
  26. Young, J.R.; Rast, L.; Suon, S.; Bush, R.D.; Henry, L.A.; Windsor, P.A. The impact of best practice health and husbandry interventions on smallholder cattle productivity in southern Cambodia. Anim. Prod. Sci. 2014, 54, 629–637. [Google Scholar] [CrossRef] [Green Version]
  27. Groupe SCE India Revised of Structure Plan—2031 Bangalore Metropolitan Region. Available online: http://opencity.in/documents/bmrda-revised-structure-plan-2031-draft-report (accessed on 17 October 2019).
  28. Indian Meteorological Department Climatological Table for the City of Bangalore. Period 1982–2000. Available online: http://www.imd.gov.in/section/climate/extreme/bangaluru2.htm (accessed on 17 October 2019).
  29. Hoffmann, E.M.; Jose, M.; Nölke, N.; Möckel, T. Construction and use of a simple index of urbanisation in the rural–urban interface of Bangalore, India. Sustainability 2017, 9, 2146. [Google Scholar] [CrossRef] [Green Version]
  30. Ferguson, J.D.; Galligan, D.T.; Thomsen, N. Principal descriptors of body condition score in Holstein cows. J. Dairy Sci. 1994, 77, 2695–2703. [Google Scholar] [CrossRef]
  31. Schreiner, D.A.; Ruegg, P.L. Effects of tail docking on milk quality and cow cleanliness. J. Dairy Sci. 2002, 85, 2503–2511. [Google Scholar] [CrossRef]
  32. Lombard, J.E.; Tucker, C.B.; von Keyserlingk, M.A.G.; Kopral, C.A.; Weary, D.M. Associations between cow hygiene, hock injuries, and free stall usage on US dairy farms. J. Dairy Sci. 2010, 93, 4668–4676. [Google Scholar] [CrossRef]
  33. Winckler, C.; Willen, S. The reliability and repeatability of a lameness scoring system for use as an indicator of welfare in dairy cattle. Acta Agric. Scand. A Anim. Sci. 2001, 51, 103–107. [Google Scholar] [CrossRef]
  34. Kandeel, S.A.; Morin, D.E.; Calloway, C.D.; Constable, P.D. Association of California mastitis test scores with intramammary infection status in lactating dairy cows admitted to a veterinary teaching hospital. J. Vet. Intern. Med. 2018, 32, 497–505. [Google Scholar] [CrossRef] [PubMed] [Green Version]
  35. Bates, D.; Mächler, M.; Bolker, B.; Walker, S. Fitting linear mixed-effects models using lme4. J. Stat. Softw. 2015, 67, 1–48. [Google Scholar] [CrossRef]
  36. Landes, M.; Cessna, J.; Kuberka, L.; Jones, K. India’s Dairy Sector: Structure, Performance, and Prospects; Economic Research Service/USDA: Washington, DC, USA, 2017; pp. 1–47.
  37. Gilles, P.; Tawfik, E.S. Urban and Periurban Dairy Cattle Farming in the Maseru District/Lesotho. Available online: http://ftp2.de.freebsd.org/pub/tropentag/proceedings/2001/full%20papers/11-animals/11_23_Gilles1.pdf (accessed on 22 October 2019).
  38. State Livestock Breeding & Training Centre, Hesaraghatta, Bengaluru. Available online: http://slbtc.kar.nic.in/ (accessed on 15 September 2020).
  39. Agrawal, T. Educational inequality in rural and urban India. Int. J. Educ. Dev. 2014, 34, 11–19. [Google Scholar] [CrossRef]
  40. Kumbhakar, S.C.; Biswas, B.; Bailey, D. A study of economic efficiency of Utah dairy farmers: A system approach. Rev. Econ. Stat. 1989, 71, 595–604. [Google Scholar] [CrossRef]
  41. Mushtaq, A.; Qureshi, M.S.; Khan, S.; Habib, G.; Swati, Z.A.; Rahman, S.U. Body condition score as a marker of milk yield and composition in dairy animals. J. Anim. Plant Sci. 2012, 22, 169–173. [Google Scholar]
  42. Nunan, F. Improved Utilisation of Urban Waste by Near-Urban Farmers in the Hubli-Dharwad City-Region; Final Technical Report of Project R7099; School of Public Policy, University of Birmingham: Birmingham, UK, 1999; pp. 1–81. [Google Scholar]
  43. Atasever, S.; Erdem, H. Relationship between hygienic aspects and milk production characteristics of holstein cows. J. Appl. Anim. Res. 2009, 35, 185–188. [Google Scholar] [CrossRef] [Green Version]
  44. Solano, L.; Barkema, H.W.; Pajor, E.A.; Mason, S.; LeBlanc, S.J.; Zaffino Heyerhoff, J.C.; Nash, C.G.R.; Haley, D.B.; Vasseur, E.; Pellerin, D.; et al. Prevalence of lameness and associated risk factors in Canadian Holstein-Friesian cows housed in freestall barns. J. Dairy Sci. 2015, 98, 6978–6991. [Google Scholar] [CrossRef] [PubMed] [Green Version]
  45. Singh, S.S.; Ward, W.R.; Lautenbach, K.; Murray, R.D. Behaviour of lame and normal dairy cows in cubicles and in a straw yard. Vet. Rec. 1993, 133, 204–208. [Google Scholar] [CrossRef] [PubMed]
  46. Norring, M.; Manninen, E.; de Passillé, A.M.; Rushen, J.; Munksgaard, L.; Saloniemi, H. Effects of sand and straw bedding on the lying behavior, cleanliness, and hoof and hock injuries of dairy cows. J. Dairy Sci. 2008, 91, 570–576. [Google Scholar] [CrossRef] [PubMed] [Green Version]
  47. Juarez, S.T.; Robinson, P.H.; DePeters, E.J.; Price, E.O. Impact of lameness on behavior and productivity of lactating Holstein cows. Appl. Anim. Behav. Sci. 2003, 83, 1–14. [Google Scholar] [CrossRef]
  48. Rutherford, K.M.D.; Langford, F.M.; Jack, M.C.; Sherwood, L.; Lawrence, A.B.; Haskell, M.J. Hock injury prevalence and associated risk factors on organic and nonorganic dairy farms in the United Kingdom. J. Dairy Sci. 2008, 91, 2265–2274. [Google Scholar] [CrossRef]
  49. Sadiq, M.B.; Ramanoon, S.Z.; Shaik Mossadeq, W.M.; Mansor, R.; Syed-Hussain, S.S. Association between lameness and indicators of dairy cow welfare based on locomotion scoring, body and hock condition, leg hygiene and lying behavior. Animals 2017, 7, 79. [Google Scholar] [CrossRef] [Green Version]
  50. Seegers, H.; Fourichon, C.; Beaudeau, F. Production effects related to mastitis and mastitis economics in dairy cattle herds. Vet. Res. 2003, 34, 475–491. [Google Scholar] [CrossRef] [Green Version]
  51. Swami, S.; Patil, R.; Gadekar, S. Studies on prevalence of subclinical mastitis in dairy animals. J. Entomol. Zool. Stud. 2017, 5, 1297–1300. [Google Scholar]
  52. Bangar, Y.C.; Singh, B.; Dohare, A.K.; Verma, M.R. A systematic review and meta-analysis of prevalence of subclinical mastitis in dairy cows in India. Trop. Anim. Health Prod. 2015, 47, 291–297. [Google Scholar] [CrossRef]
  53. Joshi, S.; Gokhale, S. Status of Mastitis as an Emerging Disease in Improved and Periurban Dairy Farms in India. Ann. N.Y. Acad. Sci. 2006, 1081, 74–83. [Google Scholar] [CrossRef]
  54. Bareille, N.; Beaudeau, F.; Billon, S.; Robert, A.; Faverdin, P. Effects of health disorders on feed intake and milk production in dairy cows. Livest. Prod. Sci. 2003, 83, 53–62. [Google Scholar] [CrossRef]
  55. Firat, M.Z. An investigation into the effects of clinical mastitis on milk yield in dairy cows. Livest. Prod. Sci. 1993, 36, 311–321. [Google Scholar] [CrossRef]
  56. Narayan, U.; Singh, D.V.; Sharma, R.J. Physiological responses in Holstein-Friesian crossbred lactating cows under heat stress ameliorating treatments. Indian J. Anim. Res. 2007, 41, 130–133. [Google Scholar]
  57. Burfeind, O.; von Keyserlingk, M.A.G.; Weary, D.M.; Veira, D.M.; Heuwieser, W. Short communication: Repeatability of measures of rectal temperature in dairy cows. J. Dairy Sci. 2010, 93, 624–627. [Google Scholar] [CrossRef] [PubMed]
  58. McDowell, R.E. Physiological approaches to animal climatology. J. Hered. 1958, 49, 52–61. [Google Scholar] [CrossRef]
  59. Sivakumar, T.; Suraj, P.T.; Yasotha, A.; Phukon, J. Identification of suitable housing system for dairy cattle in North East Zone of Tamil Nadu, India, with respect to microclimate. Vet. World. 2017, 10, 1–5. [Google Scholar] [CrossRef] [PubMed] [Green Version]
  60. Tucker, C.B.; Rogers, A.R.; Schütz, K.E. Effect of solar radiation on dairy cattle behaviour, use of shade and body temperature in a pasture-based system. Appl. Anim. Behav. Sci. 2008, 109, 141–154. [Google Scholar] [CrossRef]
  61. Berman, A.; Folman, Y.; Kaim, M.; Mamen, M.; Herz, Z.; Wolfenson, D.; Arieli, A.; Graber, Y. Upper critical temperatures and forced ventilation effects for high-yielding dairy cows in a subtropical climate. J. Dairy Sci. 1985, 68, 1488–1495. [Google Scholar] [CrossRef]
  62. König, S.; Fatehi, J.; Simianer, H.; Schaeffer, L.R. Assessment of Dairy Cow Profitability. In Proceedings of the Book of Abstracts-58th Annual Meeting, Dublin, Ireland, 26–29 August 2007; p. 58. [Google Scholar]
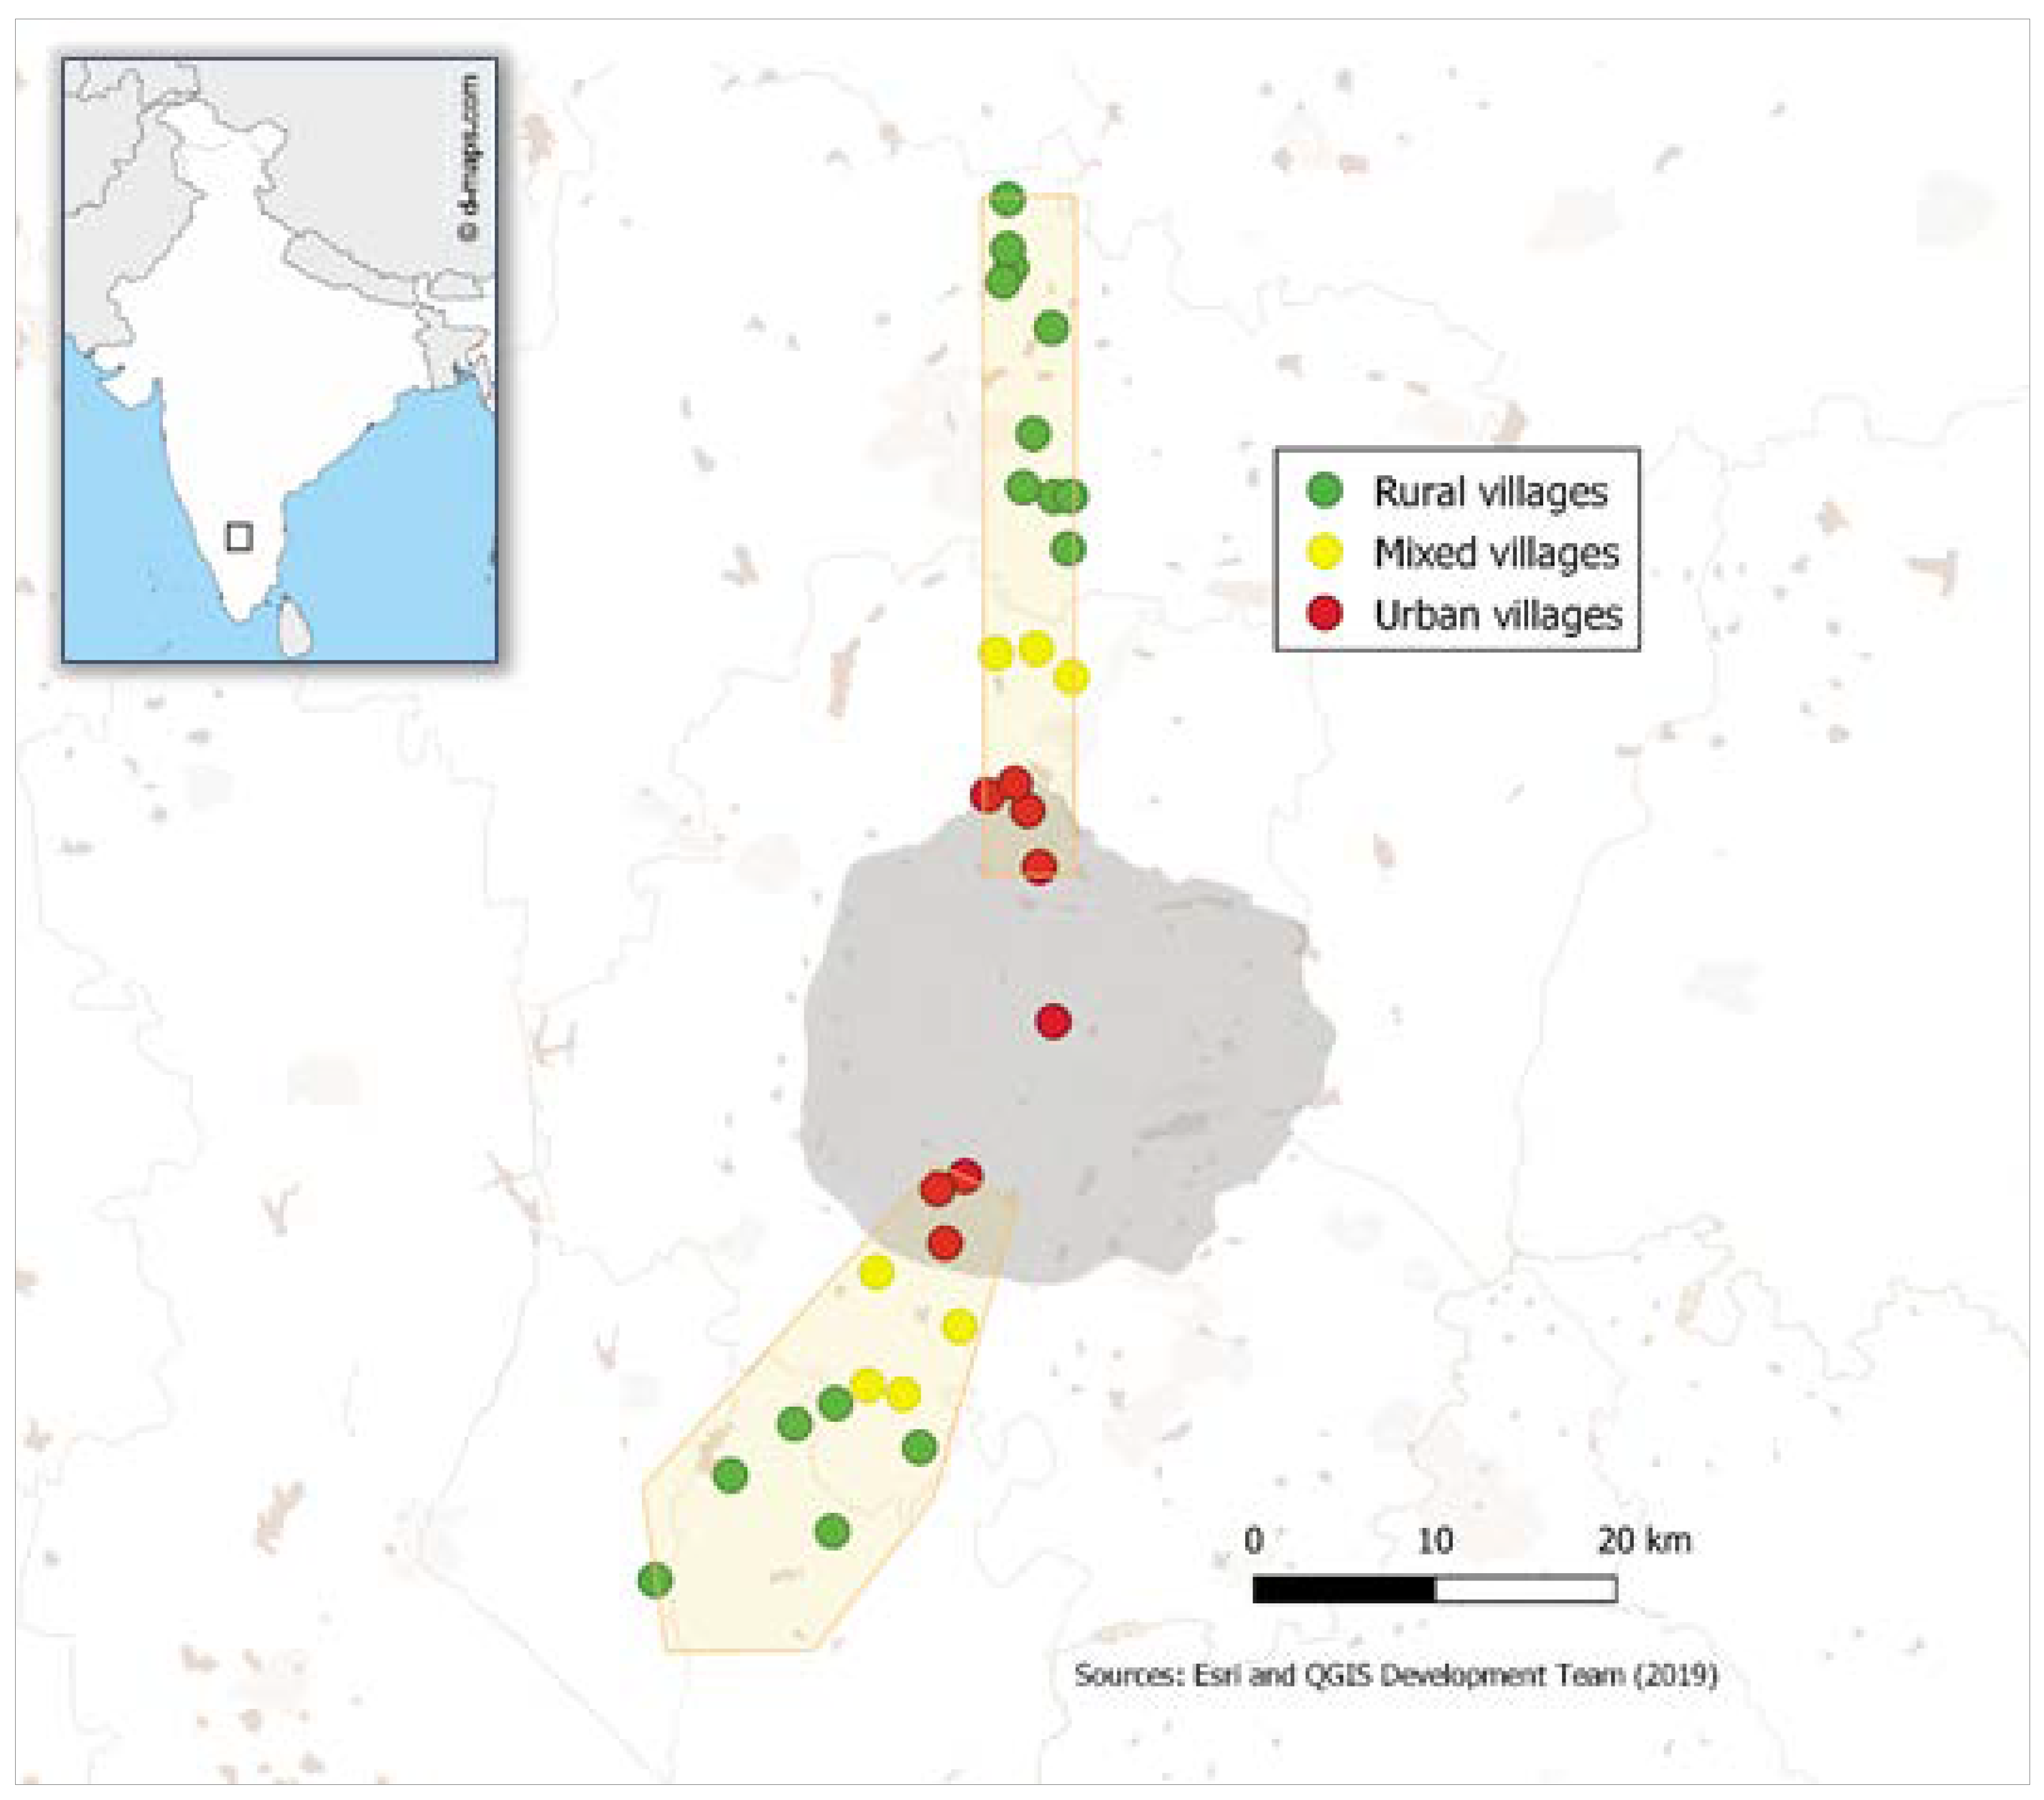
Figure 1. Map of Bangalore depicting the 31 sampled villages. The dark grey area represents the urban city zone. The orange contours indicate the northern and southern transects.
Sustainability 12 09021 g001
Figure 2. Least square means for milk yield (MY) and body condition score (BCS) in dependency of the survey stratification index (SSI).
Sustainability 12 09021 g002
Figure 3. Least square means for upper leg hygiene score (ULHS) and udder hygiene score (UddHS) in dependency of the survey stratification index (SSI) and milk yield classes (MYC).
Sustainability 12 09021 g003
Figure 4. Least square means for hock assessment score (HAS) and locomotion score (LS) in dependency of the survey stratification system (SSI) and milk yield classes (MYC)
Sustainability 12 09021 g004
Figure 5. Least square means for subclinical mastitis in dependency of the survey stratification system (SSI) and milk yield classes (MYC).
Sustainability 12 09021 g005
Figure 6. Least square means for rectal temperature and environmental temperature (ET) in dependency of the survey stratification system (SSI) and milk yield classes (MYC).
Sustainability 12 09021 g006
Figure 7. Social-ecological aspects related to dairy farming along the survey stratification index (SSI).
Sustainability 12 09021 g007
Table 1. Descriptive statistics of daily milk yield, body condition score, udder hygiene score, upper legs hygiene score, hock assessment score, locomotion score, subclinical mastitis, and rectal temperature.
TraitVariable Type# Farm# Cow# ObservationMeanSDMin.Max.
Milk yield (liter/day)Numerical12146994510.675.46135
Body condition scoreScale (1 to 5)12151711382.750.372.004.00
Udder hygiene scoreScale (1 to 4)1204789362.031.041.004.00
Upper legs hygiene scoreScale (1 to 4)1214849422.611.111.004.00
Hock assessment scoreScale (1 to 3)1214849421.550.561.003.00
Locomotion scoreScale (1 to 5)1174558631.740.901.005.00
Subclinical mastitisBinary1194658700.550.5001
Rectal temperature (°C)Numerical12146387438.510.6536.241.3
(# = number of; SD = standard deviation; Min = minimum value; Max = maximum value).
Table 2. Least square means (LSMeans) and standard errors (SE) for milk yield (MY, in liters per cow and day), body condition score (BCS), hygiene score of udders (UddHS) and of upper legs (ULHS), hock assessment score (HAS), locomotion score (LS), subclinical mastitis (SubMast), and rectal temperature (RT, in °C) for different genotypes.
Breed Traits
MYBCSUddHSULHSHASLSSubMastRT
All BlackLSMeans9.60 ab2.69 ab1.68 ab2.39 ab1.75 a1.67 ab0.5638.39
SE0.550.040.120.120.060.120.060.07
All Black crossbreedLSMeans10.19 ab2.67 ab1.99 ab2.46 ab1.46 bc1.49 a0.6438.49
SE0.630.050.130.130.070.140.070.08
Holstein Friesian (HF)LSMeans11.14 a2.8 a1.99 a2.58 a1.58 ac2.01 a0.6138.45
SE0.380.020.080.090.040.070.030.05
HF crossbreedLSMeans9.51 ab2.78 a1.86 ab2.46 a1.76 a1.92 a0.6138.47
SE0.560.040.120.120.070.120.060.07
JerseyLSMeans8.42 b2.59 b2.02 a2.55 a1.22 bd1.76 ab0.7038.39
SE0.570.040.120.120.070.130.060.07
Jersey crossbreedLSMeans8.48 bc2.67 ab1.87 ab2.41 ab1.45 abd1.56 ab0.6238.38
SE0.740.060.150.150.090.170.090.09
NativeLSMeans5.16 c3.11 c1.35 b1.85 b1.28 be1.22 b0.5738.36
SE0.910.070.190.190.110.200.110.13
Native crossbreedLSMeans8.04b c2.83 ac1.85 ab2.36 ab1.71 ace1.44 ab0.5938.45
SE0.880.070.180.180.100.190.100.11
Different superscripts within the same column indicate significant genotype differences (p-value < 0.05).
Publisher’s Note: MDPI stays neutral with regard to jurisdictional claims in published maps and institutional affiliations.