Article

Prediction for Overheating Risk Based on Deep Learning in a Zero Energy Building

1
Department of Civil and Environmental System Engineering, Graduate school of Sungkyunkwan University, 2066 Seobu-ro, Suwon 16419, Korea
2
School of Civil, Architectural Engineering, and Landscape Architecture, Sungkyunkwan University, 2066 Seobu-ro, Suwon 16419, Korea
3
Center for Building Environment, Sungkyunkwan University, 2066 Seobu-ro, Jangan-gu, Suwon 16419, Korea
*
Authors to whom correspondence should be addressed.
Sustainability 2020, 12(21), 8974; https://doi.org/10.3390/su12218974
Submission received: 29 September 2020 / Revised: 26 October 2020 / Accepted: 27 October 2020 / Published: 29 October 2020
(This article belongs to the Special Issue Smart City and Zero Energy House/Building)

Abstract

:
The Passive House standard has become the standard for many countries in the construction of the Zero Energy Building (ZEB). Korea also adopted the standard and has achieved great success in building energy savings. However, some issues remain with ZEBs in Korea. Among them, this study aims to discuss overheating issues. Field measurements were carried out to analyze the overheating risk for a library built as a ZEB. A data-driven overheating risk prediction model was developed to analyze the overheating risk, requiring only a small amount of data and extending the analysis throughout the year. The main factors causing overheating during both the cooling season and the intermediate seasons are also analyzed in detail. The overheating frequency exceeded 60% of days in July and August, the midsummer season in Korea. Overheating also occurred during the intermediate seasons when air conditioners were off, such as in May and October in Korea. Overheating during the cooling season was caused mainly by unexpected increases in occupancy rate, while overheating in the mid-term was mainly due to an increase in solar irradiation. This is because domestic ZEB standards define the reinforcement of insulation and airtight performance, but there are no standards for solar insolation through windows or for internal heat generation. The results of this study suggest that a fixed performance standard for ZEBs that does not reflect the climate or cultural characteristics of the region in which a ZEB is built may not result in energy savings at the operational stage and may not guarantee the thermal comfort of occupants.

1. Introduction

The building construction sector is responsible for more than one-third of global final energy consumption and nearly 40% of total direct and indirect CO2 emissions [1,2]. The Zero-Energy Building (ZEB) has been proposed in several countries as a realistic solution to reduce energy demand and mitigate CO2 emissions in the building sector [3,4]. A ZEB is a building with zero net energy consumption, i.e., its total annual energy consumption equals the amount of renewable energy created [5,6]. ZEBs involve two design implementation strategies—minimizing the need for energy use in buildings (especially for heating and cooling) through energy efficient measures and adopting renewable energy and other technologies to meet the remaining energy needs [7]. Energy efficient strategies for ZEBs can be categorized as passive or active. Passive strategies, as the first step to realizing a ZEB, introduce energy-saving design alternatives related to the building envelope, geometrical parameters and orientation, other passive solutions, and hybrid solutions [5]. Passive strategies contribute to energy savings in buildings by means of improving the thermal performance [8]. Active strategies involve refining heating, ventilation and air-conditioning systems, lighting, and any other building services applications [9]. In addition, the realization of “net zero energy consumption” mainly relies on the use of renewable power technologies, such as photovoltaic [10] and geothermal heat pump systems [11].
As a specific guide for the implementation of the passive design strategy for ultra-low-energy houses [12], the German Passive House (PH) standard has been applied worldwide and is considered as the most internationally influential standard, with at least 25,000 certified projects [13]. ZEBs under German PH exhibit remarkable energy saving performances and the energy consumption has even decreased 75% in some countries [14].
In Korea, the planning and construction of ZEBs has been incorporated into mandatory policies for the design of public buildings and will be extended to residential buildings in the near future [15]. In order to improve the insulation performance of the building envelope, the German PH Standard also has been adapted in the ZEB project in Korea, with high-performance external thermal insulation systems. The wall heat transfer rate of Korean PH standard requires high insulation performance of 0.15 W/m2K. The Korean PH standard requires a primary energy requirement of 120 kWh/m2yr or less. It is the same level as the 1++ level in the building energy efficiency rating, which is one of the requirements in Korea’s ZEB certification. Compared with conventional buildings, ZEBs built to PH standards in Korea embody an enormous energy saving potential [16]; some demonstration buildings can reduce energy demand by 56% to 85% [17]. However, severe discomfort issues are found in these buildings; the internal heat gain cannot be dissipated properly, resulting in overheating issues that need to be solved [18].
Other issues have been reported with ZEBs in other countries, such as unexpected building expenses [19] and uncomfortable indoor environments [20]. Among all the mentioned issues, overheating is vitally important because it can greatly influence the indoor thermal comfort and affect the productivity of the occupants. Overheating in ZEBs resulted from many factors, including geographic location, climate, and humidity. Sameni et al. reported a serious overheating problem of ZEBs in England that were built according to the PH standard [21]; the analyzed buildings experienced overheating problems over half of the time in 2013. Rojas et al. [22] also found that in Austria, a social housing development built under the PH standard exhibited quite a different thermal comfort level from a building in Germany, despite similar climates in both countries. Severe overheating was caused by uncontrolled solar radiation and poor management of the indoor heat supply in the Mediterranean climate [23]. Wang et al. reported overheating problems in ZEBs located in northern China [24]. Fletcher et al. [25] suggested that PH building in northern UK were at risk of overheating during the summer month because of high levels of thermal insulation and airtightness. Lomas et al. [19] reviewed that thermally efficient housing with the concept of PH building is increasing, and policies and regulations are being established in many countries, but there is a problem of temporal overheating. Beizaee et al. [26] investigated 207 dwellings in UK, and found that the bedrooms of houses built after 1990 had a greater chance of exceeding the standards of 5%/24 °C and 1%/26 °C. Mulville et al. [27] indicated that a building built in 2006 overheated 5.9% of the time, while the percentage increased to 31.3% for a PH building in the analyzed region [24]. Accordingly, the adaptability of the PH standard should also consider factors such as climate characteristics, building structure, and occupancy behaviors [27,28] to avoid overheating. Due to the high thermal insulation performance, the internal heat gain cannot be dissipated properly, resulting in frequent overheating [29]. The causes of overheating are occupancy level [30,31,32] and external factors such as solar radiation [33], outdoor temperature [34,35], and outdoor relative humidity [36,37]. In particular, solar radiation passing through special glass material [32] or double or triple glazed windows used in ZEBs [38] greatly increases the overheating risk in summer. In addition, the actual occupancy rate may be higher than the predefined ZEB guidelines [31], which may cause high internal heat gain.
Therefore, overheating issues should be analyzed and countermeasures are prepared in the building design stage in order to improve the indoor thermal comfort and avoid unnecessary energy consumption. In the occupied condition, the overheating risk can also be decreased by predicting and optimal air-conditioning control strategies [39].
Some papers dealing with overheating issues adopt the criteria of the Passivhaus Planning Package (PHPP) and Chartered Institution of Building Services Engineers (CIBSE) [25,40,41]. The representation of overheating as a percentage of the year in PHPP is shown to distort the effect of overheating, while the volume-weighted mean indoor temperature value overlooks variations in zonal temperature [42].
Although some studies on overheating issues in ZEBs have analyzed the overheating risk using a simulation approach during the building design stage [43,44], the application scope of the model is narrow, and the accuracy of the models’ predictions remain to be verified. The most precise method is to conduct field measurements [26,34], but this method requires a huge amount of time and cost.
The aim of this study is to identify overheating that can be a problem in ZEB buildings through measured and predicted data. The method to predict overheating using the measured data provided in this study is as follows. Several short-term variables that affect the indoor temperature of a building are ranked through correlation analysis of the values of measured data. The ranked variables are subjected to clustering analysis to detect fault data and maximize similarity between data samples. Clustered data is predicted through a prediction model. The determination of prediction model compares accuracy by analyzing several prediction models. Based on the highly accurate prediction model, long-term overheating frequency prediction and influencing factors are evaluated.
This paper is structured as follows. In Section 2, the field measurement methods of the reference building are described. Additionally, the pre-processing of the measured data is described. Furthermore, principles of clustering analysis, three data mining algorithms, as well as the idea of developing simple model are presented. In Section 3, the overheating frequency is analyzed for the cooling season and intermediate season. Factors influencing overheating are also discussed. Conclusions are presented in Section 4.

2. Methods

The methodology is divided into two main categories. The first shows the measurement data and overheating issues through the experiment of the target building. The second is an overheating prediction method using clustered measurement data by evaluating the correlation.
First, data is collected through the actual measurement of the target building and building energy management system (BEMS) data. The data from the experiment are indoor temperature, indoor humidity, and indoor carbon dioxide. Among them, indoor temperature and indoor humidity are used to analyze overheating, and carbon dioxide is used in the overheating prediction model to evaluate the prediction accuracy with the indoor temperature and evaluate the association with overheating. BEMS data includes weather data (temperature, humidity, solar radiation, and wind speed) and the return water temperature, water flow rate, and pump power measured at the building operation stage. The overheating was assumed to be an indoor condition that exceeds the operating temperature of 25 °C and is out of the comfort range, considering both temperature and humidity.
The second step is the overheating prediction model. In this study, the data clustering method is used to increase the overheating prediction model’s accuracy. The evaluation of the influence between the predicted variable, which is the indoor temperature, and the measured data is performed with the distance-weighted Pearson correlation coefficient. Clustering is performed using the self-organizing mapping (SOM) method by using variables of large influences that affect the predicted value, such as outside temperature, solar radiation, indoor humidity, and outdoor humidity. The most accurate prediction of indoor temperature and carbon dioxide is selected by comparing machine learning models using clustered data. In this study, the long short-term memory with SOM (SOM-LSTM) method was found to be the most accurate. The following sections describe the methodology of this study in more detail.

2.1. Field Measurements

2.1.1. Analyzed Building

In this study, a Korean ZEB, Asan Library, which received a Level 5 ZEB certification as a public building, is analyzed. ZEB certification requires three criteria. The first is the building energy efficiency rating of 1++ or higher, which is the case when the primary energy consumption is less than 90 kWh/m2yr for residential buildings and less than 140 kWh/m2yr for commercial buildings. The second is the energy self-sufficiency rate, that is, the ratio of renewable energy production among the total energy consumed by buildings. Finally, BEMS or remote meter reading must be installed, which is a system that measures and manages energy consumption in real time. Level 5 ZEB certification must satisfy energy self-sufficiency rate of 20% or more and less than 40%. The levels of ZEB certification are shown in Table 1.
The analyzed building has four floors above ground and one basement floor. Specifications of the analyzed building are shown in Table 2. The exterior walls have a high insulation performance with triple-glazed windows. The heat transfer coefficient (U-value) of the building envelope was planned to be lower than the Korean Building Design Criteria for Energy Savings (BDCES), a mandatory regulation for new construction buildings in Korea [45]. The analyzed building was equipped with a Building Energy Management System (BEMS) to monitor and control the building heating, ventilation, and air conditioning (HVAC) system and energy consumption efficiently. The analyzed space was the reading room located on the second floor in the target building. This space is exposed to the outside on the south wall. The east and north walls face the corridor. The west wall is shared with other adjacent study rooms. Except for the south-facing wall, all of the interior walls are in contact with the air-conditioned space. The analyzed space has a high occupancy density, has 50 desks, and is generally used for study purposes. During the measurement period, measurements were made under normal conditions without any other change in use. The windows were all closed and the sun-shade device was not working. The indoor set temperature was operated on a schedule of 9:00–22:00 at 25 degrees, and the energy recovery ventilator (ERV) was also operated on the same schedule. The measurement locations of room temperature, humidity, and CO2 are shown as a total of six positions in Figure 1.

2.1.2. Measurement Descriptions

In order to analyze the overheating issues in a ZEB in Korea, the indoor and outdoor thermal environment were monitored during a two-week period in the summer. Significantly, three kinds of data were collected: local meteorological data, indoor thermal environmental data, and operational data. The local meteorological data consisted of outdoor temperature, relative humidity, solar irradiation, and wind speed. The indoor thermal environmental data consisted of indoor temperature, relative humidity, and CO2 density. Operating data from the air-conditioning system included flow rate, return water temperature, and pump power of the fan coil unit (FCU).
Meteorological data were obtained from a weather station, the operating data of the air-conditioning system data were collected by the BEMS, and the indoor thermal environmental data were monitored using various sensors and measuring instruments. The details of the measurement system are shown in Table 3.
To ensure the accuracy and availability of the experimental data, the indoor measuring point for indoor temperature and relative humidity were set according to ISO 7726 [46], a standard for the measurement of indoor thermal environments. A total of 243 sets of sample data were obtained after smoothing the system operation data and data aggregation in consideration of the difference in the sampling interval between the meteorological data and indoor thermal environmental data.
The measurements were conducted during the cooling season in Korea. Therefore, the air-conditioning system was operated from 9:00 to 22:00. The data sampling period and sampling interval were whole-day sampling (0:00–24:00) and 1 h, respectively, in order to analyze the passive heat dissipation performance and ventilation as well as infiltration of the building at night.
The distribution of the raw data after normalization is shown in Figure 2. This normalization method turns all variables into z-values with a mean value of 0 and standard deviation of 1. The values shown in Figure 2 are the 1st and 3rd quartiles of the measured parameters.
Data preparation is important in model-based methods due to the unreliability of measurements [47]. To improve the reliability of the clustering and prediction, low-quality data should be removed. In this study, outliers are the main concern in data preparation; therefore, the quartile method is used to clean the outlier data in the raw dataset, which means a point is removed if it is greater than the 3rd Quartile, or less than the 1st Quartile, by more than 1.5 times the distance between the 1st Quartile and the 3rd Quartile. In addition, the range of the raw data determines the available range of the prediction model. The outliers shown in the raw data had values that occurred due to communication errors among BEMS data, and especially in the case of solar radiation, the outliers were seen in the excessive solar radiation measurement.

2.1.3. Overheating Issues in the Analyzed ZEB

Existing overheating criteria are categorized in the CIBSE Guide A [48], ASHRAE 55 [49], and EN15251 [50]. Operative temperature, a thermal comfort indicator, is used in existing overheating criteria to evaluate the overheating risk and calculate the number of overheating hours exceeding the comfort range. In this study, the ASHRAE 55 method is used to evaluate the overheating risk of the analyzed ZEB because these criteria can reflect the relationship among various factors more comprehensively [51]. The ASHRAE 55 standard presents the comfort range of Graphic comfort zone method for typical indoor environments. This range is a method that determines the range of operating temperature and humidity that 80% of the occupants are satisfied within a specific environment, the metabolic equivalent of task (MET) is between 1.0 and 1.3 met and the amount of clothing is between 0.5 and 1.0 clo. In this study, overheating was set as an area outside the comfort range. Since the cooling period was considered, temperature conditions lower than the comfort range were excluded from overheating.
Based on the comfort zone from ASHRAE standard 55, the overheating frequency during the experimental duration was calculated, as shown in Figure 3. The analysis indicated that the ZEB was overheated for 33% of the analyzed period (10 July 2019–24 July 2019).
The results shown in Figure 3 are limited to a two-week period; however, it is necessary to review overheating issues throughout the year. The data-driven prediction model method enables yearly analysis with a limited amount of measurement data. Therefore, a simple data-driven model was developed in this study to extend the overheating risk analysis throughout the summer and intermediate seasons, producing a greater volume of data while avoiding difficult, expensive, and time-consuming large-scale field studies.

2.2. Prediction Model to Analyze the Overheating Risk throughout the Year

2.2.1. Simple Model Challenges and Suggested Approach

(1) Concept used in the simple model
With the penetration and integration of artificial intelligence (AI), the use of AI, machine learning, and data-driven methods for building environment analysis and optimization have become increasingly important [52,53]. Deep learning algorithms are based on representational learning of data in machine learning, which aims at finding better representations and creating better models to learn these representations from large amounts of unmarked data. In simple terms, a deep learning neural network is a neural system mimicking the human brain and constructing a non-linear relationship between input and output.
The fundamental purpose of this paper is to propose a generalized simple model based on a deep learning algorithm that can accurately predict the overheating risk of a ZEB with a small number of input variables. This study further investigates the potential of the combination of unsupervised algorithms and supervised deep learning in predicting indoor thermal comfort.
Initially, the output variables are defined as indoor temperature and CO2 density. Indoor temperature is the critical index used to evaluate the overheating risk of the building. In addition, indoor CO2 density, which represents occupancy, has a high impact on indoor temperature and overheating risk and is selected as the output. But it is difficult to measure CO2 density directly, and it generally varies with human activity, so it is essential to predict CO2 density with the proposed model. The intensity of CO2 shows the density of occupants, which means the amount of internal heat generated in the room. The amount of internal heat generation directly affects the indoor temperature and is one of the factors that cause overheating in ZEB. Furthermore, the forecast duration covers the period from 1 May to 31 October due to the climate characteristics of Korea. Usually, building design standards and indoor thermal environmental standards only specify the hygrothermal parameters of buildings in summer and winter but neglect the intermediate season (spring and autumn). However, there is a great temperature difference between day and night in the intermediate season, for example in May and October in Korea.
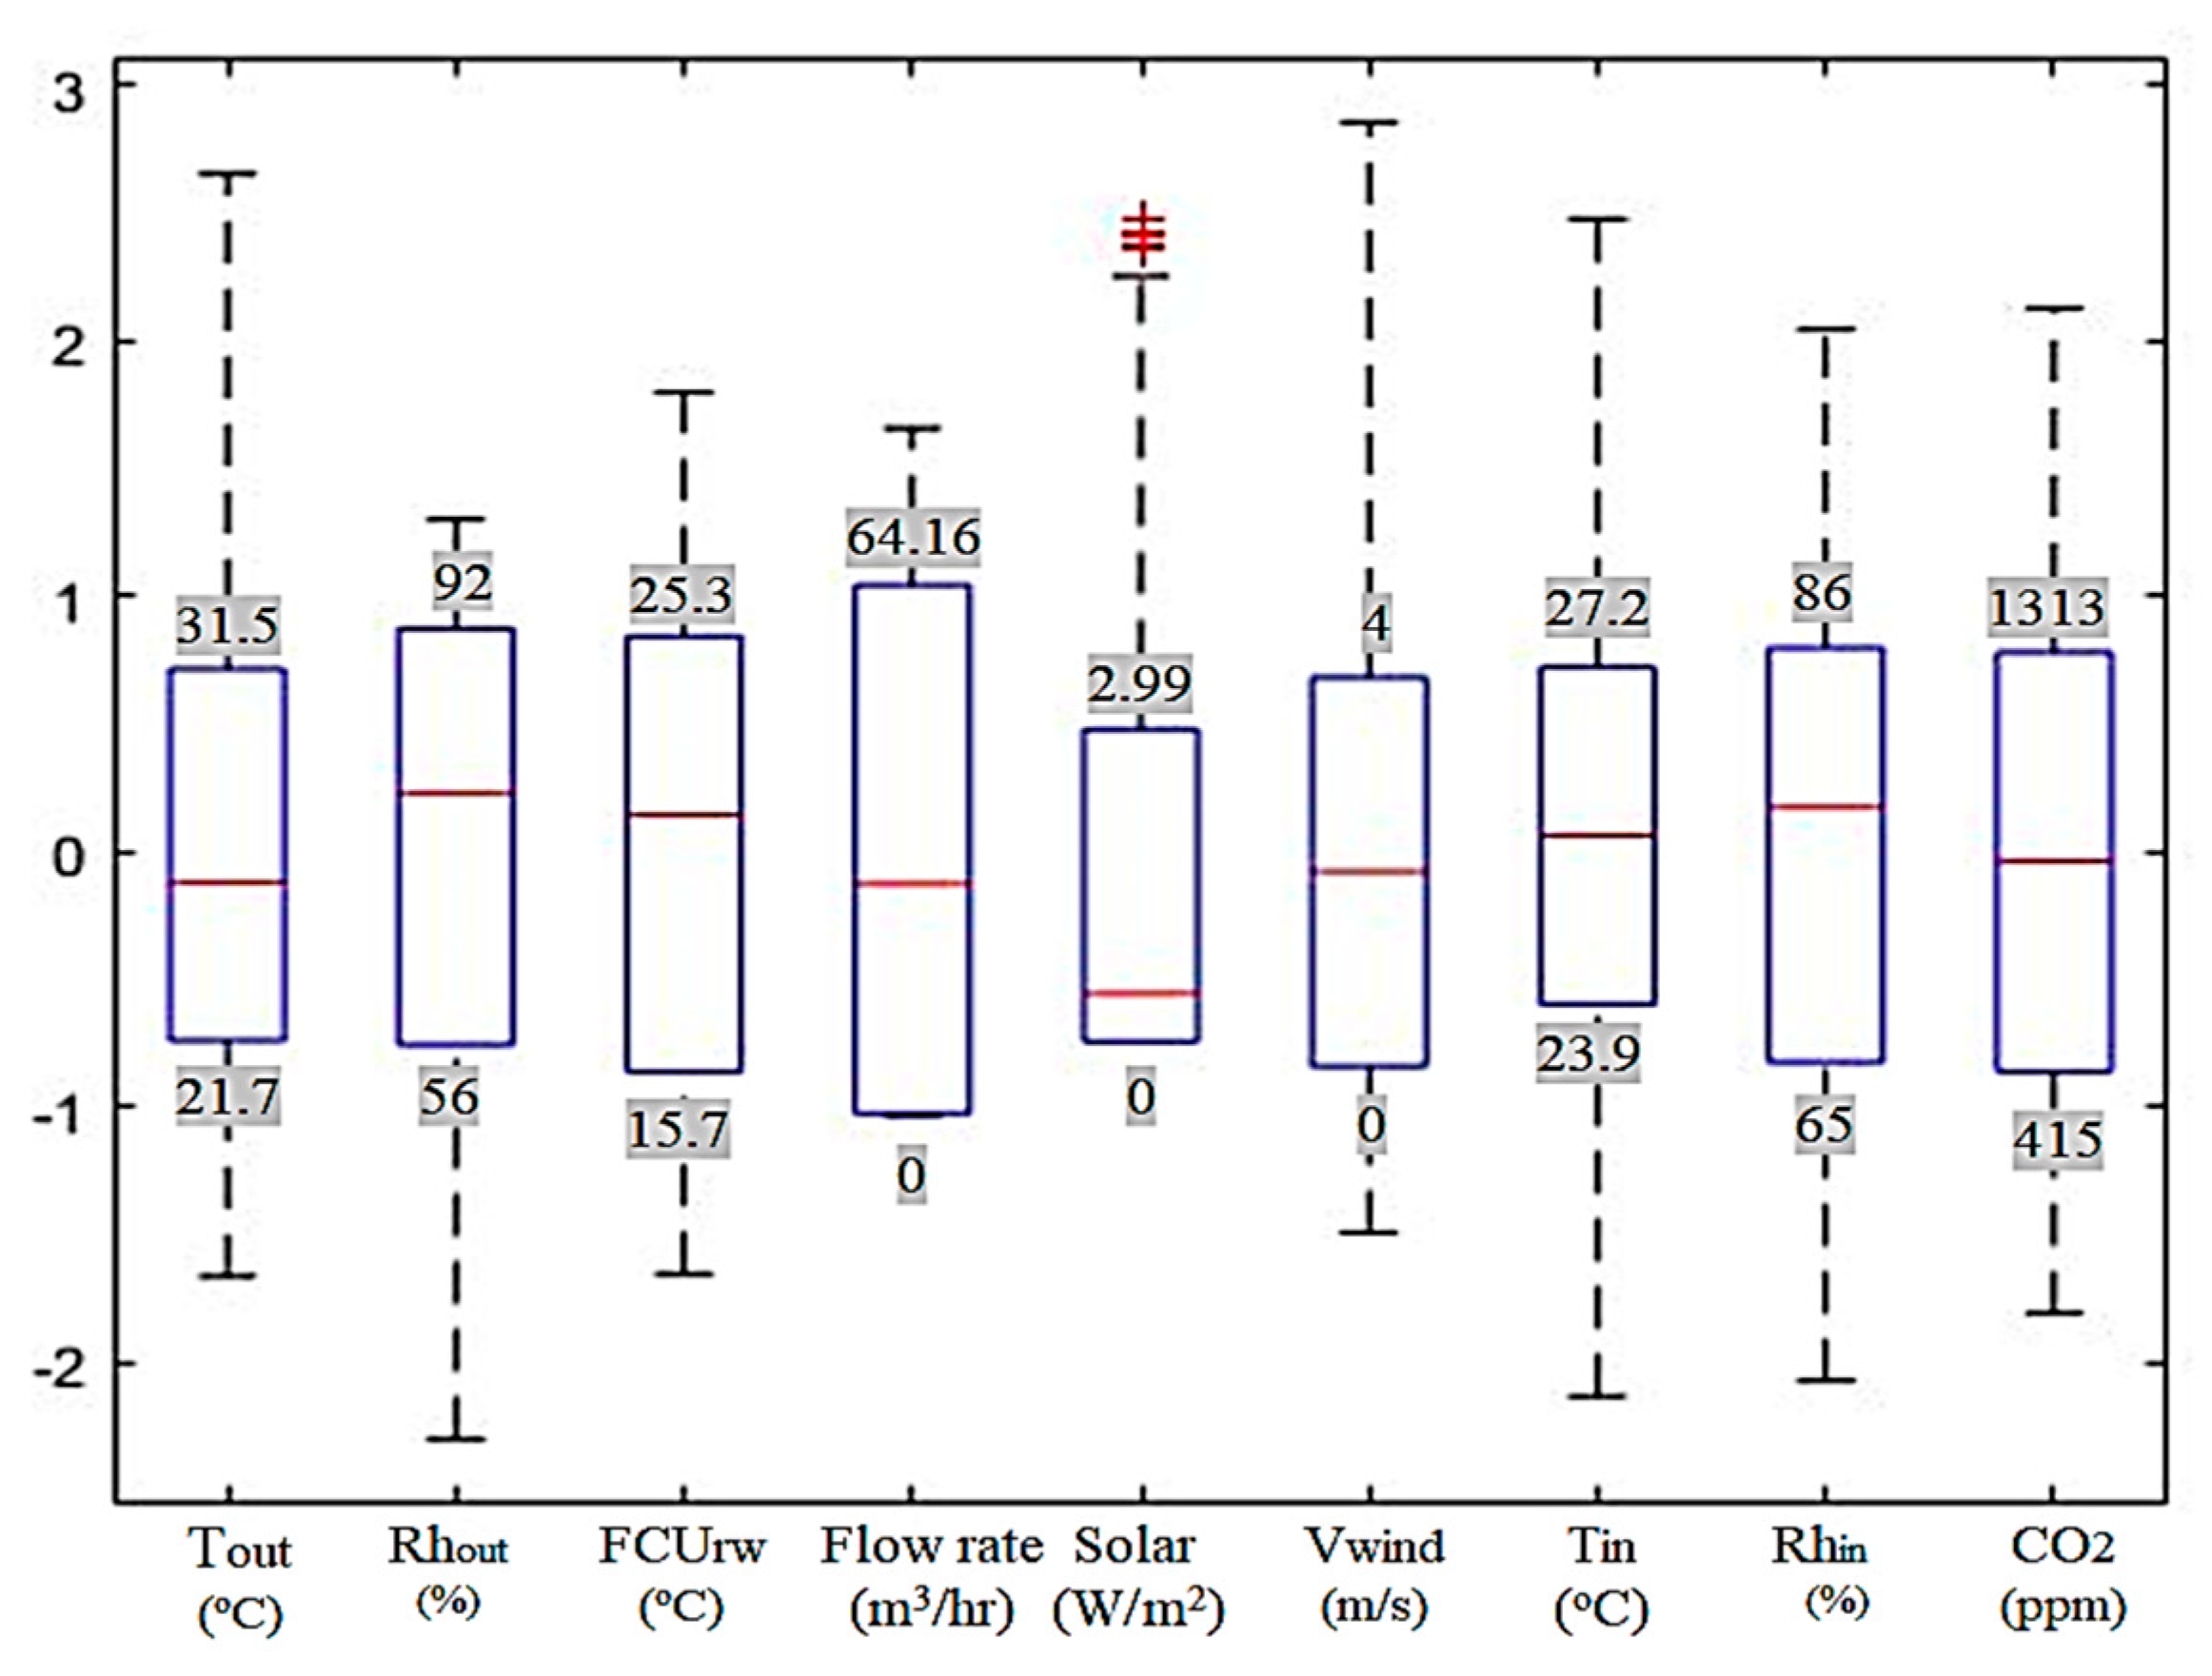
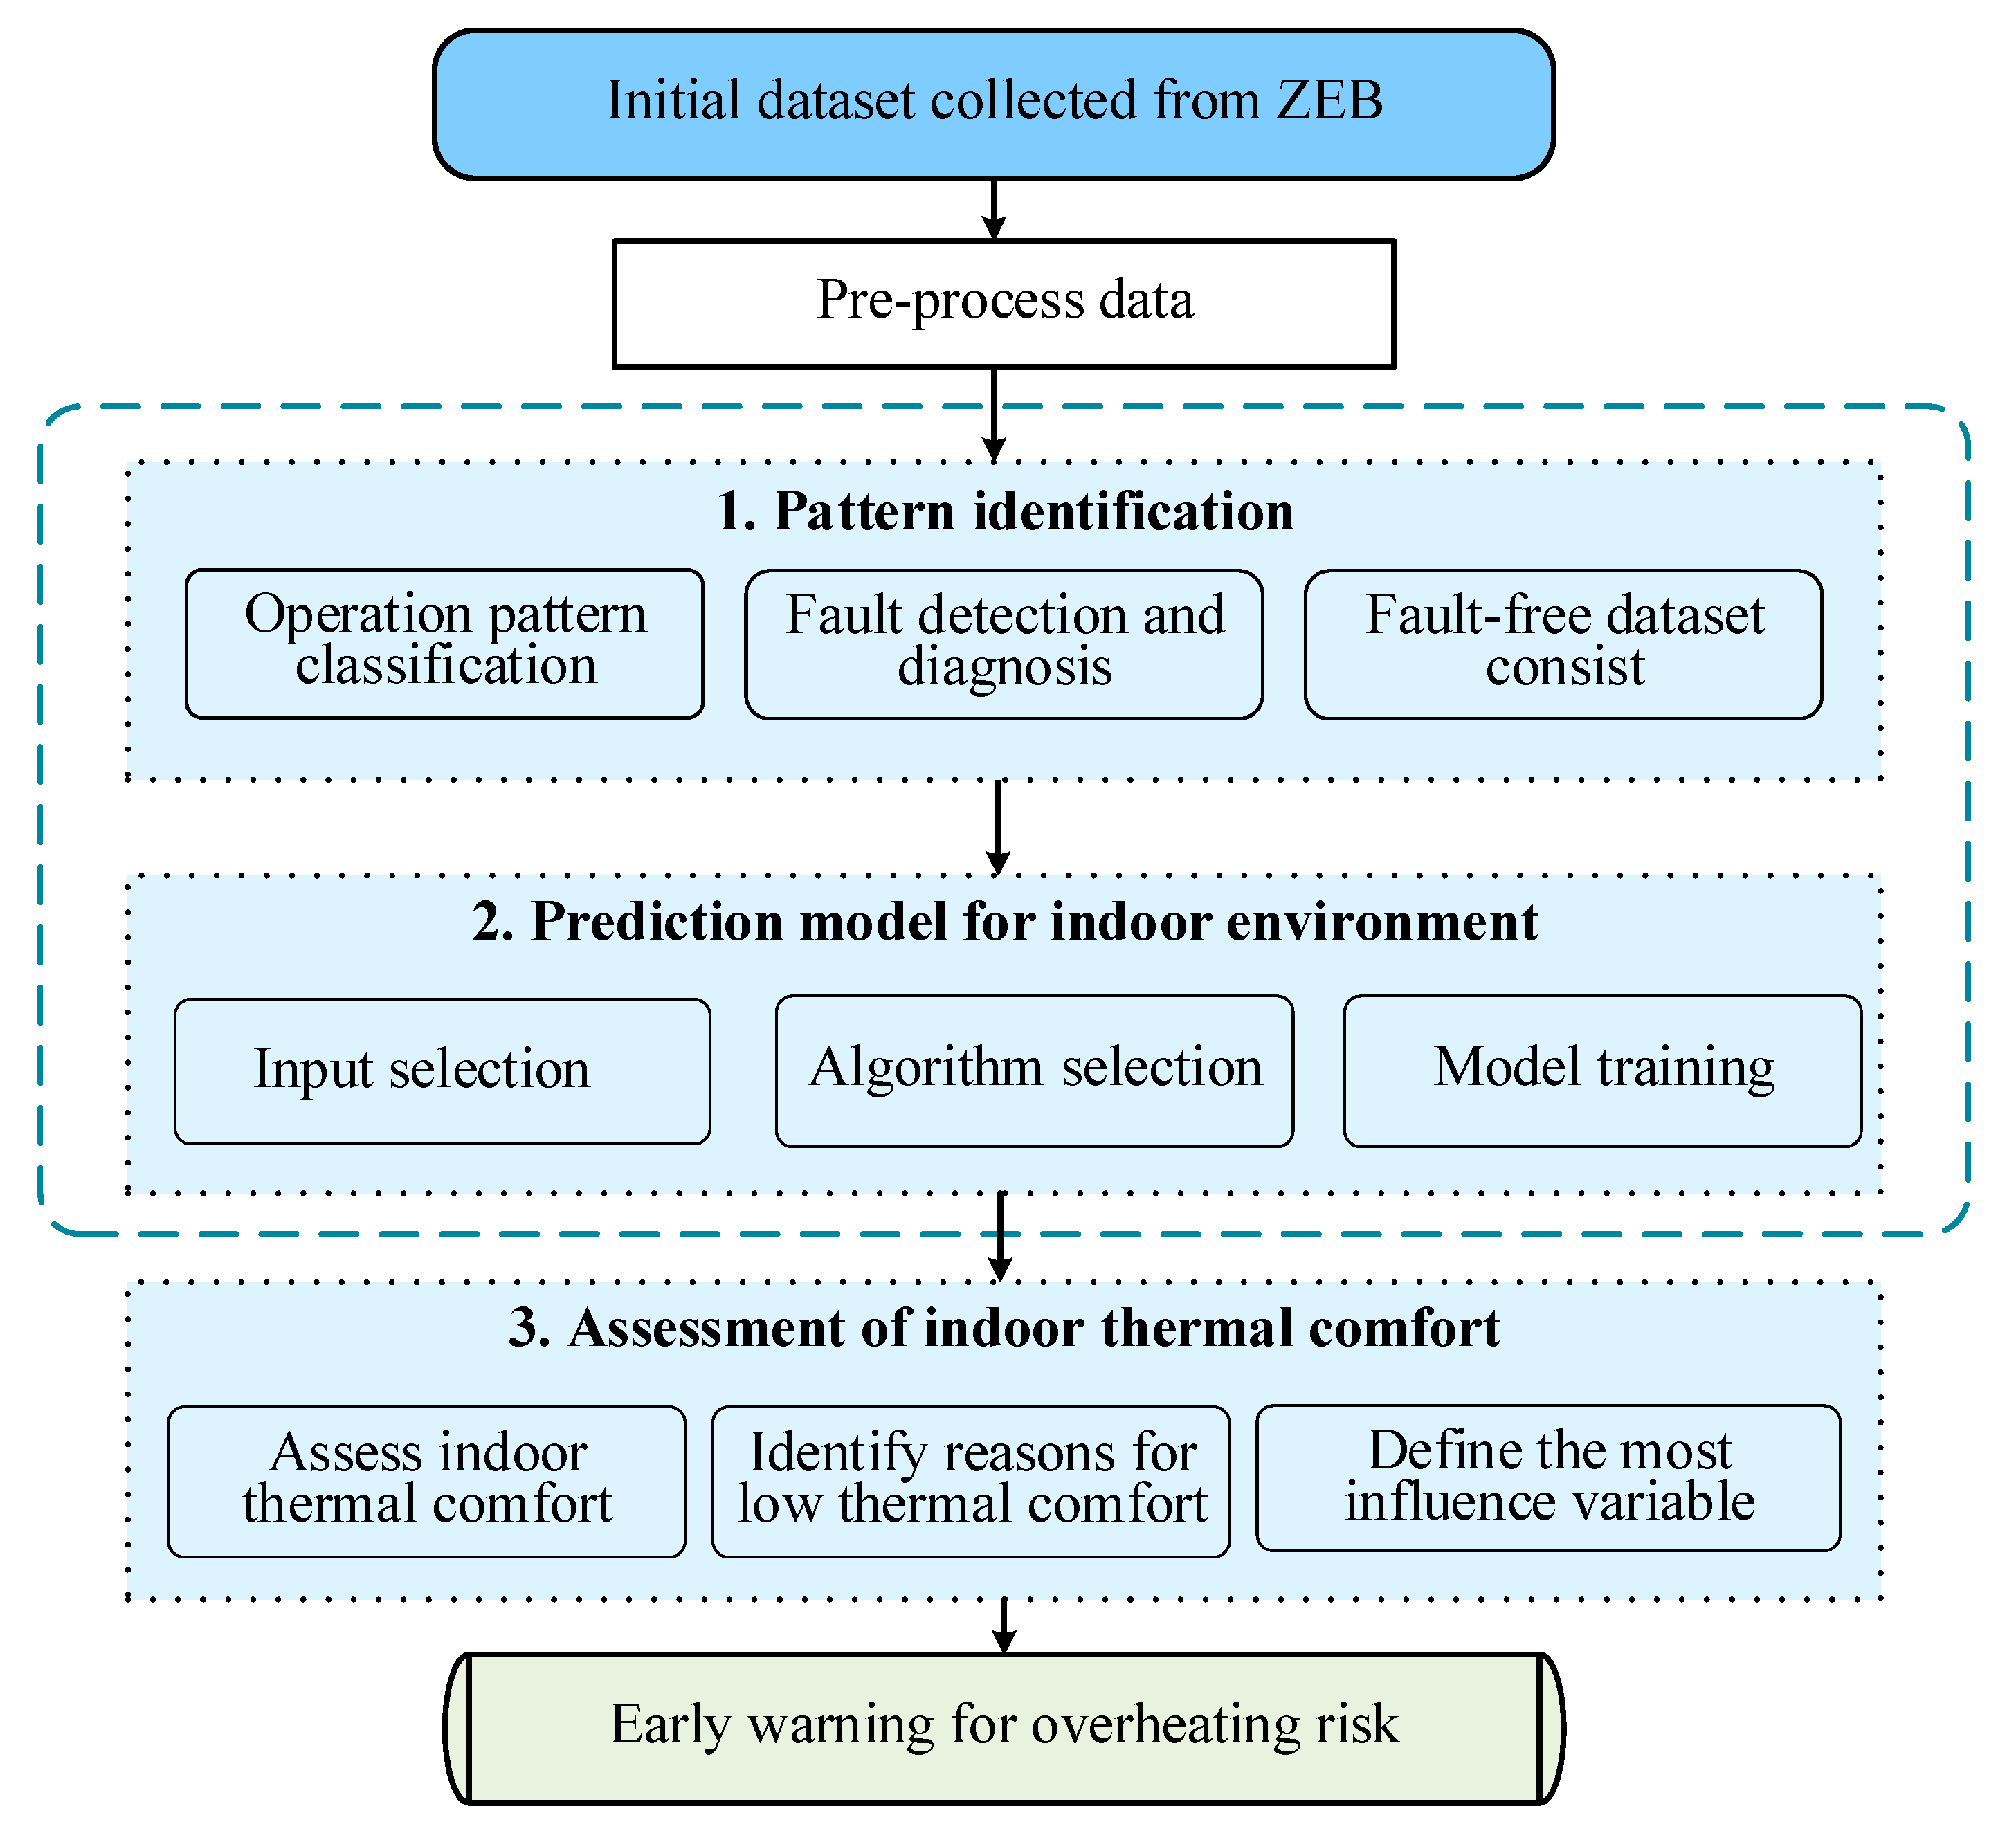
Figure 4 presents the basic process used to establish the prediction model. Before establishing the prediction model, the raw data should be preprocessed. The box plot can be used to detect and process outlier data from experimental raw data, thus avoiding interference caused by physical errors in the modeling. The pre-processed data are then randomly divided into a training dataset and a testing dataset, and only the training dataset is used in the modeling process. After that, the feature variables are selected through Pearson correlation analysis, and the set of feature variables for modeling is determined. The first step of modeling is to use unsupervised deep learning to add operational pattern identification tags as model inputs. The second step is that supervised deep learning is applied for developing prediction models. Finally, the output result should be validated with the testing dataset.
(2) Steps of model estimation
(a) Input variables selection
The purpose of input selection is as follows: (1) to find out the most effective and correlated variables among the entire dataset; (2) to discover the low repetitive and highly correlated variables to save computational time; (3) to select easily obtained variables so as to improve the applicability and robustness of the model.
In statistics, there are three commonly used correlation coefficients: Pearson correlation coefficient, Spearman correlation coefficient, and Kendall correlation coefficient. Among the three correlation coefficients, the Pearson correlation coefficient is used to measure the degree of linear correlation in this study. Spearman and Kendall are rank correlation coefficients [54] used to reflect the degree of rank correlation.
The Pearson correlation indexes [55] are shown in Table 4. Apparently, the FCU return water temperature and indoor relative humidity show the highest correlation with indoor temperature, followed by solar irradiation, outdoor temperature, pump power (operation variable), and outdoor relative humidity. Since the operation variables of cooling equipment can only be obtained via installing specific sensors, using these variables as input data will limit the broad applicability of the prediction model. Hence, the indoor relative humidity, solar irradiation, outdoor temperature, and outdoor relative humidity are ultimately chosen as input variables of the prediction model for indoor temperature prediction.
Similarly, as shown in Table 5, the correlation values with CO2 density ranked as follows: indoor temperature, return water temperature, indoor relative humidity, solar irradiation, outdoor temperature, pump power, and outdoor relative humidity. Therefore, it is necessary to add indoor temperature as a new variable to participate in predicting CO2 density for higher accuracy.
(b) Clustering algorithm selection
A clustering analysis is used in this study to detect fault data and identify the indoor environment mode initially. Cluster analysis maximizes the similarity between data samples in the same cluster and minimizes the similarity between data objects in different clusters in the final partition results. The massive data are categorized to differentiate their patterns and explore stronger rules for the prediction model. A self-organizing mapping (SOM) neural network, also known as a Kohonen network, is an unsupervised competitive learning network proposed by Kohonen et al. in 1981. As a nonlinear unsupervised clustering algorithm, it has been applied widely in artificial neural networks [56]. The algorithm gathers similar samples into the same category according to the distance to achieve data clustering. In the learning process of this network, the competition among neurons is unsupervised. In the training process of the network, the network will automatically find possible laws from the distribution characteristics to topology of the input vectors and adjust the weights among nodes of the network adaptively, and finally complete the clustering of the input data. Therefore, this method has been used widely in clustering analysis, signal processing, data dimension reduction, and other fields [57].
(c) Prediction algorithm selection
Three machine learning methods are selected in this study to participate in building the simple model: Back propagation (BP) neural network, radial basis function (RBF), and long short-term memory (LSTM). BP is a classical feed-forward neural network, RBF is a special neural network based on radial basis function, and LSTM represents a feedback neural network.
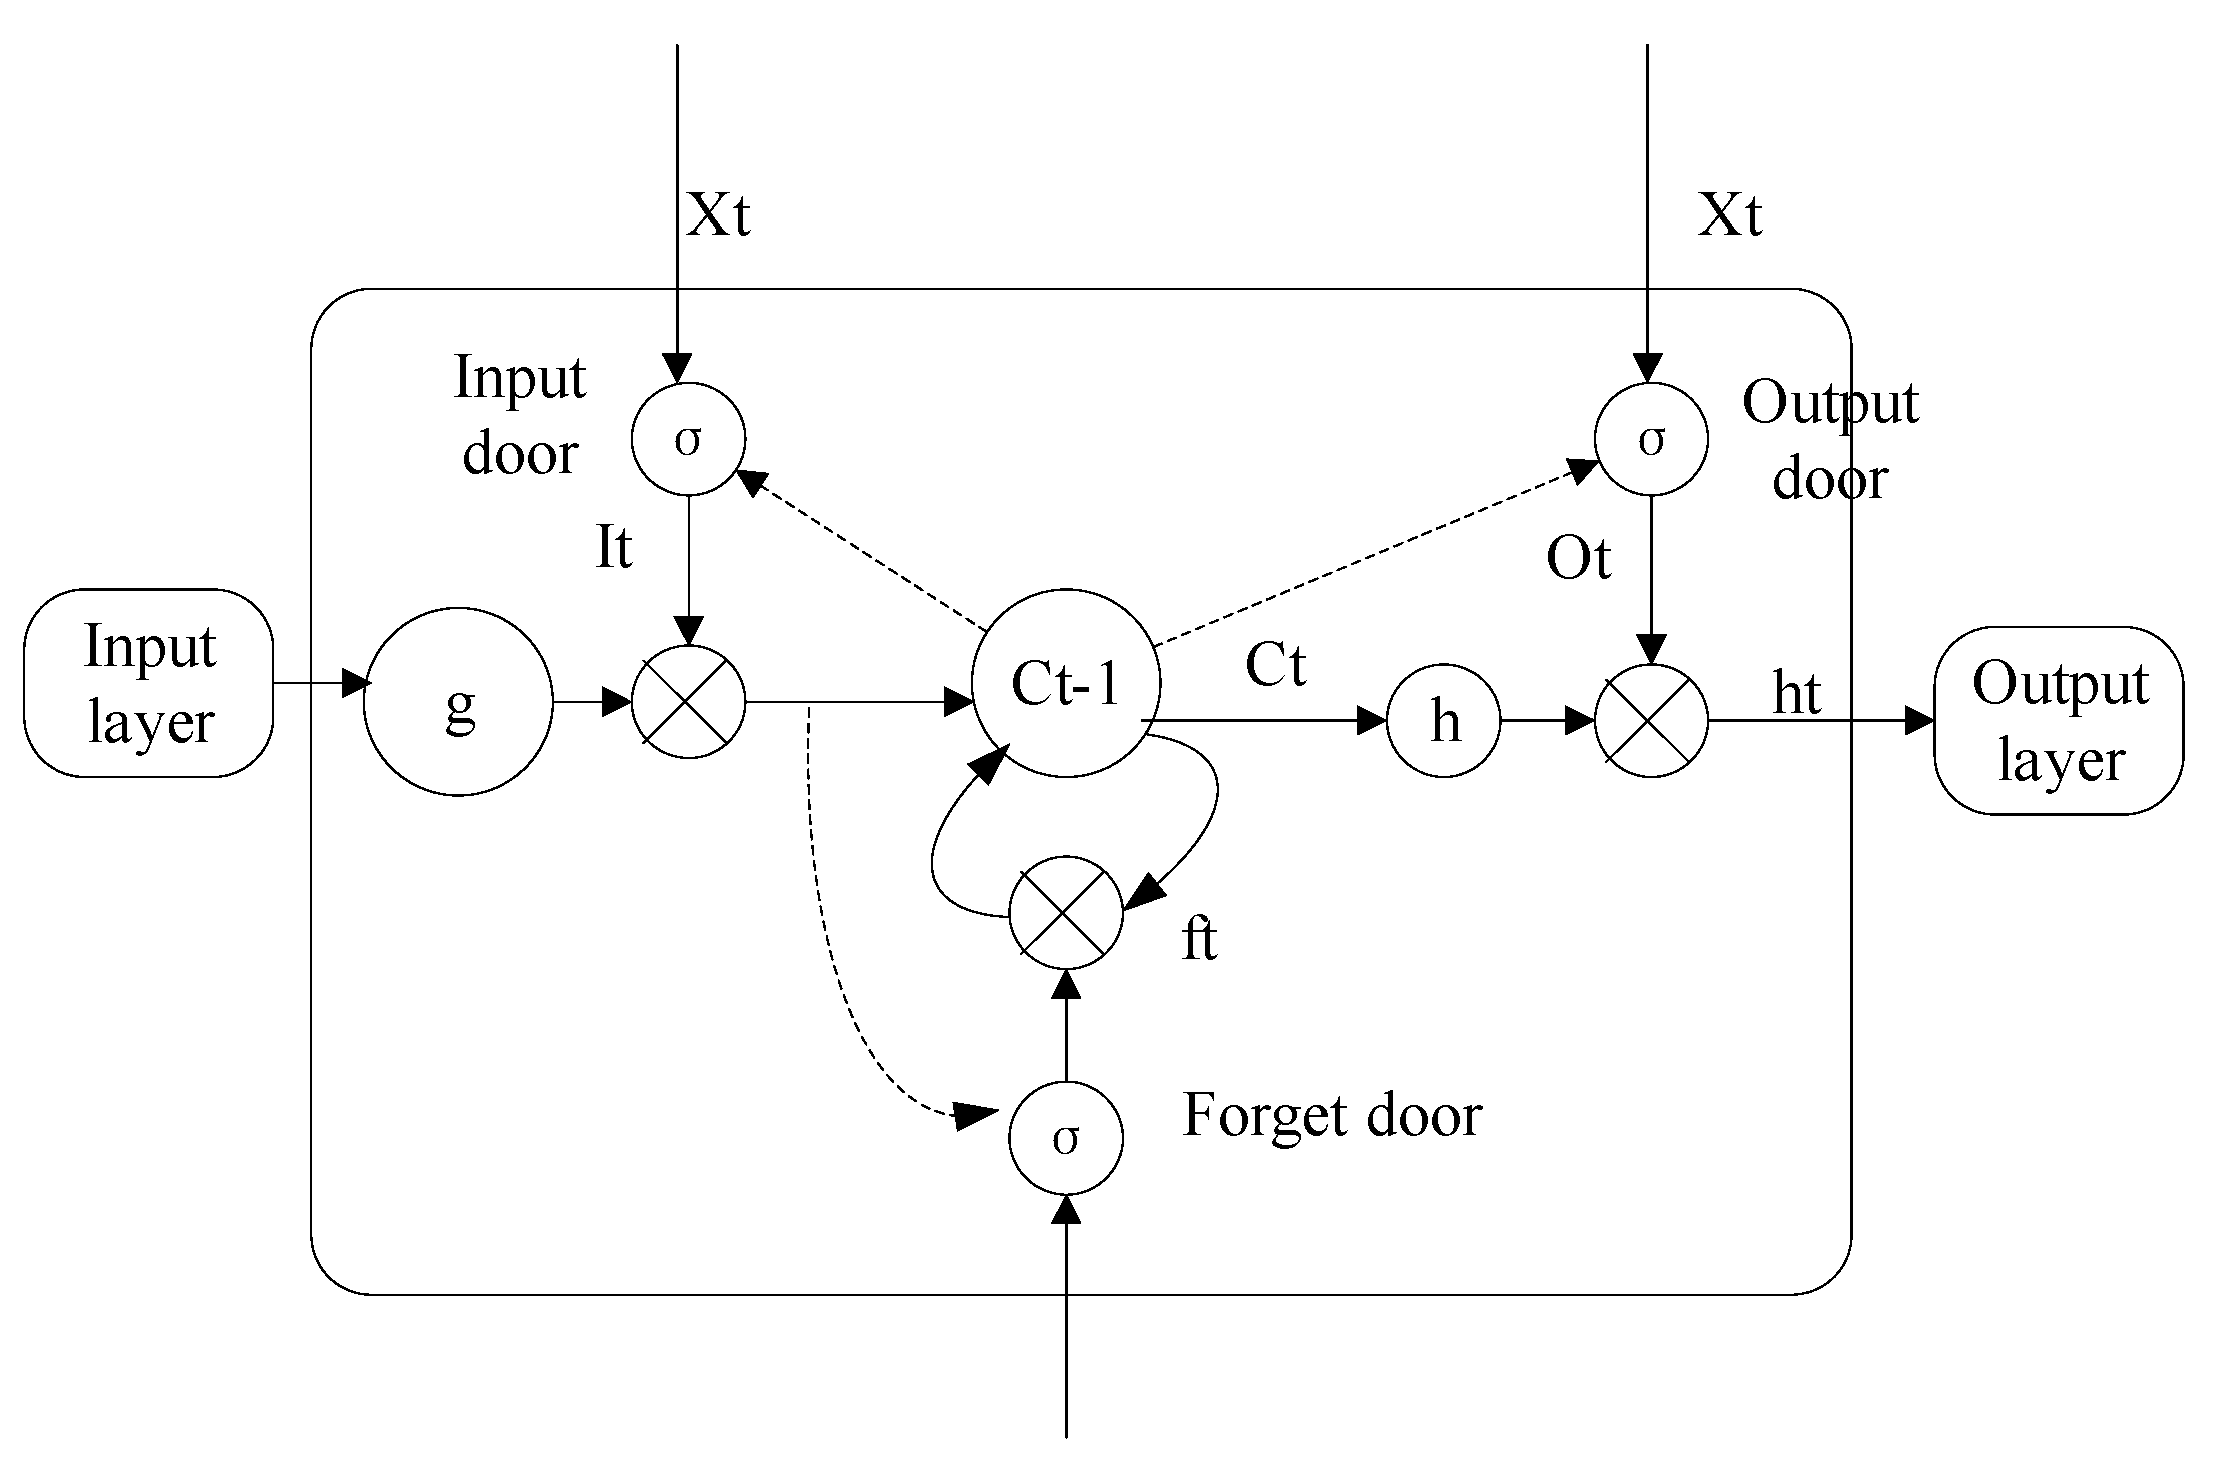
The long short-term memory neural network (LSTM) [58] is a special type of Recurrent Neural Network (RNN) that can learn to rely on information for a time series, which aligned with our research because LSTM can not only process single data points, but also entire sequences of data or historical states. It is suitable for numerical sequences of indoor temperature arranged chronologically, for multivariable, strongly coupled, and severely nonlinear relationships, and also for situations where it is difficult to describe their statistical significance in terms of functions. The LSTM neuron structure is shown in Figure 5. There are three door structures in the neuron structure: the input gate, the output gate, and the forget gate. The first step is to decide which information will be discarded from the cell status through the forget door. The second step is to determine which information will be placed in cells in the input gate, and the third step is to set the output value in the output door.
The BP [59] has very good nonlinear fitting ability, which can be used to identify complex and nonlinear systems. In particular, BPNN can build a relatively good functional relationship between input signals and output signals using original samples to train the network, so it is more suitable for short-term prediction.
The RBF plays an important role in the field of neural networks. For example, RBF neural networks have the unique best approximation property. As a kernel function, a radial basis function can map input samples to high-dimensional feature space and solve some problems that are originally linear and inseparable.
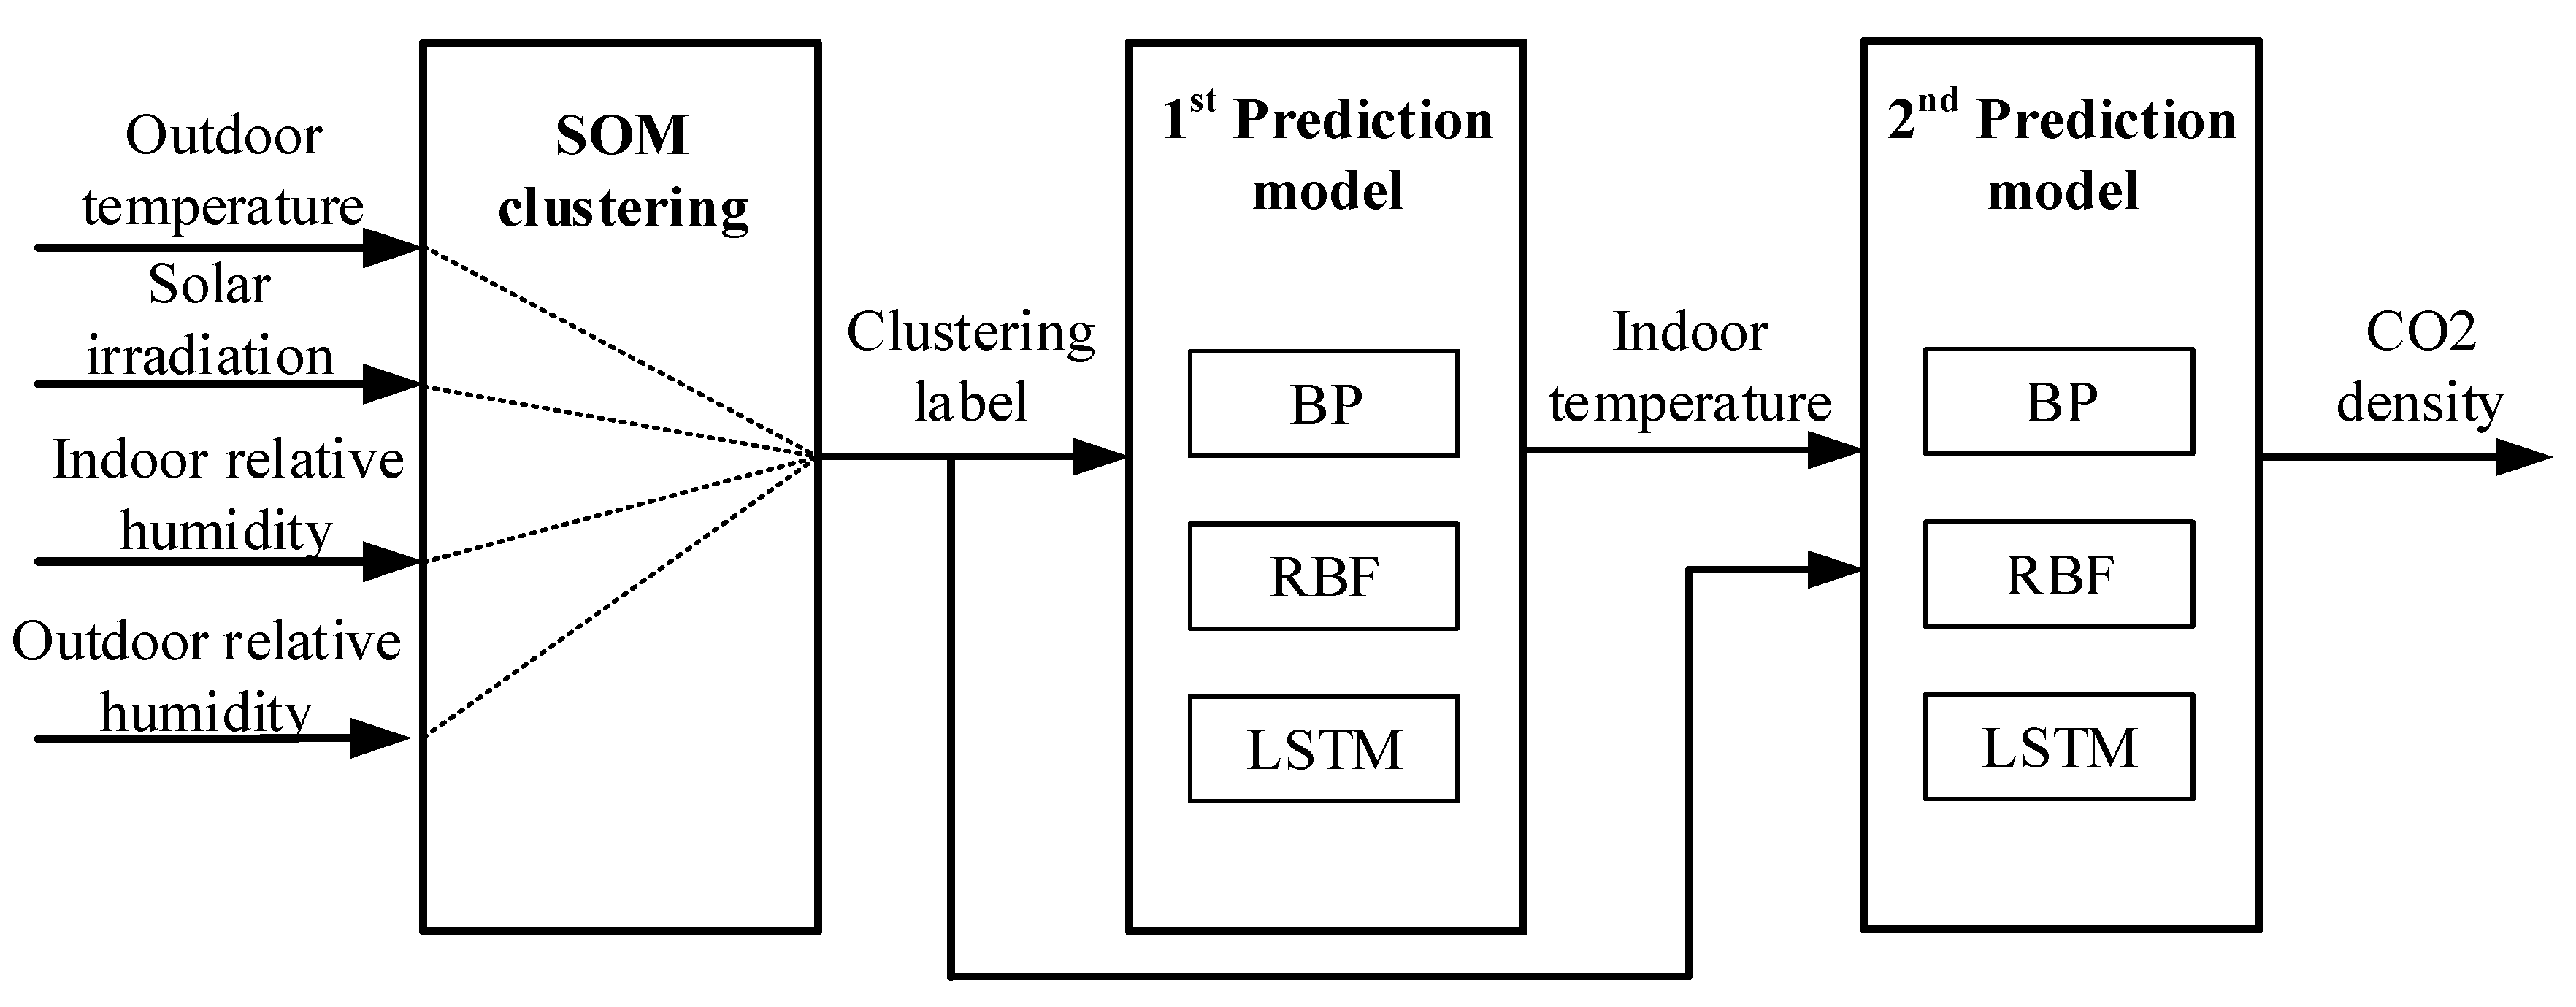
The prediction model proposed in this study is shown in Figure 6. The whole prediction process is divided into two layers. Outdoor temperature, solar irradiation, relative humidity, and indoor humidity are input variables for the first prediction model, and indoor temperature is added as a new input to estimate CO2 density in the second loop. The accuracy of the second layer is determined by the first layer. That is, the prediction accuracy of CO2 density is guaranteed by the accurate prediction of indoor temperature.
(d) Evaluation index illustration
Three evaluation metrics, root mean square error (RMSE), mean square error (MSE), and r-squared (R2), are used to evaluate the performances of those prediction models. RMSE [60], known as the standard error reflects the average deviation between the predicted values and the real value. MSE [61] refers to the average value of the relative error, which is used to compare the reliability of the prediction model.
R-squared (R2) [62] is a statistical measure that represents the proportion of the variance for a dependent variable that is explained by an independent variable or variables in a regression model. Whereas correlation explains the strength of the relationship between an independent and dependent variable, R2 explains to what extent the variance of one variable explains the variance of the second variable.

2.2.2. Prediction Model Evaluation

Each of the predictive models mentioned above has its own advantages. For comparative analysis of the prediction accuracy of each model, the performance of the LSTM model without data clustering and the SOM-BP, SOM-RBF, and SOM-LSTM models with data clustering were evaluated. The performances of the four models, SOM-BP, SOM-RBF, SOM-LSTM, LSTM, are summarized in Table 6 and Figure 7 and Figure 8. SOM-LSTM produces the most accurate results among the prediction models in this study; SOM-BP also performs well. In the case of the SOM-RBF model, the predictability decreased over time. In the case of LSTM without data clustering, it was shown that there is a deviation according to the prediction interval.
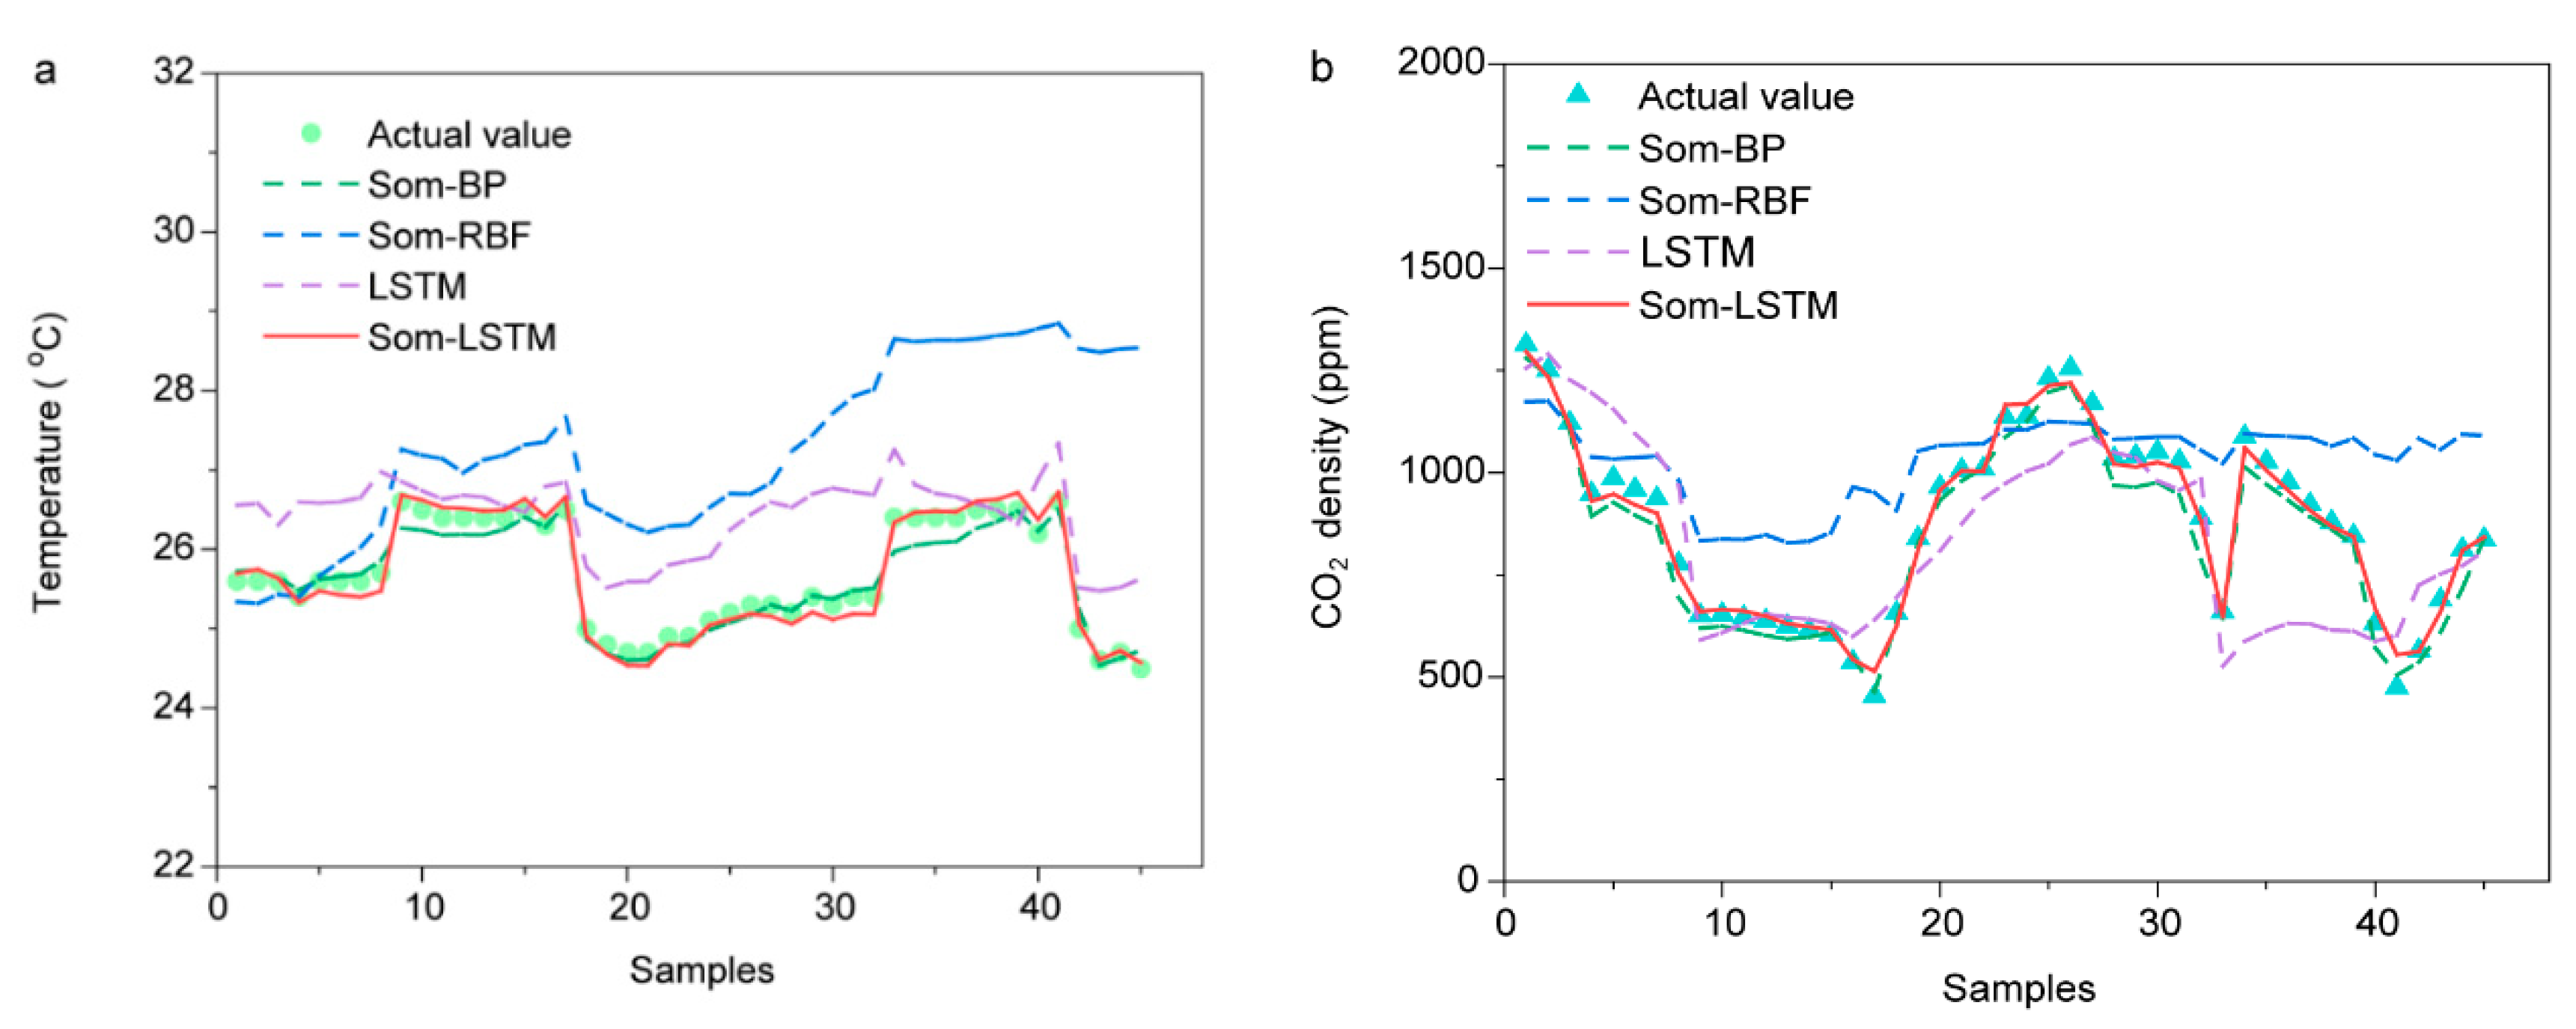
Figure 7a,b show the predicted results and actual value (measured value) comparison of the four models for indoor temperature and CO2 density, respectively. SOM-LSTM was the most similar to the actual data with the highest prediction accuracy. Since the SOM-LSTM model determines and uses the influence of past predicted values over time, it shows that accurate prediction is possible even after the elapse of time.
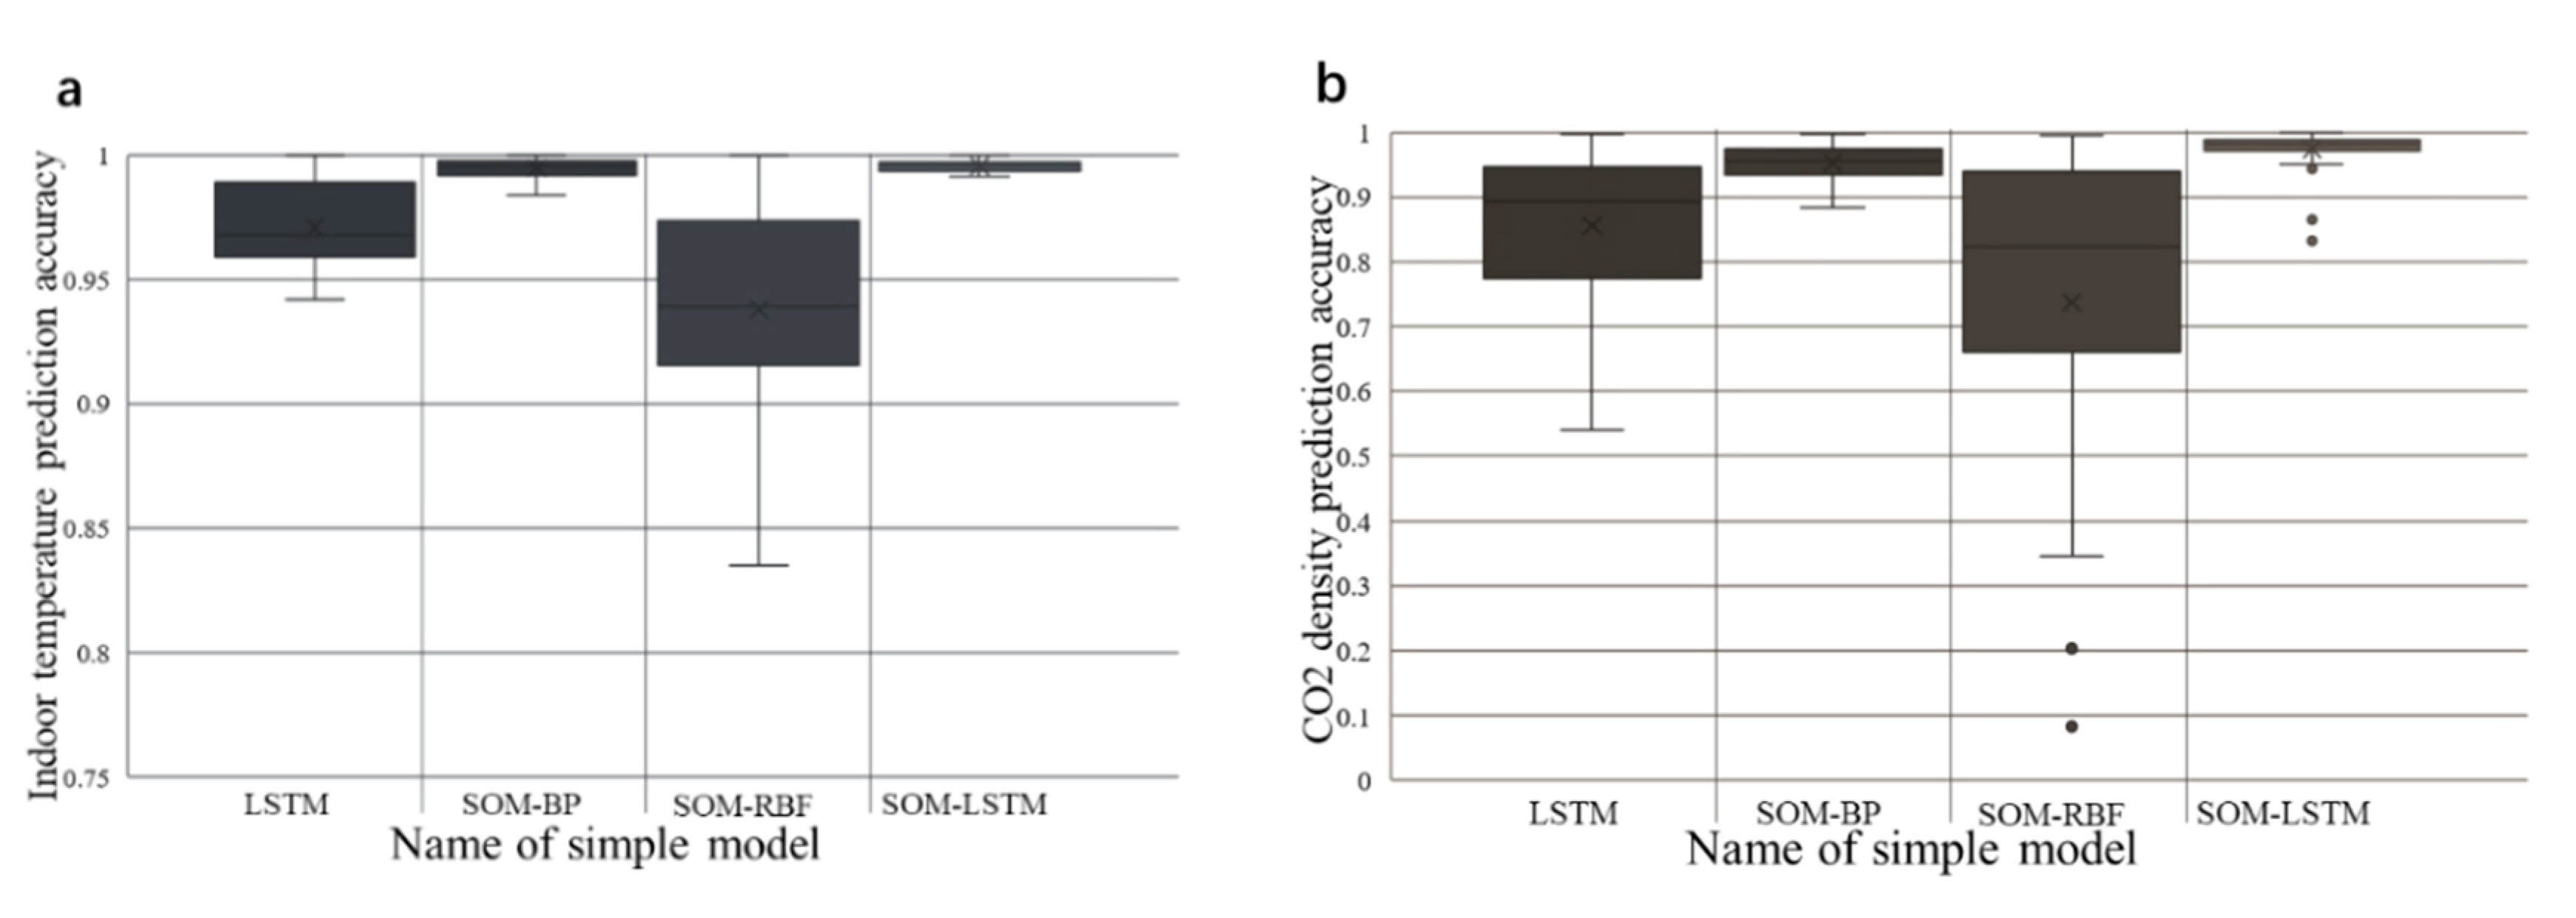
For predictive models, stability under large fluctuations of the dataset is as important as accuracy. Therefore, the boxplots of the accuracy results are shown in Figure 8 to analyze the stability of each prediction model.
Apparently, the SOM-LSTM model shows the best prediction performance, with an accuracy of over 95%, for the prediction of indoor temperature, and an acceptable accuracy of around 90% for the prediction of CO2 density. The results also demonstrated the feasibility of forecasting the CO2 density by introducing indoor temperature as a second time input variable.
Table 6 shows the results of the four models with three evaluation indexes: MSE, the RMSE, and the R2. In terms of predicting the indoor temperature and CO2 density, the SOM-LSTM method has superior performance to the LSTM, SOM-BP, and SOM-RBF methods. Thus, the proposed model using the LSTM algorithm with the SOM clustering method (SOM-LSTM) can reliably predict the indoor temperature and CO2 density from 1 May to 31 October. Further thermal comfort assessment and association analysis can be performed based on this predicted dataset.

3. Overheating Risk Prediction

3.1. Overheating Frequency

Based on data obtained from measurements and the simple model, overheating risk to the analyzed ZEB occurs during summer and intermediate seasons (Table 7 and Figure 9). The SOM-LSTM model with the highest accuracy of the previously evaluated prediction was used. Among the input values, metrological observation data around the target building was used for external weather data, and BEMS data was used for indoor humidity.
The overheating frequency exceeded 60% in July and August, the midsummer in Korea. This result shows that during the nighttime when the air conditioner is not operating, the indoor temperature and humidity did not decrease due to the characteristics of high insulation level and airtightness in the ZEB. Overheating also occurred during periods when air conditioners were off, such as May and October in Korea. In particular, overheating frequency decreased during the non-cooling season, and there was no significant difference between May and June. July showed the highest frequency of overheating, and the lowest occurred in October.

3.2. Contribution Rate of the Influencing Factors to Overheating Risk

The contribution rates of influencing factors to overheating risk are shown in Table 8 and Table 9. Table 8 presents the results of the cooling season (June to September) and Table 9 presents the results of the intermediate season (May, October).
In the case of the cooling season, the occupancy rate (CO2 concentration) showed the highest impact on overheating as 60% contribution rate for the analyzed ZEB. The solar insolation followed with 44% contribution rate. Outdoor temperature, outdoor humidity, and wind speed had contribution rates of 38.65%, 34.67%, and 25.61%, respectively. These results indicate that the indoor temperatures exceeded the thermal comfort zone when the number of occupants or the amount of solar insolation increased. In this situation, the cooling system may not be able to maintain a comfortable indoor thermal environment in the analyzed ZEB.
Even though the overheating frequency was relatively low in the intermediate season compared to the cooling season, overheating occurred at a frequency of about 10 to 30%. The solar insolation significantly affects the overheating in intermediate season. The influence of occupancy rate was also high. This is because the amount of solar insolation in spring and autumn is higher than in summer due to the solar altitude angle to the space facing the south side. More sunlight enters the room in spring and autumn than in summer in Korea. The window performance regulated by building code is just the heat transfer rate (U-value), but there is no regulation on the amount of solar irradiation (solar heat gain coefficient, SHGC). ZEBs are focused on strengthening the insulation and airtightness of the building envelope. Therefore, heat gain caused by solar insolation is the main reason of the overheating risk in ZEB in Korea.

3.3. Overheating Risk under Different Conditions

Overheating is caused by the interaction of several factors rather than by a single factor (Table 8 and Table 9). Therefore, it is important to analyze the degree of overheating in a situation in which two factors are combined. According to the results of this study, excessive solar insolation and occupancy density increase the indoor air temperature and cause overheating. The outdoor temperature also has a great influence on indoor overheating. However, anyone can predict that a room may overheat in this situation. Therefore, in this study, the effect of two factors on overheating was analyzed in a situation where one factor has a high value, but another factor does not (Table 10). Three sets of conditions are discussed in this study: (1) high occupancy rate with low solar insolation (condition 1), (2) low occupancy rates with high solar insolation (condition 2), (3) high solar insolation with high outdoor relative humidity (condition 3). Condition 3 occurs in the morning or evening, where the outside air temperature is low and the relative humidity is high but strong solar radiation is introduced to the east or west.
The analyzed results are shown in Table 10 and Figure 10. When the occupancy is high but the solar insolation is low, the overheating frequency is about 24%. When the occupancy is low and solar insolation is high, the probability of overheating is about 26%. This indicates that solar insolation and occupancy level can be a key factor affecting overheating in ZEBs. Because ZEB has a high level of insulation and is airtight, it causes an increase in indoor temperature due to the solar insolation through the window and the heat generated by the occupants during the day. Compared to general buildings, ZEB has shown that the indoor temperature is kept relatively high because of less heat loss through the building envelopes during the night. In particular, the analyzed ZEB building found that about 40% of the wall-to-window ratio considered to reduce the heating load resulted from an increase in overheating frequency in a cooling period. However, the overheating possibility is only 8% when the solar insolation and outdoor relative humidity are high. This suggests that overheating rarely occurs in the morning or evening hours.
The factors that most affects indoor overheating are solar insolation and occupancy level in the analyzed ZEB. However, this may be due to the lack of a standard for solar radiation through the windows in the Korean ZEB standard, and the fact that the design standard for occupancy density is lower than that of an actual building. In addition, since the ZEB standard is set to minimize the heating load and strengthen the insulation or airtightness performance, it is difficult for indoor heat to be discharged to the outside. This is the cause of overheating in ZEB in Korea.

4. Conclusions

The aims of this study are to discuss overheating issues in a high-performance ZEB in Korea. Field measurements were carried out to analyze the overheating risk for a zero-energy library building. A data-driven model for prediction of overheating risk was developed, requiring only a small amount of measurement data and extending the analysis throughout the year. The main factors causing overheating during both cooling season and intermediate seasons were also analyzed in detail. The results of this study are as follows:
A simple model based on a data-driven approach can accurately forecast overheating conditions throughout the year with easily obtained data from local weather stations and a few easily accessed indoor parameters, such as indoor temperature and CO2 density.
The SOM-LSTM model shows the best prediction performance, with a high accuracy (over 95%) for the prediction of indoor temperature and an acceptable accuracy (around 90%) for the prediction of CO2 density.
The overheating frequency exceeded 60% in July and August, the midsummer in Korea. Overheating also occurred during the intermediate seasons when air conditioners were off, such as in May and October in Korea.
In the case of the cooling season, the occupancy rate (CO2 concentration) showed the highest impact on overheating, with a 60% contribution rate for the analyzed ZEB. In contrast, the solar insolation significantly affects overheating in the intermediate season. This is because the amount of solar insolation in spring and autumn is greater than in the summer due to the solar altitude angle to the space facing the south side. More sunlight enters the room in spring and autumn than in summer in Korea.
The factors that most affect indoor overheating are solar insolation and occupancy level in the analyzed ZEB. This is due to the lack of a standard for solar radiation through the windows in the Korean ZEB standard, and due to the fact that the design standard for occupancy density is lower than that of an actual building. In addition, since the ZEB standard is generally set to minimize the heating load, it is difficult for indoor heat to be discharged to the outside, causing overheating in ZEBs.
This study evaluated the problems of the ZEB performance standard in Korea through a predictive model. Korean ZEB performance standard based on passive houses’ performance level imply that the local climate or building usage characteristics may not be reflected. As with the overheating problem shown in this study, the ZEB may not lead to energy saving at the operating stage and may not guarantee the occupant’s thermal comfort. It implies that the ZEB performance standard with energy saving and the thermal comfort consideration of building users in all seasons is required.

Author Contributions

Conceptualization, J.K.; methodology, Y.Y. and J.S.; software, Y.Y.; validation, J.S.; formal analysis, Y.Y.; investigation, J.J.; resources, S.L. and J.K.; data curation, S.L.; writing—original draft preparation, Y.Y.; writing—review and editing, D.S. and J.K.; supervision, D.S.; project administration, D.S.; funding acquisition, D.S. All authors have read and agreed to the published version of the manuscript.

Funding

This research was funded by Ministry of Science and ICT of Korean government, grant number 2019M3E7A1113080.

Acknowledgments

This research was supported by a grant (2019M3E7A1113080) from the Energy Environment Integrated School Particulate Matter Technology Development project funded by the Ministry of Science and ICT of Korean government.

Conflicts of Interest

The authors declare no conflict of interest.

References

  1. Tham, K.W. Conserving energy without sacrificing thermal comfort. Build. Environ. 1993, 28, 287–299. [Google Scholar] [CrossRef]
  2. Wang, Y.; Kuckelkorn, J.; Zhao, F.-Y.; Liu, D.; Kirschbaum, A.; Zhang, J.-L. Evaluation on classroom thermal comfort and energy performance of passive school building by optimizing HVAC control systems. Build. Environ. 2015, 89, 86–106. [Google Scholar] [CrossRef]
  3. Marszal, A.J.; Heiselberg, P.; Bourrelle, J.S.; Musall, E.; Voss, K.; Sartori, I.; Napolitano, A. Zero Energy Building—A review of definitions and calculation methodologies. Energy Build. 2011, 43, 971–979. [Google Scholar] [CrossRef]
  4. Sartori, I.; Napolitano, A.; Voss, K. Net zero energy buildings: A consistent definition framework. Energy Build. 2012, 48, 220–232. [Google Scholar] [CrossRef] [Green Version]
  5. Oral, G.K.; Yilmaz, Z. Building form for cold climatic zones related to building envelope from heating energy conservation point of view. Energy Build. 2003, 35, 383–388. [Google Scholar] [CrossRef]
  6. Torcellini, P.; Pless, S.; Deru, M.; Crawley, D. Zero Energy Buildings: A Critical Look at the Definition; National Renewable Energy Lab. (NREL): Golden, CO, USA, 2006.
  7. Oh, J.; Hong, T.; Kim, H.; An, J.; Jeong, K.; Koo, C. Advanced Strategies for Net-Zero Energy Building: Focused on the Early Phase and Usage Phase of a Building’s Life Cycle. Sustainability 2017, 9, 2272. [Google Scholar] [CrossRef] [Green Version]
  8. Rodriguez-Ubinas, E.; Montero, C.; Porteros, M.; Vega, S.; Navarro, I.; Castillo-Cagigal, M.; Matallanas, E.; Gutiérrez, A. Passive design strategies and performance of Net Energy Plus Houses. Energy Build. 2014, 83, 10–22. [Google Scholar] [CrossRef] [Green Version]
  9. Sun, X.; Gou, Z.; Lau, S.S.-Y. Cost-effectiveness of active and passive design strategies for existing building retrofits in tropical climate: Case study of a zero energy building. J. Clean. Prod. 2018, 183, 35–45. [Google Scholar] [CrossRef]
  10. Silva, S.M.; Mateus, R.; Marques, L.; Ramos, M.; Almeida, M. Contribution of the solar systems to the nZEB and ZEB design concept in Portugal—Energy, economics and environmental life cycle analysis. Sol. Energy Mater. Sol. Cells 2016, 156, 59–74. [Google Scholar] [CrossRef] [Green Version]
  11. Berggren, B.; Wall, M.; Flodberg, K.; Sandberg, E. Net ZEB office in Sweden—A case study, testing the Swedish Net ZEB definition. Int. J. Sustain. Built Environ. 2012, 1, 217–226. [Google Scholar] [CrossRef] [Green Version]
  12. Colclough, S.; O’Leary, T.; Hewitt, N.; Griffiths, P. The near Zero Energy Building standard and the Passivhaus standard—A case study. In Proceedings of the Passive and Low Energy Architecture, Edinburgh, UK, 3–5 July 2017; pp. 385–392. [Google Scholar]
  13. Kylili, A.; Fokaides, P.A. European smart cities: The role of zero energy buildings. Sustain. Cities Soc. 2015, 15, 86–95. [Google Scholar] [CrossRef]
  14. Brunsgaard, C.; Knudstrup, M.-A.; Heiselberg, P. Occupant Experience of Everyday Life in Some of the First Passive Houses in Denmark. Housing Theory Soc. 2012, 29, 223–254. [Google Scholar] [CrossRef]
  15. Kang, J.S.; Lim, J.H.; Choi, G.S.; Lee, S.E.; Choi, G.S. Building Policies for Energy Efficiency and the Development of a Zero-Energy Building Envelopment System in Korea. Adv. Mater. Res. 2013, 689, 35–38. [Google Scholar] [CrossRef]
  16. Koo, C.; Hong, T.; Park, H.S.; Yun, G. Framework for the analysis of the potential of the rooftop photovoltaic system to achieve the net-zero energy solar buildings. Prog. Photovolt. Res. Appl. 2013, 22, 462–478. [Google Scholar] [CrossRef]
  17. Schuetze, T.; Hagen Hodgson, P. Zero Emission Buildings in Korea. In Proceedings of the 4th World Sustainability Forum 2014, Basel, Switzerland, 1–30 November 2014. [Google Scholar]
  18. Nicol, F. The Limits of Thermal Comfort: Avoiding Overheating in European Buildings: CIBSE TM52, 2013; Cibse: London, UK, 2013. [Google Scholar]
  19. Lomas, K.J.; Porritt, S.M. Overheating in Buildings: Lessons from Research; Taylor & Francis: Abingdon, UK, 2017. [Google Scholar]
  20. Lee, H.; Kim, I. A Study on the Calculation Method of Load standard for ZEB activation. J. Energy Eng. 2017, 26, 92–99. [Google Scholar]
  21. Sameni, S.M.T.; Gaterell, M.; Montazami, A.; Ahmed, A. Overheating investigation in UK social housing flats built to the Passivhaus standard. Build. Environ. 2015, 92, 222–235. [Google Scholar] [CrossRef] [Green Version]
  22. Rojas, G.; Wagner, W.; Suschek-Berger, J.; Pfluger, R.; Feist, W. Applying the passive house concept to a social housing project in Austria—Evaluation of the indoor environment based on long-term measurements and user surveys. Adv. Build. Energy Res. 2016, 10, 125–148. [Google Scholar] [CrossRef]
  23. Baglivo, C.; Congedo, P.M.; Fazio, A.; Laforgia, D. Multi-objective optimization analysis for high efficiency external walls of zero energy buildings (ZEB) in the Mediterranean climate. Energy Build. 2014, 84, 483–492. [Google Scholar] [CrossRef]
  24. Wang, Z.; Xue, Q.; Ji, Y.; Yu, Z. Indoor environment quality in a low-energy residential building in winter in Harbin. Build. Environ. 2018, 135, 194–201. [Google Scholar] [CrossRef]
  25. Fletcher, M.; Johnston, D.; Glew, D.; Parker, J. An empirical evaluation of temporal overheating in an assisted living Passivhaus dwelling in the UK. Build. Environ. 2017, 121, 106–118. [Google Scholar] [CrossRef]
  26. Beizaee, A.; Lomas, K.; Firth, S. National survey of summertime temperatures and overheating risk in English homes. Build. Environ. 2013, 65, 1–17. [Google Scholar] [CrossRef] [Green Version]
  27. Mulville, M.; Stravoravdis, S. The impact of regulations on overheating risk in dwellings. Build. Res. Inf. 2016, 44, 520–534. [Google Scholar] [CrossRef] [Green Version]
  28. Wang, Y.; Zhao, F.-Y.; Kuckelkorn, J.; Spliethoff, H.; Rank, E. School building energy performance and classroom air environment implemented with the heat recovery heat pump and displacement ventilation system. Appl. Energy 2014, 114, 58–68. [Google Scholar] [CrossRef]
  29. Attia, S. Net Zero Energy Buildings (NZEB): Concepts, Frameworks and Roadmap for Project Analysis and Implementation; Butterworth-Heinemann: Oxford, UK, 2018. [Google Scholar]
  30. Mavrogianni, A.; Davies, M.; Taylor, J.; Chalabi, Z.; Biddulph, P.; Oikonomou, E.; Das, P.; Jones, B. The impact of occupancy patterns, occupant-controlled ventilation and shading on indoor overheating risk in domestic environments. Build. Environ. 2014, 78, 183–198. [Google Scholar] [CrossRef]
  31. Jones, R.; Goodhew, S.; De Wilde, P. Measured Indoor Temperatures, Thermal Comfort and Overheating Risk: Post-occupancy Evaluation of Low Energy Houses in the UK. Energy Procedia 2016, 88, 714–720. [Google Scholar] [CrossRef] [Green Version]
  32. Porritt, S.; Cropper, P.; Shao, L.; Goodier, C. Ranking of interventions to reduce dwelling overheating during heat waves. Energy Build. 2012, 55, 16–27. [Google Scholar] [CrossRef]
  33. Hodder, S.G.; Parsons, K. The effects of solar radiation on thermal comfort. Int. J. Biometeorol. 2006, 51, 233–250. [Google Scholar] [CrossRef]
  34. Maivel, M.; Kurnitski, J.; Kalamees, T. Field survey of overheating problems in Estonian apartment buildings. Arch. Sci. Rev. 2015, 58, 1–10. [Google Scholar] [CrossRef]
  35. Taylor, J.; Davies, M.; Mavrogianni, A.; Shrubsole, C.; Hamilton, I.; Das, P.; Jones, B.; Oikonomou, E.; Biddulph, P. Mapping indoor overheating and air pollution risk modification across Great Britain: A modelling study. Build. Environ. 2016, 99, 1–12. [Google Scholar] [CrossRef]
  36. Emmanuel, R.; Loconsole, A. Green infrastructure as an adaptation approach to tackling urban overheating in the Glasgow Clyde Valley Region, UK. Landsc. Urban Plan. 2015, 138, 71–86. [Google Scholar] [CrossRef] [Green Version]
  37. Karaıpeklı, A.; Sarı, A.; Kaygusuz, K.; Karaipekli, A.; Sari, A. Thermal Characteristics of Paraffin/Expanded Perlite Composite for Latent Heat Thermal Energy Storage. Energy Sour. Part A Recover. Util. Environ. Eff. 2009, 31, 814–823. [Google Scholar] [CrossRef]
  38. Hee, W.; Alghoul, M.; Bakhtyar, B.; Elayeb, O.; Shameri, M.; Alrubaih, M.; Sopian, K. The role of window glazing on daylighting and energy saving in buildings. Renew. Sustain. Energy Rev. 2015, 42, 323–343. [Google Scholar] [CrossRef]
  39. Rijal, H.; Tuohy, P.; Nicol, F.; Humphreys, M.A.; Samuel, A.; Clarke, J. Development of an adaptive window-opening algorithm to predict the thermal comfort, energy use and overheating in buildings. J. Build. Perform. Simul. 2008, 1, 17–30. [Google Scholar] [CrossRef] [Green Version]
  40. Mlakar, J.; Štrancar, J. Overheating in residential passive house: Solution strategies revealed and confirmed through data analysis and simulations. Energy Build. 2011, 43, 1443–1451. [Google Scholar] [CrossRef]
  41. Ridley, I.; Clarke, A.R.; Bere, J.; Altamirano, H.; Lewis, S.; Durdev, M.; Farr, A. The monitored performance of the first new London dwelling certified to the Passive House standard. Energy Build. 2013, 63, 67–78. [Google Scholar] [CrossRef] [Green Version]
  42. Finegan, E.; Kelly, G.; O’Sullivan, G. Comparative analysis of Passivhaus simulated and measured overheating frequency in a typical dwelling in Ireland. Build. Res. Inf. 2019, 48, 681–699. [Google Scholar] [CrossRef]
  43. Schultz, J.M.; Svendsen, S. WinSim: A simple simulation program for evaluating the influence of windows on heating demand and risk of overheating. Sol. Energy 1998, 63, 251–258. [Google Scholar] [CrossRef]
  44. Taylor, J.; Davies, M.; Mavrogianni, A.; Chalabi, Z.; Biddulph, P.; Oikonomou, E.; Das, P.; Jones, B. The relative importance of input weather data for indoor overheating risk assessment in dwellings. Build. Environ. 2014, 76, 81–91. [Google Scholar] [CrossRef]
  45. Agency, K.E. Korean Building Design Criteria for Energy Saving. Available online: www.energy.or.kr/ (accessed on 27 October 2020).
  46. International Organization for Standardization; International Electrotechnical Commission. Ergonomics of the Thermal Environment—Instruments for Measuring Physical Quantities; International Organization for Standardization: Geneva, Switzerland, 1998. [Google Scholar]
  47. Fang, T.; Lahdelma, R. Evaluation of a multiple linear regression model and SARIMA model in forecasting heat demand for district heating system. Appl. Energy 2016, 179, 544–552. [Google Scholar] [CrossRef]
  48. Guide, A. Environmental Design; CIBSE: London, UK, 2006. [Google Scholar]
  49. American Society of Heating, Refrigerating & Air-Conditioning Engineers. Standard 55: Thermal Environmental Conditions for Human Occupancy; ASHRAE: Atlanta, GA, USA, 2010. [Google Scholar]
  50. European Committee for Standardization. Indoor Environmental Input Parameters for Design and Assessment of Energy Performance of Buildings-Addressing Indoor Air Quality, Thermal Environment, Lighting and Acoustics; European Committee for Standardization: Brussels, Belgium, 2007. [Google Scholar]
  51. De Dear, R.J.; Brager, G.S. Thermal comfort in naturally ventilated buildings: Revisions to ASHRAE Standard 55. Energy Build. 2002, 34, 549–561. [Google Scholar] [CrossRef] [Green Version]
  52. Mocanu, E.E.; Nguyen, P.H.; Gibescu, M.; Kling, W.W. Deep learning for estimating building energy consumption. Sustain. Energy Grids Netw. 2016, 6, 91–99. [Google Scholar] [CrossRef]
  53. Jordan, M.I.; Mitchell, T.M. Machine learning: Trends, perspectives, and prospects. Science 2015, 349, 255–260. [Google Scholar] [CrossRef] [PubMed]
  54. Feeney, S.R.; Kolb, T.E.; Covington, W.W.; Wagner, M.R. Influence of thinning and burning restoration treatments on presettlement ponderosa pines at the Gus Pearson Natural Area. Can. J. Forest Res. 1998, 28, 1295–1306. [Google Scholar] [CrossRef]
  55. Benesty, J.; Chen, J.; Huang, Y.; Cohen, I. Pearson correlation coefficient. In Noise Reduction in Speech Processing; Springer: Berlin/Heidelberg, Germany, 2009; pp. 1–4. [Google Scholar]
  56. Auld, J.R.; Agrawal, A.A.; Relyea, R.A. Measuring the cost of plasticity: Avoid multi-collinearity. Proc. R. Soc. B Biol. Sci. 2011, 278, 2726–2727. [Google Scholar] [CrossRef]
  57. Song, Y.; Wang, F.; Yi, L. The fault diagnosis research based on SOM-BP composite neural network learning algorithm. In Proceedings of the 2012 International Conference on Control Engineering and Communication Technology, Shenyang, China, 7–9 December 2012; pp. 535–539. [Google Scholar]
  58. Kumar, J.; Goomer, R.; Singh, A.K. Long Short Term Memory Recurrent Neural Network (LSTM-RNN) Based Workload Forecasting Model For Cloud Datacenters. Procedia Comput. Sci. 2018, 125, 676–682. [Google Scholar] [CrossRef]
  59. Karsoliya, S. Approximating number of hidden layer neurons in multiple hidden layer BPNN architecture. Int. J. Eng. Trends Technol. 2012, 3, 714–717. [Google Scholar]
  60. Chai, T.; Draxler, R.R. Root mean square error (RMSE) or mean absolute error (MAE)?—Arguments against avoiding RMSE in the literature. Geosci. Model Dev. 2014, 7, 1247–1250. [Google Scholar] [CrossRef] [Green Version]
  61. Park, H.; Stefanski, L. Relative-error prediction. Stat. Probab. Lett. 1998, 40, 227–236. [Google Scholar] [CrossRef]
  62. Cameron, A.C.; Windmeijer, F.A. An R-squared measure of goodness of fit for some common nonlinear regression models. J. Econ. 1997, 77, 329–342. [Google Scholar] [CrossRef]
Figure 1. Temperature, humidity, CO2 measurement location.
Sustainability 12 08974 g001
Figure 2. Distribution of raw data after normalization.
Sustainability 12 08974 g002
Figure 3. Occurrence of overheating in the analyzed ZEB in Korea.
Sustainability 12 08974 g003
Figure 4. Structure of the simple model.
Sustainability 12 08974 g004
Figure 5. Long short-term memory (LSTM) schematic diagram.
Sustainability 12 08974 g005
Figure 6. Prediction model process.
Sustainability 12 08974 g006
Figure 7. Comparison of the performance of the prediction models (a) Indoor temperature prediction result; (b) CO2 density prediction result.
Sustainability 12 08974 g007
Figure 8. Comparison of the prediction accuracy by different simple models (a) Indoor temperature prediction accuracy; (b) CO2 density prediction accuracy.
Sustainability 12 08974 g008
Figure 9. Overheating frequency.
Sustainability 12 08974 g009
Figure 10. Overheating risk under different conditions.
Sustainability 12 08974 g010
Table 1. Zero Energy Building (ZEB) certification criteria.
ZEB LevelLevel 1Level 2Level 3Level 4Level 5
Energy self-sufficiency rate100% or more80% to 100%60% to 80%40% to 60%20% to 40%
Table 2. Analyzed building specifications.
Item Information
Building informationLocationAsan, Korea
Building typePublic library building
Number of floors5 floors above ground and 1 floor underground
Total building area9037.21 m2
SystemsHeat source: geothermal heat pump, auxiliary boiler, thermal storage system
Heating, ventilation, and air conditioning (HVAC): fan coil unit with energy recovery ventilator (ERV) systems
Cooling load645 kW
Building envelope informationHeat transfer coefficient (U-value)Wall-Construction 1: 0.15 W/m2·K, Construction 2:0.242 W/m2·K, Construction 3:0.243 W/m2·K
Roof: 0.130 W/m2·K
Floor: 0.243 W/m2·K
Windows: 0.889 W/m2·K
Doors: 1.279 W/m2·K
Analyzed spaceLocation2nd floor
FunctionIndividual study room
DimensionFloor area: 170 m2, height: 2.7 m,
window area: 22 m2, gross wall area: 55 m2 (WWR: 0.4)
Window orientationSouth
HVAC scheduleCooling: 9:00–22:00, set-point temperature: 25 °C
Ventilation: 9:00–22:00
Measurement periods10 July 2019~24 July 2019 (2 weeks)
Table 3. Measurements and instrument specifications.
MeasurementInstrumentSpecificationsUnit
Outdoor ambient parametersTemperatureWeather stationRange: −40–65° C, Accuracy: ±0.5 °C, Resolution: 0.1 °C°C
Relative humidityRange: 0–100% RH, Accuracy: ±5% RH, Resolution: 1% RH%
Solar irradiationRange: 0–1800 W/m2, Accuracy: ±5% of full scale, Resolution: 1 W/m2kW/m2
Wind velocityRange: 1–54 m/s, Accuracy: ±5% of reading, Resolution: 0.1 m/s.m/s
Indoor environmental parametersCO2 densityTR-76UiRange: 0–9999 ppm, Accuracy: +5% of readingppm
TemperatureRange: 0–55 °C, Accuracy: ±0.5 °C, Resolution: 0.1 °C°C
Relative humidityRange: 10–95% RH, Accuracy: +5% of reading, Resolution: 1% RH%
Operating parametersReturn water temperatureBuilding Energy Management System (BEMS) °C
Flow rate m3/hr
Pump power kWh
Table 4. Correlation with indoor temperature.
Rank1234567
FactorReturn TempIndoor RHSolar radiationFlowrateOutdoor temp.Pump powerOutdoor RH
Unit°C%kW/m2m3/h°CkWh%
Correlation0.820.790.49−0.34−0.29−0.28−0.26
Table 5. Correlation with CO2 density.
Rank12345678
FactorIndoor temperatureReturn TempIndoor RHSolar irradiationFlowrateOutdoor temp.Pump powerOutdoor RH
Unit°C°C%kW/m2m3/h°CkWh%
Correlation0.560.490.470.41−0.370.35−0.27−0.24
Table 6. Evaluation results of the time series prediction models.
MSERMSER2
Indoor temperatureLSTM0.850.720.60
SOM-RBF0.170.030.99
SOM-BPNN1.893.590.61
SOM-LSTM0.130.020.99
CO2 densityLSTM155.2312.460.55
SOM-RBF54.007.350.98
SOM-BPNN215.1614.670.56
SOM-LSTM24.344.930.99
Table 7. Overheating assessment during the period from May to October in the Korean ZEB according to prediction model.
MayJuneJulyAugustSeptemberOctober
Overheating frequency33%36%64%62%33%10%
Table 8. Contribution rate of the influencing factor to overheating in cooling season (June to September).
Rank1st2nd3rd4th5th
Influencing factorCO2 density (occupancy rate)Solar insolationToutRHoutVwind
Contribution rate60.00%43.97%38.65%34.67%25.61%
Table 9. Contribution rate of the influencing factor to overheating in intermediate season (May and October).
Rank1st2nd3rd4th5th
Influencing factorSolar insolationCO2 density (occupancy rate)ToutRHoutVwind
Contribution rate26.25%22.17%21.80%19.72%14.58%
Table 10. Overheating frequency according to conditions.
Condition.Solar InsolationOccupancy LevelOutdoor RHOverheating Frequency
Condition 1lowhigh-24%
Condition 2highlow-26%
Condition 3high-high8%
-: No specific range of values are selected.
Publisher’s Note: MDPI stays neutral with regard to jurisdictional claims in published maps and institutional affiliations.

