Article

Novel Sources of Variation in Grain Yield, Components and Mineral Traits Identified in Wheat Amphidiploids Derived from Thinopyrum bessarabicum (Savul. & Rayss) Á. Löve (Poaceae) under Saline Soils in India

1
School of Biosciences, University of Nottingham, Sutton Bonington Campus, Loughborough LE12 5RD, UK
2
Indian Institute of Wheat & Barley Research, Aggarsain Marg, Gahoon Vihar, Karnal, Haryana 132001, India
*
Author to whom correspondence should be addressed.
Sustainability 2020, 12(21), 8975; https://doi.org/10.3390/su12218975
Submission received: 25 August 2020 / Revised: 24 October 2020 / Accepted: 25 October 2020 / Published: 29 October 2020
(This article belongs to the Section Sustainable Agriculture)

Abstract

:
Salt-affected soils constrain wheat production globally. A wild wheat species, Thinopyrum bessarabicum (Savul. & Rayss) Á. Löve (Poaceae), and its derivatives are tolerant of high external NaCl concentrations but have not been tested yet in field conditions. The aim of this study was to study the performance of amphidiploids derived from T. bessarabicum for grain yield (GYD), yield components and grain mineral composition traits under normal and saline soil conditions. Field experiments were conducted at Karnal (pH(water) = 7.3) and Hisar (pH(water) = 8.3) sites in 2014–2015 and 2015–2016 in India. Grain samples were analysed using inductively coupled plasma–mass spectrometry (ICP-MS). Yield and yield component traits of amphidiploids were typically greater at Karnal than Hisar. The GYD was greater at Karnal (1.6 t ha−1) than Hisar (1.2 t ha−1) in 2014–2015. However, GYD was greater at Hisar (1.7 t ha−1) than Karnal (1.1 t ha−1) in 2015–2016. Mean grain zinc (Zn) concentration of eight amphidiploids, averaged across sites and years, varied from 36 to 43 mg kg−1. Some amphidiploids derived from T. bessarabicum showed greater GYD and grain Zn concentration under saline soils (Hisar) than normal soils (Karnal). These might be potential new sources for the development of salt-tolerant wheat varieties with increased grain Zn concentration under salt-affected soils.

1. Introduction

Wheat is an important cereal crop, providing ~21% of the total calories and protein intake in the human diet, globally [1]. It also makes a significant contribution to livestock feed, as in 2016–2017, 147 million metric tons of wheat were consumed globally and 5 Mt in India for animal feed [2,3]. In addition, wheat is an important dietary source of zinc (Zn), and approximately 20% people at the global scale are not getting sufficient Zn in their diets, which is linked to diarrhoea, respiratory infections and stunting in children [4,5,6]. Wheat supplies ~50% of daily Zn needs among the Indian population [5].
The Green Revolution increased the wheat production to ensure the food security but overlooked the nutritional value of modern wheat cultivars [7]. More genetic variations for grain yield and quality traits are present in wheat progenitors, non-progenitors and landraces. Chen et al. [8] reported that grain Zn concentration in field-grown modern wheat varieties, at a global scale, varied from 20 to 31 mg kg−1. The grain Zn concentration of 518 accessions of wild emmer wheat (Triticum turgidum subsp. Dicoccoides (Körn. ex Aschers. & Graebn.) Thell) ranged from 30 to 98 mg kg−1 under field conditions [9]. Similarly, Triticum boeoticum Boiss (Am), Triticum araraticum Jakubz (AG), Aegilops longissima (Schweinf. & Muschl.) Á. Löve (S), Aegilops peregrine (Hack. in J. Fraser) Marie & Weiller (US), Aegilops cylindrica Host (CD) and Aegilops geniculata Roth (MU) have all been shown to have twice the grain Zn concentrations than the modern wheat cultivars under field conditions [10]. In addition to wild wheat species, durum wheat landraces have shown greater thousand kernel weight, grain yield, protein content [11,12] and better malting quality than the modern wheat cultivars [13] under field conditions.
Salt-affected soils constrain wheat production in many countries. It is estimated that more than 831 million hectares (Mha) are salt affected globally, with 10 Mha of cultivated land lost annually [14,15]. In India, ~7 Mha are affected by salt across 15 out of 29 states [16,17]. Salinity adversely affects wheat grain yield (Khokhar et al. 2017, Rahnama et al. 2011) [18,19] and grain quality traits, e.g., grain zinc (Zn) concentration [20]. Some variation for salt tolerance in 36 modern Indian wheat genotypes have been reported under saline soils in India [18], but there is a need to develop high salt-tolerant varieties to improve the grain yield and grain quality under saline soils.
A number of wheat wild relatives, for example, Aegilops tauschii Coss. (DD) and Triticum urartu Tumanian ex Gandilyan (AA), and their derivatives have shown salinity tolerance when grown in saline hydroponic solutions [21,22,23]. A greater salinity tolerance has been reported in Thinopyrum bessarabicum (Savul. & Rayss) Á. Löve (Poaceae) from the tertiary gene pool (i.e., species that do not share any genomes with bread wheat). T. bessarabicum (2n = 14; JJ) is a tall wheat grass which grows in coastal areas of Crimea, and shows a greater level of salt tolerance than wheat when grown under high saline hydroponic culture [24,25]. The plants of T. bessarabicum have shown salinity tolerance up to 350 mol m−3 NaCl in solution culture when grown for up to 10 months in glasshouse conditions [24] and this species could potentially be used to develop salt-tolerant genotypes [26,27]. Salinity tolerance in T. bessarabicum plants is thought to be due to the regulation of sodium (Na) and chloride (Cl) ions to maintain adequate potassium (K) ion concentration in plant leaves, and the synthesis of glycine betaine which confers the salt tolerance [24,28]. T. bessarabicum has received attention due to its ability to recombine with wheat lacking chromosome 5B. The progeny of a cross between wheat and T. bessarabicum were found to be salt tolerant when grown in different levels of salt solutions until maturity [29,30]. Octaploid amphidiploids (AABBDDJJ) developed by crossing T. bessarabicum (JJ) and Chinese Spring wheat (AABBDD) showed better vegetative growth when grown in 150 mM NaCl nutrient solution than the wheat parent. They also showed less reduction in grain yield, a better exclusion capacity of Na+ ions from leaves (40% less) and more accumulation of glycine betaine (five-fold greater) than Chinese Spring [24,25]. Similarly, hexaploid amphidiploids (AABBJJ) developed by crossing of T. bessarabicum with durum wheat cultivars (AABB) showed greater salt tolerance and increased fertility than octaploid amphidiploids when grown at different levels of salt (NaCl) concentrations in hydroculture until maturity (King et al. 1997) [26].
The grain mineral composition of T. bessarabicum derivatives has not been studied except by Ardalani et al. [31], who studied grain Zn and Fe concentrations. There is a deficiency of Zn and Fe in the global food system, affecting human health, particularly in developing countries [6,32,33,34]. Ardalani et al. [31] screened amphidiploid and translocation lines derived from T. bessarabicum under normal soil field conditions in Kurdistan and reported greater grain Zn and Fe concentrations in the T. bessarabicum derivatives than in wheat cultivars. However, derivatives of Thinopyrum elongatum (Host) (2n = 2x = 14; EE), a close relative of T. bessarabicum, have also shown greater grain concentrations of calcium (Ca), copper (Cu), iron (Fe), magnesium (Mg), manganese (Mn), phosphorus (P) and zinc (Zn) than wheat cultivars under rainfed field experiments at Washington State University [35].
The aim of this study was to evaluate the performance of eight amphidiploids derived from T. bessarabicum for grain yield, yield components and grain mineral composition traits under normal and saline soil conditions in India.

2. Materials and Methods

2.1. Field Locations

Field experiments were conducted at two sites in the North Western Plains Zone (NWPZ) of India, during the rabi (winter) seasons in 2014–2015 and 2015–2016 (Table 1). The sites were (1) the Indian Institute of Wheat & Barley Research (IIWBR), Karnal, Haryana, which represents a “normal soil” of pH(Water) 7.3 and (2) IIWBR, Hisar, Haryana, which represents a “saline soil” of pH(Water) 8.3. Further soil characteristics of these sites are described in Table S1.

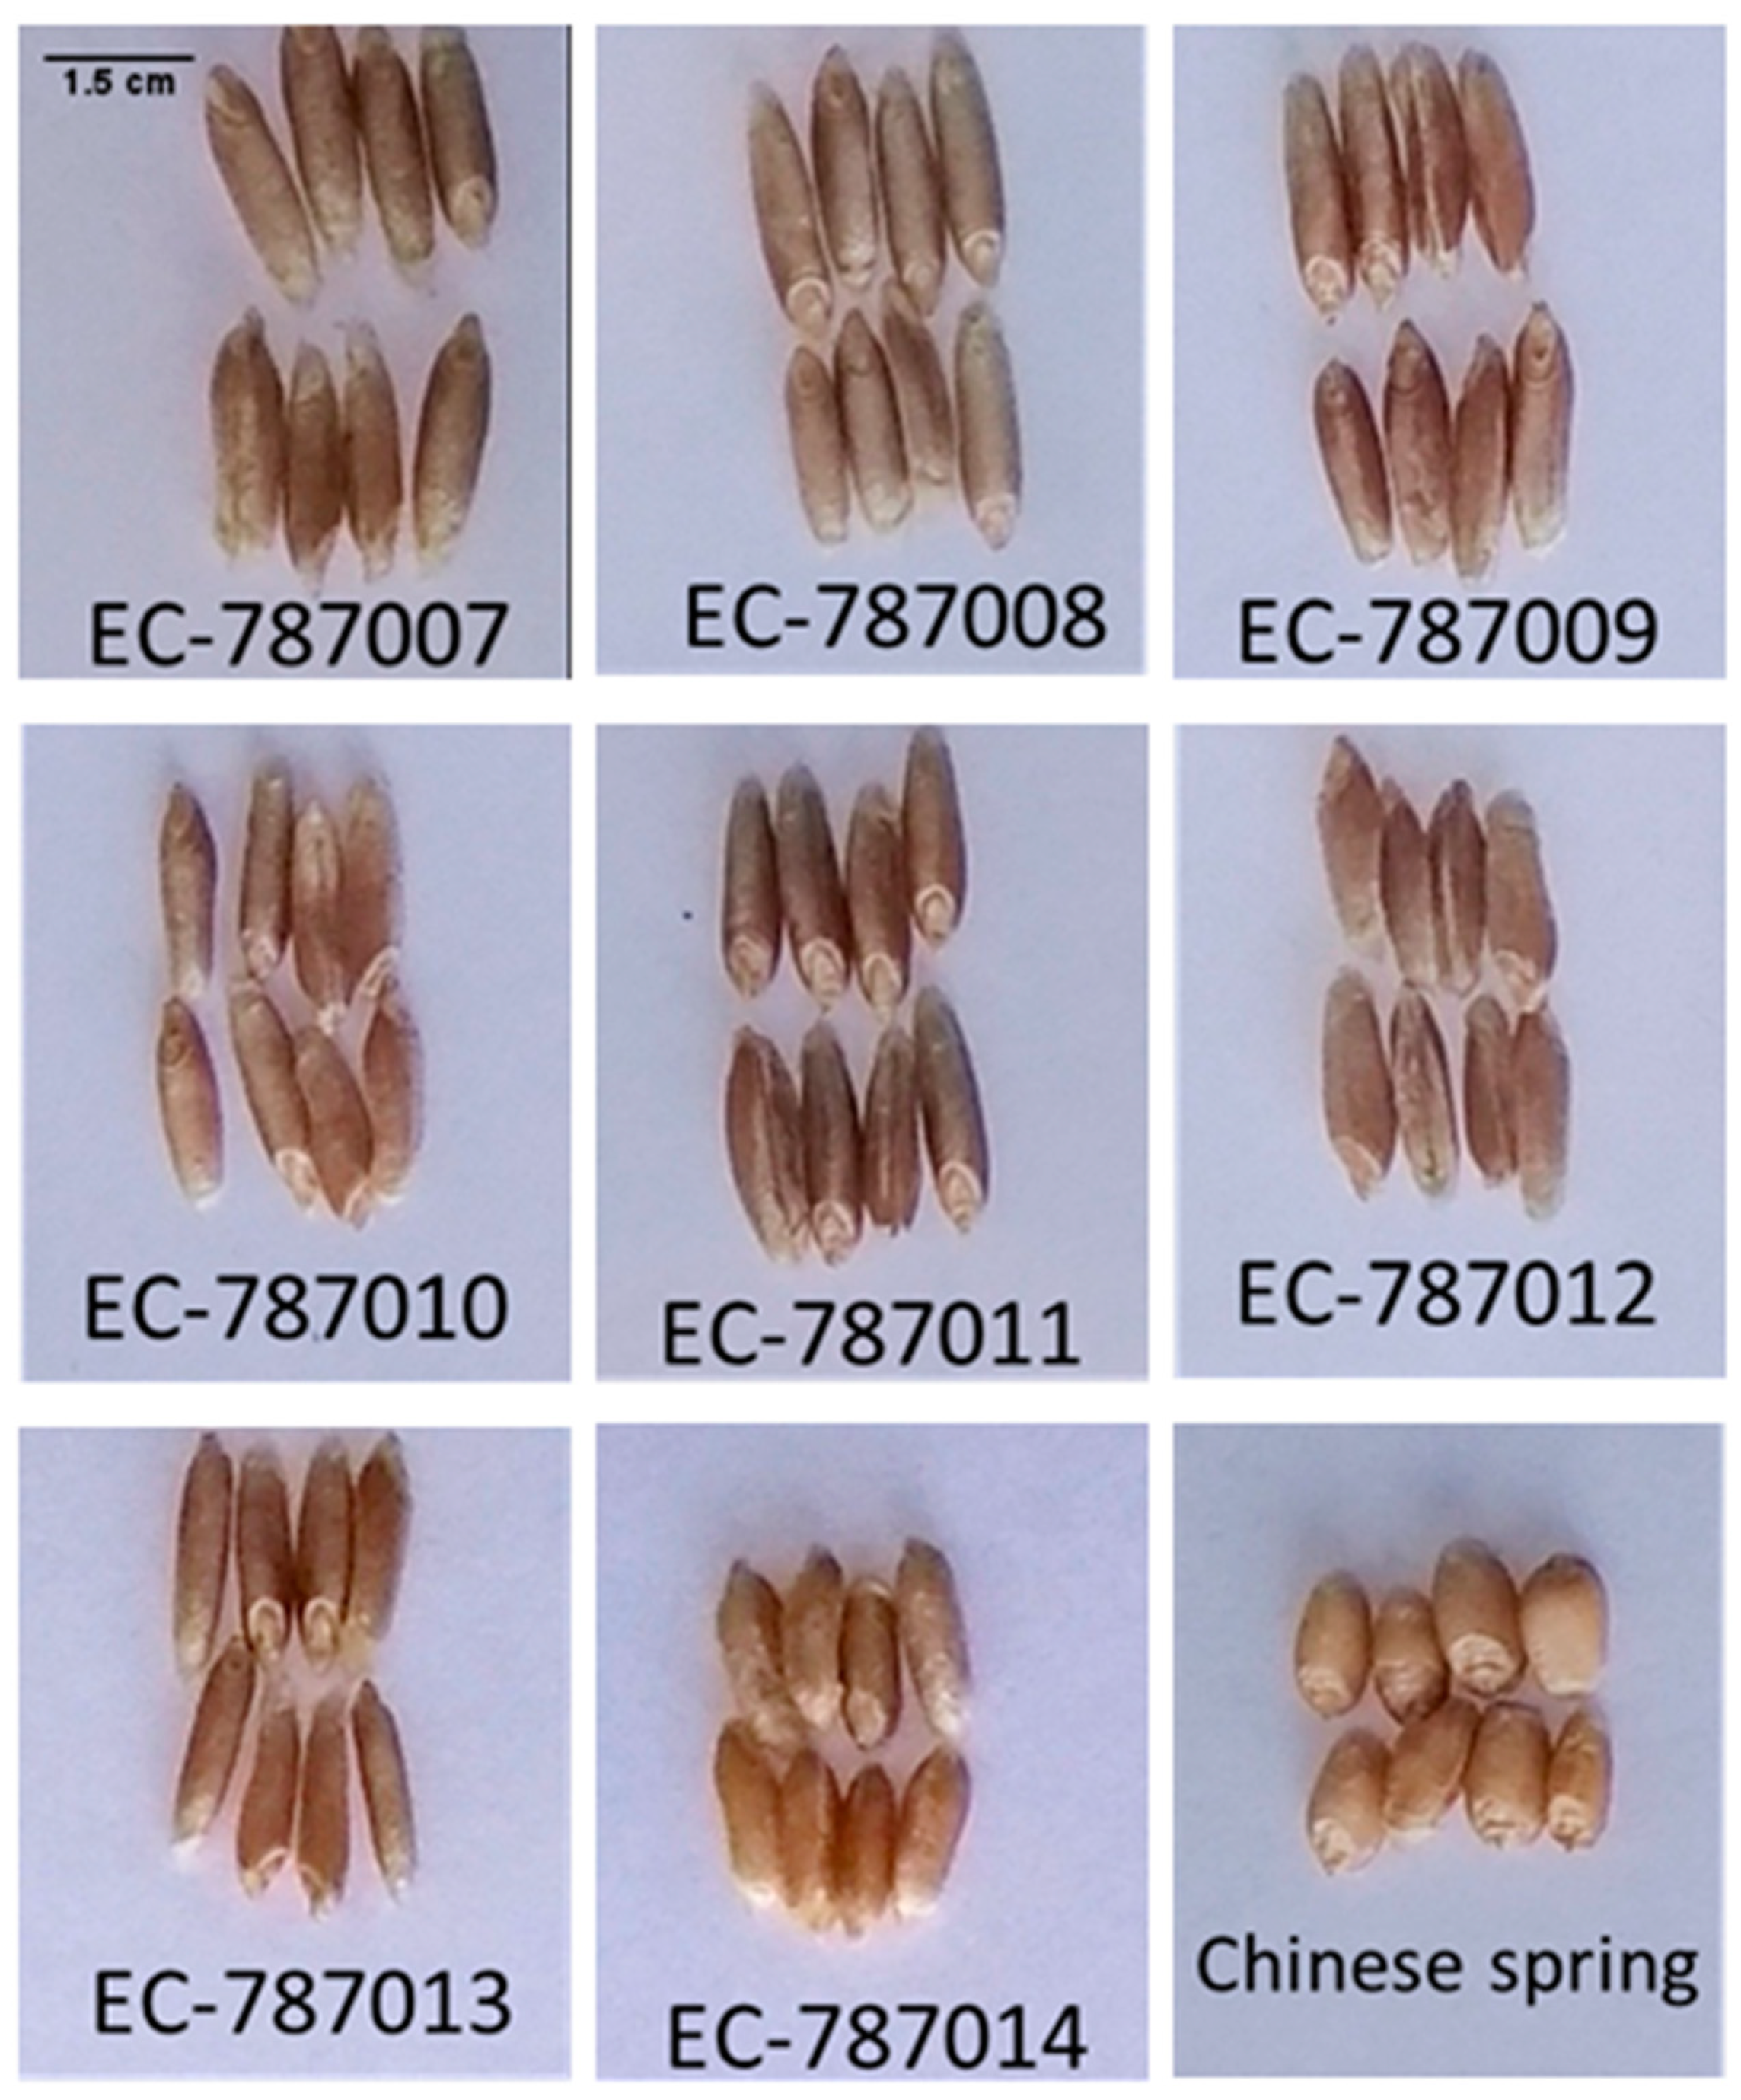
2.2. Planting Material

Grains of eight amphidiploids were provided by the Nottingham/BBSRC Wheat Research Centre (WRC). The amphidiploids were developed by crossing the same accession of T. bessarabicum, as the male parent, with different durum (AABB) and bread (AABBDD) wheat cultivars (Table 2). The resulting F1 hybrids were converted into fertile lines by doubling the chromosome number. The F1 hybrid plants were vernalised at 6 °C for 8 weeks. After vernalisation, the plants were grown on to the four-tiller stage. The roots and bases of the tillers were then dipped in a colchicine solution with 0.1% (w/v) colchicine, 2% (v/v) dimethyl sulfoxide and 0.05% (v/v) Tween 20 [36], covered with a clean plastic bag and left overnight (16 h) at room temperature. After treatment, the plant roots were washed, the plants re-potted (2 L pots; John Innes No. 2) and grown in a glasshouse. Before anthesis, plants were covered with perforated poly bags to avoid any cross-pollination and at maturity seeds were threshed manually. A cytological study of all the amphidiploids was carried out using multi-colour genomic in situ hybridisation (Mc-GISH). Genomic in situ hybridisation images of each amphidiploid are shown in Figure S1. The procedure followed for GISH was as described in Grewal et al. [37]. Four Indian cultivars, included three bread wheat cultivars (HD 2967; KRL 210; MACS 6222) and one durum wheat cultivar (HI 8498), and four cultivars collected from the WRC, UK (Paragon; Pavon 76; Highbury and Chinese Spring) were grown as checks at both the sites in 2014–2015 and 2015–2016, respectively. However, data from these checks have not been used in the analysis. Due to supplementary light, all the check cultivars matured earlier than amphidiploids and showed extreme values for all the GYD and component traits as compared to amphidiploid traits.

2.3. Experimental Managements

Field experiments were conducted in the rabi (winter) season in 2014–2015 and 2015–2016 at two sites (Table 1). After conventional operations, including field preparation, fertilising, disking, leveling and furrowing, each plot comprised three rows with an inter-row spacing of 25 cm. The plot length was 1.5 m in 2014–2015 and 2.5 m in 2015–2016. The experiment was laid out as a randomised block design with three replications. Fertilisers were applied at a rate of 150 kg N, 60 kg P2O5 and 40 kg K2O ha−1 as urea, triple super phosphate (TSP) and muriate of potash (MOP), respectively. All fertilisers, including one-third of the N, were applied uniformly in the field during final land preparation. One-third of the N was top dressed at the nodal root initiation (NRI) stage, ~21 days after sowing (DAS), and the remaining N was applied at the time of second irrigation, ~45 DAS. Experiments were irrigated when required to avoid water stress to the plants and to bring soil moisture content close to the field capacity during NRI, booting and grain filling stages. Weeds were controlled manually when required and the crops protected from pests and disease as required. Crops were harvested at maturity, sun-dried and then threshed manually (by hand).

2.4. Supplementary Lighting

T. bessarabicum-derived amphidiploids showed both a perennial and a photosensitive nature in the field, hence supplementary lighting was provided to overcome the problem of fertility and flowering. This was provided in the field using 1000 W tungsten halogen tube lamps, to give a photoperiod of 16 h d−1 light at both the Karnal and Hisar sites (Figure S2). Supplementary lighting was provided from 45 DAS, corresponding with the period of late vegetative growth to anthesis. At the onset of maturity, plants in each plot were covered with netting bags of 2 square feet to avoid losses due to the shattering of spikelets (Figure S2).

2.5. Trait Measurements

Grain number per spike (GNS), grain weight per spike (GWS, g) and plant height at maturity (PHT, cm), were recorded on five randomly selected plants per plot, which were also tagged for subsequent measurements at maturity, alongside plot-scale measurements. Data were recorded on the following traits: grain yield per plot at 12–13% dry weight (GYD, g); grains from five spikes were counted and then averaged to measure the GNS; grain from five spikes were weighed and averaged to measure the GWS; 1000 grain weight (TGW, g); productive tillers per meter (PTM); biological yield per plot (BYD, g); harvest index (GYD/BYD*100; HI,%); days to 75% heading (DTH, d); days to anthesis (DTA, d); days to 75% maturity (DTM, d) and plant height was measured from the base of a plant to the tip of a spike of the longest tiller, excluding awn.

2.6. Grain Mineral Concentration

Grain mineral analysis was carried out on grain samples from two replications from the Hisar site in 2014–2015 and from three replications from both the Karnal and Hisar sites in 2015–2016. Details of grain sampling, digestion, data validation and mineral analysis by inductively coupled plasma–mass spectrometry (ICP-MS) are described in Khokhar et al. [34]. Briefly, grain samples were crushed inside a paper bag and subsamples (~0.200 g, DW) were used for microwave digestion. Crushed grain samples were digested in 2 mL 70% trace analysis grade (TAG) HNO3, 1 mL Milli-Q water (18.2 MΩ cm; Fisher Scientific UK Ltd., Loughborough, UK) and 1 mL H2O2 after pre-soaking in the same solution for one hour at room temperature. Two operational blanks, duplicate samples of certified reference material (CRM) of wheat flour (Wheat SRM 1567b, NIST, Gaithersburg, MD, USA) and duplicate laboratory reference material (LRM), Paragon, were used for each digestion run. Following digestion, each tube was made up to a final volume of 15 mL by adding 11 mL Milli-Q water and stored at room temperature. Samples were further diluted 1:5 with Milli-Q water for determination of grain Zn concentration and 30 other elements by ICP-MS (Thermo Fisher Scientific iCAPQ, Thermo Fisher Scientific, Bremen, Germany). In total, 64 grain samples were analysed in two runs, excluding blank, CRM and LRM samples.

2.7. Statistical Analysis

Variance components were calculated for grain yield, yield components, and mineral composition traits. Analysis of variance (ANOVA) was used to test the differences in grain yield, yield components and mean of mineral composition traits due to genotype and site factors, for each site and year. Biological yield per plot at both sites in 2014–2015 was corrected according to plot size at both sites in 2015–2016 before analysis. Means of grain yield, yield components and grain mineral composition traits were compared using least significant difference (LSD) for each site. Differences between sites and genotypes for grain yield were considered significant at p < 0.01. Pearson correlation coefficients were calculated to study the correlation among yield and yield components for each site and between the sites. Correlation coefficients were also measured between yield, yield components and mineral composition traits. Broad-sense heritability (H2) for grain yield, yield components and grain mineral traits was calculated as described in Guo et al. [38]. Data from check cultivars were not included in the final statistical analysis, due to extreme values of traits measured in check cultivars which made them not comparable with amphidiploid data. All data analyses were conducted using GenStat 17th Edition (VSN International Ltd., Hemel Hempstead, UK).

3. Results

Grains of eight amphidiploids were observed visually and it was found that T. bessarabicum x durum wheat-derived amphidiploids, from EC 787007 to EC 787013, had longer and more brownish grains than the T. bessarabicum x Chinese Spring-derived amphidiploid (EC 787014). The grain colour of EC 787014 was similar to the wheat parent, Chinese Spring (Figure 1).

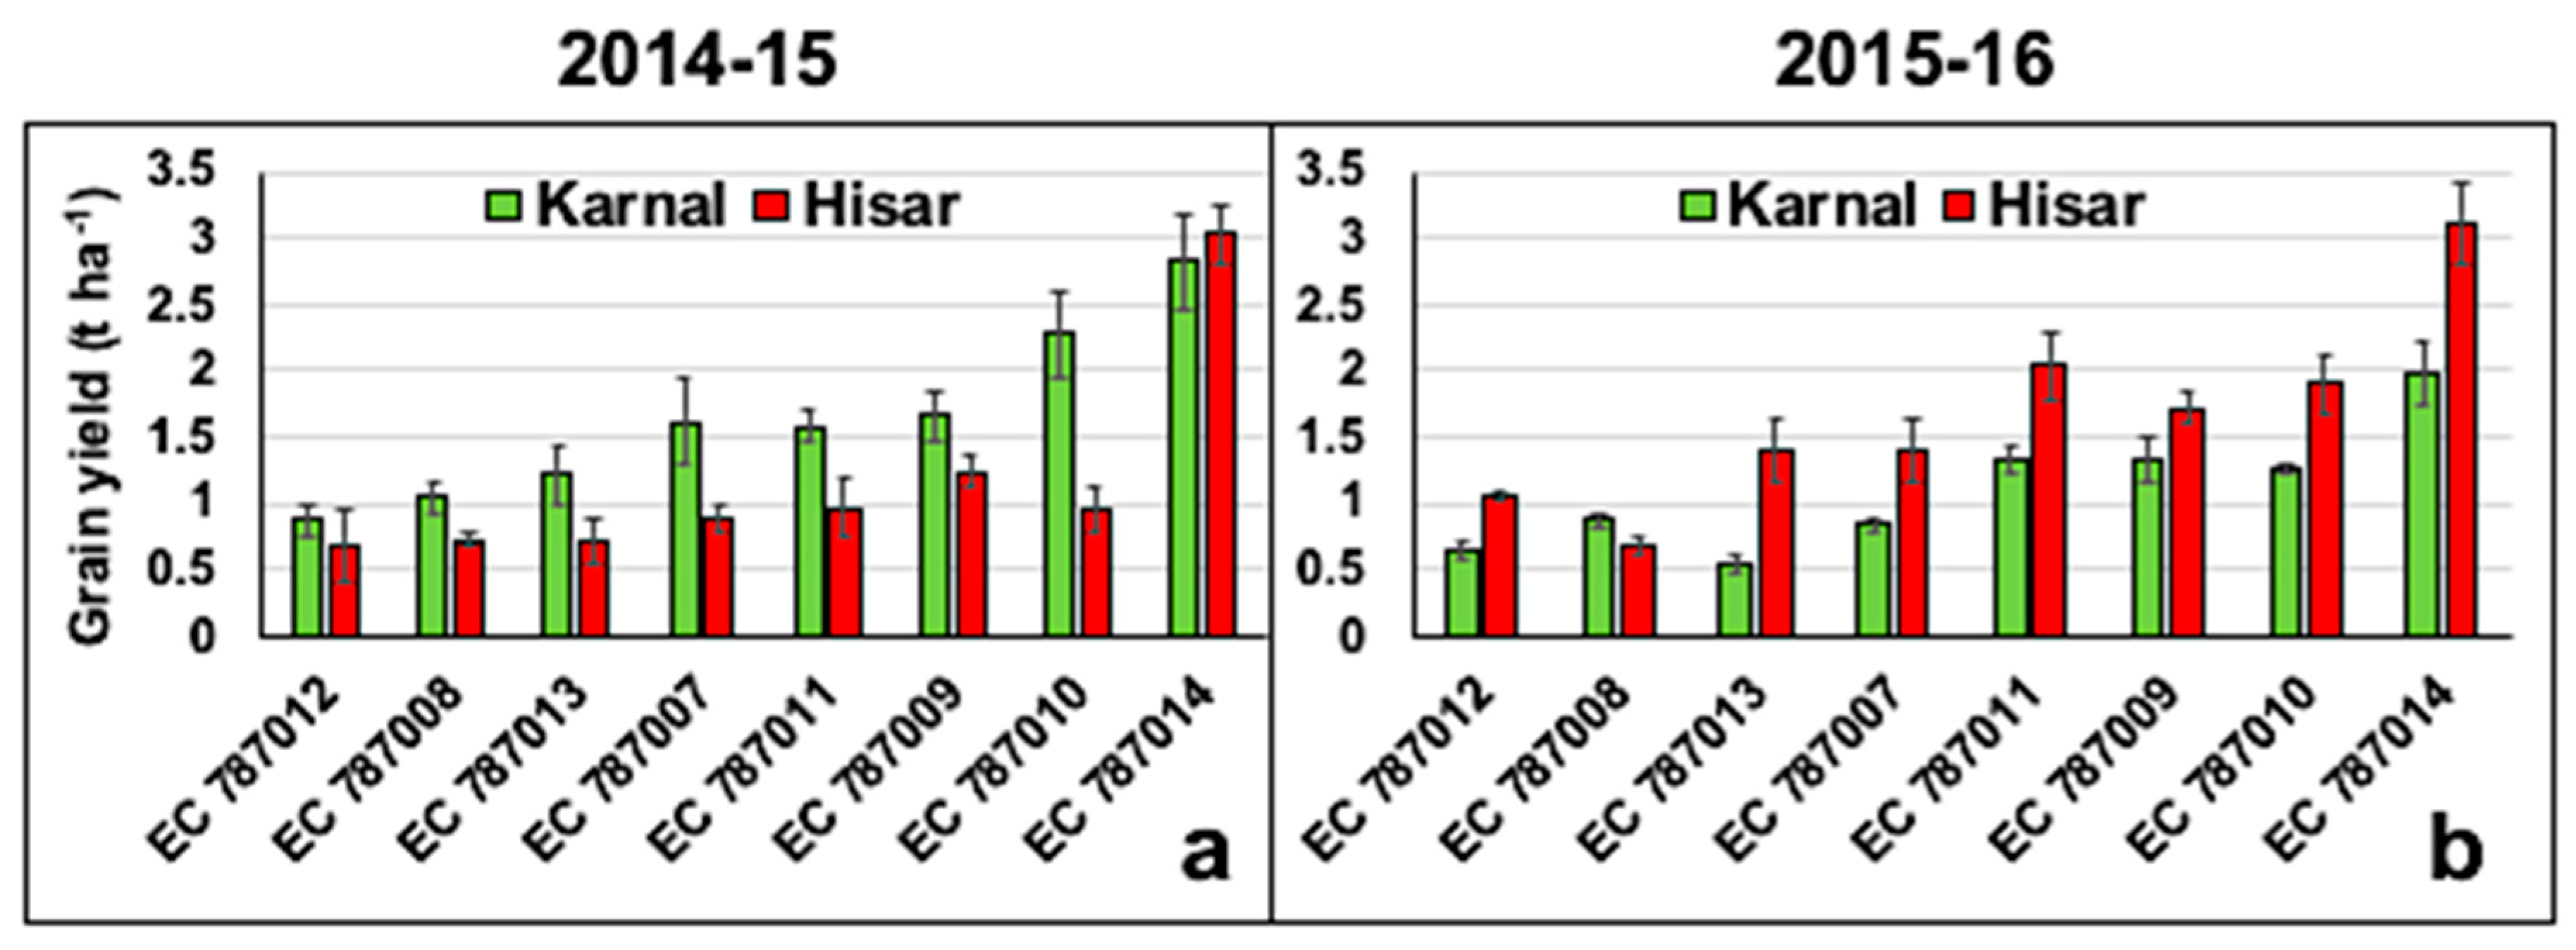
3.1. Differences in Grain Yield of Eight Amphidiploids at Karnal (Normal) and Hisar (Saline) Sites

The GYD differed between amphidiploids in both 2014–2015 and 2015–2016 (p < 0.001). The mean GYD of the eight amphidiploids, averaged across sites, varied from 0.8 to 2.9 t ha−1 in 2014-15 and from 0.8 to 2.5 t ha−1 in 2015-16. EC 787014 had the greatest GYD in both years. EC 787012 and EC 787008 had the least GYD in 2014-15 and 2015–2016, respectively.
There was a positive relationship in GYD between Karnal and Hisar in both 2014–2015 (r = 0.82) and 2015–2016 (r = 0.89). In 2014-15, the mean GYD of the eight amphidiploids varied from 0.9 to 2.8 t ha−1 at Karnal and from 0.7 to 3.0 t ha−1 at Hisar (Figure 2a). In 2015–2016, the mean GYD of the eight amphidiploids varied from 0.6 to 2 t ha−1 at Karnal and from 0.7 to 3.0 t ha−1 at Hisar (Figure 2b).
EC 787014 (Figure S3) had the greatest GYD at Karnal and Hisar in both years (2014–2015—Karnal 2.8 t ha−1; Hisar 3.0 t ha−1: 2015–2016—Karnal 2.0 t ha−1; Hisar 3.1 t ha−1). In 2014–2015, EC 787012 had the smallest GYD at both Karnal (0.9 t ha−1) and Hisar (0.7 t ha−1), while in 2015–2016, EC 787013 (0.6 t ha−1) and EC 787008 (0.7 t ha−1) had the smallest GYD at Karnal and Hisar, respectively.

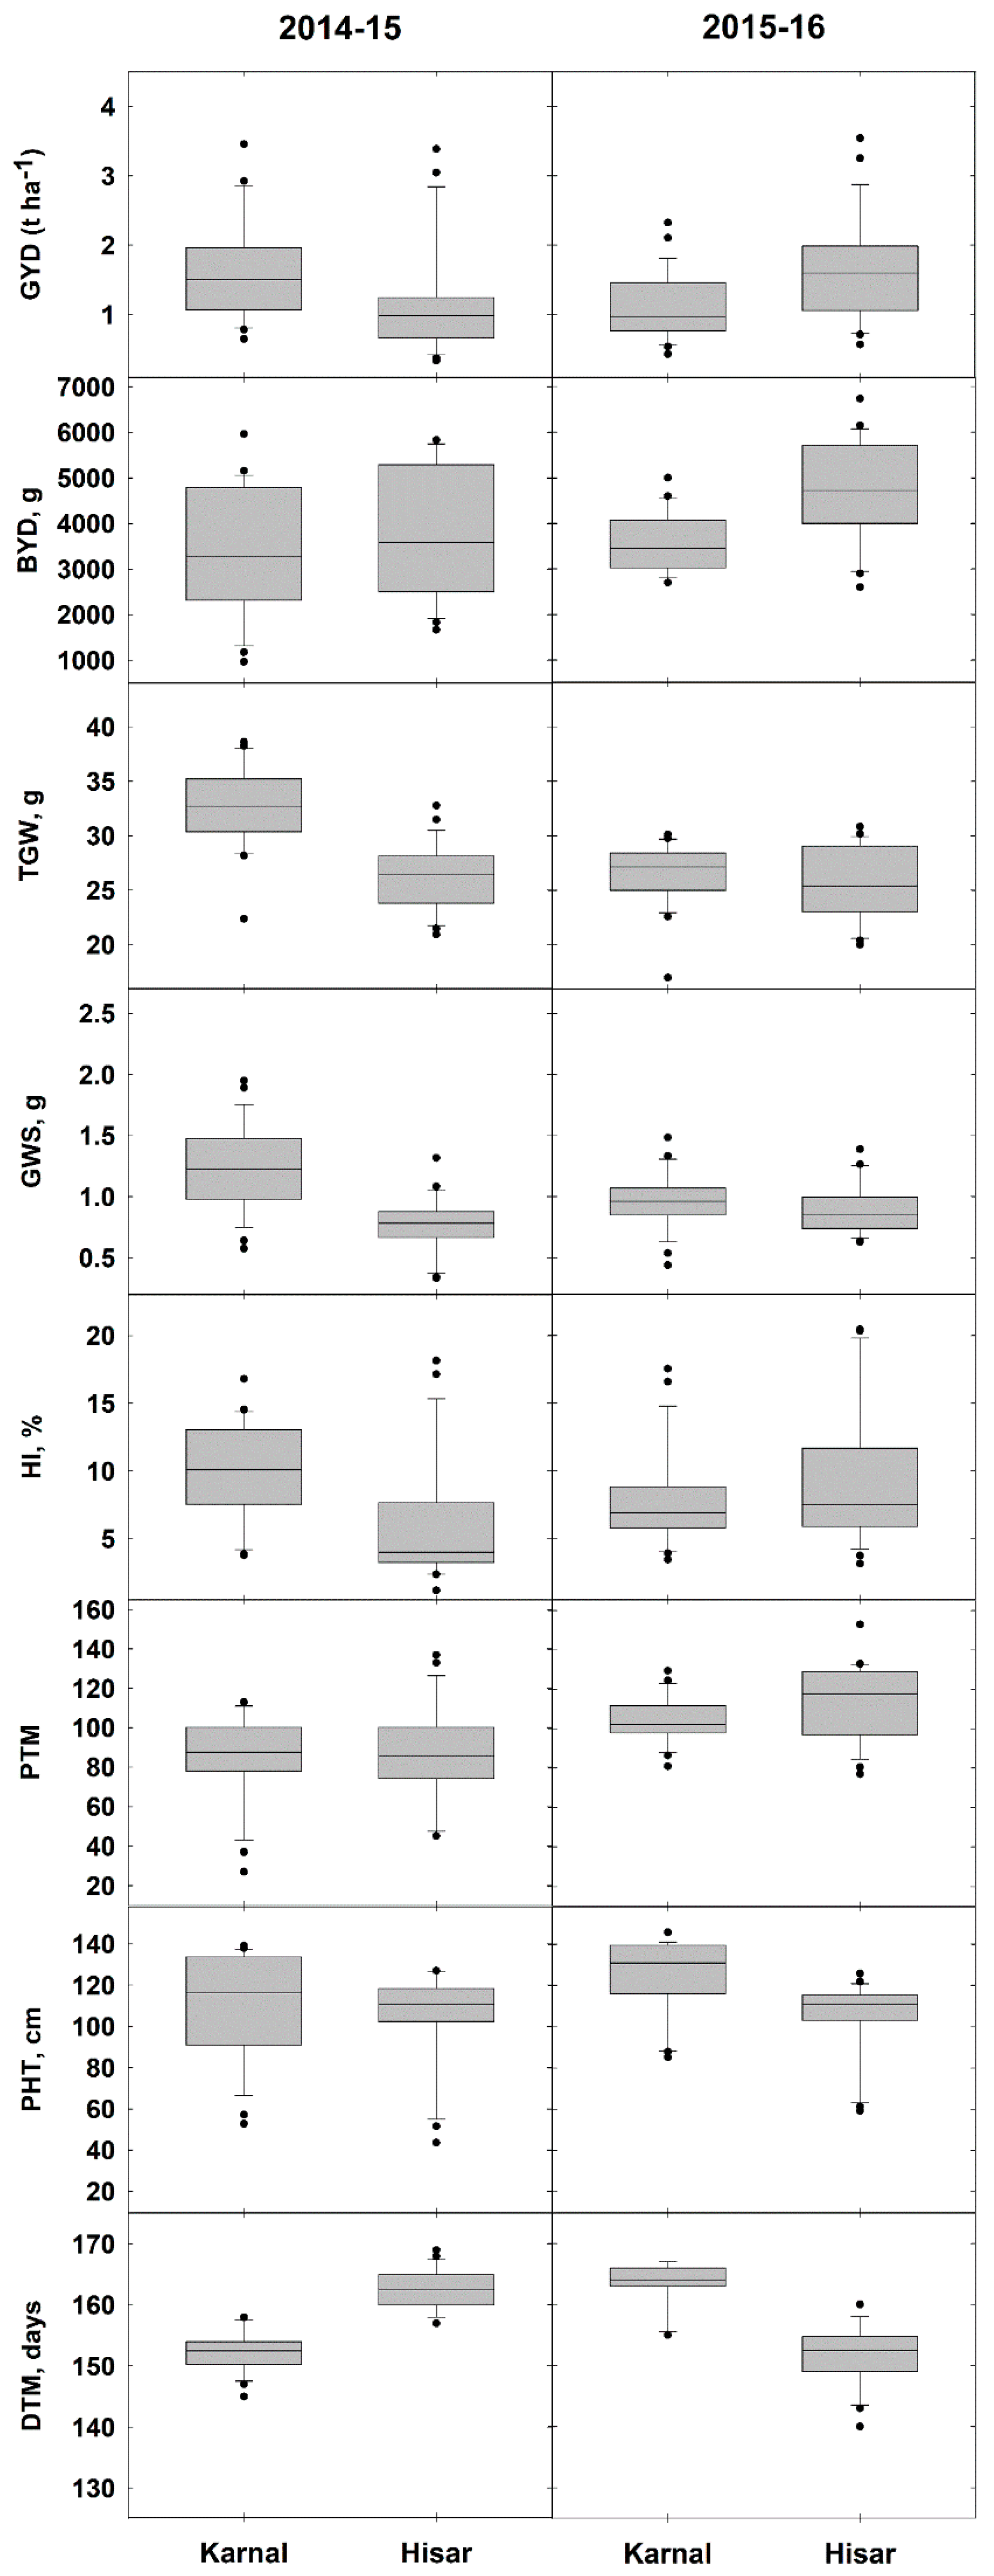
3.2. Differences in Grain Yield and Yield Component Traits between Karnal (Normal) and Hisar (Saline) Sites

Yield and yield component traits were typically greater at Karnal than Hisar (Figure 3). The GYD was greater at Karnal (1.6 t ha−1) than Hisar (1.2 t ha−1) in 2014–2015 (LSD = 0.22), while in 2015–2016, it was greater at Hisar (1.7 t ha−1) than Karnal (1.1 t ha−1) (LSD = 0.17). BYD was greater at Hisar than Karnal in both years. In 2014–2015, BYD was 3354 and 3854 g at Karnal and Hisar, respectively (LSD = 371.2). In 2015-16, BYD was 3566 and 4702 g at Karnal and Hisar, respectively (LSD = 330.7). TGW and GWS did not differ between sites in 2015–2016 but were greater at Karnal in both years. In 2014–2015, TGW was 32.7 and 26.3 g at Karnal and Hisar, respectively (LSD = 1.74). In 2015–2016, TGW was 26.5 and 25.6 g at Karnal and Hisar, respectively (LSD = 1.53). In 2014-15, GWS was 1.2 and 0.8 g at Karnal and Hisar, respectively (LSD = 0.16). In 2015–2016, GWS was 1.0 and 0.9 g at Karnal and Hisar, respectively (LSD = 0.1). The HI differed significantly between sites in both years. In 2014–2015, HI was 10 and 6.4% at Karnal and Hisar, respectively (LSD = 1.0). In 2015–2016, HI was 7.8 and 9.3% at Karnal and Hisar, respectively (LSD = 0.8).
The PTM did not differ between sites in 2014–2015. In 2014–2015, PTM was 85 and 86 at Karnal and Hisar, respectively (LSD = 10.22). In 2015-16, PTM was 104 and 113 at Karnal and Hisar, respectively (LSD = 8). The PHT differed between sites in both years and was greater at Karnal in both years. In 2014–2015, PHT was 109 and 105 cm at Karnal and Hisar, respectively (LSD = 3.35). In 2015–2016, PHT was 125 and 105 at Karnal and Hisar, respectively (LSD = 3.16).
The DTM differed between sites in both years. In 2014–2015, DTM was 152 and 163 days at Karnal and Hisar, respectively (LSD = 1.11), while in 2015–2016, DTM was 164 and 152 days at Karnal and Hisar, respectively (LSD = 0.89) (Figure 3).

3.3. Comparison of Grain Yield Reduction between Karnal (Normal) and Hisar (Saline) Sites, in 36 Indian Wheat Genotypes and Eight Amphidiploids

The amphidiploids showed less reduction in GYD on the saline site than a panel of 36 genotypes in a previous study by Khokhar et al. [18]. The mean GYD of 36 Indian wheat genotypes, averaged across years, showed a 6 to 59% reduction under saline soil (Hisar) compared to normal soil (Karnal) (Table S2). All 36 wheat genotypes showed lower GYD under saline soil (Hisar) than normal soil (Karnal), except KRL 3–4, which showed 92% greater GYD at Hisar (saline) than Karnal (normal) [18]. The mean GYD of the eight amphidiploids, averaged across years, showed a 1 to 26% reduction under saline soil (Hisar) compared with normal soil (Karnal) (Table S3). Out of the eight amphidiploids, four showed 3 to 28% higher GYD under saline soil (Hisar) than normal soil (Karnal).

3.4. Variance Components Associated with Grain Yield and Component Traits

The contribution of Genotype (G), Environment (E) and G*E interactions (G*E) to variation in GYD and yield component traits of eight amphidiploids was determined (Table 3). Genotype was associated with most of the variation in yield and yield component traits in both years (Table 3). For example, 68 and 64% of the variation in GYD was associated with genotype in 2014–2015 and 2015–2016. Genotype was also associated with most of the variation in BYD (78 and 42%) and PHT (88 and 66%) in 2014–2015 and 2015–2016. DTM was associated with E (72 and 68%) to a greater extent than G (15 and 27%) or G*E interaction (3 and 6%) in 2014-15 and 2015–2016. The site had a much greater influence on TGW, GWS and HI in 2014–2015 than in 2015–2016.

3.5. Correlation among Grain Yield and Yield Component Traits at Karnal (Normal) and Hisar (Saline) Sites

At Karnal, there was a significant positive correlation between GYD and TGW (r = 0.49), HI (r = 0.62), GWS (r = 0.48) and a significant negative correlation between GYD and DTM (r = −0.59); GYD did not correlate with BYD, PTM or PHT. At Hisar, there was a significant positive correlation between GYD and GWS (r = 0.59), HI (r = 0.88), PTM (0.31) and a significant negative correlation between GYD and DTM (r = −0.53); GYD did not correlate with BYD, PHT or TGW.

3.6. Variation in Wheat Grain Zn Concentration and the Grain Ionome

The mean grain Zn concentration across all plots and years (n = 64) was 39.7 mg kg−1 and ranged from 21.2 to 58.9 mg kg−1 across all plots (Table 4). Among the macronutrients, the mean grain concentrations of calcium (Ca), potassium (K), magnesium (Mg), phosphorus (P) and sulphur (S) across all plots were 636, 5520, 1650, 5160 and 2180 mg kg−1, respectively. Among micronutrients, the mean grain concentrations of copper (Cu), iron (Fe), manganese (Mn) and molybdenum (Mo) across all plots were 7, 50.1, 47.8 and 1.3 mg kg−1, respectively. Among non-essential trace elements, the mean grain concentrations of arsenic (As), cadmium (Cd) and selenium (Se) were 0.0154, 0.0351 and 0.331 mg kg−1, respectively (Table 4).

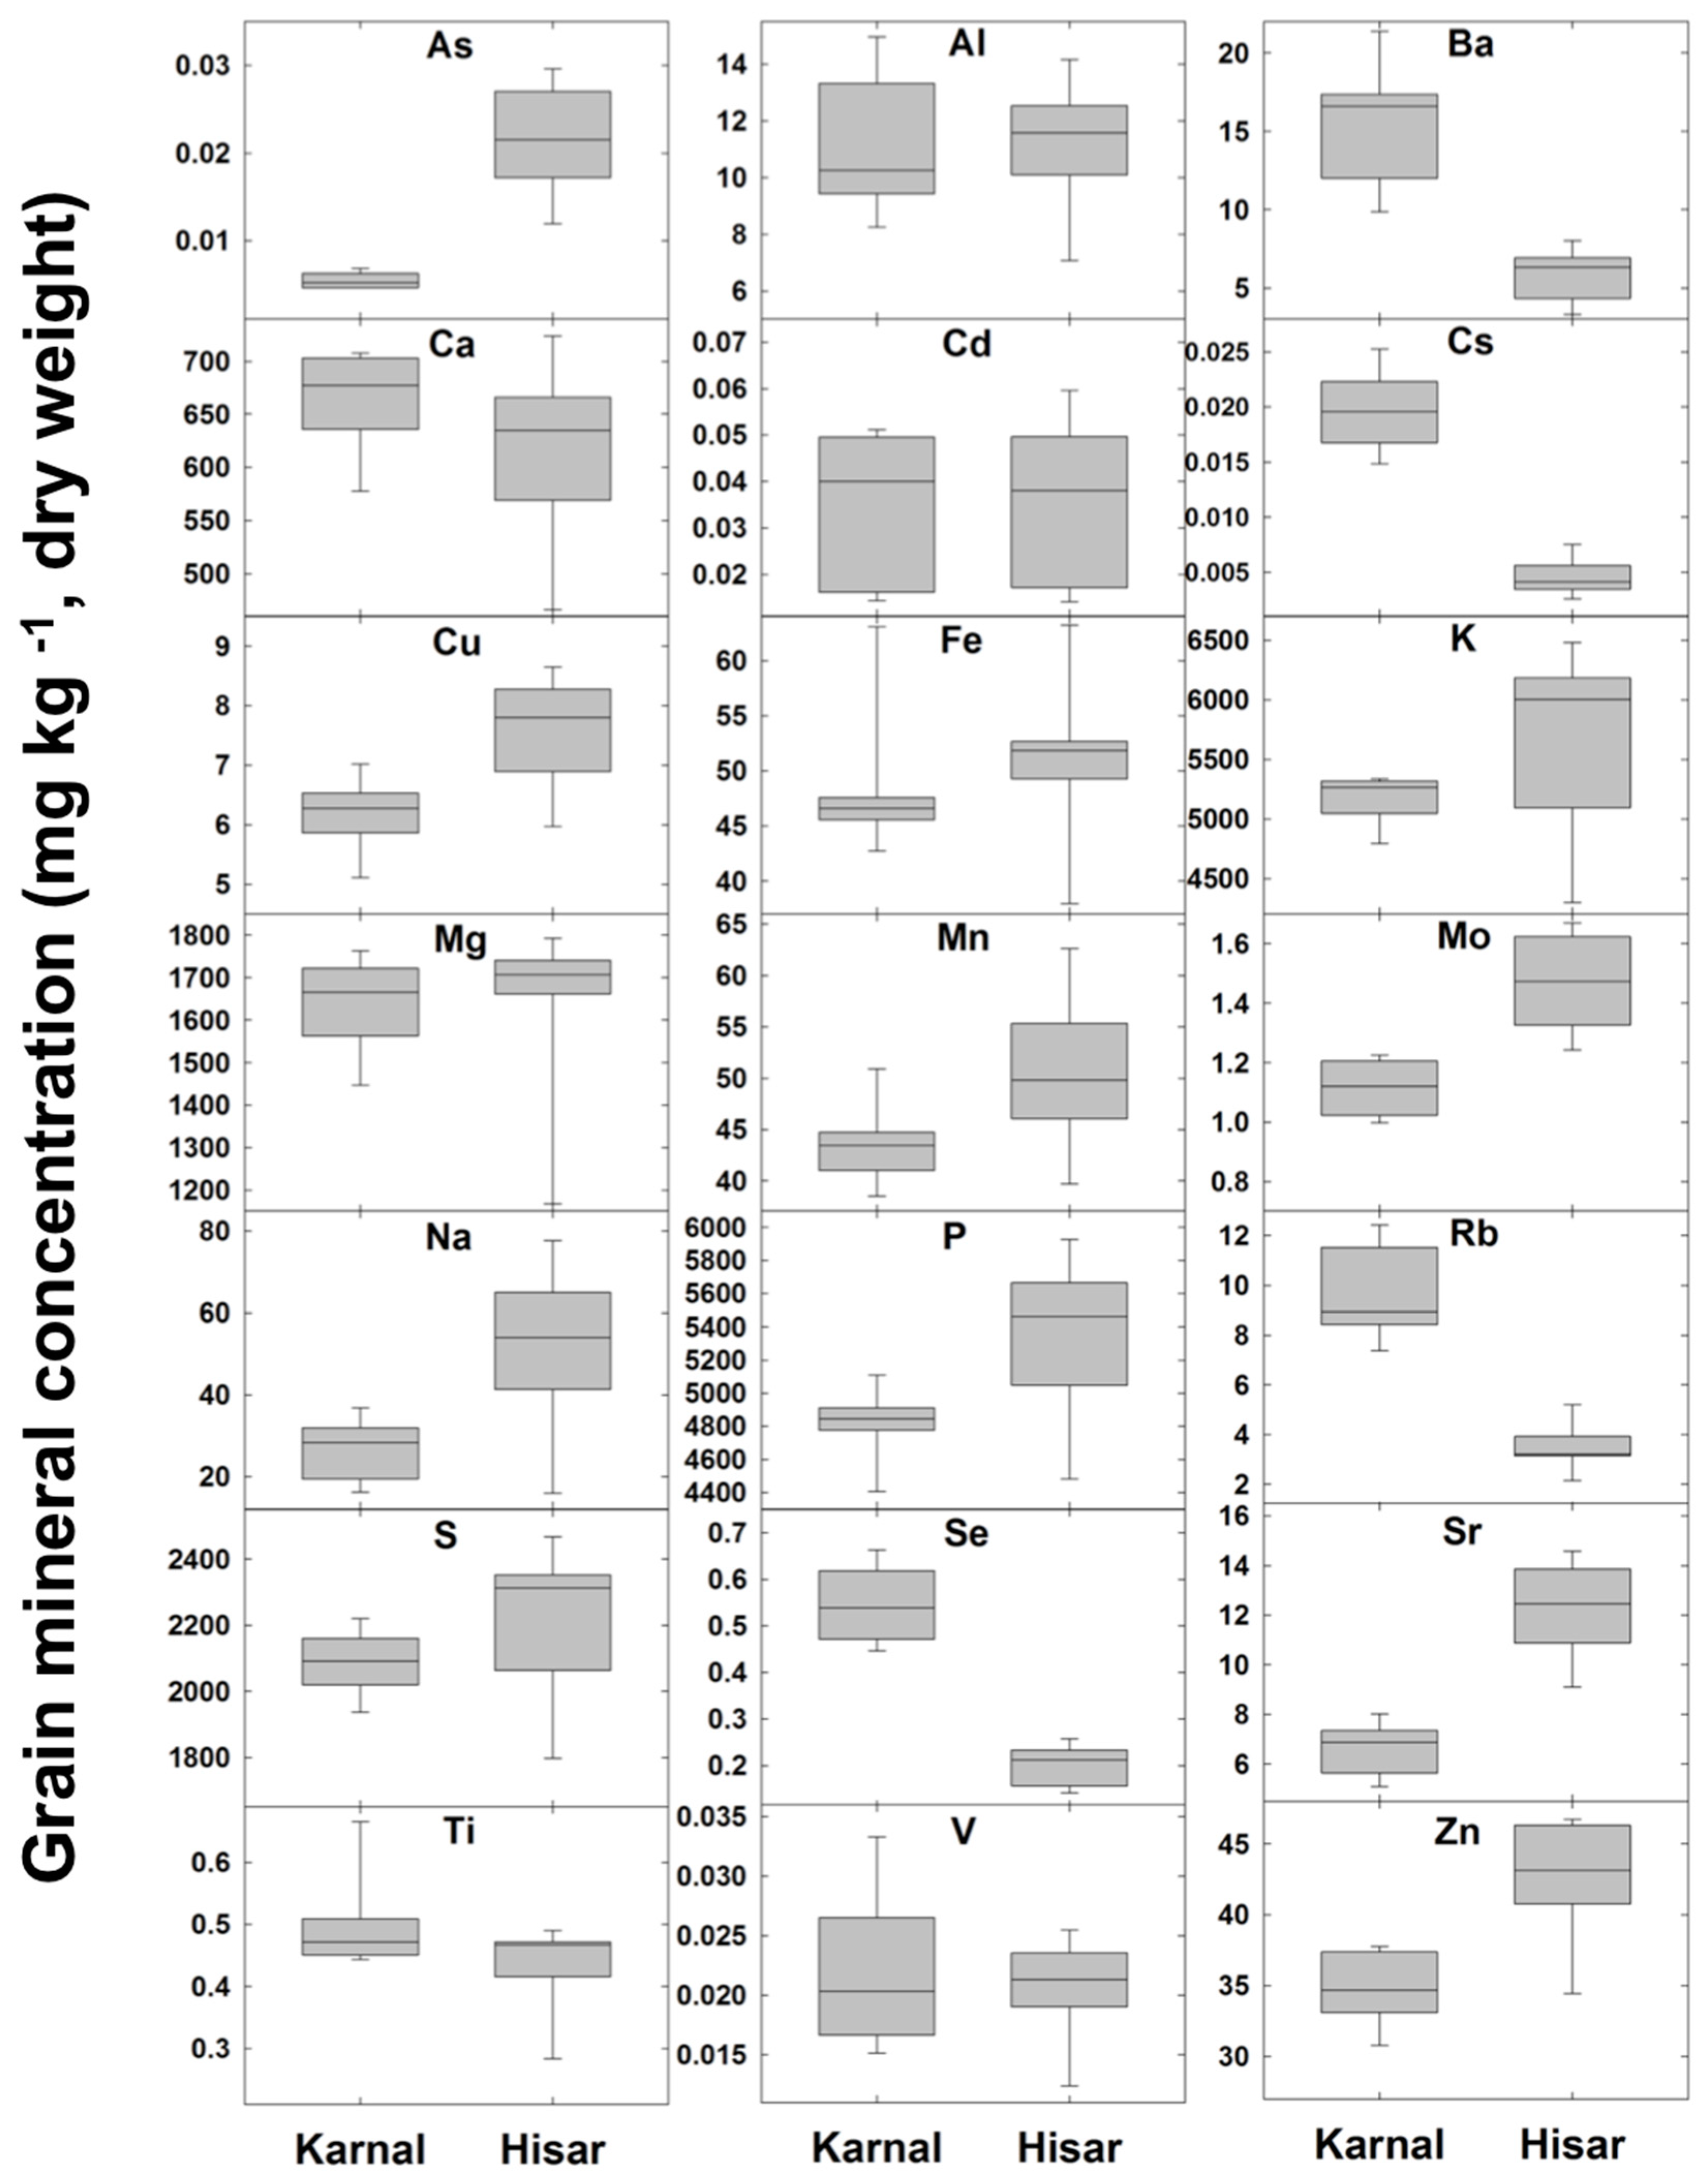
3.7. Differences in Grain Zn Concentration and the Grain Ionome between Karnal (Normal) and Hisar (Saline) Sites

Grain Zn concentration differed between sites (<0.001). The mean grain Zn concentration varied from 34.9 (Karnal) to 42.7 (Hisar) mg kg−1, averaged across eight amphidiploids and both years (LSD = 3.83). Among the macronutrients, grain Ca, K, P and S concentrations differed significantly, except Mg. Mean grain concentrations of Ca, K, Mg, P and S, averaged across eight amphidiploids and years, were 667, 5182, 1641, 4820 and 2091 mg kg−1 at Karnal; 617, 5727, 1650, 5358 and 2229 mg kg−1 at Hisar, respectively (Figure 4). Among the micronutrients, the mean grain Cu, Fe, Mn and Mo concentrations were 6.2, 48.1, 43.5 and 1.1 mg kg−1 at Karnal; 7.5, 51.3, 50.4 and 1.5 mg kg−1 at Hisar, respectively. Among the non-essential trace elements, the mean grain arsenic (As) concentration varied from 0.007 (Karnal) to 0.021 (Hisar) mg kg−1 (LSD = 0.007). The mean grain Se concentration varied from 0.5 (Karnal) to 0.2 (Hisar) mg kg−1 (LSD = 0.07).
Most of the grain mineral composition traits differed between sites (p < 0.01), except grain aluminium (Al), cadmium (Cd), Fe and Mg concentrations. The mean grain concentration of most of the mineral composition traits was greater at Hisar than the Karnal site, except the grain concentrations of Ba, Ca, Cd, Cs, Rb, Se and Tl (Figure 4).

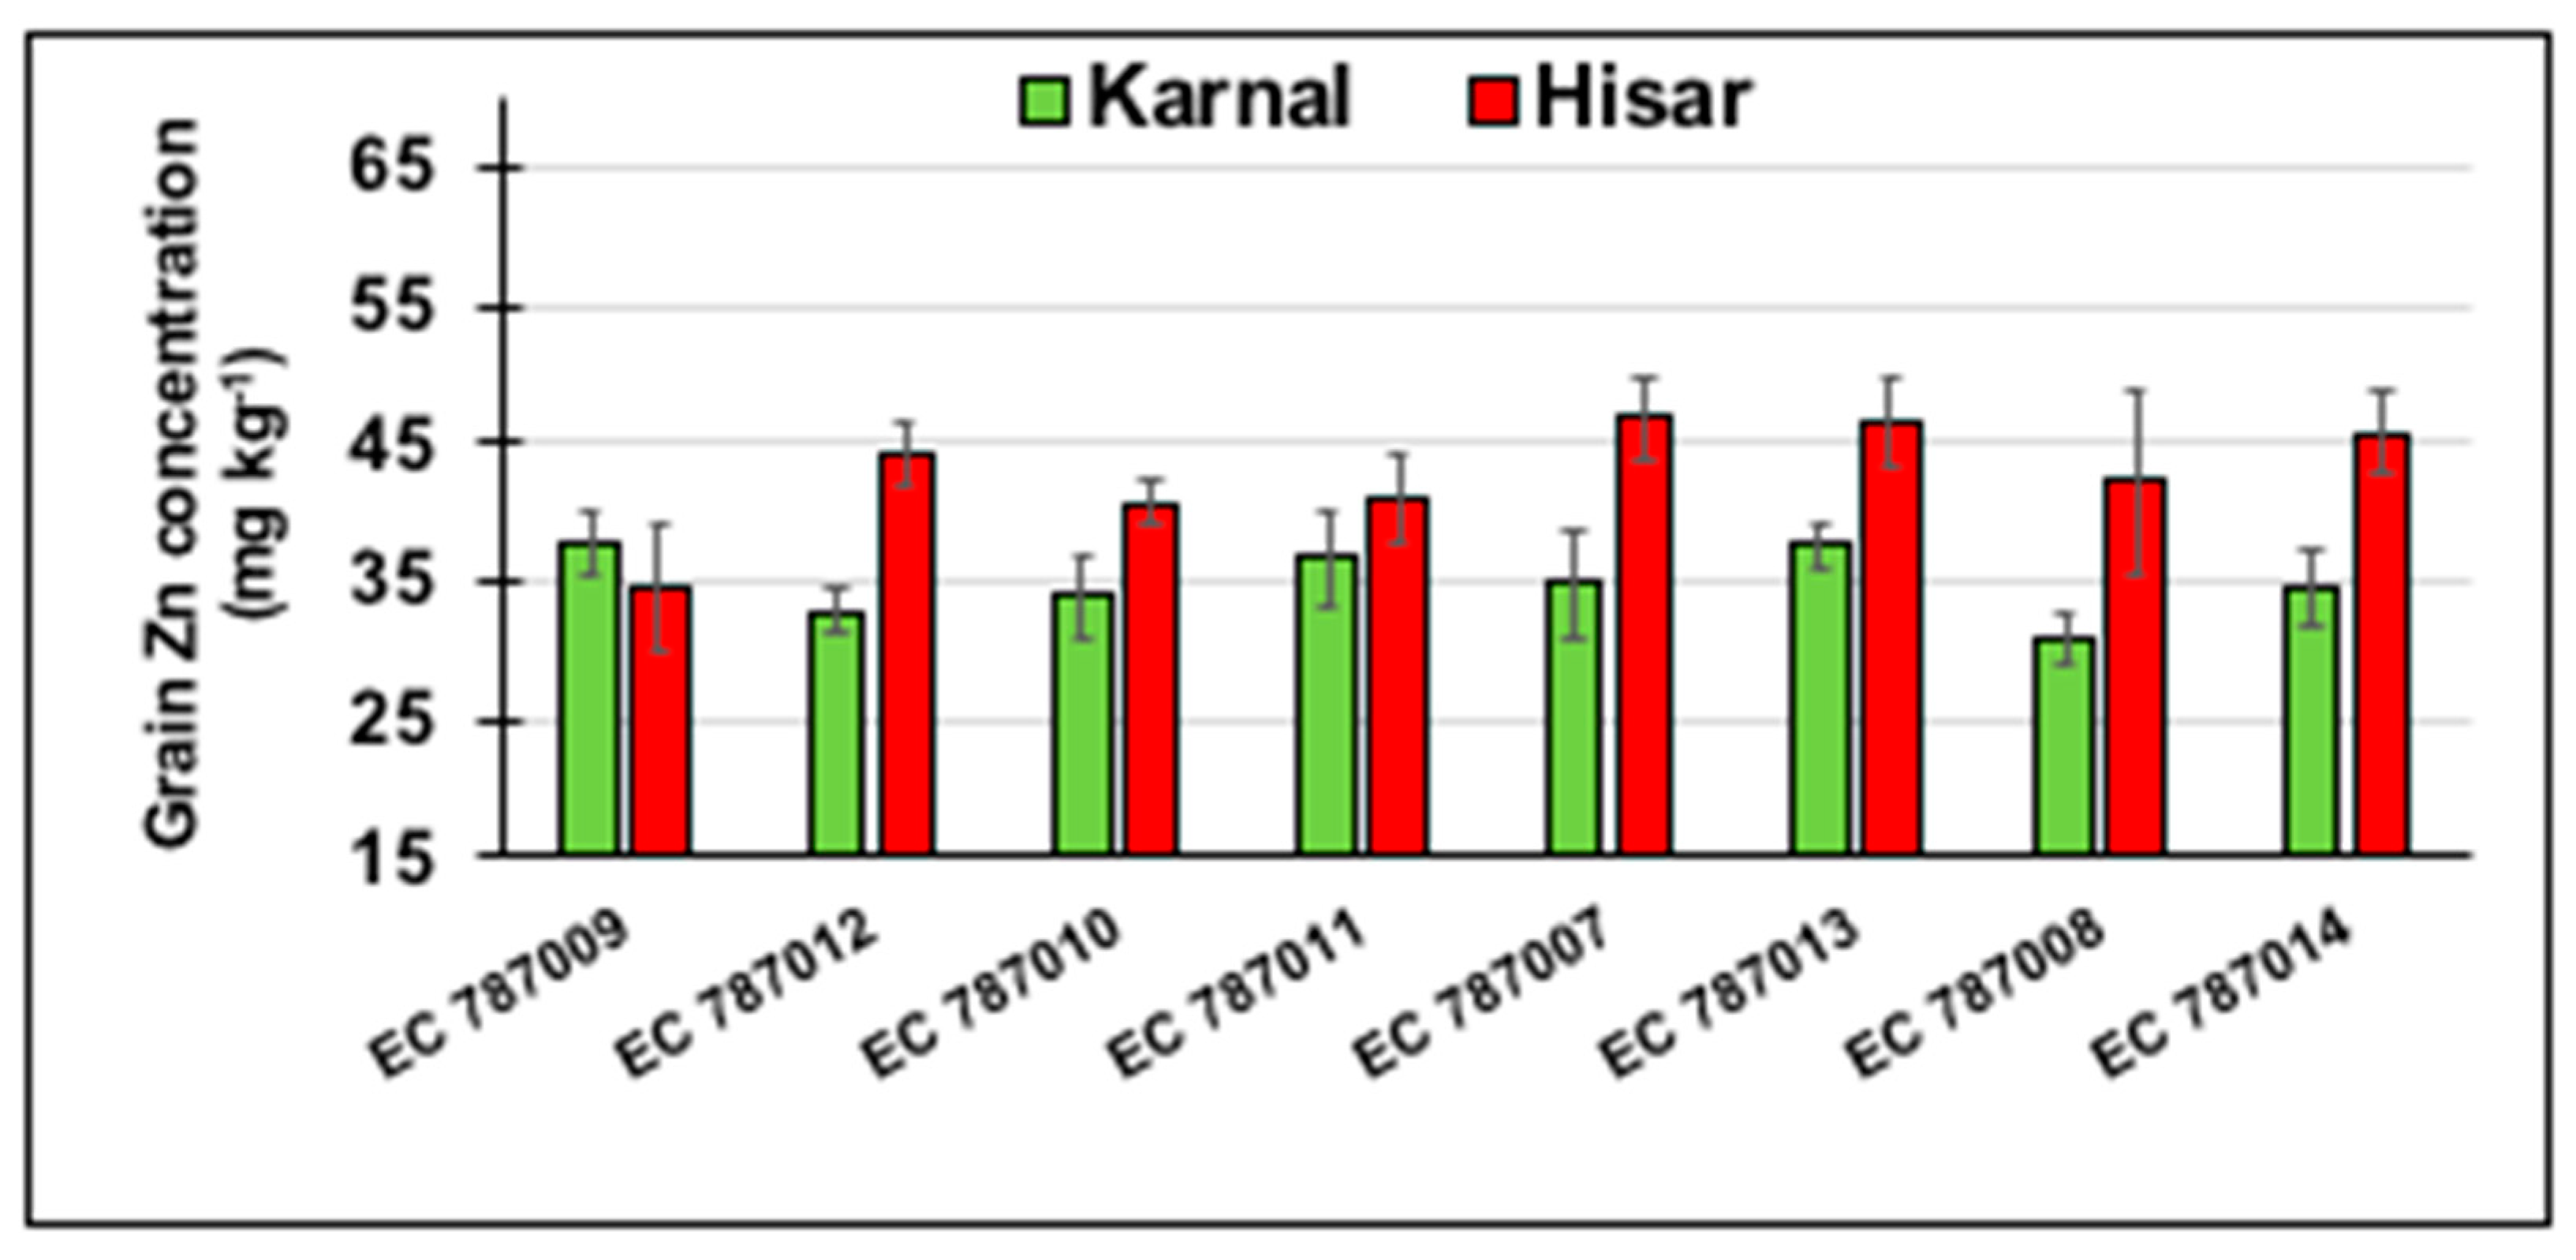
3.8. Differences in Grain Zn Concentration of Eight Amphidiploids between Karnal (Normal) and Hisar (Saline) Sites

Grain Zn concentration did not differ significantly between the eight amphidiploids (p = 0.49). The mean grain Zn concentration of the eight amphidiploids varied from 35.7 to 43.2 mg kg−1, averaged across sites and years. EC 787013 and EC 787009 had the greatest and smallest grain Zn concentration, respectively. There were no significant relationships in the mean grain Zn concentration of the eight amphidiploids, averaged across years, between Karnal and Hisar (r = 0.24; p = 0.57).
The mean grain Zn concentration of the eight amphidiploids, averaged across years, varied from 30.8 to 37.8 mg kg−1 at Karnal and from 34.5 to 46.7 mg kg−1 at Hisar. EC 787009 and EC 787007 had the greatest grain Zn concentration at Karnal and Hisar, respectively. EC 787008 and EC 787009 had the smallest grain Zn concentration at Karnal and Hisar, respectively (Figure 5).
All the amphidiploids showed greater grain Zn concentration at Hisar than Karnal, except EC 787009. However, 13 out of 36 Indian wheat genotypes showed lower grain Zn concentration at Hisar than Karnal, averaged across years [34].
The mean grain Zn concentration of Indian checks varied from 29 to 38.7 mg kg−1 at Karnal and from 23.5 to 33.2 mg kg−1 at Hisar. HI 8498 showed the highest grain Zn concentration at both the sites. KRL 210 and HD 2967 had the smallest grain Zn concentration at Karnal and Hisar, respectively. The mean grain Zn concentration of the UK checks varied from 19.8 to 32.7 mg kg−1 at Karnal and from 32.6 to 34.4 mg kg−1 at Hisar. Paragon and Highbury had the greatest grain Zn concentration at Karnal and Hisar, respectively. Pavon 76 and Chinese Spring had the smallest grain Zn concentration at Karnal and Hisar, respectively.

3.9. Correlations between Grain Zn Concentration and the Grain Ionome and Grain Yield

The grain Zn concentration showed positive significant relationships with grain concentration of Ca, Mg, Mn, P, S and Sr (r = 0.88, 0.81, 0.94, 0.87, 0.85 and 0.96, respectively). However, grain Zn concentration was not correlated with the grain concentration of Al, As, Ba, Cd, Cs, Cu, Fe, K, Mo, Na, Rb, Se, Ti or V. There was also no relationship between grain Zn concentration and GYD.

3.10. Variance Components Associated with Grain Ionome

Genotype (G) and site (E) terms were associated with 8 and 22% of the variation in grain Zn concentration, respectively. The residual term (R) was associated with 62% of the variation in grain Zn concertation which could be due to year, plot-to-plot variation between replicates and technical/measurement errors.
Genotype (G) was typically associated with a greater proportion of the variation in the grain concentration of other minerals compared to Zn (Table S4). Among the macronutrients, 22, 42, 42, 46 and 35% of the variation in grain Ca, K, Mg, P and S concentration was associated with G; 7,10 and 16% of the variation was associated with E, respectively.
Among the micronutrients, 15, 46, 27 and 10% of the variation in grain Cu, Fe, Mn, and Mo was associated with G; 3, 13, 21 and 29% of the variation was associated with E, respectively. Among non-essential trace elements, 29 and 65% of the variation in grain As and Se concentration, respectively, was associated with E, with just 4 and 6% of the variation associated with G, respectively (Table S4).

4. Discussion

Wheat grain production and quality are greatly affected by salt-affected soils. Therefore, there is scope to explore the salt-tolerant wild wheat species to harness the diversity for grain yield, yield components and nutrient traits. In the present study, eight amphidiploids derived from T. bessarabicum, a salt-tolerant wheatgrass, were studied under hostile soil environments for grain yield, yield components and mineral composition traits.

4.1. Significant Performance of Amphidiploids for Grain Yield and Yield Components under Saline Soils

Two of the amphidiploids with durum wheat parents (EC 787007 to EC787013) had longer grains than EC 787014 with a bread wheat parent. All of the amphidiploids showed both a photosensitive and a perennial nature under field conditions which is in agreement with Hassani et al. [39], who reported a perennial nature of these amphidiploids under greenhouse growing conditions. Most of the amphidiploids showed suppressed awning traits. However, some variation was observed, e.g., EC 787009 had awns, which is consistent with King et al. [26], who reported awn traits in this amphidiploid under glasshouse growing conditions. A panel of 36 Indian wheat genotypes showed a reduction in GYD of up to 59% under saline soil (Hisar) compared to normal soil (Karnal) [18]. In the present study, the eight T. bessarabicum-derived amphidiploids showed less reduction in GYD, up to 26% under saline soil (Hisar) compared to normal soil (Karnal) and most of the amphidiploids showed greater GYD under saline soil. This indicates the presence of salt tolerance genes/traits in these amphidiploids, which support their better performance under saline soil conditions.
The mean of BYD, PTM and percentage germination, averaged across amphidiploids and years, were greater under saline soils (Hisar) than normal soil (Karnal). These results are consistent with King et al. [26], who reported a greater number of heads per plant and better germination of T. bessarabicum-derived amphidiploids compared with their wheat parents grown in a salt (NaCl) solution of a concentration of 200 mol m−3. However, salinity reduced the TGW, GWS, HI, PHT and DTM of the amphidiploids. Forster et al. [29] reported a reduction in grain weight and plant height of a T. bessarabicum x Chinese Spring-derived amphidiploid when grown under 250 mol m−3 salt solution until maturity. Javed et al. [40] reported that soil salinity shortened the grain filling duration which possibly caused a reduction in grain weight. King et al. [26] also reported a reduced height of T. bessarabicum-derived amphidiploids when grown under salt (NaCl) solution culture. These results are also consistent with Khokhar et al. [18], Akbarpour et al. [41], Chamekh et al. [42], Noori et al. [43] and Turki et al. [44], who reported reductions in TGW, HI and GWS in modern wheat genotypes when grown under saline field conditions.
Grain yield of amphidiploids correlated positively with PTM at Hisar (saline), but not at Karnal; EC 787011, EC 787012, EC 787013 and EC 787014 had a greater GYD at Hisar than Karnal. Given that GYD of the amphidiploids associated positively with GWS, HI and PTM under saline soils, selection based on these traits could improve the GYD under saline soils. DTM had a negative relationship with GYD under saline soil (Hisar) which is in agreement with Khokhar et al. [18], who reported early maturity of 36 Indian wheat genotypes under saline soils. EC 787014 showed earliness in physiological maturity at both sites, unlike the other amphidiploids. This is consistent with King et al. [26] and Hassani et al. [39], who reported early physiological maturity of this amphidiploid in comparison to the other amphidiploids under normal soil field conditions and salt solution culture, respectively. This indicates that early maturity might favor GYD under saline soils [45].
Notably, some amphidiploids performed better for GYD and component traits under saline soils. For example, EC 787014 (T. bessarabicum x Chinese Spring) had the highest GYD, HI, TGW and GWS under saline soil (Hisar). This may be due to the presence of an extra D genome in this amphidiploid as compared to the others. Other amphidiploids, e.g., EC 787011 (T. bessarabicum x Creso), EC 787012 (T. bessarabicum x Azaziah) and EC 787013 (T. bessarabicum x Stewart) also had greater GYD under saline soil. Since the same T. bessarabicum accession was used to develop all the amphidiploids, this would indicate that the better performance of EC 787014 might be the result of genetic variation within wheat parents or different gene combinations [25]. Hassani et al. [39] reported that T. bessarabicum x Chinese Spring (CS)-derived and T. bessarabicum x Stewart-derived amphidiploids had greater tiller numbers and TGW than other T. bessarabicum-derived amphidiploids under normal soil field conditions.
The better performance of these amphidiploids for GYD and component traits under saline soil might be due to a salt tolerance mechanism introgressed from T. bessarabicum. This species shows salt tolerance by limiting leaf Na+ and Cl concentrations, maintaining high K+ or K+/Na+ concentrations and synthesizing glycinebetaine for osmotic adjustment and protecting the plant from the toxic effects of excessive salt in the soil [28,46,47,48]. Thus, it may be possible to develop greater salt-tolerant amphidiploids by selecting specific wheat genotypes that combine more efficiently with T. bessarabicum for salt tolerance and this could be assessed by crossing different high-yielding genotypes with T. bessarabicum and testing them under saline field conditions. All of the amphidiploids showed fragile spikes and spikelets, which is consistent with Hassani et al. [39], King et al. [26] and Stoyanow [49]. The presence of these undesirable agronomic traits could be due to the presence of genes from T. bessarabicum (King et al. 1997) [26]. The genes responsible for these undesirable traits can be removed by hybridisation of the amphidiploids with hexaploid wheat lines in order to reduce the size of the T. bessarabicum introgression and the continued selection for the genes of interest [39,50,51].

4.2. Characterisation of Amphidiploids for Grain Zn Concentration and the Grain Ionome

Wheat is an important dietary source of Zn for people of developing countries, particularly India. The modern wheat varieties had less variation in grain Zn concentration, for example, a panel of 36 Indian wheat genotypes showed grain Zn concentration from 26–32 mg kg−1 under field conditions in India [34]. A similar range of grain Zn concentration has been reported in field-grown wheat at a global scale, which showed 10 to 20 mg kg−1 lower grain Zn concentration than the target of 40 mg kg−1 for the human diet [8]. In the present study, eight T. bessarabicum-derived amphidiploids showed grain Zn concentrations from 36 to 43 mg kg−1. These results are consistent with Ardalani et al. [31], who reported a mean grain Zn concentration of 35 mg kg−1 in T. bessarabicum-derived hexaploid amphidiploids under field conditions in Kurdistan. HarvestPlus has used wild wheat relatives (Aegilops tauschii Coss and Triticum turgidum subsp. dicoccum (Schrank ex Schübler)) for the development of high-Zn wheat varieties, with 7 to 14 mg kg−1 more Zn than the notional baseline grain Zn concentration of 25 mg kg−1 for India and Pakistan [52]. Given the low soil Zn conditions in this study, amphidiploids showed greater grain Zn concentration than a panel of 36 Indian wheat genotypes. This indicates the potential of T. bessarabicum-derived amphidiploids to be a new source for variation in grain Zn concentration in breeding programmes.
Most of the amphidiploids had greater grain Zn concentrations at Hisar (saline soil) than at Karnal (normal soil). Kharchia 65, a salt-tolerant wheat genotype, showed greater grain Zn concentration under saline soils than normal soil [34]. There was no evidence of a yield dilution effect on grain Zn concentration in this study. This observation supports the argument that these amphidiploids can be used to increase the grain Zn concentration of locally adapted high-yielding wheat varieties. These results are therefore consistent with findings of Khokhar et al. [34], Joshi et al. [53] and Welch and Graham [54], who reported no trade-off between grain Zn and GYD concentration in wheat.
The concentration of mineral elements would decrease if an increase in seed size was only due to an increase in the endosperm and not the bran or germ, where most of the minerals are located [55,56]. Further research is required to understand the storage of Zn in different parts of the grain. Visual observations showed that the grains of amphidiploids were longer with a deeper crease than Chinese Spring (Figure 1) and other wheat varieties grown in the field (data not shown here). Most of the amphidiploids had brown grains, except EC 787014, which had a more wheat-like colour. Almost all the durum cultivars have amber and bold grains, whereas Chinese Spring has small, roundish and reddish grains. The Octaploid EC787014 has smaller and round grains because of its Chinese Spring parent.

4.3. Conclusions

In conclusion, a wild relative of wheat has shown its superiority compared with cultivated wheat cultivars in terms of mineral composition, salinity tolerance and other traits. T. bessarabicum is also well known for salinity tolerance. T. bessarabicum-derived amphidiploids in the present study showed a generally better performance for GYD and yield components under saline soils compared with normal soil. Therefore, there is a considerable potential to use these amphidiploids in breeding programmes to introgress salt-tolerant traits into modern wheat varieties. Moreover, amphidiploids showed greater grain Zn concentrations and might be useful to increase the grain Zn concentration of modern wheat by using them in genetic biofortification programmes. The presence of many undesirable traits, for example, brittle rachis, late maturity and hard threshing ability in the amphidiploids, can be removed by further backcrossing and selection in breeding programmes.

Supplementary Materials

The following are available online at https://www.mdpi.com/2071-1050/12/21/8975/s1, Supplementary Material Figure S1. Genomic in situ hybridisation (GISH) images of amphidiploids. Supplementary Material Figure S2. Supplementary lighting and covering of plant spikes in plots with net bags at Karnal (A) and Hisar (B) sites. Supplementary Material Figure S3. Amphidiploid EC 787014 (Thinopyrum bessarabicum (Savul. & Rayss) Á. Löve (Poaceae) x Chinese Spring) growing at Hisar. Supplementary Material Table S1. Soil characteristics of different experimental sites in India. Supplementary Material Table S2. Grain yield reduction (percentage) of 36 Indian wheat genotypes at the Hisar (saline) site compared to the Karnal (normal) site. Data are means of two replicate plots per genotype at each site over two years, 2013–2014 and 2014–2015. Supplementary Material Table S3. Grain yield reduction (percentage) of eight amphidiploids (Thinopyrum bessarabicum (Savul. & Rayss) Á. Löve (Poaceae) x bread/durum wheat) at the Hisar (saline) site compared to the Karnal (normal) site. Data are means of three replicate plots per amphidiploid at each site, over two years, 2014–2015 and 2015–2016. Supplementary Material Table S4. The contribution of G, E and G*E and residual factors to variation percentage (%) in grain Zn concentration and the grain ionome of eight amphidiploids grown at two sites in 2014–2015 and 2015–2016, in India.

Author Contributions

J.S.K., S.S., B.S.T. and M.R.B. designed the experiment. J.S.K. processed and prepared the grain samples for mineral analysis, S.Y. and L.W. carried out ICP-MS analysis. J.S.K. collected field data, compiled the mineral and field data, carried out the statistical analysis and prepared the initial draft of the manuscript. J.S.K., S.S., B.S.T., J.K., I.K., S.Y. and M.R.B. contributed to drafting and editing the manuscript. All authors have read and agreed to the published version of the manuscript.

Funding

This work was supported by the Department of Biotechnology, Government of India (grant number BT/IN/UK/12/IS/2012) and the Biotechnology and Biological Sciences Research Council (grant number BB/J011827/1).

Acknowledgments

We would like to thank Nabin Bhusal, B.K. Meena and Ramespal from the Indian Institute of Wheat and Barley Research (IIWBR) (Karnal) and all the technical staff from the IIWBR (Hisar) site. This work was supported by the Department of Biotechnology, Government of India (grant number BT/IN/UK/12/IS/2012) and the Biotechnology and Biological Sciences Research Council (grant number BB/J011827/1), including a studentship to Jaswant S. Khokhar.

Conflicts of Interest

The sponsors had no role in the design, execution, interpretation or writing of the study.

References

  1. Shieferaw, B.; Smale, M.; Braun, H.J.; Duveiller, E.; Reynolds, M.; Muricho, G. Crops that feed the world 10. Past successes and future challenges to the role played by wheat in global food security. Food Secur. 2013, 5, 291–317. [Google Scholar] [CrossRef] [Green Version]
  2. United States Department of Agriculture. Available online: https:/www.fas.usda.gov/data/grain-world-markets-and-trade (accessed on 15 September 2020).
  3. United States Department of Agriculture. Available online: https:/www.fas.usda.gov/data/india-grain-voluntary-1 (accessed on 15 September 2020).
  4. King, J.C.; Brown, K.H.; Gibson, R.S.; Krebs, N.F.; Lowe, N.M.; Siekmann, J.H.; Raiten, D.J. Biomarkers of nutrition for development (BOND)-Zinc review. J. Nutr. 2016, 146, 858S–885S. [Google Scholar] [CrossRef] [Green Version]
  5. Kumssa, D.B.; Joy, E.J.M.; Ander, E.L.; Watts, M.J.; Young, S.D.; Walker, S.; Broadley, M.R. Dietary calcium and zinc deficiency risks are decreasing but remain prevalent. Sci. Rep. 2015, 5, 10974. [Google Scholar] [CrossRef] [Green Version]
  6. Gregory, P.J.; Wahbi, A.; Adu-Gyamfi, J.; Heiling, M.; Gruber, R.; Joy, E.J.M. Approaches to reduce zinc and iron deficits in food systems. Glob. Food Secur. 2017, 15, 1–10. [Google Scholar] [CrossRef] [Green Version]
  7. Zhao, F.J.; Su, Y.H.; Dunham, S.J.; Rakszrgi, M.; Bedo, Z.; McGrath, S.P.; Shewry, P.R. Variation in mineral micronutrient concentrations in grain of wheat lines of diverse origin. J. Cereal Sci. 2009, 49, 290–295. [Google Scholar] [CrossRef]
  8. Chen, X.P.; Zhang, Y.Q.; Tong, Y.P.; Xue, Y.F.; Liu, D.Y.; Zhang, W.; Deng, Y.; Meng, Q.F. Harvesting more grain zinc of wheat for human health. Sci. Rep. 2017, 7, 7016. [Google Scholar] [CrossRef] [PubMed] [Green Version]
  9. Cakmak, I.; Torun, A.; Millet, E.; Feldman, M.; Fahima, T.; Korol, A.; Nevo, E.; Braun, H.J.; Ozkan, H. Triticum dicoccoides: An important genetic resource for increasing zinc and iron concentration in modern cultivated wheat. Soil Sci. 2004, 50, 1047–1054. [Google Scholar] [CrossRef] [Green Version]
  10. Rawat, N.; Tiwari, V.K.; Singh, N.; Randhawa, G.S.; Singh, K.; Chhuneja, P.; Dhaliwal, H.S. Evaluation and utilization of Aegilops and wild Triticum species for enhancing iron amnd zinc content n wheat. Genet. Resour. Crop Evol. 2008, 56, 53–64. [Google Scholar] [CrossRef]
  11. Zaharieva, M.; Ayana, N.G.; Al Hakimi, A.; Misra, S.C.; Monneveux, P. Cultivated emmer wheat (Triticum diccocum Schrank), an old crop with a promising future: A review. Genet. Resour. Crop Evol. 2010, 57, 937–962. [Google Scholar] [CrossRef]
  12. Fiore, M.C.; Mercati, F.; Spina, A.; Blangiforti, S.; Venora, G.; Dell’Acqua, M.; Lupini, A.; Preiti, G.; Monti, M.; Pe, M.E.; et al. High-throughput genotype, morphology, and quality traits evaluation for the assessment of genetic diversity of wheat Landraces from Sicily. Plant 2019, 8, 116. [Google Scholar] [CrossRef] [Green Version]
  13. Alfeo, V.; Jaskula-Goiris, B.; Venora, G.; Schimmenti, E.; Aerts, G.; Todaro, A. Screening of durum wheat landraces (Triticum turgidum subsp. durum) for the malting suitability. J. Cereal Sci. 2018, 83, 101–109. [Google Scholar] [CrossRef]
  14. Hasegawa, P.M. Sodium (Na+) homeostasis and salt tolerance of plants. Environ. Exp. Bot. 2013, 92, 19–31. [Google Scholar] [CrossRef]
  15. Pessarakli, M.; Szabolcs, I. Soil salinity and sodicity as particular plant/crop stress factors. In Handbook of Plant and Crop Stress, 3rd ed.; CRC Press: Boca Raton, FL, USA, 2010; pp. 3–21. [Google Scholar]
  16. Mandal, A.K.; Sharma, R.C.; Singh, G.; Dagar., J.C. Computerized Database on Salt Affected Soil in India; Sehgal, V.K., Singh, R., Eds.; Central Soil Salinity Research Institute: Karnal, India, 2010; p. 28. [Google Scholar]
  17. Sharma, K.L.; Mandal, B.; Venkateswarlu, B. Soil Quality and Productivity Improvement under Rainfed Conditions–Indian Perspectives. In Resource Management for Sustainable Agriculture; Abrol, V., Sharma, P., Eds.; InTech: Rijeka, Croatia, 2012; pp. 203–238. [Google Scholar]
  18. Khokhar, J.S.; Sareen, S.; Tyagi, B.S.; Singh, G.; Chowdhury, A.K.; Dhar, T.; Singh, V.; King, I.P.; Young, S.D.; Broadley, M.R. Characterising variation in wheat traits under hostile soil conditions in India. PLoS ONE 2017, 12. [Google Scholar] [CrossRef] [PubMed] [Green Version]
  19. Rahnama, A.; Munns, R.; Poustini, K.; Watt, M. A screening method to identify genetic variation in root growth response to a salinity gradient. J. Exp. Bot. 2011, 62, 69–77. [Google Scholar] [CrossRef] [PubMed] [Green Version]
  20. Frossard, E.; Bucher, M.; Machler, F.; Mozafar, A.; Hurrell, R. Potential for increasing the content and bioavailability of Fe, Zn and Ca in plants for human nutrition. J. Sci. Food Agr. 2000, 80, 861–879. [Google Scholar] [CrossRef]
  21. Gorham, J. Salt Tolerance in the Triticeae-K/Na Discrimination in Synthetic Hexaploid Wheats. J. Exp. Bot. 1990, 41, 623–627. [Google Scholar] [CrossRef]
  22. Gorham, J.; Bristol, A.; Young, E.M.; Wyn-Jones, R.G. The presence of the enhanced K/Na discrimination trait in diploid Triticum species. Theor. Appl. Genet. 1991, 82. [Google Scholar] [CrossRef]
  23. Mujeeb-Kazi, A.; De Leon, J.L.D. Conventional and alien genetic diversity for salt tolerant wheats: Focus on current status and new germplasm development. In Prospects for Saline Agriculture; Ahmad, R., Malik, K.A., Eds.; Springer: Dordrecht, The Netherlands, 2002; pp. 69–82. [Google Scholar]
  24. Gorham, J.; Mcdonnell, E.; Budrewicz, E.; Jones, R.G.W. Salt tolerance in the Triticeae: Growth and solute accumulation in leaves of Thinopyrum bessarabicum. J. Exp. Bot. 1985, 36, 1021–1031. [Google Scholar] [CrossRef]
  25. King, I.P.; Forster, B.P.; Law, C.C.; Cant, K.A.; Orford, S.E.; Gorham, J.; Reader, S.; Miller, T.E. Introgression of salt-tolerance genes from Thinopyrum bessarabicum into wheat. New Phytol. 1997, 137, 75–81. [Google Scholar] [CrossRef]
  26. King, I.P.; Law, C.N.; Cant, K.A.; Orford, S.E.; Reader, S.M.; Miller, T.E. Tritipyrum, a potential new salt-tolerant cereal. Plant Breed. 1997, 116, 127–132. [Google Scholar] [CrossRef]
  27. Qi, Z.; Du, P.; Qian, B.; Zhuang, L.; Chen, H.; Chen, T.; Shen, J.; Guo, J.; Feng, Y.; Pei, Z. Characterization of a wheat-Thinopyrum bessarabicum (T2JS-2BS.2BL) translocation line. Theor. Appl. Genet. 2010, 121, 589–597. [Google Scholar] [CrossRef] [PubMed]
  28. Colmer, T.D.; Flowers, T.J.; Munns, R. Use of wild relatives to improve salt tolerance in wheat. J. Exp. Bot. 2006, 57, 1059–1078. [Google Scholar] [CrossRef] [Green Version]
  29. Forster, B.P.; Gorham, J.; Miller, T.E. Salt Tolerance of an Amphiploid between Triticum aestivum and Agropyron junceum. Plant Breed. 1987, 98, 1–8. [Google Scholar] [CrossRef]
  30. King, I.P.; Purdie, K.A.; Orford, S.E.; Reader, S.M.; Miller, T.E. Detection of homoeologous chiasma formation in Triticum durum x Thinopyrum bessarabicum hybrids using genomic in situ hybridization. Heredity 1993, 71, 369–372. [Google Scholar] [CrossRef]
  31. Ardalani, S.; Mirzaghaderi, G.; Badakhshan, H. A Robertsonian translocation from Thinopyrum bessarabicum into bread wheat confers high iron and zinc contents. Plant Breed 2016, 135, 286–290. [Google Scholar] [CrossRef]
  32. Black, R.E.; Victoria, G.; Walker, P.; Bhutta, A.; Christian, P.; de Onis, M.; McGregor, S.G.; Katz, J.; Martorell, R.; Uauy, R. Maternal and child undernutrition and overweight in low-income and middle-income countries. Lancet 2013, 382, 427–451. [Google Scholar] [CrossRef]
  33. World Health Organisation. The Double Burden of Malnutrition. Available online: http://www.who.int/nutrition/publications/doubleburdenmalnutrition-policybrief/en (accessed on 13 September 2020).
  34. Khokhar, J.S.; Sareen, S.; Tyagi, B.S.; Singh, G.; Wilson, L.; King, I.P.; Young, S.D.; Broadley, M.R. Variation in grain Zn concentration, and the grain ionome, in field-grown Indian wheat. PLoS ONE 2018, 13. [Google Scholar] [CrossRef] [Green Version]
  35. Murphy, K.M.; Hoagland, L.A.; Reeves, P.G.; Baik, B.K.; Jones, S.S. Nutritional and quality characteristics expressed in 31 perennial wheat breeding lines. Renew. Agric. Food Syst. 2009, 24, 285–292. [Google Scholar] [CrossRef]
  36. Nemeth, C.; Yang, C.Y.; Kasprzak, P.; Hubbart, S.; Scholefield, D.; Mehra, S.; Skipper, E.; King, I.; King, J. Generation of amphidiploids from hybrids of wheat and related species from the genera Aegilops, Secale, Thinopyrum, and Triticum as a source of genetic variation for wheat improvement. Genome. 2015, 58, 71–79. [Google Scholar] [CrossRef]
  37. Grewal, S.; Yang, C.; Edward, S.H.; Scholefield, D.; Ashling, S.; Burridge, A.J.; King, I.P.; King, J. Characterisation of Thinopyrum bessarabicum chromosomes through genome-wide introgressions into wheat. Theor. Appl. Genet. 2017, 131, 389–406. [Google Scholar] [CrossRef] [Green Version]
  38. Guo, Z.; Chen, D.; Schnurbusch, T. Variance components, heritability and correlation analysis of anther and overy size during the floral development of bread wheat. J. Exp. Bot. 2015, 66, 3099–3111. [Google Scholar] [CrossRef] [Green Version]
  39. Hassani, H.S.; King, I.P.; Reader, S.M.; Caligari, P.D.S.; Miller, T.E. Can tritipyrum, a new salt tolerant potential amphiploid, be a successful cereal like triticale? J. Agri. Sci. Tech. 2000, 2, 177–195. [Google Scholar]
  40. Javed, I.U.H.; Akhtar, S.; Akram, M.; Arfan, M.; Yasmin, S. Differential yield responses of barley genotypes to NaCl salinity. Int. J. Agric. Biol. 2003, 5, 233–235. [Google Scholar]
  41. Akbarpour, O.A.; Dehghani, H.; Rousta, M.J. Evaluation of salt stress of Iranian wheat germplasm under field conditions. Crop Pasture Sci. 2015, 66, 770–781. [Google Scholar] [CrossRef]
  42. Chamekh, Z.; Ayadi, S.; Karmous, C.; Trifa, Y.; Amara, H.; Boudabbous, K.; Yousfi, S.; Dolors, S.; Araus, J.L. Comparative effect of salinity on growth, grain yield, water use efficiency, delta (13)C and delta(15)N of landraces and improved durum wheat varieties. Plant Sci. 2016, 251, 44–53. [Google Scholar] [CrossRef] [PubMed]
  43. Noori, S.A.S.; Khalaj, H.; Labbafi, M.R. Effect of different salinity levels on morpho-physiological characters of 8 wheat genotypes (Triticum aestivum L.). Iranian J. Plant Physio. 2010, 1, 108–117. [Google Scholar]
  44. Turki, N.; Harrabi, M.; Okuno, K. Effect of salinity on grain yield and quality of wheat and genetic relationships among durum and common wheat. J. Arid Land Stud. 2012, 22, 311–314. [Google Scholar]
  45. McDonald, G.K.; Taylor, J.D.; Verbyla, A.; Kuchel, H. Assessing the importance of subsoil constraints to yield of wheat and its implications for yield improvement. Crop Pasture Sci. 2013, 63, 1043–1065. [Google Scholar] [CrossRef]
  46. Munns, R.; James, R.A.; Islam, A.; Colmer, T.D. Hordeum marinum-wheat amphiploids maintain higher leaf K+:Na+ and suffer less leaf injury than wheat parents in saline conditions. Plant Soil. 2011, 348, 365–377. [Google Scholar] [CrossRef]
  47. Munns, R.; Tester, M. Mechanisms of salinity tolerance. Ann. Rev. Plant Biol. 2008, 59, 651–681. [Google Scholar] [CrossRef] [Green Version]
  48. Zhu, M.; Shabala, S.; Shabala, L.; Fan, Y.; Zhou, M.X. Evaluating predictive values of various physiological indices for salinity stress tolerance in wheat. J. Agron. Crop Sci. 2016, 202, 115–124. [Google Scholar] [CrossRef]
  49. Stoyanov, H. Characteristics of amphidiploids in the Triticum-Aegilops-Haynaldia-Agropyron group. Scientific Papers-Series A. Agronomy 2012, 55, 249–255. [Google Scholar]
  50. Ghazali, S.; Mirzaghaderi, G.; Majdi, M. Production of a novel Robertsonian translocation from Thinopyrum bessarabicum into bread wheat. Cytol. Genet. 2015, 49, 378–381. [Google Scholar] [CrossRef]
  51. Marais, F.; Simsek, S.; Poudel, R.S.; Cookman, D.; Somo, M. Development of hexaploid (AABBJJ) Tritipyrums with rearranged Thinopyrum distichum (Thunb.) A love-derived genomes. Crop Sci. 2014, 54, 2619–2630. [Google Scholar] [CrossRef]
  52. Singh, R.; Velu, G. Zinc-biofortified wheat: Harnessing genetic diversity for improved nutritional quality. In Science Brief: Biofortification; Andersson, M.S., Bouis, H., Eds.; CIMMYT, HarvestPlus and the Global Crop Diversity Trust: Bonn, Germany, 2017. [Google Scholar]
  53. Joshi, A.K.; Crossa, J.; Arun, B.; Chand, R.; Trethowan, R.; Vargas, M.; Ortiz-Monasterio, I. Genotype x environment interaction for zinc and iron concentration of wheat grain in eastern Gangetic plains of India. Field Crop Res. 2010, 116, 268–277. [Google Scholar] [CrossRef]
  54. Welch, R.M.; Graham, R.D. Breeding for micronutrients in staple food crops from a human nutrition perspective. J. Exp. Bot. 2004, 55, 353–364. [Google Scholar] [CrossRef] [Green Version]
  55. Ajiboye, B.; Cakmak, I.; Paterson, D.; de Jonge, M.D.; Howard, D.L.; Stacey, S.P.; Torun, A.A.; Aydin, N.; McLaughlin, M.J. X-ray fluorescence microscopy of zinc localization in wheat grains biofortified through foliar zinc applications at different growth stages under field conditions. Plant Soil 2015, 392, 357–370. [Google Scholar] [CrossRef]
  56. Cakmak, I.; Kalayci, M.; Kaya, Y.; Torun, A.A.; Aydin, N.; Wang, Y.; Arisoy, Z.; Erdem, H.; Yazici, A.; Gokmen, O.; et al. Biofortification and localization of zinc in wheat grain. J. Agric. Food Chem. 2010, 58, 9092–9102. [Google Scholar] [CrossRef]
Figure 1. Comparison of grain size and colour of eight amphidiploids derived from Thinopyrum bessarabicum (Savul. & Rayss) Á. Löve (Poaceae). Left to right: EC 787007 (T. bessarabicum x Langdon), EC 787008 (T. bessarabicum x Macoun), EC 787009 (T. bessarabicum x Karim), EC 787010 (T. bessarabicum x Neodur), EC 787011 (T. bessarabicum x Creso), EC 787012 (T. bessarabicum x Azaziah), EC 787013 (T. bessarabicum x Stewart), EC 787014 (T. bessarabicum x Chinese Spring) and Chinese Spring.
Sustainability 12 08975 g001
Figure 2. Mean grain yield of eight amphidiploids harvested in 2014–2015 and 2015–2016 at Karnal and Hisar sites. In panels (a,b), data are the means of three replicate plots per amphidiploid per site in 2014–2015 and 2015–2016, respectively (± standard error of the mean). Green and red bars represent “normal” and “saline” soils, respectively.
Sustainability 12 08975 g002
Figure 3. Yield and yield component traits at Karnal and Hisar sites in 2014–2015 and 2015–2016. Data represent three replicate plots per site of eight amphidiploids (n = 24) in 2014–2015 and 2015–2016. Boxes represent the two quartiles with median drawn; whiskers are the 95% confidence limits plus outliers. Traits: grain yield (GYD, t ha−1), biological yield (BYD, g), 1000 grain weight (TGW, g), grain weight per spike (GWS, g), harvest index (HI, %), productive tillers per meter (PTM), plant height at maturity (PHT, cm), days to maturity (DTM, days).
Sustainability 12 08975 g003
Figure 4. Grain element concentration of eight amphidiploids at Karnal and Hisar sites over two years. Data represent the mean of two replicate plots per amphidiploid at the Hisar site in 2014–2015 and three replicate plots per amphidiploid at Karnal and Hisar sites in 2015–2016. Boxes represent the two quartiles with the median drawn; whiskers are the 95% confidence limits; circles are the outliers.
Sustainability 12 08975 g004
Figure 5. Grain Zn concentration of eight amphidiploids grown at two sites over two years. Data represent two replicate plots per amphidiploid at the Hisar site in 2014–2015 and three replicate plots per amphidiploid at Karnal and Hisar sites in 2015–2016 (± standard error of the mean). Green and red bars represent “normal” and “saline” soils, respectively).
Sustainability 12 08975 g005
Table 1. Sowing dates and cropping pattern of field experiments in India.
SiteGrowing
Zone
GridSowingHarvestingYearSoil TypeCropping Pattern
IIWBR, KarnalNWPZ29.70° N18.11.1420.04.152014–2015NormalRice–Wheat
76.99° E12.11.1523.04.162015–2016
IIWBR, HisarNWPZ29.18° N27.11.1424.04.152014–2015SalineCotton–Wheat
75.70° E24.11.1522.04.162015–2016
Note: IIWBR—Indian Institute of Wheat & Barley Research; NWPZ—North Western Plains Zone.
Table 2. Amphidiploids used in field trials in 2014–2015 and 2015–2016 in India.
AmphidiploidsPedigreeGenomic Constitution
EC 787007Triticum. turgidum L. cv. Langdon x Thinopyrum bessarabicum (Savul. & Rayss) Á. Löve (Poaceae)AABBJJ
EC 787008T. turgidum L. cv. Macoun x T. bessarabicumAABBJJ
EC 787009T. turgidum L. cv. Karim x T. bessarabicumAABBJJ
EC 787010T. turgidum L. cv. Neodur x T. bessarabicumAABBJJ
EC 787011T. turgidum L. cv. Creso x T. bessarabicumAABBJJ
EC 787012T. turgidum L. cv. Azaziah x T. bessarabicumAABBJJ
EC 787013T. turgidum L. cv. Stewart x T. bessarabicumAABBJJ
EC 787014Triticum aestivum L. cv. Chinese Spring x T. bessarabicumAABBDDJJ
Table 3. The contribution of genotype (G), environment (E) and G*E interaction to variation in grain yield and yield component traits of eight amphidiploids grown at two sites in India during 2014–2015 and 2015–2016.
TraitsVariation (%)
GEG*EResidualH2
201520162015201620152016201520162015 + 2016
Grain yield per plot (GYD)67.7 **63.7 **9.8 **16.7 **7.27.015.312.639.1
Biological yield (BYD)77.5 **41.6 **3.1 *27.3 **6.213.3 *13.217.849.8
Germination % (Germ. %)67.0 **67.1 **4.9 *14.5 **13.9 *4.414.114.077.7
1000 grain weight (TGW)18.825.149.3 **2.04.426.027.646.856.3
Grain weight per spike (GWS)13.250.6 **41.5 **2.59.84.735.542.264.9
Harvest Index (HI)58.0 **84.8 **16.2 **3.1 **15.5 **5.5 *10.26.659.6
Productive tillers per meter (PTM)45.9 **23.10.18.115.422.938.646.040.8
Plant height at maturity (PHT)88.3 **65.6 **0.823.9 **7.2 **5.7 **3.74.782.4
Days to maturity (DTM)15.0 **26.8 **71.9 **67.5 **6.92.9 *6.22.889.1
Degrees of freedom (d.f.)71732
Test of significance; * p < 0.01, ** p < 0.001; H2: heritability.
Table 4. Grain concentration of Zn and other mineral elements of amphidiploid wheat. Data are in mg kg−1, summarised across all plots (n = 64). SD = standard deviation; LOD = limit of detection.
ElementsMeanMedianSDRangeLODHeritability
Zn39.740.08.2021.2–58.90.57243.7
Others
As0.01540.01060.01460.0016–0.06460.0031945.7
Al11.111.14.222.26–26.34.5327.3
Ba9.478.26.12–24.10.029178.0
Ca63663194.8273–8197.6577.3
Cd0.03510.0330.01960.00634–0.09990.0012156.4
Cs0.01020.005860.008530.000271–0.03020.00054258.5
Cu7.0171.443.53–9.990.35569.4
Fe50.149.38.3322.1–72.84.7656.0
K552056608432920–71402.0277.6
Mg16501670217643–19500.94262.4
Mn47.847.89.2418.9–69.80.23865.3
Mo1.341.30.330.609–2.360.07767.5
Na42.334.225.413–1035.3956.0
P516052206572530–65901.8448.3
Rb5.784.453.770.468–15.20.0059973.6
S21802170257947–262010659.9
Se0.3310.2890.2060.0912–0.9110.0034201.2
Sr10.19.663.924.18-18.40.088634.9
Ti0.460.4560.1170.126–0.7360.25129.1
V0.02120.02010.008330.00251–0.04680.0050309.2
Publisher’s Note: MDPI stays neutral with regard to jurisdictional claims in published maps and institutional affiliations.

