Abstract
Fire is one of the mutable hazards that damage properties and destroy forests. Many researchers are involved in early warning systems, which considerably minimize the consequences of fire damage. However, many existing image-based fire detection systems can perform well in a particular field. A general framework is proposed in this paper which works on realistic conditions. This approach filters out image blocks based on thresholds of different temporal and spatial features, starting with dividing the image into blocks and extraction of flames blocks from image foreground and background, and candidates blocks are analyzed to identify local features of color, source immobility, and flame flickering. Each local feature filter resolves different false-positive fire cases. Filtered blocks are further analyzed by global analysis to extract flame texture and flame reflection in surrounding blocks. Sequences of successful detections are buffered by a decision alarm system to reduce errors due to external camera influences. Research algorithms have low computation time. Through a sequence of experiments, the result is consistent with the empirical evidence and shows that the detection rate of the proposed system exceeds previous studies and reduces false alarm rates under various environments.
1. Introduction
Fire is one of the most uncontrollable phenomena with respect to time and space and directly endangers human life and property and nature. Based on the National Fire Protection Association (NFPA) report, 1,342,000 fire incidents were reported. Moreover, there was 10.6 billion U.S. Dollars in property damage in the U.S. in 2016 [1]. There are fast ways of detecting it: (1) heat detection (e.g., Fixed Temperature Detectors), (2) chemical-compound-smoke detection (e.g., ionization and gas sensors), and (3) flame detection (e.g., ultraviolet and infrared sensors) [2]. Traditional methods have many disadvantages. One of these disadvantages is transmission delay and detection in outdoor places, for instance, forests and long tunnels. Furthermore, sensors have massive deployment and maintenance costs. Early fire detection algorithms process visual information obtained from the static camera, which is incorporated with the techniques of CCTV surveillance systems. Fire detection consists of two main categories, flame and smoke features.
Most of the time, smoke becomes visible before flames in forest fires and helps in detecting fires at an early stage, which in turn can reduce the dangerous situation caused by it. However, smoke detection cannot detect at night without appropriate light.
To detect smoke and flame, different image processing techniques can be used. During image processing, a video sequence is given as input to the system, and output can be either an image, characteristics of an image, or pre-decided parameters. It consists in the processing of the 2D image. Various tasks can be performed using image processing, such as feature extraction, classification, and recognition of different patterns. The process of fire development is divided into four periods [2,3,4]: inception, fire growth period, fully developed period, and decay period, as shown in Figure 1. According to the development figure, detection of fire during the growth period could reduce property damage; recently many studies have been introduced to solve early fire detection problems using surveillance cameras, which use machine vision that can detect flame based on image processing and different machine learning algorithms.
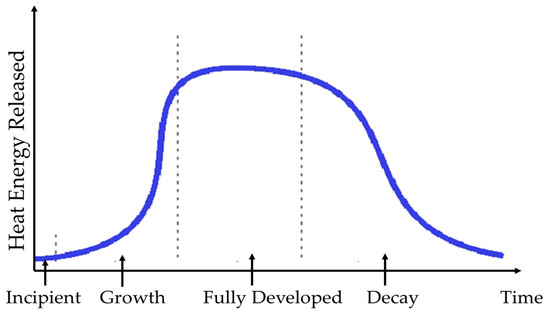
Figure 1.
Fire development periods.
Flame detection classification can be categorized mainly into four different categories: color, texture, motion, and shape. The first type of classification is based on the color of the flame. Frequently, the flame will exhibit yellow, yellow-red, and red colors. Depending on the color distribution of fire, a fire model shows different color spaces. Chen et al. [5] and Celik et al. [6] concluded that fire must abide by the RGB color space distribution law,, , and, ; furthermore, Horng et al. [7] suggested a unique color model in the HSI (Hue, Saturation, Intensity) color space depending on the saturation. This model can be applied to different brilliance environments. Therefore, different environments can utilize the fire model more widely. [8] combined the RGB model and the HIS model to identify the color of fire distribution. The major drawback of the RGB model is that it does not consider the brightness difference in the fire due to the use of a camera. Celik et al. [6] proposed a flame color model based on YCbCr (Y is the luma component and Cb and Cr are the blue-difference and red-difference chroma components) pace to efficiently identify the fire chroma and luminance. In this research, the flame color model also refers to the Celik method, in addition to further improvements. Walia et al. [9] introduced a new approach using data fusion applied to the three-color models. The Dezert–Smarandache theory (DSmT) of evidence fusion deals with disagreement in data obtained from color models RGB, HSV (Hue, Saturation and value), and YCbCr. Their conflicting mass redistribution is resolved using proportional conflict redistribution (PCR). PCR5 uses the logic of conjunctive rules. Wang et al. [10] introduce a K-means clustering of the two models HSV and YCbCr.
The second category of flame detection is texture classification. The burning flame appears similar from a long distance; however, upon closer look, visible subtle changes are shown in nearby pixel blazing. A preset mask was introduced by Ebert et al. [11] to calculate and analyze the tendency of fire to be grouped around a central point, the spatial color variation of fire, and the temporal variation of fire intensity. Toreyin et al. [12] proposed a flame region color analysis using wavelet analysis. They used an ample amount of variation in the pixel brightness in the neighboring area of the fire zone. Absolute values of low and high bands were calculated using 2D wavelet analysis to define the parameters, and only objects with significant parameters as fire bodies were considered. As suggested by Zhao et al. [13], the texture parameter of the region of interest (ROI) can be calculated using the entropy formula. Zhao introduced two dynamic texture models [13]: Multi-resolution Analysis Linear Dynamic System (MRALDS) and Analysis Non-Linear Dynamic System (MRANLDS). The dynamic texture segmentation system was proposed by Paygude and Vyas [14] based on local and global spatiotemporal techniques. Dynamic texture representation was proposed by Nguyen et al. [15] based on hierarchical local patterns.
The third grade is a classification of flame flickering. The prominent part of the fire is flame, which keeps blazing and swaying on its own or propagates specifically owing to combustion with oxygen. This kind of swing may suddenly change the appearance of flame to red, and the red channel of the pixel then returns to the background color. Gunay et al. [16] proposed time-domain analysis and accumulation of detected fire color moving body’s pixel red channel. Dimitropoulos et al. [17] proposed fire-flame detection based on a computer vision approach. First, background subtraction is used, followed by a non-parametric model based on color analysis defining candidate fire regions in a frame. Various spatiotemporal features are then utilized to model fire behavior [18], for example, flickering, color probability, and spatial energy. Linear dynamic system and several system approaches are utilized in each candidate region. The spatiotemporal consistency energy of each candidate fire region is calculated with prior knowledge of the possible existence of fire in neighboring blocks from the current and previous frames, and finally, for classification of candidate regions, a two-class Support Vector Machine (SVM) [19] classifier is used. Dai Duong et al. [20] proposed a fire detection system based on fuzzy logic.
Flame shape analysis is considered the fourth type of fire classification. Fire shape surface area usually fluctuates compared to the relatively smooth features of other objects. Borges [21] proposed a system to determine the exterior of the fire using objects’ circumference/length ratio and actual circumference length. Zhang et al. [22,23] proposed a system to detect boundaries of objects using the Laplacian operator and used Fourier analysis to detect fire contour. Ko et al. [24] proposed a novel fire-flame detection method based on visual features using fuzzy Finite Automata (FFA) and a probability density function. The method offers a systematic approach to handle irregularities in the computation systems. The system is capable of handling continuous spaces by combining methodologies of automata and fuzzy logic. Gaur et al. [25] described recent developments in the area of fire detection using video sequence. Higher detection rates are targeted by most of the literature published. Speed of fire detection and decreasing false alarm rates are the most preferred parameters while calculating the accuracy of the fire detection systems [26]. Most of the methods do not consider increasing fire detection rates, though some systems concentrate on detecting fire in the single frame or entire video. Using block processing, the proposed research framework can detect and locate the fire region accurately even in the worst case when fire and non-fire objects are in the same frame. In this paper, an efficient and robust fire detection system is proposed using local and global feature analysis for each candidate block. The proposed system is so computationally light that it can even be implemented on an embedded system for any real-time surveillance problem.
A novel fire detection system based on the Convolutional Neural Network (CNN) model YOLO v3 (latest variant of a popular object detection algorithm YOLO—You Only Look Once) [27], R–FCN (Region-based Fully Convolutional Network), Faster-RCNN (Region-Based Convolutional Neural Networks) and SSD (single-shot detector) was proposed by Li and Zhao [28]. YOLO v3 performed well and had 83.7% accuracy at a speed of 28 FPS (frames per second). R–FCN had 83.3% accuracy at 5 FPS, Faster-RCNN had 84.9% accuracy at 3 FPS, and SSD had 82.8% accuracy at 16 FPS. The dataset used for experimentation had 29,180 images from the public fire image database. Images were pre-processed by resizing them to 500 × 375 and 375 × 500 for horizontal images and longitudinal images, respectively. Datasets had two object classes named “fire” and “smoke” and two disturbance classes “fire-like” and “smoke-like”.
Mao et al. [29] proposed a multichannel convolution-neural-network-based fire detection method. Three-channel colorful images were given as input to the CNN. It uses a hidden layer with multiple-layer pooling and convolution along with tuning the model parameter using backpropagation. Classification of fire recognition is conducted using the softmax method. The author used GPU (graphics processing unit) for training and testing the model. For experimentation 7000 and 4494 images were considered for training and testing, respectively. The method was compared with the existing support vector machine and deep neural network algorithms. Classification accuracy of 98% was reported by authors and outperformed existing methods in terms of precision rate, recall rate, ROC curve, and F1-score.
Muhammad et al. [30] proposed an early fire detection framework based on fine-tuned CNN using CCTV surveillance cameras. The authors proposed an adaptive prioritization mechanism for autonomous operations and a dynamic channel selection algorithm for reliable data dissemination. For experimentation, a dataset of 68,457 images and videos was used, which was a collection of 62,690 frames from Foggia’s video dataset, 226 images from Chino’s dataset, and images from a few other datasets. Experimental results verified high accuracy of 94.39% with a false positive of 9.07%.
Classical CNN has high accuracy in a single frame but fails to capture motion information between frames. To solve this issue, Hu and Lu [31] proposed a spatial-temporal based CNN algorithm for real-time detection and video smoke detection. The algorithm uses a multitask learning strategy to recognize smoke and estimate optical flow by capturing inter-frame motion and intra-frame appearance features simultaneously. To prove the efficiency and effectiveness of the method, a self-created dataset is used with 157 videos comprising of 86 non-smoke videos and 71 smoke videos. The system has a 3.5% false alarm rate, 97% detection rate, and processing time of 5 ms per frame. Govil et al. [32] proposed a smoke detection system based on machine-learning-based image recognition software and a cloud-based workflow that is capable of scanning hundreds of cameras every minute. The authors further plan to leverage the other existing fire detection algorithms and combine their information with the information obtained from the author’s camera-based detection system to provide a robust and faster and combined system. Above are a few examples of CNN-based fire.
2. System Overview
Our primary functionality of the framework was early detection of fire containing blazing flame and not for detecting smoke or smoldering fire. The proposed system is shown in Figure 2 and consists of three basic phases, pre-processing, flame feature processing, and global feature processing. In pre-processing, input image is cropped into a fixed block position. This block is used as an observation unit, and analysis of identification of fire flame is applied to these blocks. In this phase, the movement foreground is found, and the background is eliminated, followed by connecting the correct candidate’s blocks to construct the movable shape. The local block feature processing phase consists of applying color analysis, fire source analysis, and disorder analysis. The candidate blocks which pass the criteria for these steps are processed by a global feature analysis step, which includes analysis of color variance and fire-surrounded areas. Succeeded image block candidates will trigger an alarm decision unit to trigger an alarm. Figure 3 is the flowchart of block processing. The input is the gray level image sequence, and the output is candidate blocks with a moving property. There are two common methods for obtaining a foreground image: one is a temporal difference, the other is background subtraction.
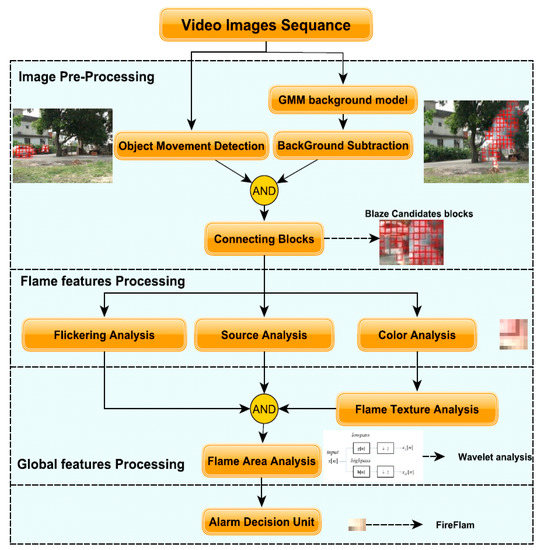
Figure 2.
Flame detection system overview.
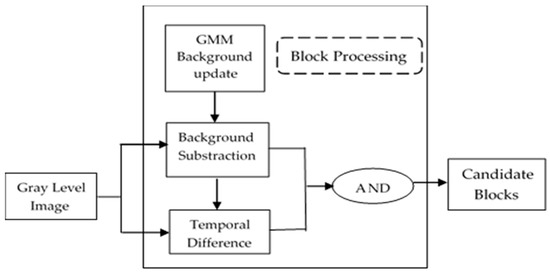
Figure 3.
Block processing.
2.1. Background Substraction
The first step of the system is moving the background from the image, and this is implemented using a Gaussian mixture model (GMM) [13] to construct the background image. For background modeling, GMM is commonly used, as it is one of the most robust methods. However, surveillance videos observe background movement, for example, waving leaves and sparking light, which leads to pixel changes at several specific intervals. Therefore, the mixture model (GMM) uses multiple Gaussian distributions. The flow chart of the GMM background construction is shown in Figure 4.
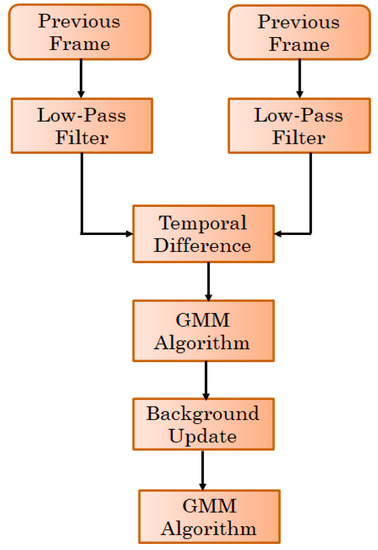
Figure 4.
Gaussian mixture model (GMM) background model construction.
Equation (1) shows the probability distribution of pixel having some specific values Xt at time t.
where K is the number of distributions, μk,t is the mean, ωk,t represents the weight, Σk,t is the covariance matrix of the kth Gaussian in the mixture at time t, and η is a Gaussian probability density function as shown in Equation (2).
where n is the dimension of data. For simplification of the computation process, it is assumed that data of each channel are independent and have the same variance. Therefore, Equation (3) shows the covariance matrix.
The following Equations (4) and (5) update the weight, mean, and variance as shown.
where Mk,t+1 is 1 for the matched model and 0 for remaining or unmatched models, α is a learning rate, and second learning rate ρ is shown by Equation (4).
The weights are updated by the remaining Gaussians. For unmatched distribution, the weight, variance, and mean of the last distribution are replaced by , a low weight value and a high variance, respectively. Constructed background image using GMM is shown in Figure 4. Figure 5b demonstrates the foreground object obtained by background subtraction.
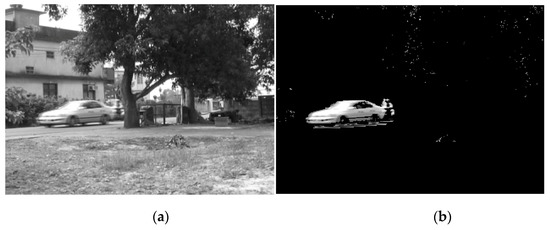
Figure 5.
Background subtraction as a result of pre-processing. (a) Original image (b) Foreground image.
2.2. Object Movement Detection
Identifying objects’ movements from video images sequence is implemented by dividing each image into non-overlapping blocks with the same size in each block in the same image. The first step in the process is finding out which blocks have gray-level changes. The GMM approach extracts foreground image y, and Equation (6) is used to computed the summation of the foreground image for each block.
where Sk is the kth block and x, y are the coordinates of the scene. T1 is the predefined threshold.
Foreground regions found by the GMM approach may have partial or full static objects. Therefore, to overcome this problem, the process calculates the temporal difference between two successive frames. In the analysis of dynamic images, if the difference image has a value of 1 for any pixel, it is considered as a moving object in the frame. Video images usually have an increased signal-to-noise ratio owing to quantification and intrinsic electronic noises. Therefore, false segmentation is produced when the difference is taken between two successive frames. Noise reduction is achieved by calculating the addition of each block to find the moving property. The block difference is defined as
where Tk is the kth block, x, y are the coordinates of the scene, f is the input image, and T2 is the predefined threshold.
If the temporal difference and value of background subtraction are more substantial than the predefined thresholds, the computation cost of the process decreases. A block image is considered a candidate containing moving objects using Equation (8).
The information of a particular block over time is considered as a “block process” in the following sections. Figure 6 illustrates some results produced by block processing.
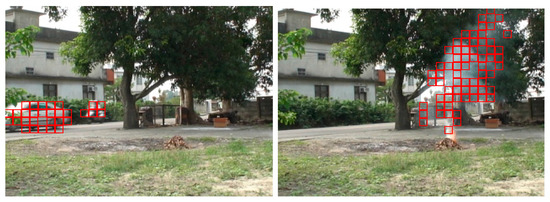
Figure 6.
Detecting moving objects as a result of a pre-processing phase.
2.3. Flame Color Analysis
Identifying the fire color model in this research uses Celik et al.’s [6] model, which is based on YCbCr color space. This model offers an error reduction of alarm rate and increased detection rate by adaptively adjusting the surrounding glare. Equation (9) shows the linear transformation between RGB and YCbCr color spaces:
where Y ranges from 16 to 235, and Cb and Cr range from 16 to 240. For a frame, average values of components Y, Cb, and Cr of the YCbCr color space are calculated by Equation (10):
where (xi, yi) represent the pixel coordinates, K represents the screen’s total pixel quantity, Ymean represents the frame’s average luminance value, Crmean represents blue average color concentration of difference components, and Cbmean represents the red average color concentration of difference components. The RGB space fire formula R > Rmean and R > G > B converted to YCbCr formula using
Therefore,
Y (x, y) represents the luminosity and F (x, y) represents the conditional function for the pixel’s compliance with the formula in Equation (12). Cr (x, y) and Cb (x, y) represents the different chroma component of red and blue, respectively, for the coordinates (x, y).
This algorithm is ideal for general yellow and red fire color. However, some fires with colors closer to white, high-intensity fire, and high temperature cannot be detected correctly. Consequently, the color model is divided into two areas by Equation (18). The divisions are called high-intensity fire (Y > 220) and regular intensity fire (Y < 220) respectively. It adjusts the conditions as shown:
The equation changes because of high intensity, and Cb and Cr values are closer to the maximum value. It is notable that from various observed fire images that the pixels with fire usually have greater luminosity than the average luminosity of the entire picture, and the red difference chroma component is greater than the average difference of the entire picture. The luminosity must be greater than the blue difference, and the red difference must be more significant than the blue difference. The fire picture statistics of the YCbCr distribution is demonstrated in Figure 7.
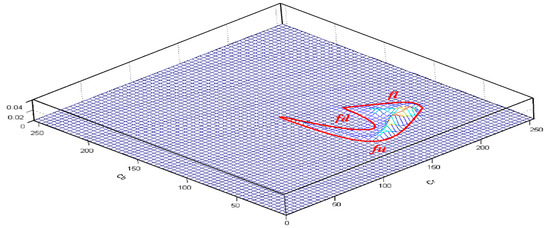
Figure 7.
Distribution of fire color in YCbCr color space.
From various fire pictures, some features can also be observed. A pixel with fire usually will have higher luminosity than the average luminosity of the entire picture, and the red difference chroma component will be higher than the average difference of the entire picture. The blue difference chroma component will be smaller than the average of the entire picture. The following formula expresses the sum of the features mentioned above:
The fire color pixel will have a value difference between the blue difference chroma component and the red difference chroma component, as in the following:
where, τ represents constant with the default range of 0 to 224. Post-modified comparison of the second equation is shown in Figure 8a,b.
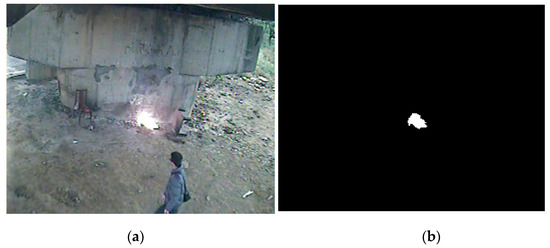
Figure 8.
Flame color modeling results. (a) Original image. (b) The resultant image based on Equations (12) and (13) under different intensity situations.
Results retrieved from the fire color model will usually include some objects that have similar colors as fire but are not fire, such as metal reflecting the fire in the picture. Thus, simply using color for analysis is not enough. Fire color is just a looser feature analysis. The experimental result is shown in Figure 9:
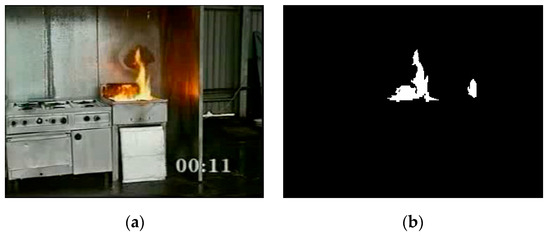
Figure 9.
Fire color analysis results. (a) Original image (b) resultant image based on Equations (12) and (13) under different intensity situations.
In the experiment, the algorithm only identified the general red and yellow fire color. For some high-temperature, high-intensity fire, close to white in color, it cannot be accurately detected. Thus, we cut the color model into two areas. One is a normal-intensity fire (Y < 220), for which we used the above algorithm. For high-intensity fires (Y > 200), we adjust the conditions as follows:
The main reason for this situation is that for high intensity, Cr and Cb values will be close to the maximum value. There will not be a sufficient gap between the two values, so it is easy for it to not comply with
The pre and post-modification comparison of these two formulas are shown in Figure 10.
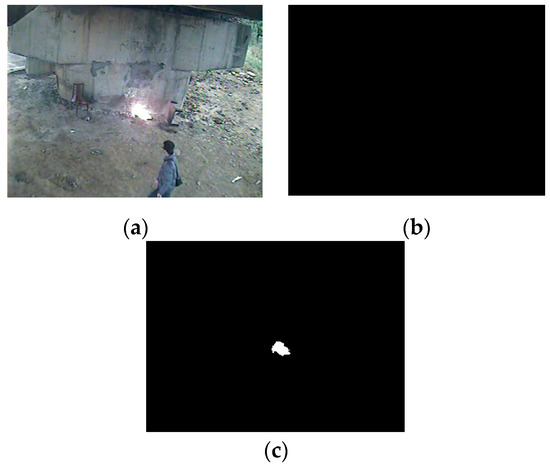
Figure 10.
High-intensity formula modification comparison (a) Original image (b) fire detection using pre-modification formula (c) fire detection using post-modification formula.
It can be seen from Figure 10 that the high-intensity fire can be detected by the modified algorithm. Conversely, false detection will increase. Since color is the first problem, other algorithms will be proposed to filter out these errors. When the pixels of the fire in the block are over the block’s total pixels by 10%, this block matches the fire color features.
2.4. Flame Source Analysis
A fire will have a burning source. Although the flame can move with the wind, the fire source location will not usually move or will expand with the fire, forming a slow movement. The burnt location will form a leftover area. Fire at the fire source contains two features, fixed position and high-intensity feature in the fire source area.
The method calculates high-intensity features by comparing average intensity of both entire image and block. If the average block intensity is higher than the average intensity of the image, then it matches the high-intensity feature of the fire starting point. Then this candidate block high-intensity state holding time is calculated. This high-intensity state must be higher than t times to match the fixed-position feature as mentioned in Equation (22):
Thus, the candidate block passes the features as shown in Equation (23):
2.5. Flame Flickering Analysis
To filter out the noise effects, grayscale image subtractions are performed t − 1 times, so the subtracted absolute value is higher than the threshold value, as shown in Equation (24):
The threshold is a preset value obtained via empirical tries. Because the method uses the block as an observation unit, a block must have a certain number of mixed intensity pixel to be considered matching this feature with a default value.
2.6. Flame Texture Analysis
Using the Flame Colour model for detection is not sufficient to filter out some objects that have a similar color to flames, for example, an orange car or yellow and red clothes. Fire is not a smooth texture pattern, as illustrated in Figure 11 Color variance can measure the texture. To differentiate the texture, Equation (27) introduces a weighted variance analysis model.
where μ is the mean value and Cr value of the observed pixel within the connecting block is represented by Xi. The value of Cr will be closer to the maximum value because of the high intensity of the observed pixel with small variation of the block. For high-intensity situations, Y > 220, which is increased by multiplying a preset value w; otherwise, w is a constant equal to 1. Thus, the variance of the candidate block is appropriately calculated. The label of a specific connecting block is represented by l. Labels help in combining complete objects, such as for a block; if the label is the same, then it can be concluded that they belong to the same object. Equation (27) represents the different variance formulas for different objects.
where the preset constant is represented by σ, which is the variance of the data collection that has the fire color model and a level of dispersion. Figure 12 shows the fire is not smooth textured.
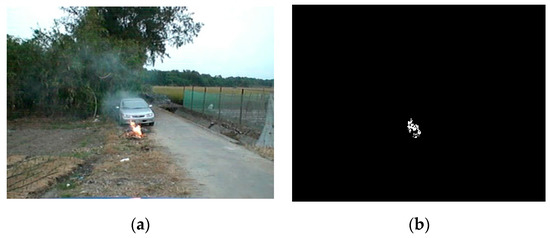
Figure 11.
Flickering analysis using the temporal difference (a) Original image (b) Temporal difference result.
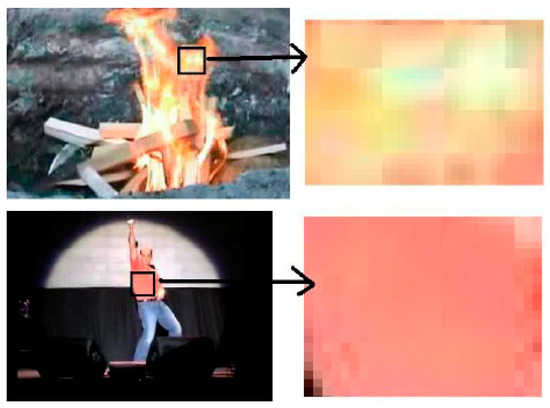
Figure 12.
Flame texture variance results of two similar images.
2.7. Flame Area Analysis
Fire area analysis is a novel proposed method. It filters out a new type of frequent false alarms. These false alarms are related to objects that have similar flame characteristics, for example, street lights and car headlights, as demonstrated in Figure 13.
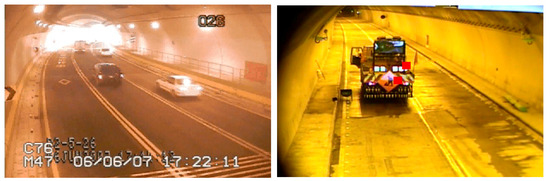
Figure 13.
False detection of flashing lights.
Flashing red light not only changes decorative features and matches the flame color, but also matches the fire’s flickering feature and fire source. However, the difference between flashing light and fire is their rate of area change. Flashing lights usually will instantly shine and instantly darken, which will have rapid changes in the area of fire color detection. Flame area analysis is implemented in two main steps (extending candidate region and wavelet analysis).
2.7.1. Extending Flame Region
A fire’s area will shrink and expand with the wind and expand with the movement of the fire, but the surface area’s sudden change rate will be at a particular rate. Therefore, a new feature analysis scheme with extended observation is needed. Since the prior local block analysis has identified candidate blocks of the high probability of flame detection, these candidate blocks are used as a benchmark to find the topmost, bottommost, leftmost, and rightmost strong candidate block and extend out one block coordinates as observation area boundary. In Figure 14, the red block in the left side Figure 14a are the strong candidate block that match the four feature analysis and the right side Figure 14b are the extended observation area.
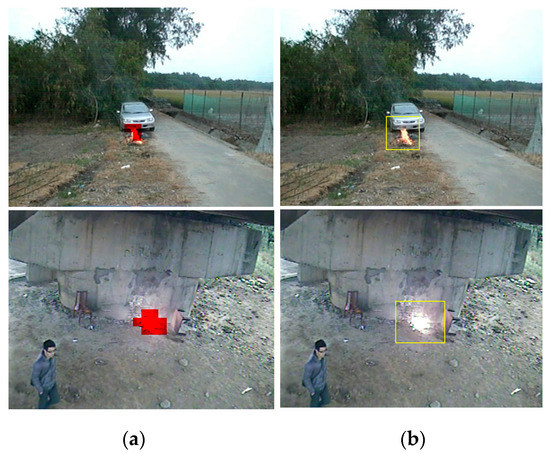
Figure 14.
(a) Images before extension and (b) images after extension.
2.7.2. 1-D Wavelet Analysis
Wavelet analysis is used for feature extraction to extract the high-frequency signal. The method converts the fire surface of the observation area into the 1D continuous signal. One-dimensional wavelet conversion analysis is short-period and considers changes in the past and future, which makes it suitable for transient signal analysis. The primary concern with a fire surface is the instantaneous rate of change of area. To determine the high frequency of the curve, a filter bank of the proposed method is fed by input signal x[n], as shown in Figure 15, where, the high pass filter coefficients are represented by h[n] and low pass filter coefficients are represented by g[n].
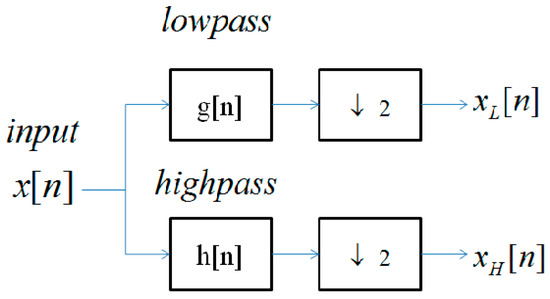
Figure 15.
Single wavelet transform.
The values of high- and low-pass filter coefficients are {1/2, 1/4, 1/2} and {−1/2, 1/4, −1/2}, respectively. Figure 16a,b show the trend of fire surface area changes and the flashing light area changes, respectively. As shown in Figure 16, changes in flashing light areas are more dramatic compared to changes in fire surface area. Equation (28) demonstrates the observations based on Figure 16.
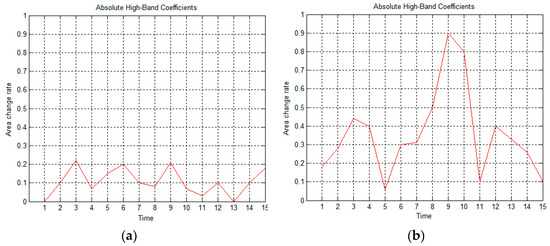
Figure 16.
Flame surface area ratio varies between the flame and non-flame object: (a) flame object. (b) non-flame object.
This feature is used to accumulate the fire surface area changing rate over a period. is representative of the amount of data, and is the feature inversely proportional to the fire probability.
2.8. Alarm Decision Unit
Image-based detection systems often receive the wrong image information from the camera due to external influences, such as sudden shaking or change in brightness caused by strong winds or fast object movement. The system adopts an alarm buffer to identify false alarms by eliminating these types of influences, as shown in Figure 17. All false alarms from the image sequence are collected by buffer. The system produces a ratio of alarm data and non-alarm data for a specific period. When the detected intervals exceed 50% of buffer size, the decision unit triggers an alarm. Meanwhile, it neglects uneven detected intervals which are related to camera noise and sudden brightness.
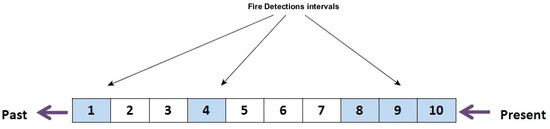
Figure 17.
Alarm decision unit.
3. Experimental Results
For experimentation, we used six non-fire videos and ten fire videos. Though the number of videos is small, the variety of videos makes the dataset perfect for training and testing. The proposed system detects only one false alarm out of ten fire videos, whereas existing systems such as Chen et al. [4] and Celik et al. [5] detects only nine fire videos each, with three and four false-alarms, respectively. The approach successfully detected videos related to global features that failed to be identified by Chen et al. and Celik fire. Thus, it shows that flame area analysis is consistent with the experimental evidence. Although this approach has a high detection rate and lowers the false alarm rate, it has a longer reaction time due to buffering information of previous detections. The proposed system is developed using C++ programming language on Windows 7 operating system installed on a computer with 2GB RAM and Intel Core i5 2.53 GHz processor. The video database has a minimum resolution of 320 × 240.
3.1. Testing the Algorithm and Accuracy Discussions
Many images of different environmental conditions are applied to this approach, including outdoor, indoor, and sunlight variation, each containing fire events, motorcycle, pedestrians, waving, bicycles, leaves, tourist coaches, and trailers. These datasets include 13,257 positive samples as fire events and 62,614 ordinary moving objects as negative samples. Equation (29) shows the detection rate and false alarm rate to understand the effects of each component in the proposed methods.
Table 1 shows the false alarm rates and detection rates of various fire detection methods without using an alarm decision unit (ADU). For detection rate, the false-positive rate is high. The fire source shows a fixed location feature and higher flame intensity. This showcases good effects in moving objects or light that does not have enough intensity. Temporal difference represents that the fire in a fixed block shows continuous movement. This feature cannot eliminate non-moving (street lights) lights but can eliminate those with fixed positions. Using global features for verification, the variance can filter out objects from fire, such as objects with smooth textures of colors like yellow and red color cars. After matching the previous feature values, the block becomes a strong candidate block and can have a high likelihood of being a fire body. Finally, the last judgment will be based on the fire surface area analysis. As shown in the table, each feature complements the other in filtering false positives. Every algorithm creates a complementary relationship with each other. Using variance as a strong feature, most false positives rates can be lowered.

Table 1.
Experimental results without ADU based on a single frame.
Table 2 represents the false alarm rate, detection rates, and reaction time by using global and flame analysis. Table 2 shows enhancement in false alarm rates by adding Arithmetic Decision Unit (ADU). The proposed method reduces the false alarm rate from 2.8% to 0.8% at the cost of increased reaction
Table 2.
Experimental results with ADU based on a single frame.
Table 3 exhibits the performance comparison of this research with the other two existing methods by Chen et al. [5] and Celik et al. [6]. The proposed method detects ten fire videos correctly, whereas existing methods could only detect nine videos each. The proposed method had only one false-alarm, whereas existing methods had three and four false alarms, respectively, for Chen et al.’s [5] and Celik et al.’s [6] methods.
Table 3.
Performance comparison results.
3.2. Detection in Different Environments
The proposed method has been tried in indoor and outdoor environments, and it performed exceptionally well in both. Figure 18, Figure 19, Figure 20, Figure 21 and Figure 22 shows the experimental setup for reflection on metal, indoor environment, outdoor environment, with high-intensity fire, and in an extremely dark area. The correct detections are marked in a red rectangle, and the false detections are identified by green. The false detection proof from the fire area analysis algorithm detects the moving objects which emit light, (e.g., cars) as shown in Figure 18. Figure 18 shows non-fire test videos, most of which are traffic videos or pedestrian videos. Since these videos generally do not have fire characteristics, no strong candidate blocks are generated, and they will not produce a global candidate fire region. Therefore, we show the foreground movement candidate block to represent that this video has a foreground moving objects. The picture of top right corner in Figure 18 is a special case. The entire screen is reddish hued, and color signal judgment becomes useless. However, we can still rely on other fire features to accurately judge if a fire exists or not. Figure 22b shows flashing red car lights. This event is in line with most of the fire features, including fire color, fire source, temporal difference, and variance analysis. The fire surface area feature was finally used for filtering out.
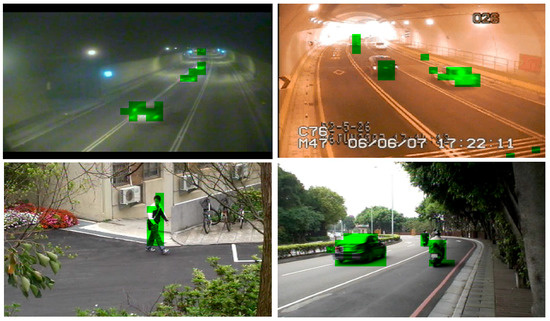
Figure 18.
False detections of moving objects.
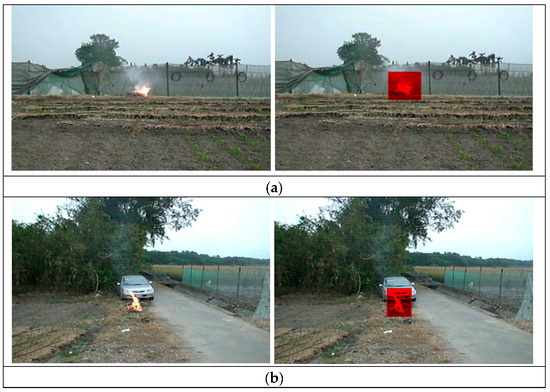
Figure 19.
Outdoor environments: (a) with wind and (b) without wind.
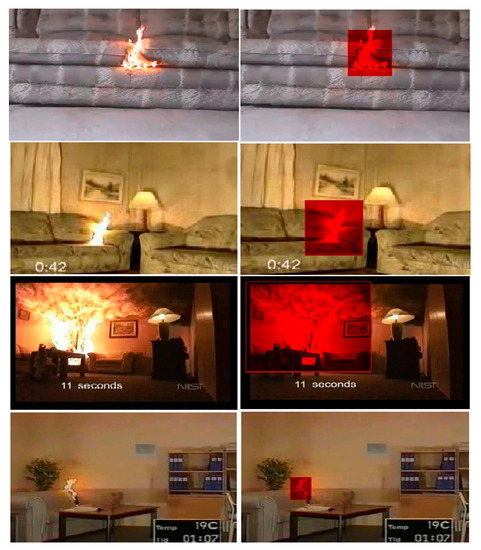
Figure 20.
Flame detection illustrates at various scenarios in different environments.
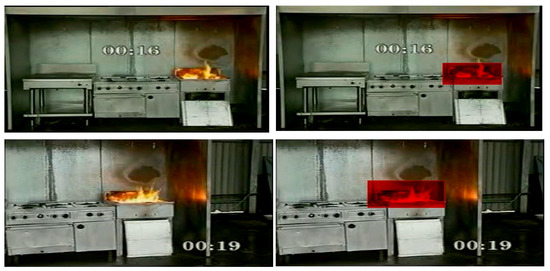
Figure 21.
Fire reflection on metal on two different time frames.
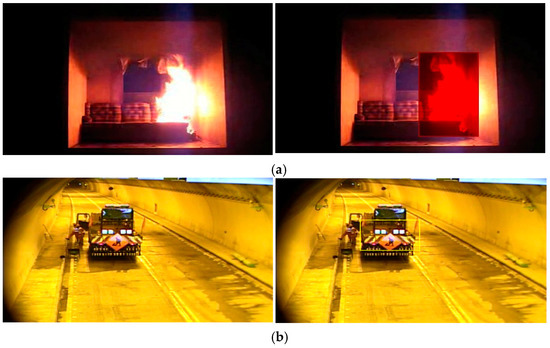
Figure 22.
Fire detection in (a) an extremely dark space and (b) flashing red light.
4. Conclusions and Future Work
The proposed system is capable of automatically determining the threshold mechanism and performing a robust block selection. It is an idealized model for fire detection because it operates in various environments by using local and global feature analysis for each candidate block along with a decision unit. The proposed work includes three local feature models. Each model calculates the fire features and filters out a specific false alarm to provide a higher decision rate. The global features are used for the analysis of flame, with surrounding blocks to identify fire objects against similar bodies with similar behavior. False alarm caused by instantaneous changes can be rectified using decision units. Proposed work can be improved further by eliminating false alarm rates caused by minor shaking of the camera due to heavy wind and different flame colors due to combustion from different fuel and gas. Moreover, smoke detection feature extraction is a viable model for early detection of forest fire, where fire does not appear in video images. For specific scenarios such as smoldering fire, detection could be used for detecting a volcanic eruption. One of the main advantages of the proposed system is its low computation complexity. Thus, the proposed system can be implemented on embedded systems for real-time applications of surveillance systems.
Author Contributions
Conceptualization, T.W.H., D.L.L, and M.P.; methodology, T.W.H., S.P., and M.P.; software, D.K.J. and M.S.M.; validation, M.S.M., A.S., D.K.J., and C.T.L.; formal analysis, T.W.H., S.P., D.L.L., A.S., and M.P.; investigation, M.S.M., A.S., D.L.L., and C.T.L.; resources, T.W.H., S.P., M.S.M., D.K.J., and M.P.; data curation, T.W.H., D.K.J., and A.S.; writing—original draft preparation, T.W.H. and S.P.; writing—review and editing, T.W.H., S.P., M.S.M., D.K.J., D.L.L., A.S., M.P., and C.T.L.; visualization, S.P., M.S.M., D.K.J., and A.S.; supervision, D.L.L. and C.T.L.; project administration, D.L.L. and M.P.; funding acquisition, D.L.L., M.P., and C.T.L. All authors have read and agreed to the published version of the manuscript.
Funding
This work was supported in part by the Australian Research Council (ARC) under Grant DP180100670 and Grant DP180100656, in part by the U.S. Army Research Laboratory under Agreement W911NF-10-2-0022, and in part by the Taiwan Ministry of Science and Technology under Grant MOST 106-2218-E-009-027-MY3 and MOST 108-2221-E-009-120-MY2.
Conflicts of Interest
The authors declare no conflict of interest.
References
- Haynes, H.J. Fire Loss in the United States During 2014; National Fire Protection Association, Fire Analysis and Research Division: Quincy, MA, USA, 2015. [Google Scholar]
- Quintiere, J.G. Principles of Fire Behavior; CRC Press: Boca Raton, FL, USA, 2016. [Google Scholar]
- Quintiere, J.G.; Wade, C.A. Compartment fire modeling. In SFPE Handbook of Fire Protection Engineering; Springer: New York, NY, USA, 2016; pp. 981–995. [Google Scholar]
- Hartin, E. Fire Behavior Indicators: Building Expertise. 2008. Available online: www.firehouse.com (accessed on 27 October 2020).
- Chen, J.; Mu, X.; Song, Y.; Yu, M.; Zhang, B. Flame recognition in video images with color and dynamic features of flames. J. Auton. Intell. 2019, 2, 30–45. [Google Scholar] [CrossRef]
- Celik, T.; Demirel, H. Fire detection in video sequences using a generic color model. Fire Saf. J. 2009, 44, 147–158. [Google Scholar] [CrossRef]
- Horng, W.B.; Peng, J.W.; Chen, C.Y. A New Image-Based Real-Time Flame Detection Method Using Color Analysis. In Proceedings of the 2005 IEEE International Conference on Networking, Sensing and Control (ICNSC), Tucson, AZ, USA, 19–22 March 2005; pp. 100–105. [Google Scholar]
- Hong, W.B.; Peng, J.W. A Fast Image-ased Fire Flame Detection Method Using Color Analysis. Tamkang J. Sci. Eng. 2008, 11, 273–285. [Google Scholar]
- Walia, G.; Gupta, A.; Rajiv, K. Intelligent fire-detection model using statistical color models data fusion with Dezert–Smarandache method. Int. J. Image Data Fusion 2013. [Google Scholar] [CrossRef]
- Zhao, Y.; Zhao, J.; Dong, E.; Chen, B.; Chen, J.; Yuan, Z.; Zhang, D. Dynamic Texture Modeling Applied on Computer Vision Based Fire Recognition. In Artificial Intelligence and Computational Intelligence; Deng, H., Miao, D., Lei, J., Wang, F.L., Eds.; Springer: Berlin/Heidelberg, Germany, 2011; pp. 545–553. [Google Scholar]
- Ebert, J.; Shipley, J. Computer vision based method for fire detection color videos. Int. J. Imaging 2009, 2, 22–34. [Google Scholar]
- Toreyin, B.U.; Dedeoglu, Y.; Gudukbay, U.; Cetin, A.E. Computer Vision-Based Method for Real-Time Fire and Flame Detection. Pattern Recognit. Lett. 2006, 27, 49–58. [Google Scholar] [CrossRef]
- Zhao, J.; Zhang, Z.; Han, S.; Qu, C.; Yuan, Z.; Zhang, D. SVM Based Forest Fire Detection Using Static and Dynamic Features. Comput. Sci. Inf. Syst. 2011, 8, 821–841. [Google Scholar] [CrossRef]
- Paygude, S.; Vyas, V. Unified dynamic texture segmentation system based on local and global spatiotemporal techniques. Int. J. Reason. Based Intell. Syst. 2019, 11, 170–180. [Google Scholar]
- Nguyen, T.T.; Nguyen, T.P.; Bouchara, F. Dynamic texture representation based on hierarchical local patterns. In International Conference on Advanced Concepts for Intelligent Vision Systems; Springer: Cham, Switzerland, 2020; pp. 277–289. [Google Scholar]
- Gunay, O.; Tasdemir, K.; Toreyin, B.U.; Cetin, A.E. Fire Detection in Video Using LMS Based Active Learning. Fire Technol. 2010, 46, 551–557. [Google Scholar] [CrossRef]
- Dimitropoulos, K.; Barmpoutis, P.; Grammalidis, N. Spatio-temporal Flame Modeling and Dynamic Texture Analysis for Automatic Video-Based Fire Detection. IEEE Trans. Circuits Syst. Video Technol. 2015, 25, 339–351. [Google Scholar] [CrossRef]
- Avula, S.B.; Badri, S.J.; Reddy, G. A Novel Forest Fire Detection System Using Fuzzy Entropy Optimized Thresholding and STN-based CNN. In Proceedings of the IEEE International Conference on COMmunication Systems & NETworkS (COMSNETS), Bengaluru, India, 7–11 January 2020; pp. 750–755. [Google Scholar]
- Manevitz, L.M.; Yousef, M. One-class SVMs for document classification. J. Mach. Learn. Res. 2001, 139–154. [Google Scholar]
- Dai Duong, H.; Nguyen, D.D.; Ngo, L.T.; Tinh, D.T. On approach to vision based fire detection based on type-2 fuzzy clustering. In Proceedings of the 2011 International Conference of Soft Computing and Pattern Recognition (SoCPaR), Dalian, China, 14–16 October 2011; pp. 51–56. [Google Scholar]
- Borges, P.V.K.; Izquierdo, E.A. Probabilistic Approach for Vision-Based Fire Detection in Videos. IEEE Trans. Circuits Syst. Video Technol. 2010, 20, 721–731. [Google Scholar] [CrossRef]
- Zhang, R.; Cheng, Y.; Li, Y.; Zhou, D.; Cheng, S. Image-based flame detection and combustion analysis for blast furnace raceway. IEEE Trans. Instrum. Meas. 2019, 68, 1120–1131. [Google Scholar] [CrossRef]
- Zhang, Z.; Zhao, J.; Zhang, D.; Qu, C.; Ke, Y.; Cai, B. Contour-Based Forest Fire Detection using FFT and Wavelet. In Proceedings of the International Conference on Computer Science and Software Engineering, Hubei, China, 12–14 December 2008; Volume 1, pp. 760–763. [Google Scholar]
- Ko, B.C.; Ham, S.J.; Nam, J.Y. Modeling and Formalization of Fuzzy Finite Automata for Detection of Irregular Fire Flames. IEEE Trans. Circuits Syst. Video Technol. 2011, 21, 1903–1912. [Google Scholar] [CrossRef]
- Gaur, A.; Singh, A.; Kumar, A.; Kumar, A.; Kapoor, K. Video Flame and Smoke Based Fire Detection Algorithms: A Literature Review. Fire Technol. 2020, 56, 1943–1980. [Google Scholar]
- Wu, H.; Wu, D.; Zhao, J. An intelligent fire detection approach through cameras based on computer vision methods. Process Saf. Environ. Prot. 2019, 127, 245–256. [Google Scholar] [CrossRef]
- Redmon, J.; Farhadi, A. Yolov3: An incremental improvement. arXiv 2018, arXiv:1804.02767. [Google Scholar]
- Li, P.; Zhao, W. Image fire detection algorithms based on convolutional neural networks. Case Stud. Therm. Eng. 2020, 19, 100625. [Google Scholar] [CrossRef]
- Mao, W.; Wang, W.; Dou, Z.; Li, Y. Fire recognition based on multi-channel convolutional neural network. Fire Technol. 2018, 54, 531–554. [Google Scholar] [CrossRef]
- Muhammad, K.; Ahmad, J.; Baik, S.W. Early fire detection using convolutional neural networks during surveillance for effective disaster management. Neurocomputing 2018, 288, 30–42. [Google Scholar] [CrossRef]
- Hu, Y.; Lu, X. Real-time video fire smoke detection by utilizing spatial-temporal ConvNet features. Multimed. Tool. Appl. 2018, 77, 29283–29301. [Google Scholar] [CrossRef]
- Govil, K.; Welch, M.L.; Ball, J.T.; Pennypacker, C.R. Preliminary Results from a Wildfire Detection System Using Deep Learning on Remote Camera Images. Remote Sens. 2020, 12, 16631. [Google Scholar] [CrossRef]
Publisher’s Note: MDPI stays neutral with regard to jurisdictional claims in published maps and institutional affiliations. |
© 2020 by the authors. Licensee MDPI, Basel, Switzerland. This article is an open access article distributed under the terms and conditions of the Creative Commons Attribution (CC BY) license (http://creativecommons.org/licenses/by/4.0/).