Article

Decarbonizing Maritime Transport: The Importance of Engine Technology and Regulations for LNG to Serve as a Transition Fuel

1
SINTEF Ocean, Marine Technology Centre, 7465 Trondheim, Norway
2
Business and Management Science, Norwegian School of Economics (NHH), 5045 Bergen, Norway
*
Author to whom correspondence should be addressed.
Sustainability 2020, 12(21), 8793; https://doi.org/10.3390/su12218793
Submission received: 11 September 2020 / Revised: 12 October 2020 / Accepted: 20 October 2020 / Published: 22 October 2020
(This article belongs to the Special Issue Reducing GHG Emissions in Shipping-Measures and Policy)

Abstract

:
Current Greenhous gas emissions (GHG) from maritime transport represent around 3% of global anthropogenic GHG emissions and will have to be cut in half by 2050 to meet Paris agreement goals. Liquefied natural gas (LNG) is by many seen as a potential transition fuel for decarbonizing shipping. Its favorable hydrogen to carbon ratio compared to diesel (marine gas oil, MGO) or bunker fuel (heavy fuel oil, HFO) translates directly into lower carbon emissions per kilowatt produced. However, these gains may be nullified once one includes the higher Well-to-tank emissions (WTT) of the LNG supply chain and the vessel’s un-combusted methane slip (CH4) from its combustion engine. Previous studies have tended to focus either on greenhouse gas emissions from LNG in a Well-to-wake (WTW) perspective, or on alternative engine technologies and their impact on the vessel’s Tank-to-wake emissions (TTW). This study investigates under what conditions LNG can serve as a transition fuel in the decarbonization of maritime transport, while ensuring the lowest possible additional global warming impact. Transition refers to the process of moving away from fossil fuels towards new and low carbon fuels and engine technologies. Our results show: First, the importance of applying appropriate engine technologies to maximize GHG reductions; Second, that applying best engine technologies is not economically profitable; Third, how regulations could be amended to reward best engine technologies. Importantly, while the GHG reduction of LNG even with best engine technology (dual fuel diesel engine) are limited, ships with these engines can with economically modest modification switch to ammonia produced with renewable energy when it becomes available in sufficient amounts.

1. Introduction

Greenhouse gas emissions (GHG) from maritime transport are estimated at around one billion-ton carbon dioxide equivalents (CO2 eq.). This accounts for around 3% of total anthropogenic GHG emissions, a fairly stable share according to the last three GHG Studies of the International Maritime Organization (IMO) [1,2,3]. These emissions will have to be reduced by at least 50% up to 2050, if a pathway reflecting the Paris agreements [4] shall be reached [5]. The main source of emissions from ships is the exhaust gas from its combustion engines, followed by the emissions from producing the ship fuel. Of these exhaust gases, carbon dioxide (CO2) affects climate, while carbon monoxide (CO), sulfur oxides (SOx), nitrogen oxides (NOx), methane (CH4) and particulate matters including Black Carbon (BC) have both global climate effects and regional and local environmental impacts on human health and nature.
Metrics that compare exhaust gases based on their global warming potential (GWP), reported as "CO2 equivalents", are used to show their contributions to climate change [6]. GWP gives negative weights to exhaust gases and particles that have a cooling effect, and positive weights to those that have a warming effect. The GWP values as provided by the International Panel on Climate Change (IPCC) in their Assessment Reports (AR), for which AR 5 is the latest [7], are based on the most recent scientific work, and therefore recommended as a characterization factor of climate impact in life-cycle assessment (LCA) studies [8]. It is worth pointing out that the choice of metrics between GWP and an alternative one, Global Temperature change Potential (GTP), is still under debate [9,10]. GWP estimate the heat absorbed by greenhouse gas, whereas GTP estimate the resulting rise in surface temperature. They claim to be more aligned with the temperature target of the Paris Agreement [10,11,12], and some studies from other sectors use GTP100 instead of GWP100 [13]. However, within the maritime sector or the transport sector, the main focus is on GWP and few comparisons are made that include GTP, in which case the assumption is that GTP 40 equals GWP 100 when LNG is compared against MGO (diesel) [14].
For emissions contributing to air pollution, locally and regionally, there is an accepted consensus that natural gas (LNG) delivers major reductions when the fuel is combusted in the ship’s engines (or gas turbines) compared to diesel (marine gas oil, MGO) and traditional bunker fuel (heavy fuel oil, HFO) [15,16]. LNG does not contain sulfur and thus there are no emissions of sulfur oxides (SOx). Emissions of Particulate Matter (PM) are also much lower from combustion of LNG. Emission of Nitrogen Oxides (NOx) is governed by combustion process parameters, with temperature being the dominant parameter. Thus, NOx emissions will vary depending on the engine technology and is not directly related to the fuel. Using LNG in low pressure Otto-process engines typically results in very low NOx emissions. It was these advantages which triggered the first development projects of LNG for maritime applications in the late 1980s. In addition, with its high hydrogen-to-carbon ratio, LNG is often seen as a promising option to reduce maritime GHG emissions. If one estimates emissions and energy based on the combustion stage only, LNG results in about 25% lower CO2 emissions than conventional fuels like diesel or bunker fuel. Such estimates are called Tank-to-wake (TTW) [14]. When one includes Well-to-tank (WTT) estimates of emissions for the LNG supply chain (from extraction through logistics to the vessel’s tanks) as well as un-combusted methane (CH4) from the ship’s engine(s), these additional emissions will reduce and in the worst case more than nullify any Greenhouse gas (GHG) gains from LNG relative to HFO or MGO, as documented in recent studies of life-cycle emissions from marine engines [17,18,19].
Un-combusted methane from ships engine is one of many sources to the world’s increasing global methane emissions, where the rising atmospheric methane levels represent a major challenge in the effort to limit global warming [20,21,22,23]. Methane atmospheric concentration levels have drastically increased since the industrial revolution and almost tripled. In comparison the CO2 concentration in the atmosphere, which tends to get most of the focus in the climate change debate has increased much less, i.e., by 50% over the same period. This evolution is graphically represented in Figure 1, showing the atmospheric gas concentrations of CO2, N2O and CH4 from 1750 to 2020, in absolute values on the left side of the figure and percentage increase on the right side.
While the main source of anthropogenic methane emissions is the agricultural sector, accounting for more than half of the global CH4 manmade emissions [20], the maritime transport sector is experiencing a rapidly growth in methane emissions, with no signs of stabilization in the future. The latest IMO GHG Study [3] reports a 150% growth in methane emissions from ships between 2012 and 2018, mostly due to increased number of LNG fueled vessels and claims a need for IMO to regulate methane emissions.
Overall, in the public debate, LNG seems to be treated as a bipolar issue. Some studies argue that all LNG usage are beneficial regarding both GHG and local air quality. In contrast, other studies tend to argue against LNG due to its high methane slip through the whole Well-to-tank chain. There seems to be few, if any, that try to describe the issue of LNG from a middle of the road perspective. Although LNG as fuel itself does not decarbonize maritime transport, unlike carbon-neutral fuels, its contribution to a decarbonization process is not negligeable. The main motivation for this study has been to investigate how LNG can serve as a transition fuel to decarbonize maritime transport. Ideally this requires delivering both short term GHG reductions and engine solutions and tank arrangements which easily can be modified to run on very low or zero carbon fuels, such as ammonia produced from renewable sources, when these become available.
After a review of recent research presented in Section 2, the methodology applied in the present study is described in Section 3. The technical and environmental analysis and results are presented in Section 4, followed by economic analysis and results in Section 5 and conclusions in Section 6.

2. Literature Review

Previous studies of marine fuels have used both simplified and more advanced life-cycle assessment (LCA) methodology to assess environmental impacts from fuel extraction and processing to combustion in the ship’s engines, as documented in earlier review of potential and life-cycle assessment of GHG emissions [26,27,28]. Life cycle assessment enables evaluation of a product environmental performance throughout its whole life cycle from raw materials extraction, through production, usage, end-of-life treatment and final disposal. When it comes to the scope of marine fuel life-cycle studies, previous studies on LNG have tended to focus either on greenhouse gas emissions from LNG in a Well-to-wake (WTW) perspective, or on alternative engine technologies and their impact on the vessel’s Tank-to-wake emissions (TTW), and fewer studies have considered Well-to-wake emissions (WTT). Previous studies can therefore be grouped into three main categories:
(1)
Well-to-tank (WTT) studies which for a conventional fuel include the whole upstream chain from production, processing and transport to the refinery, refining, transport to the ship and bunkering operations. For LNG, it includes gas production, processing, liquefaction and transport to the final customer. JRC (2013) [29], Exergia (2015) [30], GREET (2018) [31] and Alvarez (2018) [32], are examples of studies with a focus on the WTT supply chains.
(2)
Tank-to-wake studies (TTW), with focus on the combustion of marine fuels as a function of engine technology and the fuel. These studies have often focused on existing emission control areas (ECAs), such as in North Europe or North America and their potential extensions [33,34,35,36,37,38]. Or, they have focused on development of alternative technologies and thermal energy efficiency related to unburnt hydrocarbons, such as the methane slip [15,16,39,40,41,42,43].
(3)
Well-to-wake (WTW) studies which assess the overall emissions from the fuel supply and the fuel combustion in the assessed ship engines. Compared to full LCA studies, the construction and decommissioning phase for the oil and gas chains are excluded [35,44,45,46,47,48]. More WTW studies of marine fuels have been published recently. Hua et al. (2019) [49] proposed a new model for life cycle emissions estimation, applied to 10 post-Panamax container ships, and comparing LNG against HFO. El Houjairi et al. (2019) [50] compared HFO, MGO and LNG on considering distinct fuel supply chains and combining a set of bottom-up engineering models for detail GHG estimations. Similarly, Sharafian et al. (2019) [51] conducted life cycle assessment of GHG emissions with HFO versus LNG on a WTW basis. Hwang et al. (2019) [52] considered distinct fuel supply chains for WTT estimations using a case of a 50,000 dwt Bulk Carrier for TTW estimations. El Houjairi et al. (2019) [50], Hwang et al. (2019) [52] and Sharafian et al. (2019) [51] all highlighted that un-combusted methane reduces LNG’s GHG advantage compared to diesel and bunker oil. Thinkstep (2019) [14], Lindstad (2019) [17], ICCT (2020) [18] and Lindstad and Rialland (2020) [19] compared LNG to conventional fuel options which all meet the 2020 sulfur cap of maximum 0.5% globally (MGO, VLSFO—very low sulfur fuel oil; HFO in combination with an Exhaust gas scrubber) on a WTW basis for alternative engine technologies. The issue of methane slip and uncertainty associated is acknowledged across sectors and has also been raised in studies of road transportation [53,54,55].
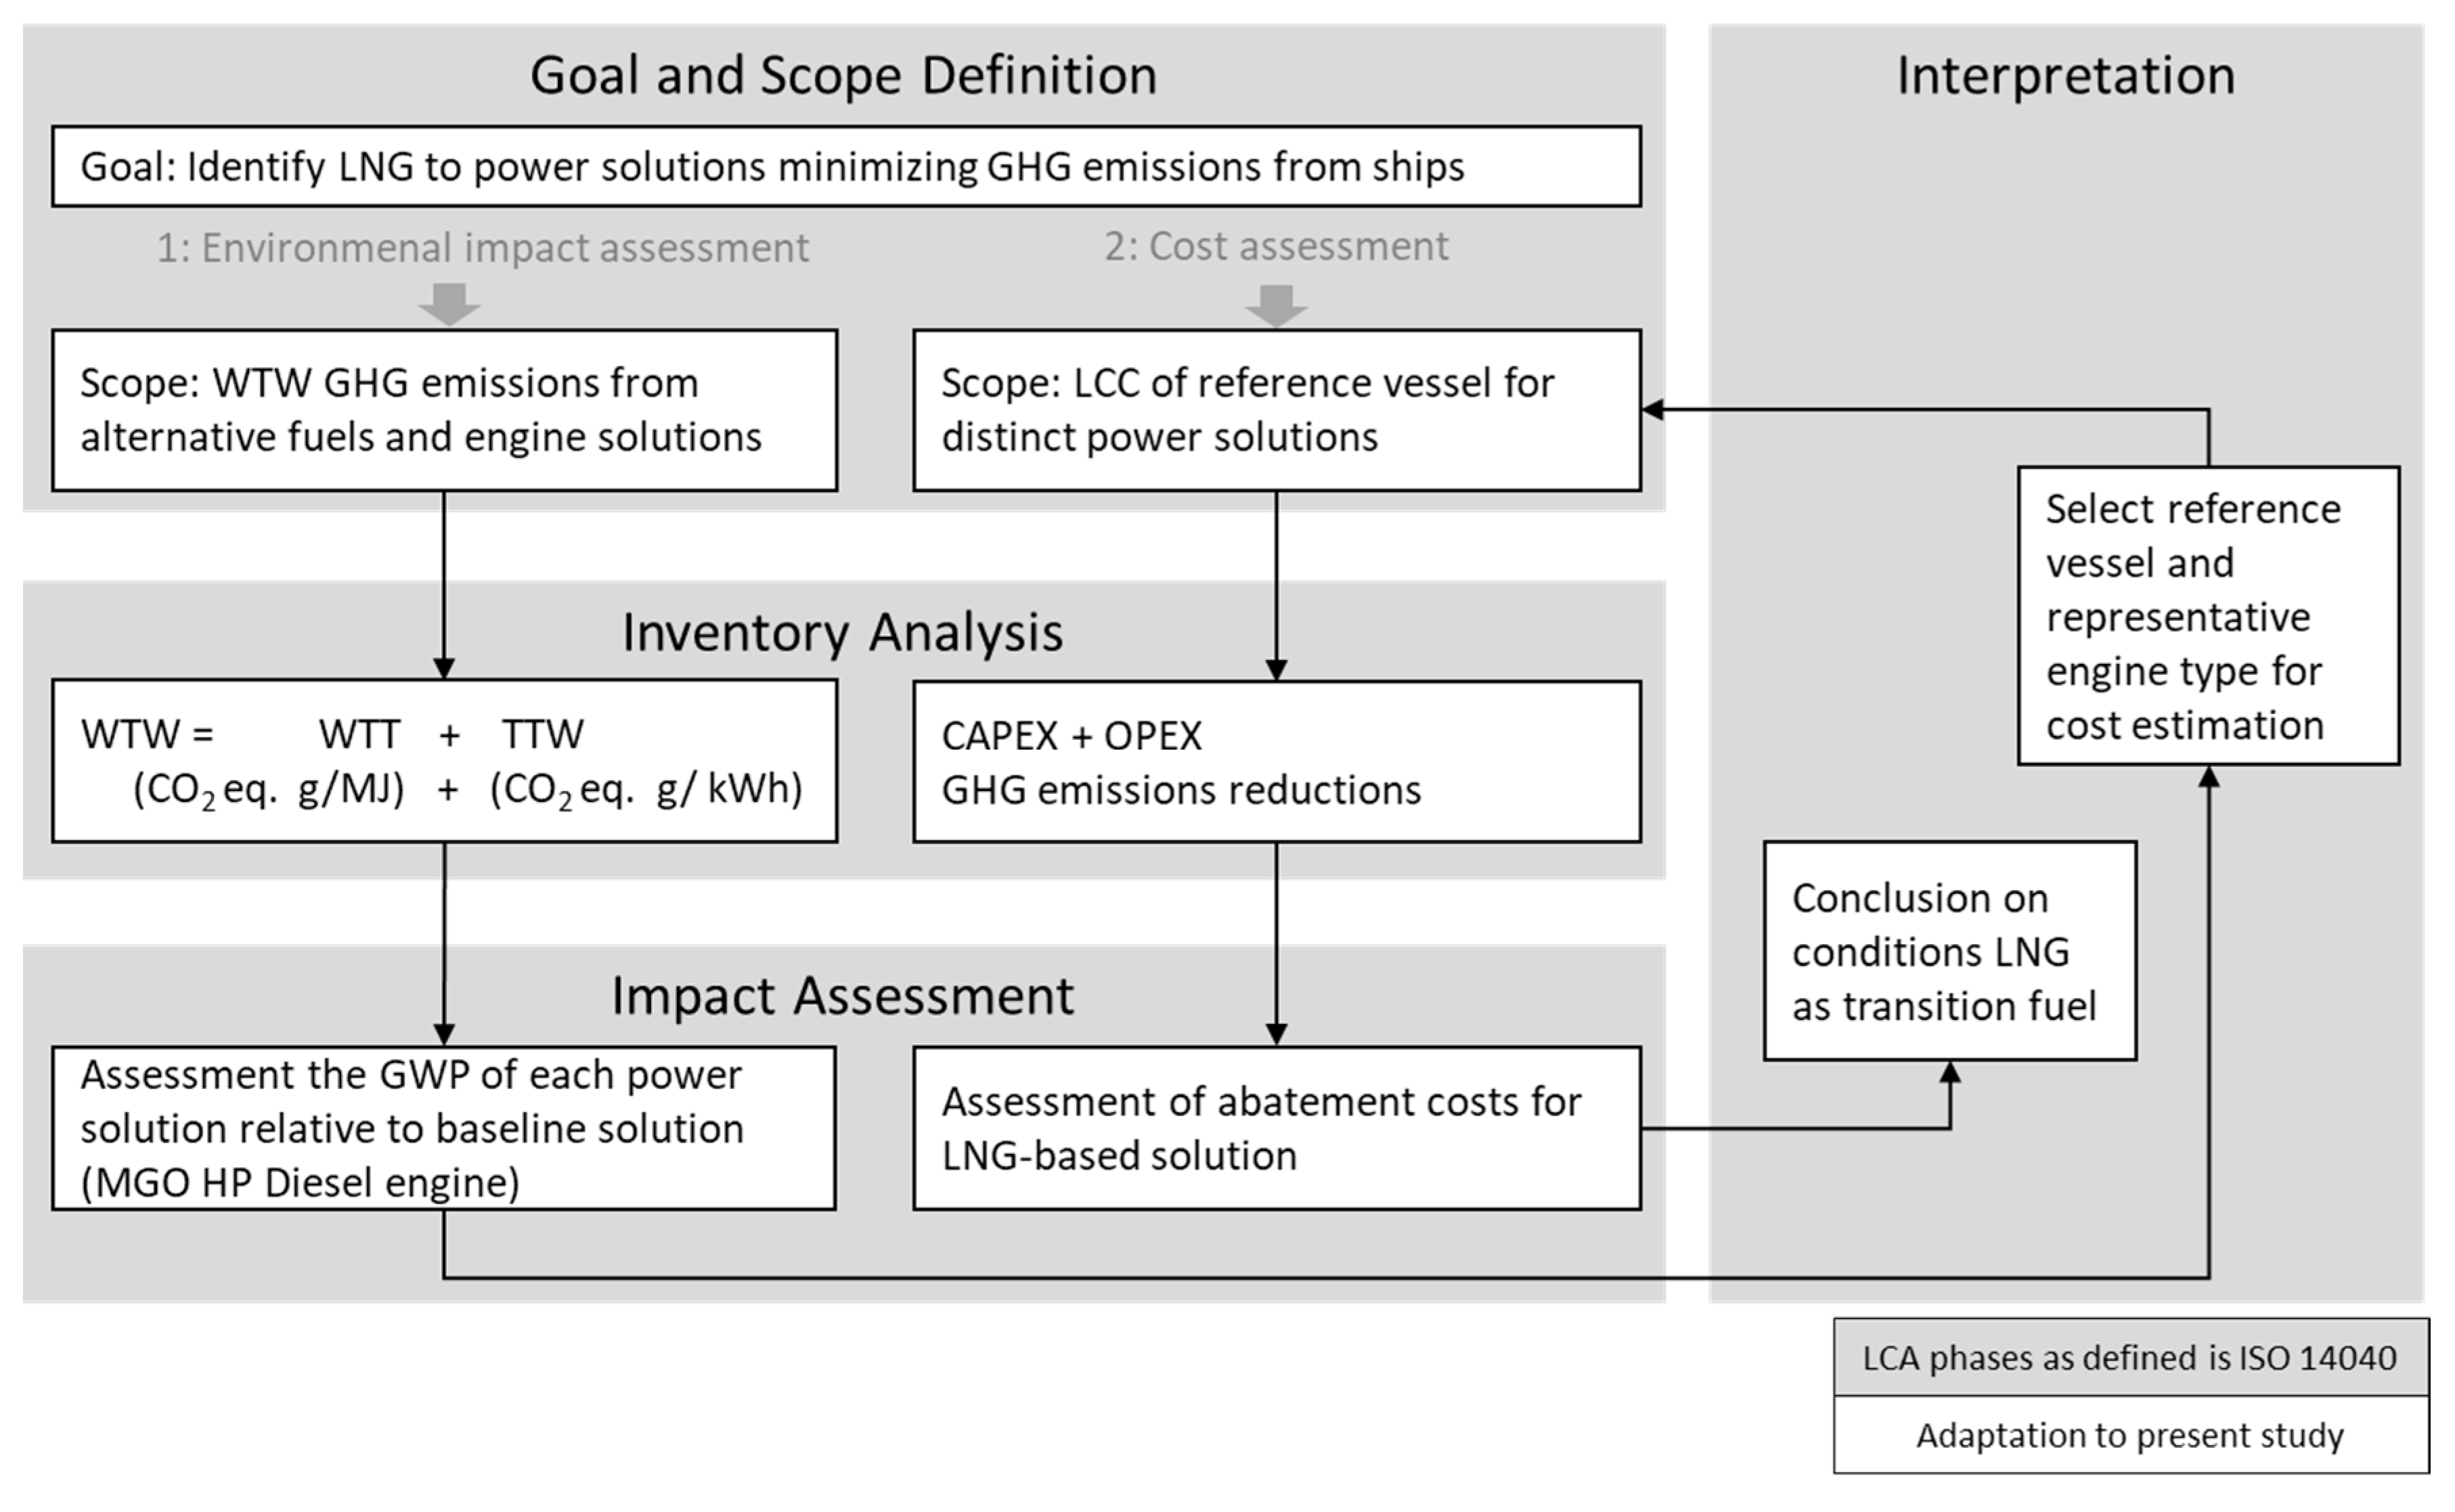
3. Methodology

The present study aims at identifying under which conditions LNG can serve as a transition fuel in the decarbonization of maritime transport, with the lowest possible increase in climate impact and lowest possible increase in cost compared to traditional oil based engine solutions.
To do so, we conduct a LCA of alternative power solutions, following the LCA process as defined by ISO LCA guidelines (14040) [56]: goal and scope definition, inventory analysis, impact assessment and interpretation. This framework is similar to the one applied by Hwang et al. (2019) [52] and Dong and Cai (2019) [57] in their studies of maritime technology solutions. In the present study, the LCA consists of WTW GHG emissions, from the fuel production to combustion, using CO2 equivalents per kWh as a common criterion. The WTW approach is generally preferred for assessing fuels in terms of potential GHG and energy savings [29,58]. Construction and decommissioning phases of fuel production units and energy systems are therefore not part of the analysis.
The present study includes first an environmental WTW assessment of distinct power solutions, followed by an economic assessment of a reference vessel, as shown in Figure 2. The focus was on identifying appropriate fuel/engine solutions for lowering GHG emissions. The fuels assessed, in order of refinement and—typically—cost were the traditional Heavy Fuel Oil (HFO), followed by two finer alternatives: Marine Gas Oil and Very Low-Sulfur Oil (MGO and VLSFO), finally followed by Liquefied Natural Gas (LNG). The engine solutions considered were high pressure diesel (HP Diesel) and low-pressure Otto dual fuels (LP Otto DF) engines, which were 2- and 4- strokes types. The combination fuels/engines selected for the analysis are all compliant with present IMO air emission regulations. For the economic assessment, the scope was narrowed down to one vessel type Supramax dry bulker 63000 dwt and one engine type. Globally there are around 3000 Supramax vessels which together perform nearly 10% of the world’s sea freight work measured in tons of nautical miles [59]. While this example is not representative of the global fleet and limits the possibility to generalize the results, it is a very relevant case and covers the largest segment in terms of type and size category.
The WTW assessment was divided into well-to-tank (WTT) and tank-to-wake (TTW). The WTT emissions expressed in gram CO2 eq. per MJ, both in a 20- and a 100-year time perspective (GWP20 and GWP100), are identified through a review of previous studies. No distinction in fuel pathway was made for each of the fuel considered, but the range of values reported was considered for sensitivity analysis. The TTW and resulting WTW were expressed in CO2 eq./kWh, to avoid the dependency on operational parameters such as load factor necessary for estimating emissions per transport work. The main parameters used for calculation of WTW emissions are shown in Table 1.
The economic impact analysis includes capital, operational and fuel cost. Capital and operational expenditures (CAPEX and OPEX) for a reference vessel (newbuild with Diesel engine and SCR) are identified for alternative engine solutions based on published data and in-house knowledge.

4. Technical and Environmental Analysis and Results

This section contains the following sub-sections: Well-to-tank (WTT) emissions; Engine technology; Methane slip; Well-to-wake (WTW) emissions for 2-stroke engines and 4-stroke engines; and is concluded with a section comparing the results of this study with previous studies.

4.1. Well-to-Tank (WTT) Emissions

WTT emissions includes all emissions from the production of the fuels and the transport needed to deliver them into the ships fuel tanks. Thinkstep (2019) [14], ICCT (2020) [18], Lindstad and Rialland (2020) [19] all found that estimates of WTT emissions vary widely across previous studies both for LNG only and when LNG is compared with conventional fuels. While there might be good reasons for some of these variations, we need the relative differences between the fuels to make fair WTW comparisons. Table 2 contains the WTT emissions values in CO2 eq. with both GWP100 and GWP20 for LNG, versus conventional fuels applied by recent studies [14,17,18] and for GWP 100 from three studies performed in the previous 5–7 years [29,30,60]. In this study, MGO served as the reference fuel, which implies that all relative differences are quoted versus MGO.
The main observations from Table 2 are that when we divide the LNG value on the MGO value for each study, the study results are quite close, i.e., that WTT emissions for LNG are 24–35% higher than for MGO with a 100 year time perspective and 40–57% higher than MGO with a 20 year time perspective. The Thinkstep (2019) [14] report is well known and publicly available, and its WTT figures for LNG, MGO and VLSFO are within the main range of values published. Thus, we used them for the calculations in this study.
For HFO, there is a large variation in Well-to-tank GHG emission estimates. This is due to differences in allocation principles and due to the chemical composition of the crude in different region, i.e., sweet easily refined North Sea crude oil, versus sour crude oil with a higher sulfur content from oil-sand. Further, transforming all the crude into distillates at modern highly advanced refineries tends to come at a high energy consumption, compared to just leaving a part of it as a heavy fuel oil to be burnt in ship engines or at power stations [61,62,63]. Due to this, a main argument for scrubbers is that it enables continued use of HFO from less advanced refineries, which have lower GHG emissions per ton of oil refined, than refineries with advanced processes and equipment to convert the traditional bottom of the barrel into distillates such as MGO. For these reasons, we used the values developed by Lindstad (2019) [17] of 9.6 grams of CO2 eq. per MJ for HFO (which is at the same level as the 9.8 found by Verbeek and Verbeek (2015) [60]) to fully exploit the maximum GHG reduction potential by using HFO in a combination with scrubbers.

4.2. Tank-to-Wake (TTW) Emissions

4.2.1. Engine Technology

HFO, VLSFO and MGO (Heavy Fuel Oil, Very Low Sulfur Fuel Oil, and Marine Gas Oil) are combusted in traditional diesel engines, or in dual fuel engines. Liquefied Natural Gas (LNG) is burnt in dual fuel engines, either in low pressure (Otto) engines or in high-pressure (diesel) engines. Dual fuel means that the engine can run on both liquid and gaseous fuels.
In a high-pressure dual fuel diesel engine, LNG is injected at a pressure of 300–350 bar and ignited by a small amount of diesel. The resulting combustion is nearly complete. This implies that a nearly zero methane slip can be achieved throughout the load range of the engine by proper design. Another benefit of a dual fuel diesel engine is that it can burn conventional fuels, biofuels, LNG, LPG and ammonia, all with a high and consistent thermal energy efficiency. Some of these fuels will require modifications of the engine injection and control systems, but the engine is prepared for it, so the required modifications are very moderate in comparison to replacing the whole engine and fuel system. The diesel process runs with high combustion temperatures and thus produce NOx emissions. To meet IMO Tier 3 NOx requirements, high-pressure dual fuel engines require add-on processes and equipment such as Selective Catalytic Reduction (SCR).
In a low-pressure dual fuel engine, the LNG is injected under low pressure, comparable to the Otto cycle (petrol engine). A benefit of the low-pressure is that it gives low NOx emissions, and no additional treatment technologies are needed to meet IMO tier 3 NOx requirements. A disadvantage with the dual fuel Otto engine is that the methane slip (due to unburnt methane) is much higher than for the diesel dual fuel engine, both at high and low engine loads. The methane slip at medium and high loads originates from the pre-mixing of air and fuel, allowing the air/fuel mix to enter regions of the cylinder where combustion will not occur, i.e., crevices and cylinder wall [43]. At low loads (25% or less), achieving complete combustion is even more challenging, due to there being a much lower fuel-air ratio. This allows bulk quenching in the coldest areas of the combustion chamber [64], resulting in high methane slip and hence also higher fuel consumption [41]. Adding it all up, thermal efficiency tends to be lower for the Otto dual fuel engines compared to the diesel engine option. For more insight, see [16]. When an Otto dual fuel engine runs on diesel, due to fuel prices or lack of LNG availability, it also implies a higher fuel consumption compared to a conventional diesel engine, because diesel is best suited to be combusted in a diesel process. In this study, we therefore used a higher thermal efficiency for the diesel engine compared to the dual fuel (Otto) LNG engine when both run on diesel, which are in line with ICCT (2020) [18] and engine manufactures specifications. When the Otto dual fuel engine runs on LNG, we assumed that the thermal efficiency in theory will be the same as for a diesel engine but only adjusted for the methane slip, which in this setting wasted fuel.
Currently, high-pressure dual fuel diesel engines are available in the market only for 2-stroke engines. Two stroke engines are preferred engine types for tankers, bulkers and container vessels from about the 5000 kW size upwards. The 2-stroke advantage is a slightly lower fuel consumption per kWh compared to the 4-strokes. The disadvantage is that 2 -stroke engines require a larger height inside the ship and have a 10% to 20% higher cost. The required height is typically not available on Ro-Ro vessels due to the ramps or in Cruise vessels, where space has great value for passengers. Nevertheless, there is also ongoing research and development activities on developing high pressure solutions for the 4-stroke market. For these reasons, we have included 4-stroke diesel dual fuel engines in this study.

4.2.2. Methane Slip

Un-combusted methane gives a GHG impact that is 28–34 times higher per gram emitted than CO2 over a 100-year perspective [7]. With a short-term horizon of 20 years, the warming impact of CH4 is 85 times larger per gram than CO2 [7]. The methane slip is typically measured either based on engine laboratory testing, when running according to the NOx test cycle [14], or from running the same test cycle on vessels at sea with real sea conditions (not exceeding Beaufort 6), as performed by [41]. In a NOx test, the engine operates at high power, i.e., at 75% and 100% power for 70% of the time and at 25% and 50% power for the remaining 30% of the time. With high power the methane slip is low, but when power decreases below 50%, the methane slip increases significantly with Otto based dual fuel engines [16,41]. In contrast to the NOx test cycle, today’s vessels typically operate at less than 75% power [65] and only at high power when needed for safe maneuvering under difficult conditions, or when they really have to speed up to ensure early passage through canals or locks, or to secure business. This implies that using test bed cycles for methane slip generally will underestimate a ship’s real methane emissions when it is running on LNG. In addition, testbed values from laboratory tests are generally lower than values measured by the same testing cycle on board vessels at sea, as documented by Stenersen and Thonstad (2017) in their report for the Norwegian NOx-fund. Table 3 shows methane slip figures of the distinct engine types based on previous published studies and values, either as one specific value or as a range. Moreover, the last line displays the values applied in this paper.

4.3. Well-to-Wake (WTW) Emissions

In this section, we establish the Well-to-wake (WTW) emissions for 2- and 4-stroke engines based on the WTT and TTW figures reported in the previous sections.

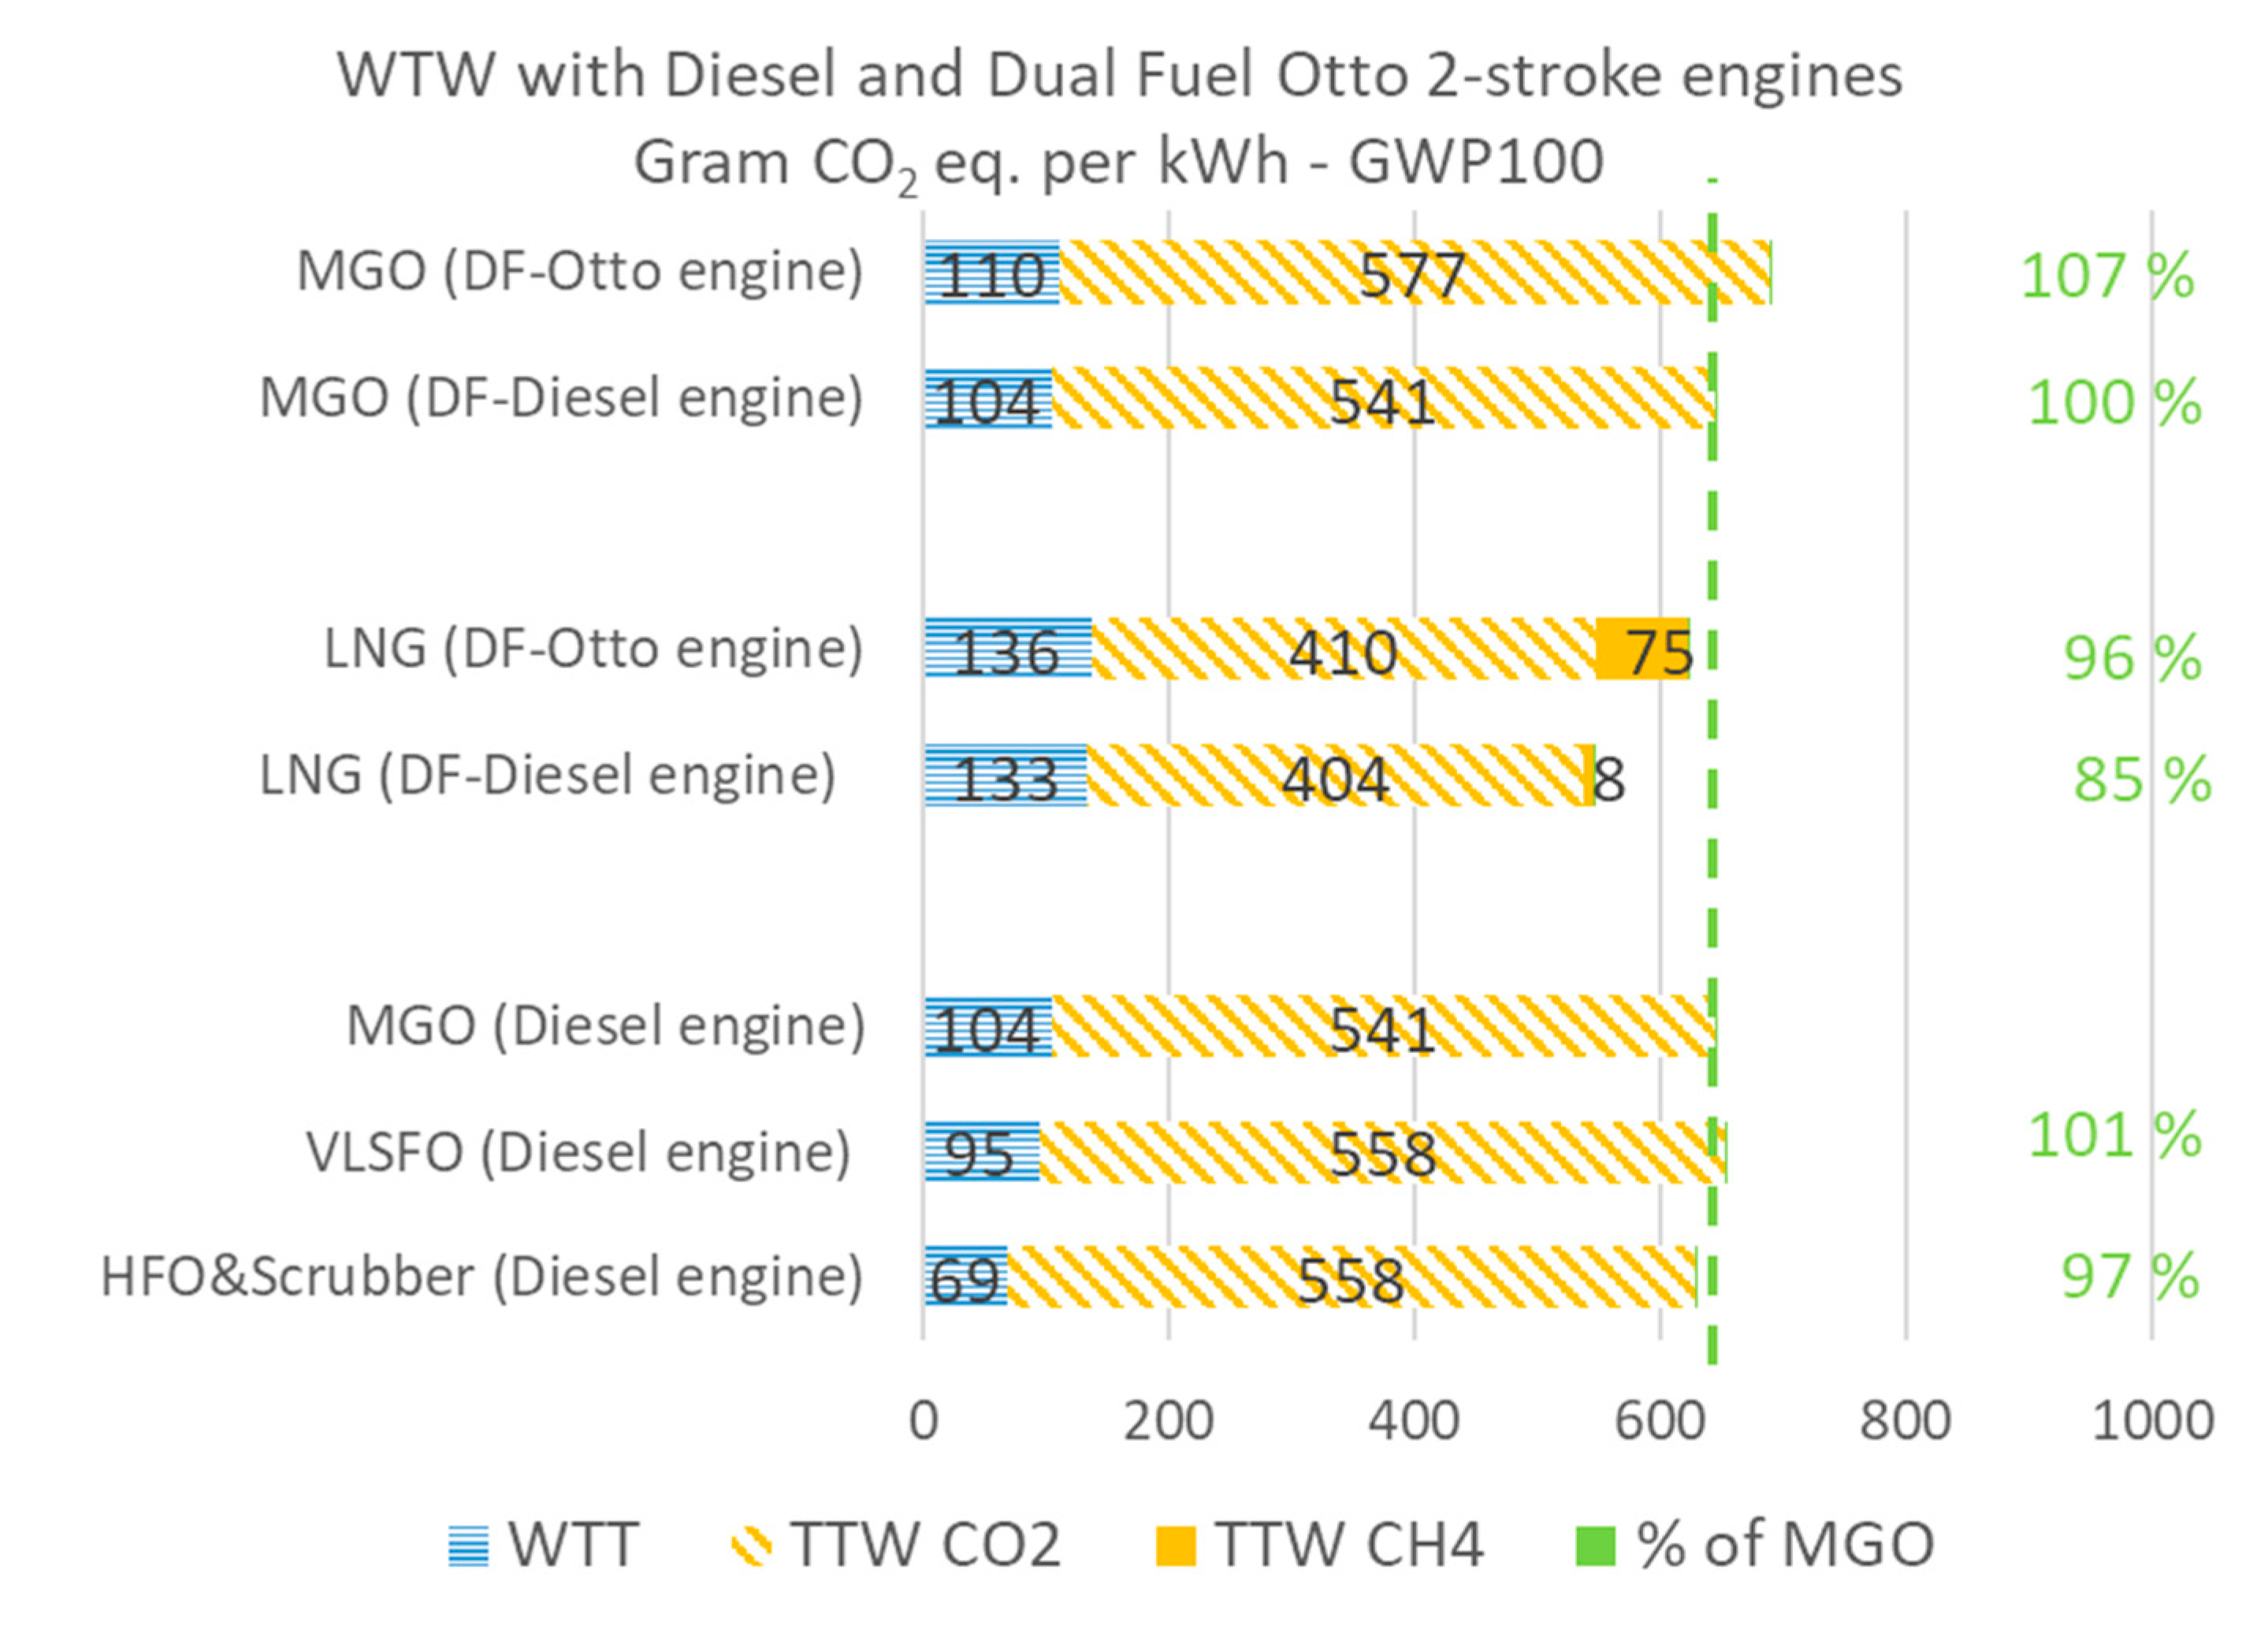
4.3.1. Well-to-Wake (WTW) Emissions for 2-Stroke Engines

Notably, 2-stroke engines include pure diesel engines, diesel dual fuel engines and Otto dual fuel engines. After combining fuel and engines, we obtained 7 options. The first set of options is the diesel engine on HFO & Scrubber, VLSFO or MGO; the second set of options is the diesel dual fuel engine running on LNG or on diesel; the third set of options is the Otto dual fuel engine running on LNG or on diesel. The main input values and factors used in the calculation for each of these options are as shown in Table 4. These are based on the inputs described in the three previous sections. In the first column, the nature of the value is indicated as number 1 (one) for general consensus values such as a lower calorific value for each fuel, number 2 (two) for the values compounded in the previous sections of this chapter and number 3 (three) for calculated values.
From Table 4 we observe: First, that LNG combusted in a dual fuel diesel engine reduces GHG emissions with 9–15% compared to MGO; Second that LNG combusted in a dual fuel Otto-engine increases GHG emissions significantly in a short-term horizon (GWP20), and even with a long-term horizon (GWP100), it gives only marginal reductions compared to MGO. Third, when the Otto dual fuel engine run purely on MGO, the GHG emissions increase by around 7% compared to when the MGO is combusted in either a pure diesel engine or a dual fuel diesel engine. These results are visualized in Figure 3; Figure 4, displaying values for GWP20 and GWP100, respectively in grams of CO2 eq. per kWh for WTT, TTW and methane slip for the investigated fuel and engine combinations. Finally, the vertical dashed line shows the WTW value for the reference fuel, i.e., MGO, and the green number relative value for each fuel in % of the MGO-baseline.

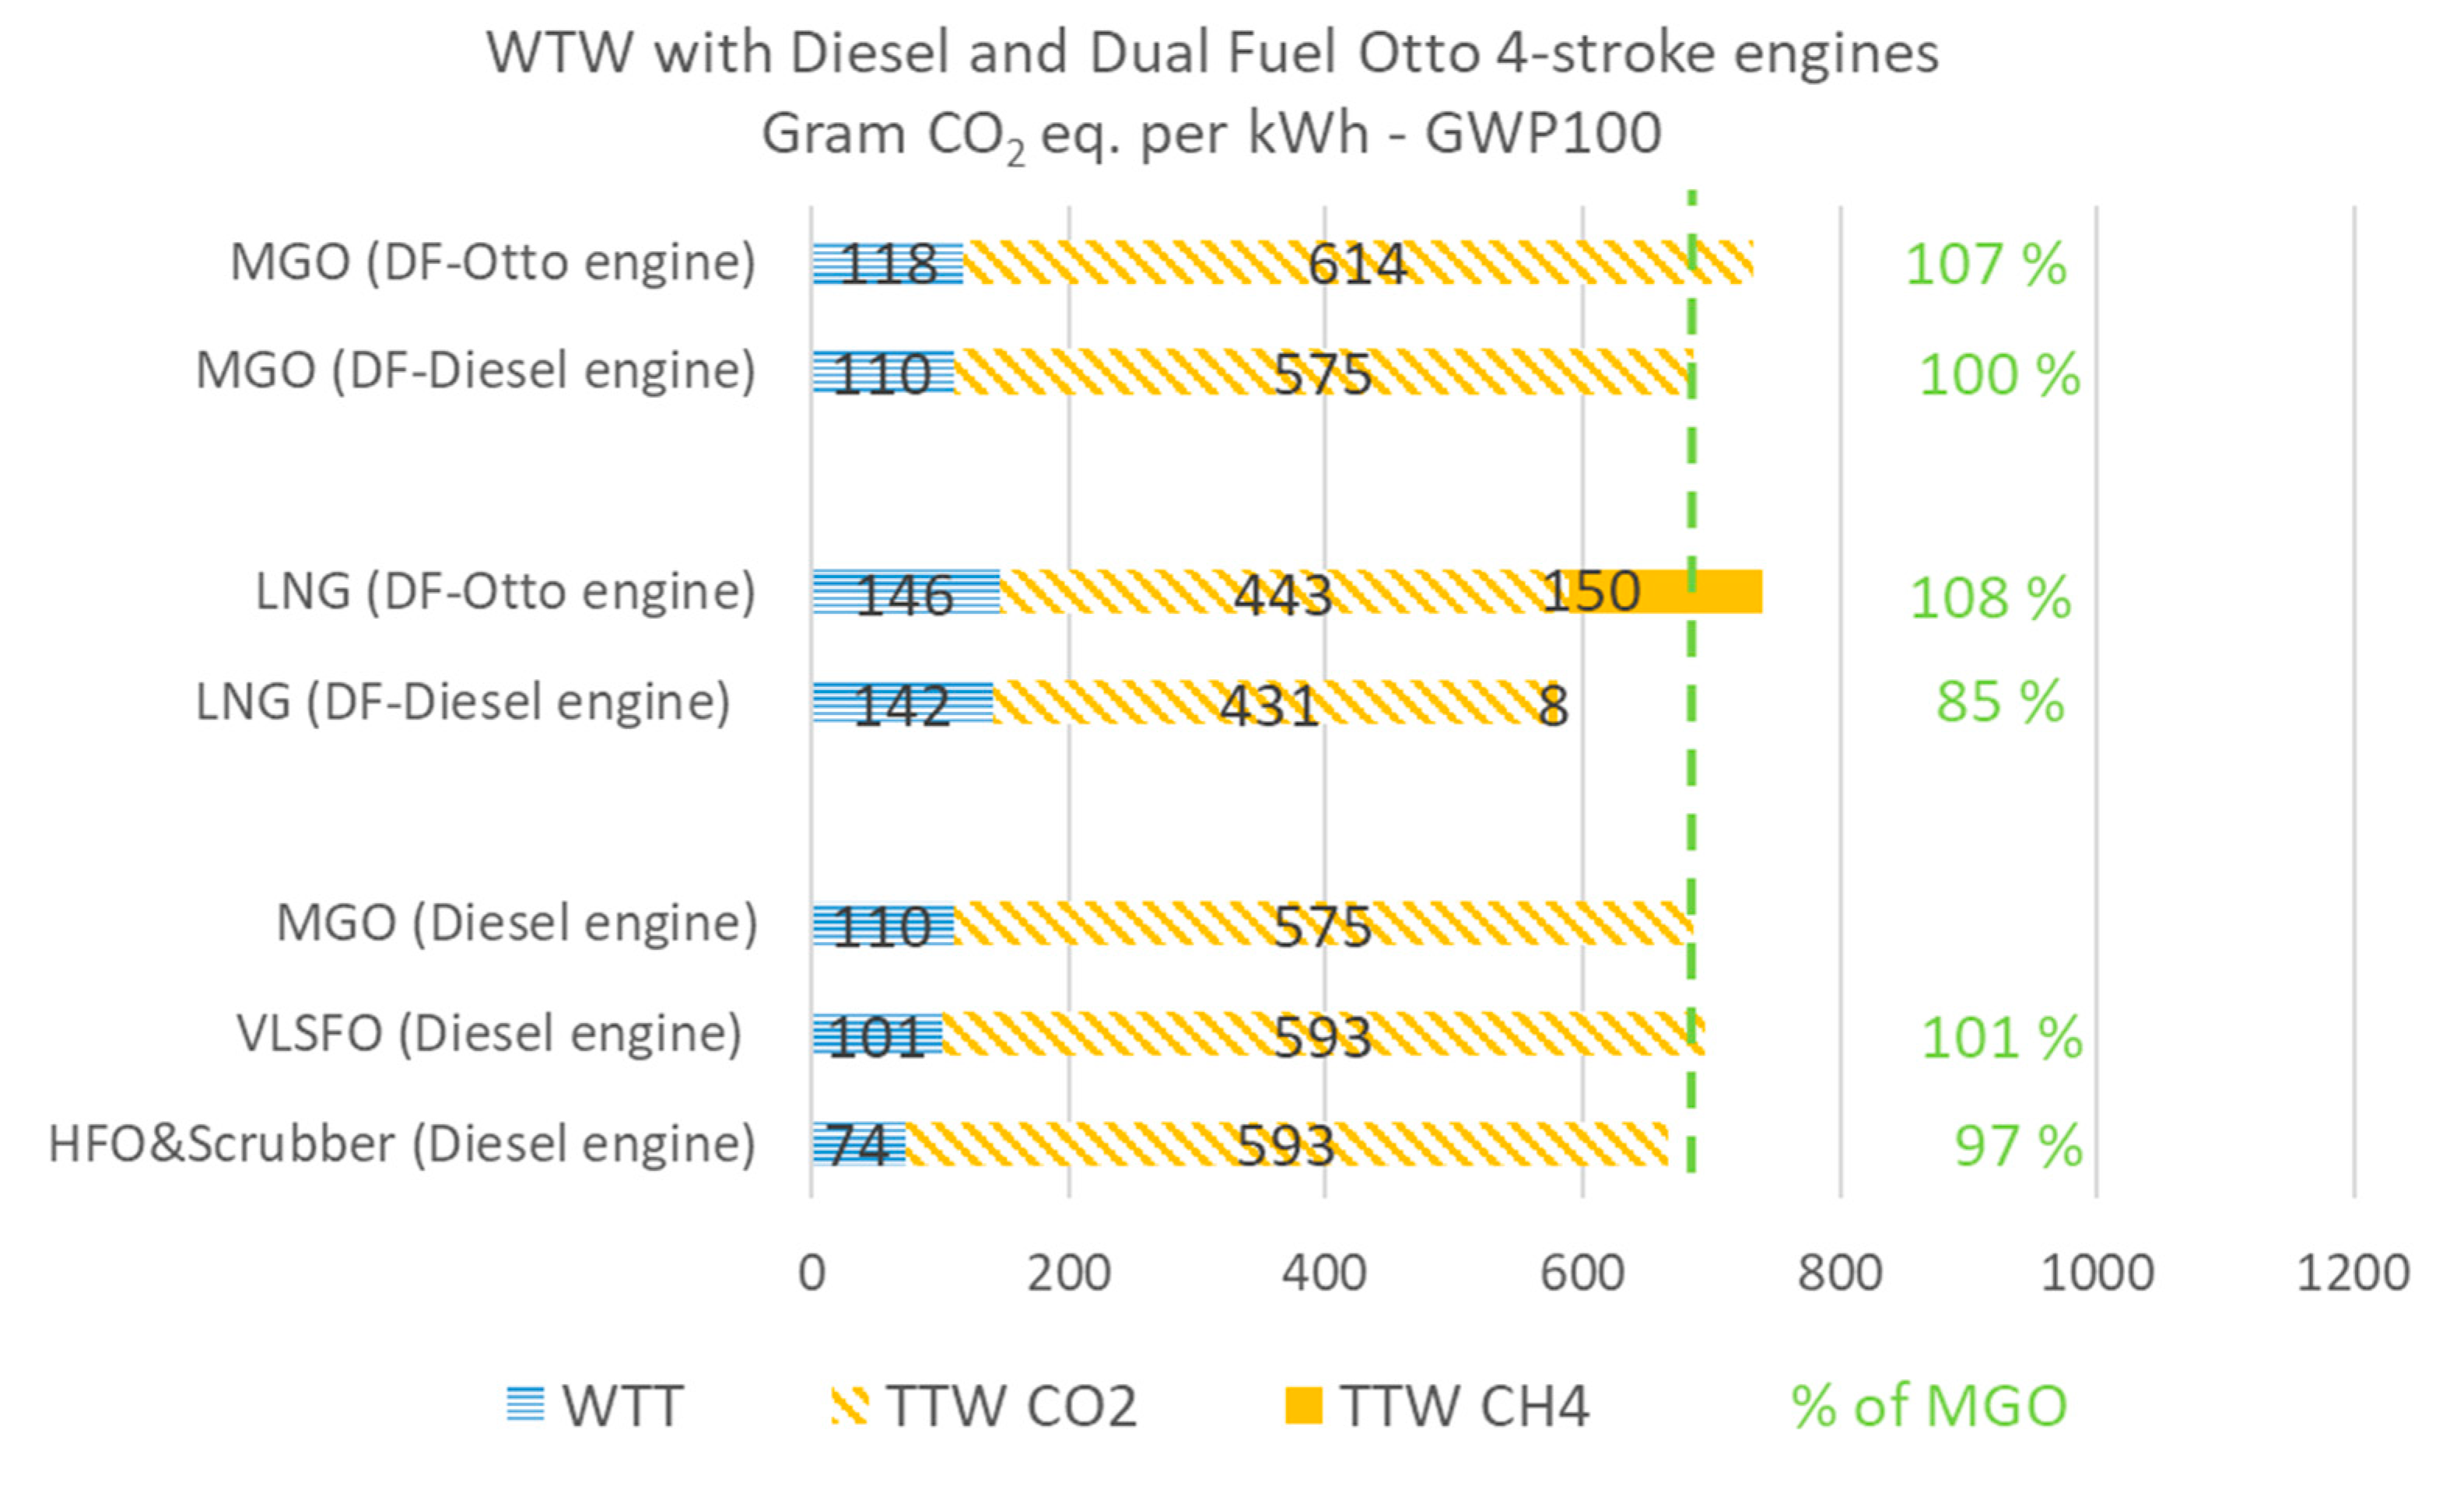
4.3.2. Well-to-Wake (WTW) Emissions for 4-Stroke Engines

In this section, we establish the Well-to-wake emissions for 4-stroke engines, i.e., the pure diesel engine, the diesel dual fuel engine and the Otto dual fuel engine. As described earlier dual fuel diesel engines are currently only available for 2-stroke engines, but there is ongoing research and development projects for development of dual fuel diesel 4-stroke engines. Therefore, the 4-stroke diesel dual fuel engine is included in this study highlighted with a gray color in Table 5.
From Table 5 we can observe that: First that LNG combusted in the dual fuel Otto-engine increases GHG emissions with nearly 50% within a short-term horizon (GWP20); Second, even with a long-term horizon (GWP100) LNG increases GHG emissions compared to MGO. Third, if LNG shall contribute to GHG reductions in the 4-stroke market, and there is a need for dual fuel diesel engines, then we will get similar reductions as for 2-stroke DF diesel engines; Fourth when the Otto 4-stroke dual fuel engine runs purely on MGO, the GHG emissions increase by around 7% compared to when using a pure diesel engine or the dual fuel diesel engine (which is similar to the numbers for 2-stroke engines). Fifth, with scrubbers the Greenhouse reduction potential is 3–4% greater than for MGO if we assume that HFO comes from less advanced oil refineries.
These results are visualized in Figure 5 and Figure 6, displaying values for GWP20 and GWP100, respectively.

4.4. Comparing the WTW Results of the Present Study With Previous Studies

Table 6 compares the result of this study with previous studies which have distinguished between alternative engine technologies. The first column provides a reference to each study. The percentage values provide the Well-to-wake emissions for LNG as a percentage of the same emissions when running the diesel engine on MGO.
The main observations are: First, all studies show that LNG in combination with the 2-stroke Dual fuel diesel engine reduces GHG emissions by 10–20% compared to MGO, with an average result of 15%; Second, for 2-stroke Dual fuel Otto engines, the variance between the studies is larger than for the dual fuel diesel option; Third, the results from this study are quite close to the average values which can be calculated based on these studies.

5. Economic Analysis and Results

In the previous section, we have seen that Dual fuel diesel engines fueled by LNG can deliver GHG reductions of up to 15% for the whole Well-to-Wake chain, while the dual fuel 2-stroke Otto-engine will emit similar quantities greenhouse gases (CO2 eq.) similar to MGO or even raise emissions. This implies that if shipowner’s decisions are made based on well-informed environmental assessments alone, they will choose a dual fuel diesel engine. In the real-world, decisions tend to be made based on lowest cost for compliance with regulations. Lindstad and Bø (2018) [68] have previously investigated combinations of alternative engine setups, including batteries, alternative fuels and innovative hull forms to fulfil future Energy Efficiency Design Index requirements (EEDI). The EEDI regulation involving IMO restricts a given vessel to a maximum for emitted grams of CO2 per ton-mile, with this maximum depending on vessel type and vessel size (carrying capacity). The vessel’s EEDI compliance is assessed through sea trial at delivery [17,69,70,71]. Basically, the EEDI test measures the emissions per ton nm for a fully loaded vessels when the main engine delivers 75% of its maximum continuous power (MCR) under calm water conditions. The findings from [68] indicate that future EEDI requirements raise newbuilding costs, so that unless the selected abatement option reduces fuel cost through for example reduced fuel consumption, the costs of transporting goods will rise. Or alternatively if the price of LNG drops below the costs of both using VLSFO or HFO in combination with Scrubber, building a new ship to run on LNG could be profitable on its own.
When considering LNG from the perspective of the vessel’s rated Energy Efficiency Design Index, neither the Well-to-tank emissions for producing the fuel nor any un-combusted methane (CH4) from the ship’s engine are included in the considerations. There are several explanations for this approach. First, the Well-to-tank emissions are out of scope, since EEDI includes only the-vessel fuel consumption. Second, IMO’s EEDI formula comprises only CO2 and not CO2 equivalents, so the on-board un-combusted methane slip is excluded. Third, given the EEDI thresholds of 30% emission reductions for phase 3, relative to vessels from the reference period (1998–2008), a LNG compliant engine running on LNG will easily satisfy the threshold independently of the dual fuel engine, regardless of whether it is diesel or Otto based.
To answer the important question of under which condition LNG can serve as a transitional fuel, we compared the two alternative LNG dual fuel options, i.e., diesel and Otto for the most typical 2- stroke engine segment. These are vessels with 7–13 MW power installed, for which we used the Supramax dry bulkers as a proxy. Globally there are around 3000 Supramax vessels which together carry out nearly 10% of the world’s sea freight work as measured in ton nm [59]. Moreover, here the cost calculation for the Supramax (55–65’ dwt) also serves as a proxy for typical bulk and tank vessels in the 35–80,000 dwt segment, i.e., the Handymax bulkers (40–55’dwt), the MR oil product tankers (around 50’dwt) and the Panamax dry bulkers (around 80’ dwt), i.e., the largest dry bulkers built to utilize the original 1914 Panama canal locks.
The figures in Table 7 are based on news reports of broker assessments [72,73,74], personal communication with ship owners and engine manufactures as well as in-house knowledge. To estimate the annual costs, we used as a rule of thumb 8% of total investment for the capital cost (CAPEX, a combined cost for equity, loans and the principal down payment) and 4% for the operational cost (OPEX). Today a typical Supramax with today’s operational speeds and operational patterns will have an annual fuel consumption of around 6000 tons [3,75,76]. With a diesel engine in combination with SCR to fulfil IMO tier III NOx requirements, a new built vessel costs around 30 million USD. If we instead selected LNG as the main fuel, this would cost around 5 MUSD more than the previous approach with the Dual Fuel Otto-engine solution and up to 10 MUSD more with the Dual Fuel diesel engine solution. It could be argued that the cost difference between the LNG options, which translates into a 0.6 MUSD higher annual cost, is in the high end, but the high pressure diesel technology has so far provided a significantly higher maintenance cost onboard than the Otto option. To keep it simple, all fuel prices are given in USD per Ton of oil equivalents (TOE), an energy content measure.
The main observations from Table 7 is that if the fuel price of LNG is lower than the fuel price per energy unit for VLSFO and MGO, then LNG in combination with a Dual fuel Otto engine becomes a very cost competitive option. In contrast, LNG with a Dual fuel diesel engine cost increases compared to all other options. With a high LNG fuel price, LNG is not cost competitive versus either MGO or VLSFO. Nevertheless, even with a high LNG price, combining LNG with a dual fuel Otto engine would be an easy way to fulfil IMO phase 3 EEDI regulations. Figure 7 shows how these findings are influenced by variations in annual fuel consumption where the LNG is based on the low estimate presented in Table 7. Similarly, Figure 8 shows the change in annual GHG emissions CO2 eq.) for the assessed fuel and distinct engine technologies.
The main observations from the sensitivity analysis are: First, LNG in combination with an DF Otto engine is economically competitive even at quite low annual fuel consumptions, i.e., from 4000 TOE upwards. However, even if it easily fulfils the EEDI phase 3 requirement (Lindstad and Bø 2018) [68], the real GHG reduction is next to nothing, i.e., around 4%; Second, LNG in combination with a DF diesel engine increases costs significantly, unless the fuel consumption is high. But in contrast with the DF Otto engine, a DF diesel engine delivers 15% GHG reduction of Well-to-wake emissions, which at least is more appropriate by providing the 30% reduction in Tank-to-wake emissions required by EEDI phase 3. Importantly, while the GHG reductions from LNG, even with best engine technology (i.e., dual fuel diesel engines), are modest, ships with these engines can with modest modification switch to using ammonia produced with renewable energy when it becomes available in sufficient amounts.
With LNG becoming cheaper than even HFO in some regions globally, and its good environmental perception compared to conventional fuels, we therefore expect a growing number of ships to be delivered with dual fuel Otto engines fulfilling all EEDI requirements, but where the GHG savings even in the best case scenario are next to nothing. We therefore conclude: First that there is a need for policies that reduce the broader GHG emissions of shipping and not only CO2; Second, that the policies needs to including the well-to-tank emissions of producing the fuels, i.e., the Well-to-tank. If we fail to include all GHGs, we might end up with paragraph ships fulfilling all EEDI requirements, but where the GHG savings are only on paper. This can be solved by IMO through including un-combusted methane in the EEDI formula, i.e., to change it from CO2 only to CO2 equivalents.

6. Conclusions

This study has investigated under what conditions LNG can serve as a transitional fuel in the decarbonization of shipping. Our results show that the LNG can serve as such a transitional fuel only if it is combined with the best engine technology, i.e., diesel dual fuel engines. This finding combines two arguments: the first relating to the short-term benefits of LNG as an energy carrier, the second to the longer term benefits of a diesel dual fuel engine’s ability to burn fuels with very low or zero GHG emissions energy sources such as renewables or ammonia when they become available for use in this way. Each argument is sufficient (in its own right) but may need to be considered together, given a fairly tough price tag of around five million USD, or around 15 percent of newbuilding costs in addition to the costs of a dual fuel Otto-engine. Concerning the short term benefits of LNG as an energy carrier, when LNG is combusted in the Otto-engine, these benefits are insignificant even under the best case scenario when the analysis (a) includes other greenhouse gases than CO2, and especially methane, and (b) comprises well-to-wake emissions, rather than just the combustion stage.
For IMO as a normative organization, the opportunity to regulate methane emissions through technical measures would seem rather urgent, most straightforwardly by including methane as a CO2 equivalent in the IMO EEDI formula (the energy efficiency design index for new-buildings). This is necessary for an otherwise implicit LNG encouragement not to backfire, including in ways that would hurt IMO’s credibility relative to the shipping industry, builders and owners.

Author Contributions

Conceptualization, E.L., G.S.E.; Methodology, E.L.; Software, E.L., A.R.; Validation, G.S.E., A.V.; Formal analysis, E.L.; Investigation, A.V., A.R.; resources, E.L., A.V.; Writing—original draft preparation, E.L., A.R.; Writing—review and editing, G.S.E., E.L. and A.R; Visualization, E.L., A.R.; Funding acquisition, A.V. All authors have read and agreed to the published version of the manuscript.

Funding

This study has been financially supported by the Norwegian Research Council project (Norges Forskningsråd) SFI Smart Maritime project number 237917.

Conflicts of Interest

The authors declare no conflict of interest.

References

  1. Buhaug, Ø.; Corbett, J.J.; Endresen, Ø.; Eyring, V.; Faber, J.; Hanayama, S.; Lee, D.S.; Lee, D.; Lindstad, H.; Markowska, A.Z.; et al. Second IMO GHG Study 2009; International Maritime Organization (IMO): London, UK, 2009. [Google Scholar]
  2. Smith, T.W.P.; Jalkanen, J.P.; Anderson, B.A.; Corbett, J.J.; Faber, J.; Hanayama, S.; O’Keeffe, E.; Parker, S.; Johansson, L.; Aldous, L.; et al. The Third IMO GHG Study; International Maritime Organization (IMO): London, UK, 2014. [Google Scholar]
  3. Faber, J.; Hanayama, S.; Zhang, S.; Pereda, P.; Comer, B.; Hauerhof, E.; van der Loeff, W.S.; Smith, T.; Zhang, Y.; Kosaka, H.; et al. Reduction of GHG Emissions from Ships—Fourth IMO GHG Study 2020—Final Report. Available online: https://docs.imo.org/Shared/Download.aspx?did=125134) (accessed on 30 June 2019).
  4. UN. United Nations Framework Convention on Climate Change; Paris Agreement: FCCC/CP/2015/L.9/Rev.1; UN: New York, NY, USA, 2015. [Google Scholar]
  5. IMO. Summary of Outcome of MEPC 73; IMO: London, UK, 2018. [Google Scholar]
  6. Shine, K.P. The global warming potential—The need for an interdisciplinary retrial. Clim. Chang. 2009, 96, 467–472. [Google Scholar] [CrossRef] [Green Version]
  7. IPCC. AR5 Climate Change 2014: Impacts, Adaptation, and Vulnerability. Part A: Global and Sectoral Aspects. Contribution of Working Group II to the Fifth Assessment Report of the Intergovernmental Panel on Climate Change; Field, C.B., Barros, V.R., Dokken, D.J., Mach, K.J., Mastrandrea, M.D., Bilir, T.E., Chatterjee, M., Ebi, K.L., Estrada, Y.O., Genova, R.C., et al., Eds.; Cambridge University Press: Cambridge, UK; New York, NY, USA, 2014; p. 1132. [Google Scholar]
  8. Hauschild, M.Z.; Goedkoop, M.; Guinée, J.; Heijungs, R.; Huijbregts, M.; Jolliet, O.; Margni, M.; De Schryver, A.; Humbert, S.; Laurent, A.; et al. Identifying best existing practice for characterization modeling in life cycle impact assessment. Int. J. Life Cycle Assess. 2012, 18, 683–697. [Google Scholar] [CrossRef]
  9. Ocko, I.B.; Hamburg, S.P.; Jacob, D.J.; Keith, D.W.; Keohane, N.O.; Oppenheimer, M.; Roy-Mayhew, J.D.; Schrag, D.P.; Pacala, S.W. Unmask temporal trade-offs in climate policy debates. Science 2017, 356, 492–493. [Google Scholar] [CrossRef] [PubMed]
  10. Tanaka, K.; Cavalett, O.; Collins, W.; Cherubini, F. Asserting the climate benefits of the coal-to-gas shift across temporal and spatial scales. Nat. Clim. Chang. 2019, 9, 389–396. [Google Scholar] [CrossRef]
  11. Myhre, G.S.D.; Bréon, F.-M.; Collins, W.; Fuglestvedt, J.; Huang, J.; Koch, D.; Lamarque, J.-F.; Lee, D.; Mendoza, B.; Nakajima, T.; et al. Anthropogenic and Natural Radiative Forcing. In Climate Change 2013: The Physical Science Basis. Contribution of Working Group I to the Fifth Assessment Report of the Intergovernmental Panel on Climate Change; Stocker, T.F., D. Qin, G.-K., Plattner, M., Tignor, S.K., Allen, J., Boschung, A., Nauels, Y., Xia, V., Bex, P.M., Midgley, P.M., Eds.; Cambridge University Press: Cambridge, UK; New York, NY, USA, 2013; pp. 659–740. [Google Scholar]
  12. Allen, M.R.; Fuglestvedt, J.S.; Shine, K.P.; Reisinger, A.; Pierrehumbert, R.T.; Forster, P.M. New use of global warming potentials to compare cumulative and short-lived climate pollutants. Nat. Clim. Change 2016, 6, 773–776. [Google Scholar] [CrossRef] [Green Version]
  13. Iordan, C.M.; Verones, F.; Cherubini, F. Integrating impacts on climate change and biodiversity from forest harvest in Norway. Ecol. Indic. 2018, 89, 411–421. [Google Scholar] [CrossRef]
  14. Thinkstep. Life Cycle GHG Emission Study on the Use of LNG as Marine Fuel. 2019. Available online: https://www.thinkstep.com/content/life-cycle-ghg-emission-study-use-lng-marine-fuel-1 (accessed on 30 June 2019).
  15. Ushakov, S.; Stenersen, D.; Einang, P.M. Methane Slip Summarized: Lab vs. Field Data. In Proceedings of the CIMAC Congress, Vancouver, BC, Canada, 10–14 June 2019. [Google Scholar]
  16. Ushakov, S.; Stenersen, D.; Einang, P.M. Methane slip from gas fuelled ships: A comprehensive summary based on measurement data. J. Mar. Sci. Technol. 2019, 24, 1308–1325. [Google Scholar] [CrossRef]
  17. Lindstad, E. Increased Use of LNG Might Not Reduce Maritime GHG Emissions at All, Transport & Environment (T&E). Available online: https://www.transportenvironment.org/sites/te/files/publications/2019_06_Dr_Elizabeth_Lindstad_commentary_LNG_maritime_GHG_emissions.pdf (accessed on 30 June 2019).
  18. ICCT. The Climate Implications of Using LNG as a Marine Fuel; Working paper 2020-02; International Council on Clean Transportation: Washington, DC, USA, 2020. [Google Scholar]
  19. Lindstad, H.; Rialland, A. LNG and Cruise Ships, an Easy Way to Fulfil Regulations—Versus the Need for Reducing GHG Emissions. Sustainability 2020, 12, 2080. [Google Scholar] [CrossRef] [Green Version]
  20. Yusuf, R.O.; Noor, Z.Z.; Abba, A.H.; Abu Hassan, M.A.; Din, M.F.M. Methane emission by sectors: A comprehensive review of emission sources and mitigation methods. Renew. Sust. Energy Rev. 2012, 16, 5059–5070. [Google Scholar] [CrossRef]
  21. Turner, A.J.; Frankenberg, C.; Kort, E.A. Interpreting contemporary trends in atmospheric methane. Proc. Natl. Acad. Sci. USA 2019, 116, 2805–2813. [Google Scholar] [CrossRef] [PubMed] [Green Version]
  22. Mikaloff-Fletcher, S.; Schaefer, H. Rising methane: A new climate challenge. Science 2019, 364, 932–933. [Google Scholar] [CrossRef]
  23. Roston, E.N.; Malik, S. Methane Emissions Hit a New Record and Scientists Can’t Say Why. Bloomberg. Available online: https://www.bloomberg.com/news/articles/2020-04-06/methane-emissions-hit-a-new-record-and-scientists-can-t-say-why (accessed on 6 April 2020).
  24. Meure, C.M.; Etheridge, D.; Trudinger, C.; Steele, P.; Langenfelds, R.; Van Ommen, T.; Smith, A.; Elkins, J. Law Dome CO2, CH4and N2O ice core records extended to 2000 years BP. Geophys. Res. Lett. 2006, 33. [Google Scholar] [CrossRef]
  25. CSIRO. Cape Grim Greenhouse Gas data. In 1976–2020, Meteorology. Available online: https://www.csiro.au/en/Research/OandA/Areas/Assessing-our-climate/Latest-greenhouse-gas-data (accessed on 30 June 2019).
  26. Bouman, E.A.; Lindstad, E.; Rialland, A.I.; Strømman, A.H. State-of-the-art technologies, measures, and potential for reducing GHG emissions from shipping—A review. Transp. Res. Part D Transp. Environ. 2017, 52, 408–421. [Google Scholar] [CrossRef]
  27. Bouman, E.A.; Lindstad, H.E.; Strømman, A.H. Life-Cycle Approaches for Bottom-Up Assessment of Environmental Impacts of Shipping. In Proceedings of the SNAME Maritime Convention, Bellevue, WA, USA, 1–5 November 2016. [Google Scholar]
  28. Silva, M. Life Cycle Assessment of Marine Fuel Production. Master’s Thesis, Norwegian University of Science and Technology, Trondheim, Norway, 2017. [Google Scholar]
  29. Edwards, R.; Larivé, J.F.; Rickeard, D.; Weindorf, W.; Godwin, S.; Hass, H.; Krasenbrink, A.; Lonza, L.; Maas, H.; Nelson, R.; et al. Well-to-Tank Report Version 4.a: JEC Well-to-Wheels analysis; JRC, EUCAR, CONCAWE: Luxembourg, Belgium, 2014. [Google Scholar]
  30. EXERGIA; E3M-Lab; COWI. Study on Actual GHG Data for Diesel, Petrol, Kerosene and Natural Gas—Final Report; ENER/C2/2013-643, prepared by EXERGIA S.A.—E3M-Lab—COWI A/S, Members of COWI Consortium; European Commission DG Energy: Brussels, Belgium, 2015; p. 549. [Google Scholar]
  31. Argonne. GREET: Greenhouse Gases, Regulated Emissions, and Energy use in Transportation (GREET) Model; Argonne National Laboratory: Lemont, IL, USA, 2018. [Google Scholar]
  32. Alvarez, R.A.; Zavala-Araiza, D.; Lyon, D.R.; Allen, D.T.; Barkley, Z.R.; Brandt, A.R.; Davis, K.J.; Herndon, S.C.; Jacob, D.J.; Karion, A.; et al. Assessment of methane emissions from the U.S. oil and gas supply chain. Science 2018, 361, 186–188. [Google Scholar] [CrossRef] [PubMed]
  33. Campling, P.; Janssen, L.; Vanherle, K.; Cofala, J.; Heyes, C.; Sander, R. Specific Evaluation of Emissions From Shipping Including Assessment For the Establishment of Possible New Emission Control Areas in European Seas; Flemish Institute for Technological Research (VITO): Flanders, Belgium, 2013; p. 34. [Google Scholar]
  34. Johansson, L.; Jalkanen, J.-P.; Kalli, J.; Kukkonen, J. The evolution of shipping emissions and the costs of regulation changes in the northern EU area. Atmos. Chem. Phys. Discuss. 2013, 13, 11375–11389. [Google Scholar] [CrossRef] [Green Version]
  35. Brynolf, S.; Magnusson, M.; Fridell, E.; Andersson, K. Compliance possibilities for the future ECA regulations through the use of abatement technologies or change of fuels. Transp. Res. Part D Transp. Environ. 2014, 28, 6–18. [Google Scholar] [CrossRef]
  36. Jiang, L.; Kronbak, J.; Christensen, L.P. The costs and benefits of sulphur reduction measures: Sulphur scrubbers versus marine gas oil. Transp. Res. Part D Transp. Environ. 2014, 28, 19–27. [Google Scholar] [CrossRef]
  37. Acciaro, M. Real option analysis for environmental compliance: LNG and emission control areas. Transp. Res. Part D Transp. Environ. 2014, 28, 41–50. [Google Scholar] [CrossRef]
  38. Lindstad, H.; Sandaas, I.; Strømman, A.H. Assessment of cost as a function of abatement options in maritime emission control areas. Transp. Res. Part D Transp. Environ. 2015, 38, 41–48. [Google Scholar] [CrossRef] [Green Version]
  39. Nielsen, J.B.; Stenersen, D. Emission Factors for CH4, NOx, Particulates and Black Carbon for Domestic Shipping in Norway; Revision 1, TA-2746; SINTEF: Trondheim, Norway, 2010; p. 36. [Google Scholar]
  40. Hiltner, J.; Loetz, A.; Fiveland, S. Unburned hydrocarbon emissions from lean burn natural gas engines-sources and solutions. In Proceedings of the 28th CIMAC World Congress, Helsinki, Finland, 6–10 June 2016. [Google Scholar]
  41. Stenersen, D.; Thonstad, O. GHG and NOx Emissions from Gas Fuelled Engine—Mapping, Verification, Reduction Technologies; OC2017 F-108; SINTEF: Trondhein, Norway, 2017. [Google Scholar]
  42. Hutter, R.; Ritzmann, J.; Elbert, P.; Onder, H. Low-Load Limit in a Diesel-Ignited Gas Engine. Energies 2017, 10, 1450. [Google Scholar] [CrossRef] [Green Version]
  43. Krivopolianskii, V.; Valberg, I.; Stenersen, D.; Ushakov, S.; Æsøy, V. Control of the combustion process and emission formation in marine gas engines. J. Mar. Sci. Technol. 2018, 24, 593–611. [Google Scholar] [CrossRef]
  44. Bengtsson, S.K.; Andersson, K.; Fridell, E. A comparative life cycle assessment of marine fuels. In Proceedings of the Institution of Mechanical Engineers, Part M: Journal of Engineering for the Maritime Environment; SAGE Publications: Newbury Park, CA, USA, 2011; Volume 225, pp. 97–110. [Google Scholar]
  45. Verbeek, R.; Kadijk, G.; van Mensch, P.; Wulffers, C.; van den Beemt, B.; Fraga, F. Environmental and Economic Aspects of Using LNG as a Fuel For Shipping in The Netherlands; TNO report TNO-RPT-2011-00166; TNO: Delft, The Netherlands, 2011; p. 48. [Google Scholar]
  46. Chryssakis, C.; Stahl, S. Well-To-Propeller Analysis of Alternative Fuels for Maritime Applications. In Proceedings of the CIMAC 2013, Shanghai, China, 13–16 May 2013. [Google Scholar]
  47. Bengtsson, S.K.; Fridell, E.; E Andersson, K. Fuels for short sea shipping: A comparative assessment with focus on environmental impact. Proc. Inst. Mech. Eng. Part M J. Eng. Marit. Environ. 2013, 228, 44–54. [Google Scholar] [CrossRef]
  48. Brynolf, S.; Kuvalekar, S.; Andersson, K. Life Cycle Assessment of Methanol and Dimethyl Ether (DME) as Marine Fuels; NTNU: Trondheim, Norway, 2014. [Google Scholar]
  49. Hua, J.; Cheng, C.-W.; Hwang, D.-S. Total life cycle emissions of post-Panamax containerships powered by conventional fuel or natural gas. J. Air Waste Manag. Assoc. 2018, 69, 131–144. [Google Scholar] [CrossRef] [PubMed]
  50. El-Houjeiri, H.M.; Monfort, J.-C.; Bouchard, J.; Przesmitzki, S. Life Cycle Assessment of Greenhouse Gas Emissions from Marine Fuels: A Case Study of Saudi Crude Oil versus Natural Gas in Different Global Regions. J. Ind. Ecol. 2018, 23, 374–388. [Google Scholar] [CrossRef]
  51. Sharafian, A.; Blomerus, P.; Mérida, W. Natural gas as a ship fuel: Assessment of greenhouse gas and air pollutant reduction potential. Energy Policy 2019, 131, 332–346. [Google Scholar] [CrossRef]
  52. Hwang, S.; Jeong, B.; Jung, K.H.; Kim, M.; Zhou, P. Life Cycle Assessment of LNG Fueled Vessel in Domestic Services. J. Mar. Sci. Eng. 2019, 7, 359. [Google Scholar] [CrossRef] [Green Version]
  53. Camuzeaux, J.R.; Alvarez, R.A.; Brooks, S.A.; Browne, J.B.; Sterner, T. Influence of Methane Emissions and Vehicle Efficiency on the Climate Implications of Heavy-Duty Natural Gas Trucks. Environ. Sci. Technol. 2015, 49, 6402–6410. [Google Scholar] [CrossRef] [Green Version]
  54. Clark, N.N.; McKain, D.L.; Johnson, D.R.; Wayne, W.S.; Li, H.; Akkerman, V.; Sandoval, C.; Covington, A.N.; Mongold, R.A.; Hailer, J.T.; et al. Pump-to-Wheels Methane Emissions from the Heavy-Duty Transportation Sector. Environ. Sci. Technol. 2016, 51, 968–976. [Google Scholar] [CrossRef] [Green Version]
  55. Sedlar, D.K.; Sedlar, D.K.; Drljača, B.; Jukić, L. Fuel Switch to LNG in Heavy Truck Traffic. Energies 2019, 12, 515. [Google Scholar] [CrossRef] [Green Version]
  56. ISO. ISO 14040: Environmental Management—Life Cycle Assessment—Principles and Framework; Technical Committee: ISO/TC 207/SC 5 Life Cycle Assessment; ISO: Geneva, Switzerland; Available online: https://www.iso.org/standard/37456.html (accessed on 30 June 2019).
  57. Dong, D.T.; Cai, W. A comparative study of life cycle assessment of a Panamax bulk carrier in consideration of lightship weight. Ocean Eng. 2019, 172, 583–598. [Google Scholar] [CrossRef]
  58. Moro, A.; Helmers, E. A new hybrid method for reducing the gap between WTW and LCA in the carbon footprint assessment of electric vehicles. Int. J. Life Cycle Assess. 2015, 22, 4–14. [Google Scholar] [CrossRef] [Green Version]
  59. Lindstad, E.; Borgen, H.; Sandaas, I. Real Performance in Seaways and its Impact on Ship Design. In Proceedings of the SNAME Maritime Convention 2018, Providence, RI, USA, 24–27 October 2018. [Google Scholar]
  60. Verbeek, R.; Verbeek, M. LNG for Trucks and Ships: Fact Analysis Review of Pollutant and GHG Emissions; TNO: Delft, The Netherlands, 2015; p. 70. [Google Scholar]
  61. Shell. The Bunker Fuels Challenge: How Should You Respond? Technology Trends to Watch. Available online: http://www.shell.com/business-customers/global-solutions/industry-focus/the-bunker-fuels-challenge.html (accessed on 30 November 2016).
  62. Lindstad, H.; Rehn, C.F.; Eskeland, G.S. Sulphur abatement globally in maritime shipping. Transp. Res. Part D Transp. Environ. 2017, 57, 303–313. [Google Scholar] [CrossRef] [Green Version]
  63. Concawe. Environmental Impacts of Marine SO2 Emissions; Concawe STF-67 Members: Brussels, Belgium, 2018. [Google Scholar]
  64. Heywood, J. Internal Combustion Engine Fundamentals 2E; McGraw-Hill Education: New York, NY, USA, 2019. [Google Scholar]
  65. Jonathan, R.; Lindstad, E. Slow steaming not necessarily a sulphur cap saviour. Fairplay Mag. 2018, 391, 24–26. [Google Scholar]
  66. MAN. Introduction to MAN-Energy Solutions; Visit of SFI Smart Maritime to MAN-Energy Solution and Research Centrer; MAN: Copenhagen, Denmark, 20 January 2020. [Google Scholar]
  67. SGMF. Life cycle GHG emission study on the use of LNG as marine fuel, Submitted by SGMF, ISWG-GHG 7. In Proceedings of the Intersessional meeting of the working group on reduction of GHG emissions from ships, 7th session, Agenda item 5; IMO: London, UK, 2020. [Google Scholar]
  68. Lindstad, E.; Bø, T.I. Potential power setups, fuels and hull designs capable of satisfying future EEDI requirements. Transp. Res. Part D Transp. Environ. 2018, 63, 276–290. [Google Scholar] [CrossRef]
  69. Lindstad, E. Why Increased Use of LNG Might Not Reduce Maritime GHG Emissions at All. Transport & Environment. Available online: https://www.transportenvironment.org/publications/dr-elizabeth-lindstad-why-increased-use-lng-might-not-reduce-maritime-ghg-emissions-all (accessed on 30 July 2019).
  70. IMO. Guidelines on the Method of Calculation of the Attained Energy Efficiency Design Index (EEDI), RESOLUTION MEPC.245(66), as amended by resolutions MEPC.263(68) and MEPC.281(70). In MEPC.1/Circ.866, IMO; IMO: London, UK, 2014. [Google Scholar]
  71. IACS. Procedural Requirements NO. 38 (Rev.1) 2015 Industry Guidelines for Calculating and Verification of EEDI; IACS: London, UK, 2015. [Google Scholar]
  72. BRS. BRS GROUP Annual Review 2019, Shipping & Shipbuilding Markets; BRS: Neuilly-sur-Seine, France, 2020. [Google Scholar]
  73. HellenicShippingNews. Dry Bulk Carriers’ Newbuilding Orders Slowing Down; Hellenic Shipping News: Imittos Court, Cyprus, 2019. [Google Scholar]
  74. Splash. Smaller Bulkers are a Larger Gamble When it Comes to Scrubbers. Available online: https://splash247.com/smaller-bulkers-are-a-larger-gamble-when-it-comes-to-scrubbers/ (accessed on 1 August 2020).
  75. Le Fevre, C. A Review of Demand Prospects for LNG as a Marine Transport Fuel; Oxford Institute for Energy Studies: Oxford, UK, 2018. [Google Scholar]
  76. Lindstad, E.; Sandaas, I.; Borgen, H. Length and hull shape importance to Reach IMO’s GHG target. In Proceedings of the SNAME Maritime Conference—SMC 2019, Tacoma, WA, USA, 29 October–2 November 2019. [Google Scholar]
Figure 1. Atmospheric gas concentrations of CO2, N2O and CH4 from 1750 to 2020 (Source: compiled by the authors; Data sources: [24,25]).
Sustainability 12 08793 g001
Figure 2. Environmental and Economics impact assessment process.
Sustainability 12 08793 g002
Figure 3. WTW CO2 eq. emissions per kWh (GWP20) as a function of fuel and a 2-stroke engine.
Sustainability 12 08793 g003
Figure 4. Well-to-Wake (WTW) emissions for 2-Stroke engines.
Sustainability 12 08793 g004
Figure 5. WTW CO2 eq. emissions per kWh (GWP20) as a function of fuel and a 4-stroke engine.
Sustainability 12 08793 g005
Figure 6. WTW CO2 eq. emissions per kWh (GWP100) as a function of fuel and a 4-stroke engine.
Sustainability 12 08793 g006
Figure 7. Energy Cost as function of Engine Technology, in USD per Ton of oil equivalents (TOE).
Sustainability 12 08793 g007
Figure 8. Change in annual GHG emissions (GWP 100), as a function of engine technology.
Sustainability 12 08793 g008
Table 1. Description of main parameters for calculation of Well-to-wake emissions (Source: compiled by the authors).
ParametersDescription
WTWGHG/kWhWTW GHG emissions of alternative fuel/engine combinations, in CO2 eq./kWh.
WTW = WTT + TTW
WTTGHG/kWhWTT GHG emissions in gram CO2 eq./kWh. Reported for GWP100 and GWP20
WTTGHG/kWh = WTTGHG/MJ × 3.6/TEE
where:
WTTGHG/MJ are the reported WTT emissions from the selected fuel, in g/GJ.
TEE is the Thermal Efficiency of the engine for a given fuel, in %.
TTWGHG/kWhTTW GHG emissions in g CO2 eq./kWh for distinct engine/fuel combinations solutions.
TTWGHG/kWh = SFOCMF × CO2MF + SFOCPF × CO2PF + CH4 × CO2 eq. (CH4)
where:
SFOCMF and SFOCPF are the Specific Fuel Oil Consumption for main fuel and pilot fuel, respectively.
SFOC = 3.6 × 1000 Low   Calorific   Value   ×   Thermal   Efficiency
CO2MF and CO2PF are CO2 emission factors for main fuel and pilot fuel, respectively.
CO2 eq. (CH4) is the CO2 emission factor for CH4, in CO2 eq. (GWP20 and GWP100).
CH4 is the methane slip for the given engine.
Table 2. Well-to-tank (WTT) Greenhouse gas emissions per MJ for alternative fuels (Source: compiled by the authors).
Gram CO2 eq. per MJ
Previous studies (GWP100) LNGMGOVLSFOHFOLNG/MGO
JRC (2013) [29] 19.415.4 126%
Exergia (2015) [30] 19.415.0 129%
Verbeek and Verbeek (2015) [60]19.114.2 9.8135%
Thinkstep (2019) Global average [14]18.514.413.213.5128%
Lindstad (2019) [17]18.514.413.29.6128%
ICCT (2020) North America [18]21.517.416.814.3124%
Previous studies (GWP20)LNGMGOVLSFOHFOLNG/MGO
Thinkstep (2019) Global average [14]27.119.418.218.5140%
Lindstad (2019) [17]27.119.418.214.6140%
ICCT (2020) North America [18]35.622.72219.2157%
Table 3. Methane slip figures (in g/kWh) (Source: compiled by the authors).
2-Stroke Dual Fuel-Diesel Engine2-Stroke Dual Fuel-Otto Engine4-Stroke Dual Fuel-Otto Engine4-Stroke Dual Fuel-Diesel Engine
Stenersen and Thonstad (2017)-SINTEF [41] 5.3
Thinkstep (2019) [14]0.12.13.9
Lindstad (2019)-SINTEF [17]0.32.1–4.03.9–5.3
ICCT (2020) [18]0.22.55.5
MAN (2020) [66]0.2–0.3
SGMF (2019) [67]0.12.13.9
This study (2020)0.252.55.00.25
Table 4. Well-to-wake CO2 eq. emissions per kWh for 2-Stroke engines (Source: compiled by the authors).
2-Stroke EnginesHFO & Scrubber Diesel Engine VLSFO Diesel EngineMGO Diesel EngineLNG DF Diesel Engine LNG DF Otto EngineMGO DF Diesel Engine MGO DF Otto Engine
1CO2 emission factorsg CO2/g fuel3.1143.1763.2062.752.753.2063.206
1Low Calorific ValueMJ/kg40.241.042.749.249.242.742.7
1CH4-GWP100CO2 e 3030
1CH4-GWP20CO2 e 8585
2Thermal engine efficiency %50%50%50%50%49.2%50%47%
3Compared to Diesel engine% 100%98%100%94%
3SFOC-Main fuelGram/kWh179.1175.6168.6145.3147.6168.6179.4
2SFOC-Pilot FuelGram/kWh 1.51.5
2Methane SlipGram/kWh 0.252.5
3TTW–GWP100 CO2 eq. Gram/kWh558558541412486541577
3TTW–GWP20 CO2 eq. Gram/kWh558558541426623541577
2WTT–GWP100 CO2 eq.Gram/MJ9.613.214.418.518.514.414.4
3WTT–GWP100 CO2 eq. Gram/kWh6995104133135104110
2WTT–GWP20 CO2 eq.Gram/MJ14.119.620.827.927.920.820.8
3WTT–GWP20 CO2 eq.Gram/kWh102141150201204150160
3WTW–GWP100 CO2eq.Gram/kWh627653644545621644687
3WTW–GWP20 CO2eq.Gram/kWh659699690626827690737
3WTW–GWP100 in% of MGO97%101%100%85%96%100%107%
3WTW–GWP20 in% of MGO95%101%100%91%120%100%107%
Table 5. Well-to-wake CO2 eq. emissions per kWh for 4-stroke engines (Source: compiled by the authors).
4-Stroke EnginesHFO & Scrubber Diesel Engine VLSFO Diesel EngineMGO Diesel EngineLNG DF Diesel Engine LNG DF Otto EngineMGO DF Diesel Engine MGO DF Otto Engine
1CO2 emission factorsg CO2/g fuel 3.1143.1763.2062.752.753.2063.206
1Low Calorific ValueMJ/kg40.241.042.749.249.242.742.7
1CH4–GWP100 (CO2 eq.) 3030
1CH4–GWP20 (CO2 eq.) 8585
2Thermal engine efficiency %47%47%47%47%45.6%47%44%
3Compared to Diesel engine% 100%100%100%94%
2SFOC–Main fuelGram/kWh190.5186.8179.4154.6159.4179.4191.6
2SFOC–Pilot FuelGram/kWh 1.51.5
2Methane SlipGram/kWh 0.255.0
3TTW–GWP100 CO2 eq. Gram/kWh593593575439593575614
2TTW–GWP20 CO2 eq.Gram/kWh593593575451868575614
3WTT–GWP100 CO2 eq.Gram/MJ9.613.214.418.518.514.414.4
2WTT–GWP100 CO2 eq. Gram/kWh74101110142146110118
3WTT–GWP20 CO2 eq.Gram/MJ14.119.620.827.927.920.820.8
3WTT–GWP20 CO2 eq.Gram/kWh109150159214220159170
3WTW–GWP100 CO2 eq.Gram/kWh667694685581739685732
3WTW–GWP20 CO2 eq.Gram/kWh7027437346651088734784
3WTW GWP100 in % of MGO97%101%100%85%108%100%107%
3WTW GWP20 in % of MGO96%101%100%91%148%100%107%
Table 6. Comparing the results of the present study with previous studies (GWP100) (Source: compiled by the authors).
2-Stroke Dual Fuel-Diesel Engine2-Stroke Dual Fuel-Otto Engine4-Stroke Dual Fuel-Otto Engine4-Stroke Dual Fuel-Diesel Engine
Verbeek and Verbeek (2015) [60]85% 108%
Thinkstep (2019) [14]80%87%96%
Sharafian et al. (2019) [51]90%98%107%
Lindstad (2019) [17]87%104%106%
ICCT (2020) [18]85%103%116%
Lindstad and Rialland (2020) [19] 110%
This study (2020)85%96%108%85%
Table 7. Costs for the two alternative LNG dual fuel engine options versus Conventional fuels (Source: compiled by the authors).
Supramax Dry Bulker 63,000 dwt MGO & Diesel EngineVLSFO & Diesel EngineLNG & DF Otto-EngineLNG & DF Diesel-EngineUNIT
Fuel typeDieselVLSFOLNGLNG
New-built cost with Diesel–engine & SCR3030 MUSD
Dual fuel engine & fuel system including tanks 510MUSD
Total investment30303540MUSD
Annual Fuel consumption (TOE)6000600061206000Ton
Change in GHG compared to MGO (GWP 100) 1%−4%−15%
Annual CAPEX & OPEX3.603.604.204.80MUSD
Fuel price per TOE–Low estimate450375300300USD/ton
Fuel price per TOE–Average estimate 450375500500USD/ton
Annual Fuel cost Low estimate2.702.251.841.80MUSD
Annual Fuel cost average estimate2.702.253.063.00MUSD
Annual cost low estimate6.305.856.046.60MUSD
Annual cost average estimate6.305.857.267.80MUSD
Change in annual tons of CO2e compared to MGO0192−769−2 885Ton
Publisher’s Note: MDPI stays neutral with regard to jurisdictional claims in published maps and institutional affiliations.

