1. Introduction
The current COVID-19 pandemic has shown that global travel activities are a key factor for hardly or even non-traceable infection chains. This effect is particularly significant in the aviation sector [
1], where safety measures must be implemented to prevent the spread of COVID-19 [
2]. Air transport enables people to travel around the world, and the confined space in the aircraft cabin can contribute to virus transmissions during boarding and deboarding, flight, and related service processes [
3]. The related aircraft ground operations (cabin disinfection [
4]) or airport terminal processes (e.g., security checks [
5], passenger health screening [
6]) are also significantly affected by new pandemic requirements.
As reduced human interactions will significantly decrease the virus transmission risk, a generally and widely applied pro-active infection counter measurement is social (physical) distancing, which refers to measures aiming to minimize physical human contacts [
7]. In the past months, the world has seen several related measures to stem the spread of the coronavirus, such as movement restrictions to limit human interactions, hygiene measures, social confinements as well as business and social lockdowns [
8]. In addition to these, technology-aided approaches are applied, especially in the form of digital social distancing and contact tracing frameworks. In this context, contact tracing refers to surveying the proximity between users and tracing critical encounters in case of positive coronavirus reports [
9]. These are used in COVID-19 apps to track distances between people, avoid crowds in public places, and determine infection chains in case of SARS-CoV-2 positive tested users [
10]. Next to these, various emerging technologies and their potential benefits are discussed [
9]. Most of the current approaches utilize the Google Apple Exposure Notification (GAEN) framework, which exploits Bluetooth Low Energy (BLE) based distance estimations for proximity tracing [
11]. However, there are major concerns about the accuracy of such an approach regarding the accuracy of the distance estimation as a result of a BLE measurement [
12]. In our contribution, we emphasize and discuss environmental influences on receiver signal strength measurements, which are used to ensure the appropriate distance between persons. Particularly when considering the complex and confined aircraft cabin, a number of constraints lead to a limited accuracy in the distance calculation.
A general problem for wireless ranging is non-line-of-sight (NLOS) and multipath signal reception, which leads to a variation in signal parameter measurands and therefore also to distance deviations. The influence of environmental conditions is further increased in areas with limited space, as well as concave and metallic surroundings, such as aircraft cabins. These environments naturally provide demanding conditions for wireless signals, due to possible reflections, scattering, and attenuation of transmitted signals.
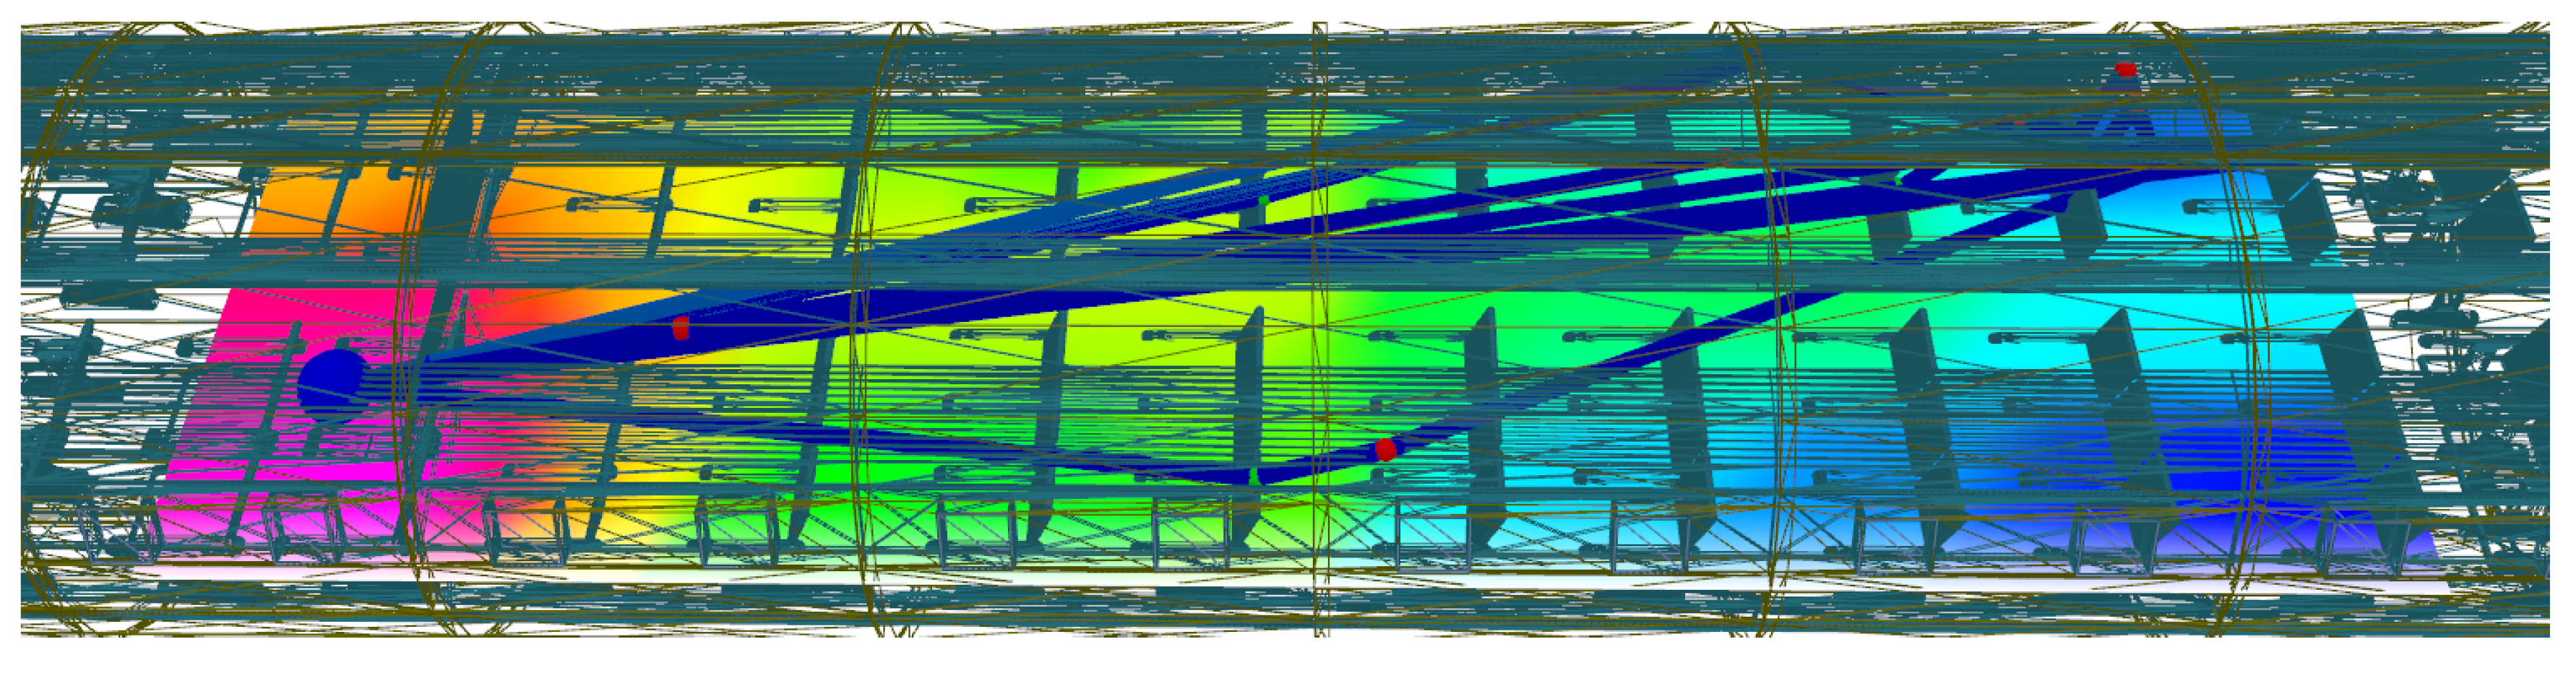
Figure 1 highlights the corresponding challenges, by showing a ray-tracing simulation of possible signal paths leading to adverse reception conditions in an Airbus A321 cabin. In addition to the environment, passengers also influence radio behavior resulting in additional attenuation further decreasing the correlation between the measured Receiver Signal Strength Indicator (RSSI) and derived distances.
RSSI based distancing can only take environmental information into consideration by tuning a so-called path-loss exponent
(see
Section 2). Parameter variations can lead to tremendous consequences for social distancing applications: conservative parameter choices lead to generally shorter measured distances, increasing false-positive tracing rates; too small path-loss exponents can lead to positive ranging biases and therefore increase the rate of false-negative encounters resulting in undetected violations of distance rules. A general parameterization for a time-invariant and dynamic environment is a key challenge. Hence, we discuss and analyze the challenges of RSSI based distance estimation in challenging environments and propose the utilization of further signal measurands to increase technology-aided social distancing performance.
1.1. Status Quo of Technology-Aided Contact Tracing
Obtaining spatial information from wireless technologies is a rapidly growing research field and has immense commercial potential. While Global Navigation Satellite Systems (GNSS) already provide the go-to and state of the art localization technology for outdoor positioning, additional technologies, like WiFi, Ultra-Wide Band (UWB) or BLE are emerging and aim to provide reliable and locally available geometric relations especially for indoor applications often leading to the terminology of indoor positioning systems [
13,
14,
15,
16,
17,
18].
The basic idea of technology-aided social distancing approaches is the generation of location or distance information. Contacts below a certain proximity threshold are registered and stored. If a user got tested positive for SARS-CoV-2 afterward, all former contacts are notified about this critical encounter. A comprehensive overview of technologies used for physical distancing is presented in [
9].
There are two main approaches to measure the proximity between persons: On the one hand, there are absolute, geo-referenced positions, which can be generated using GNSS or other radio-based position estimation technologies. The distance between users is now determined by calculating the Euclidean distance between the respective positions. On the other hand, relative distances between devices can be estimated between the user equipment directly. For this, spatial information is generated by interpreting wireless signal measurands, such as received signal strength (RSS), travel time, phase information, or angular information [
19]. Choosing a suitable wireless technology for specific application domains is dependent on a variety of factors, such as accuracy, market penetration, and coverage, energy consumption, or security concerns [
12].
A general downside of social distancing techniques using absolute position information is that GNSS availability is very limited in indoor and partially in urban environments. Additionally, the user’s position needs to be disclosed to other users or centralized servers, which raises severe privacy concerns. Therefore direct proximity tracing is preferred by most public health agencies and app providers [
12]. These apps are often based on the GAEN framework. The current technological basis for distance estimation within this framework is BLE based RSSI. The reasons for this choice are obvious: BLE and the provided API are available for all modern smartphone operation systems, which allows for a wide adaption. Additionally, wearables like smartwatches or fitness trackers are also equipped with this technology. On the downside, the underlying distance estimation scheme based on RSSI can be volatile and prone to environmentally implied errors leading to a decorrelation of RSSI and distance [
20]. In the context of social distancing and contact tracing, this unreliability can conduct to undetected infection chains or increased false-negative encounter rates, overall decreasing efficiency, and user acceptance. Empirical tests with existing corona apps already show low reliability in the distance accuracy in public transportation [
21,
22]. Since the environmental influences on signal propagation in aircraft cabins (conical shape and metallic shell) are similar to those of buses or metro trains, similar effects can be expected.
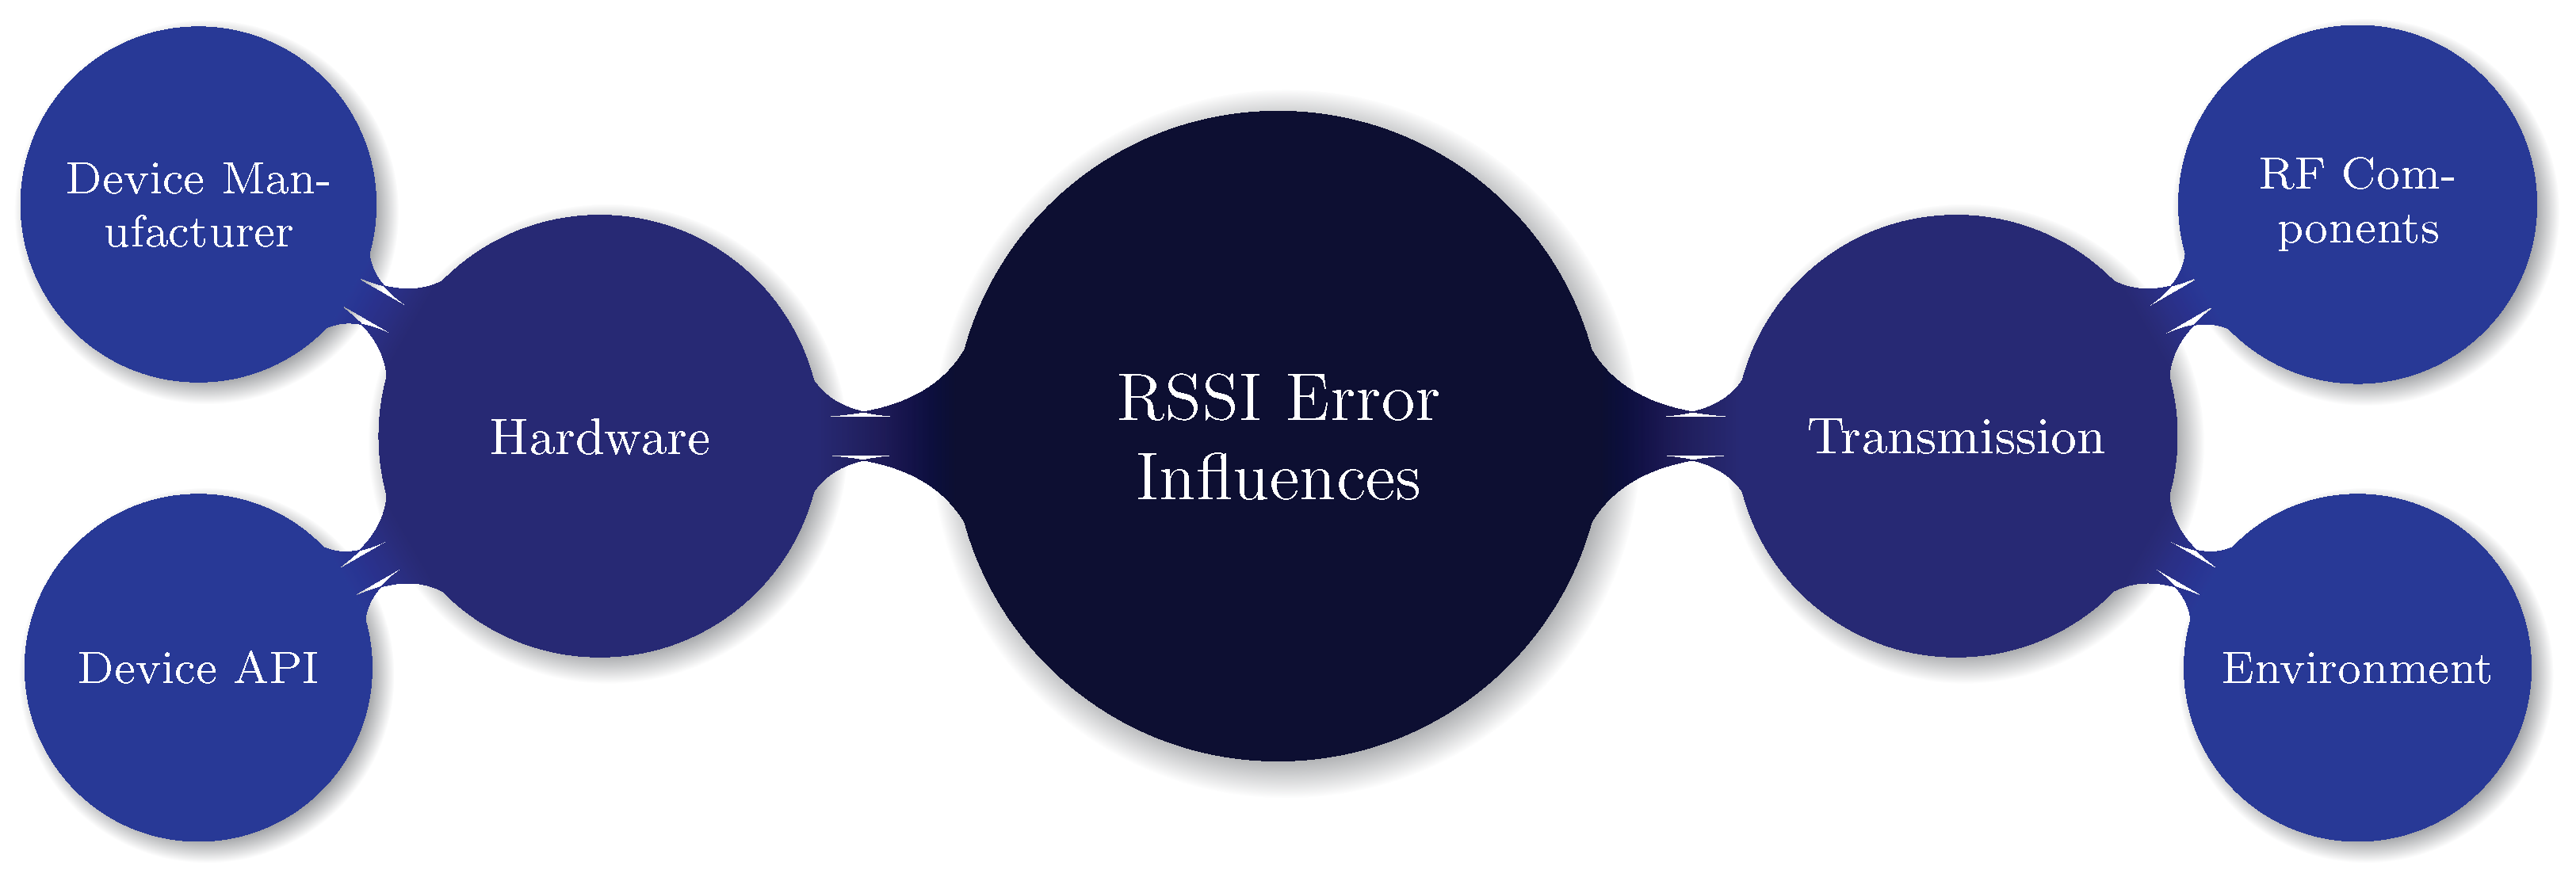
Figure 2 provides an overview of possible error influences on the RSSI distance estimation.
In general, manufacturer and device heterogeneity in terms of different built-in antenna characteristics hinder a highly accurate distance estimation using RSSI measurements. Common smartphone antennas for WiFi and BLE have a high directionality in their radiation patterns leading to orientation-dependent antenna gains. This can result in offsets in the distance estimation depending on the relative device orientation. Additionally, external influences on signal transmission need to be considered, which we will discuss in more depth in
Section 4, applying a radiowave simulation.
1.2. Cabin Operations
In the context of efficient airline operations during pandemic situations, the focus is set on efficient passenger handling in the aircraft cabin. Standard boarding strategies are analyzed considering the quantity and quality of passenger interactions and evaluated with a virus transmission model to provide a more detailed assessment. The implementation of physical distances indicates that conventional boarding strategies take longer and trade-offs between economic efficiency (seat load) and process duration must be made in order to minimize the impact on various health risks [
3,
23]. A more detailed investigation shows that physical distances between passengers decrease the number of possible transmissions by approx. 75% for random boarding sequences, and could further decreased by more strict reduction of hand luggage items (less time for storage, compartment space is always available) [
3]. Furthermore, standard process times could be reached if the rear aircraft door is used for boarding and deboarding. This investigation also points out that deboarding consists of the highest transmission potential and only minor benefits from distance rules and hand luggage regulations. Different boarding strategies are applied to reduce possible transmissions, such as reduced number of passengers seated close to the aisle [
24] or boarding of passenger groups [
25]. The optimized consideration of passenger groups in the context of a pandemic boarding scenario (see
Figure 3 will significantly contribute to a faster process (reduction of boarding time by about 60%) and a reduced transmission risk (reduced by 85%), which reaches the level of boarding times in pre-pandemic scenarios [
25]. In this context, the connected cabin and the associated position detection concept will be a key enabling technology.
Similar to other industrial fields, wireless technologies can be utilized to efficiently shape passenger boarding/deboarding and cabin related processes by both digitization and interconnection. Location-Based Services (LBS) can be derived from the relevant absolute position information of cabin objects, crew, and passengers. This latest technical development will also help to detect or prevent the possible transmission of coronaviruses and thus reduce the spread of the virus.
1.3. Focus and Structure of the Document
The COVID-19 pandemic has drastically changed our daily lives including travel habits. Technology-aided social distancing and contact tracing offers great potential for restoring previous behavioral patterns. However, this recovering strongly relies on accurate and reliable distance or position estimation. We will discuss the challenges and the shortcomings of RSSI distance estimation in a close connection to the application of passenger boarding and monitoring. In the context of the connected cabin, we propose alternative technological approaches suitable for the specific aircraft cabin related process demands. With this, we both expect to shape future smart cabin while reducing and tracing critical on-board encounters as well as maintaining global freedom of travel.
The paper is structured as follows. After the introduction (
Section 1), we introduce the challenges of commonly applied RSSI based distance estimation (
Section 2) as well as the basics of ray tracing radio propagation simulation (
Section 3), which can be used to validate propagation effects in specified environments. In
Section 4 we compare two RSSI simulation runs with and without taking environmental influences into account and discuss the occurring effects in the context of RSSI determination. Additionally, we discuss the analysis of alternative signal measurands potentially leading to more accurate and robust ranging, as the need for safe and reliable passenger operations in the aircraft cabin. Finally, our contribution ends with a conclusion and outlook (
Section 5).
2. RSS Distance Estimation
The foundation for deriving spatial information between devices relies on interpreting properties of wireless communication signals, such as RSS, travel time or phase information. As already pointed out in the introduction, common tracing apps utilize the RSS of BLE beacons to estimate the distances between devices. Generally, the RSS
is subject to a variety of influencing factors and calculated according to the link budget shown in (
1):
where
and
denote the received respectively the transmitted signal strength,
and
the antenna gains for both antennas,
and
include all connection and cable losses for the receiver and the transmitter and finally
represents the path-loss [
26]. The application of RSS based ranging and the associated low accuracies lead to a variety of issues. Many of the influences in (
1) are either unknown due to extremely heterogeneous user devices supplied by different manufacturers, in different production generations, and with distinct hardware configurations (especially antennas). Furthermore, the device orientation has a large influence on RSS, since the integrated antennas do not have a uniform radiation pattern in all directions. This effect may lead to potentially large variations in estimated distances [
27].
Next to these device-related matters, a large factor for RSS based distance measurement is the path-loss
due to environmental dependencies. Essentially, in a non multipath channel, a transmitted signal arrives the receiver with a certain amplitude
a and phase angle
at a distinct point of time resp. time delay
. Without any error influences, the amplitude is depending on signal attenuation caused by the path-loss and the time delay is solely depending on the distance
d between transmitter and receiver. The simplest form of modeling the path-loss is the free space path-loss according to Friis equation (additional gains and losses from (
1) are not considered) given (
2) with
[
28]:
where
denotes the wavelength of the utilized radio technology and
denotes the path-loss exponent, indicating the correlation between path-loss and increasing distance. The applicability of (
2) relies on the absence of obstacles or other disturbances within the first Fresnel zone, which is a rotational ellipsoidal area between transmitter and receiver in which most of the signal energy is transmitted.
However, for real-world applications and especially in indoor environments this assumption is hurt by multipath effects. The signal typically arrives at the receiver via multiple paths
K, caused by reflections and scattering leading to signal energy dissipation, phase, and time shifts of the signal. Considering all these propagation paths, the resulting RSS can then be calculated as a combination of time- and phase-shifted as well as differently attenuated signals as given in (
3), with amplitudes
and phase angles
[
29,
30].
Modeling the path-loss in these scenarios is strongly dependent on the propagation environment and oftentimes needs to be determined empirically. However, all derived models indicate a distance-dependent logarithmic increase in path-loss. Additionally, past studies have shown that multipath reception leads to a fluctuation of RSS caused by shadowing. Even in static environments multipath effects manifest in RSS variations up to
[
20]. Hence, it has been shown that next to the distance dependency of the path-loss, it also follows a log-normal random distribution (normal distribution when measured in dB) given a constant distance
d, which also affects the RSS at the receiver [
28]. According to [
31], the resulting log-normal propagation model (
4) can be expressed as
with
denoting the average RSS, which can either be determined empirically or by applying the free space path-loss for a reference distance
. Additionally,
is a zero mean normally distributed random variable with variance
:
. Since both
and
are typically unknown, they have to be estimated from measurements utilizing a Maximum Likelihood estimation [
31] or simply set based on literature review. Once, these are determined, RSS measurements
can be used to estimate distances between transmitter and receiver (
5), where
now represents a single RSS measurement at the given reference distance.
For practical considerations and as already outlined, all influences in (
1) obviously play into measuring signal strengths. Additionally, commercially available user hardware is typically not able to directly measure RSS. Therefore, the vendor-specific indicator of RSSI is available from most devices. For this reason, estimating the distance is simply put as given in (
6), with
A denoting a measured reference RSSI value at a known distance.
Next to the already mentioned issues for RSSI distance estimation (cf.
Figure 2), the main shortcomings for RSSI based distance determination we want to highlight and discuss in our contribution are environmental influences as these are hardly considered. The only tuning parameter available is the path-loss exponent, which is highly volatile for different scenarios and cannot express propagation phenomena in different environments in a general manner.
3. Radiowave Simulation
A common approach for investigating propagation effects is to simulate radio propagation. In general, these approaches can be classified as follows:
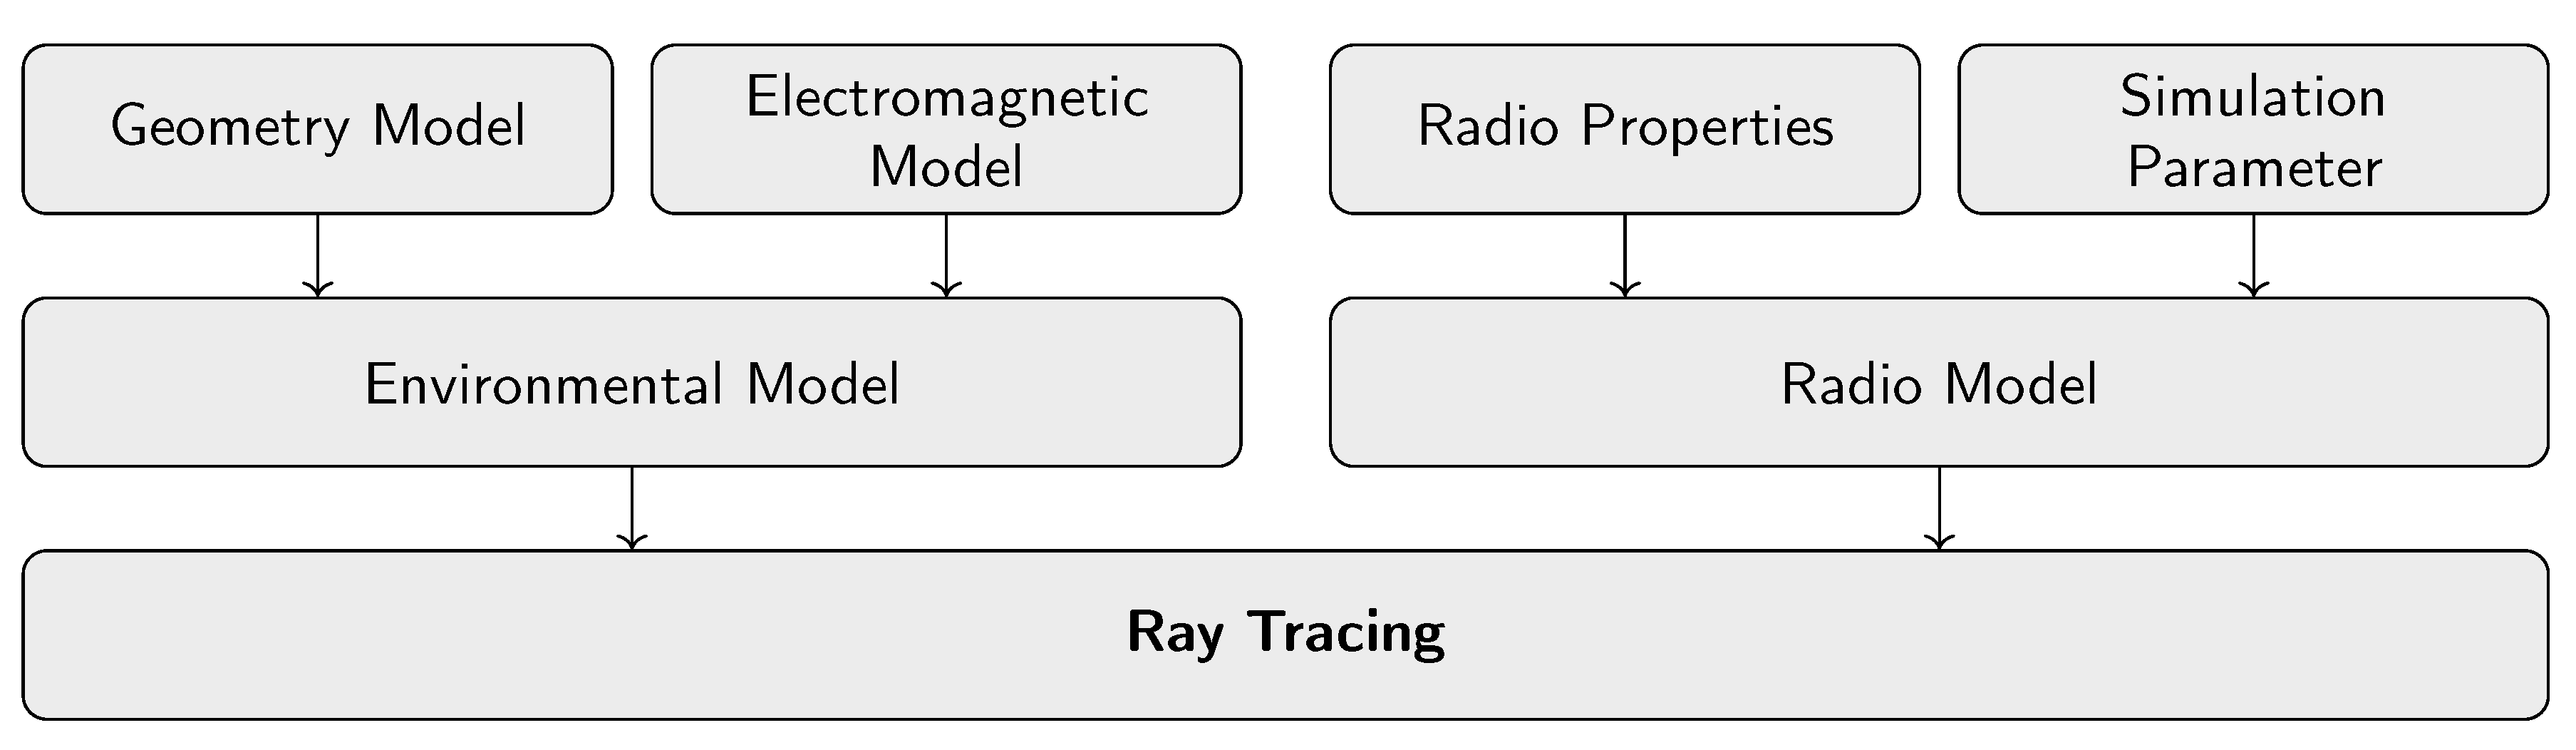
Ray-tracing methods provide a decent trade-off between simulation accuracy and complexity and are still able to facilitate all relevant propagation mechanics, such as the simulation parameters of reflection and diffraction. Therefore we decided to utilize this technique for simulating wireless propagation in an aircraft cabin with regards to RSS ranging. A hierarchical model of necessary ray tracing components is given in
Figure 4. A comprehensive overview on ray-tracing methods and applications can be found in [
35].
The environmental model for ray-tracing comprises the individual elements of the environment relevant to radio propagation. These include geometric and electromagnetic properties. To represent the geometric model of the investigation scenario a 3D CAD model can be applied including the size and dimensions of relevant objects in the environment. Next to these, different materials affect radio propagation in different ways, which is also considered in the radio simulation and represented by the electromagnetic model. Hence, specific electromagnetic properties are assigned to all objects.
These properties are defined by several parameters, including the electrical permittivity (
) and the permeability (
) of a medium, where
and
are given values in free space. For wireless propagation
(non-magnetic media) can be assumed. Another parameter is the characteristic impedance
of a material. If a dielectric medium has a conductivity
that is different from zero, then it is a lossy medium. The complex relative permittivity
considers these losses in the parameter
[
36,
37,
38].
Next to the environmental model, radio properties and simulation parameters constitute the radio model. Radio properties include physical characteristics of the underlying radio technology, which is to be considered during the simulation. Among others, this includes the examined frequency band, the maximum transmit power of the transmitter and the minimum receiver sensitivity of the receiver. These values are typically given by the respective technology or device specification. Furthermore, the antenna specification of both the transmitter and receiver are considered, including radiation patterns and associated antenna gains as well as antenna polarization. In addition, the simulation parameters characterize the type of simulation and its associated settings. For ray tracing, inter alia, this includes the amount of calculated reflections, the consideration of scattering or maximum ray attenuation as well as related power losses such as transmission , reflection and scattering losses.
4. Application of Radiowave Simulation on Aircraft Cabin
We perform a ray tracing propagation simulation in a section of a modeled Airbus A321 aircraft cabin (cf.
Figure 1) to compare and discuss the signal path-loss with respect to the propagation environment and its implications on RSSI based distance estimation. For this, the radio propagation simulation tool Altair Feko Winprop (
https://www.altair.com/hyperworks) was used. Relevant parameters of the ray tracing simulation (cf.
Section 3) are summarized in
Table 1 (all simulation parameters are valid for a radio frequency range of
to
).
All simulations are performed at a frequency of , which lies within the operating frequency band of BLE. As the presented work focuses on the environmental influences on radio propagation, no additional investigations of antenna or antenna orientation influences were performed. Therefore and for simplicity, an omni-directional isotropic radiator was assumed. However, different antenna types with respect to their specifications can also be integrated into the simulation.
Concerning the environmental model, the Airbus A321 was chosen due to its dissemination as well as its geometry and EM model availability. However, we want to highlight that the utilized model, both in the type of model and level of detail, has a critical impact on simulation accuracy. Hence, direct quantities may not be transferable to other aircraft cabins or application fields, like public transportation. However, we encourage that the general effects on radio propagation (e.g., reflections) will still be observable to a similar extent.
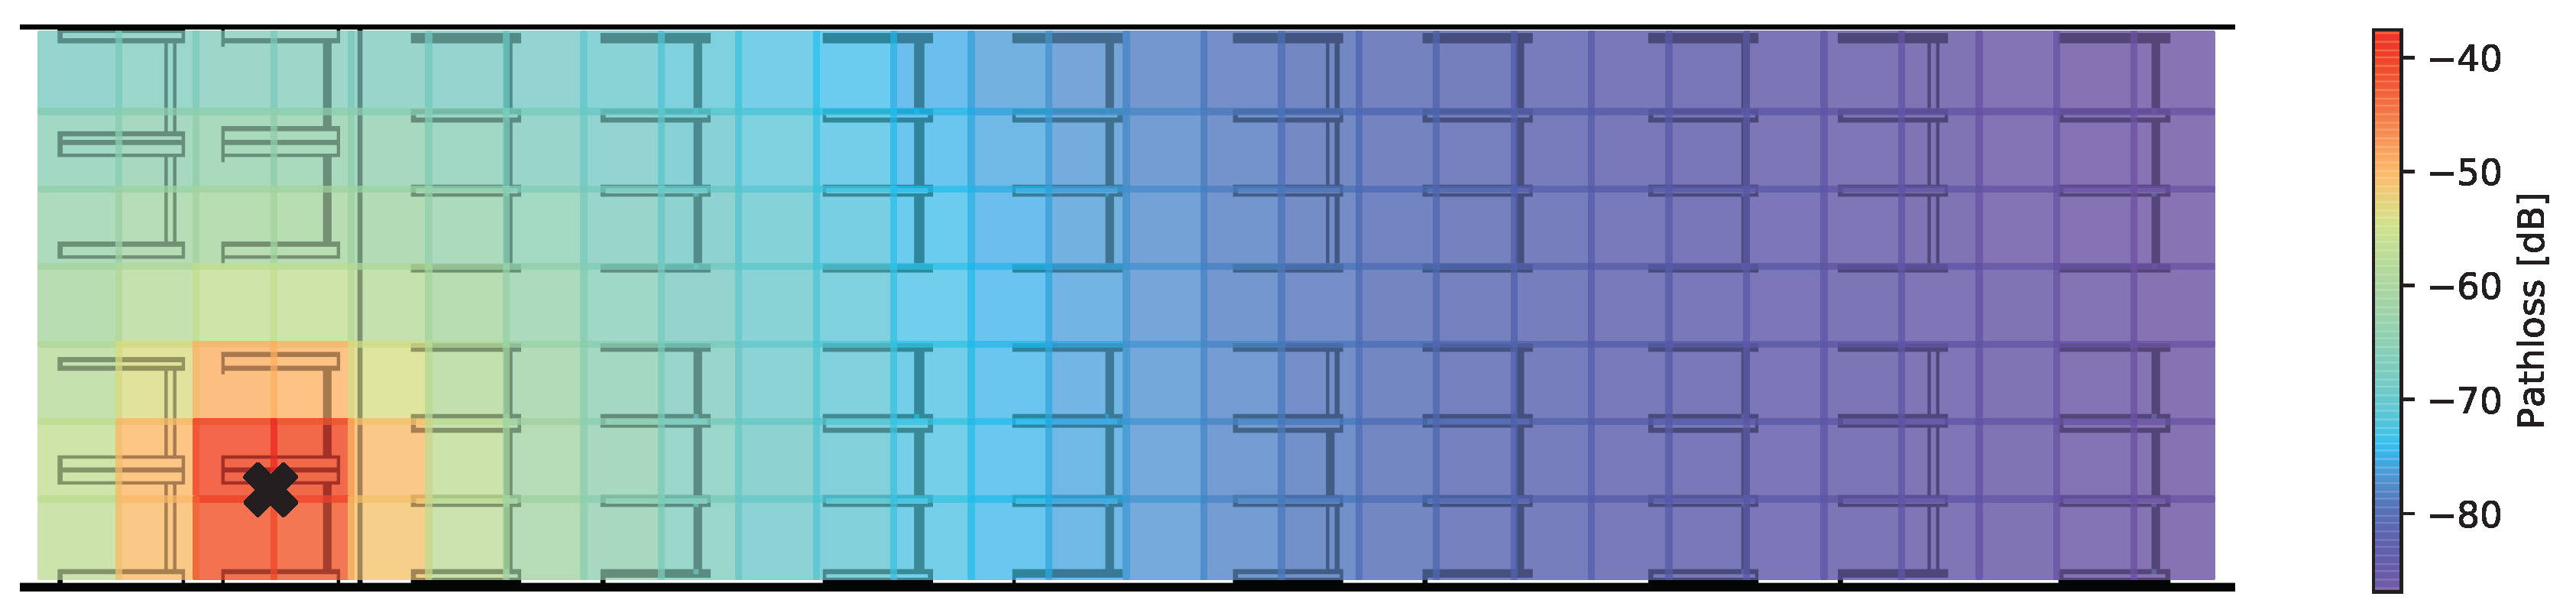
At first, the results for a path-loss based on (
2) are depicted in
Figure 5. The calculation of the path-loss given the marked transmission antenna is performed for a discrete
grid. The actual level of values can vary depending on
parameter setting, which was set to
for the shown results.
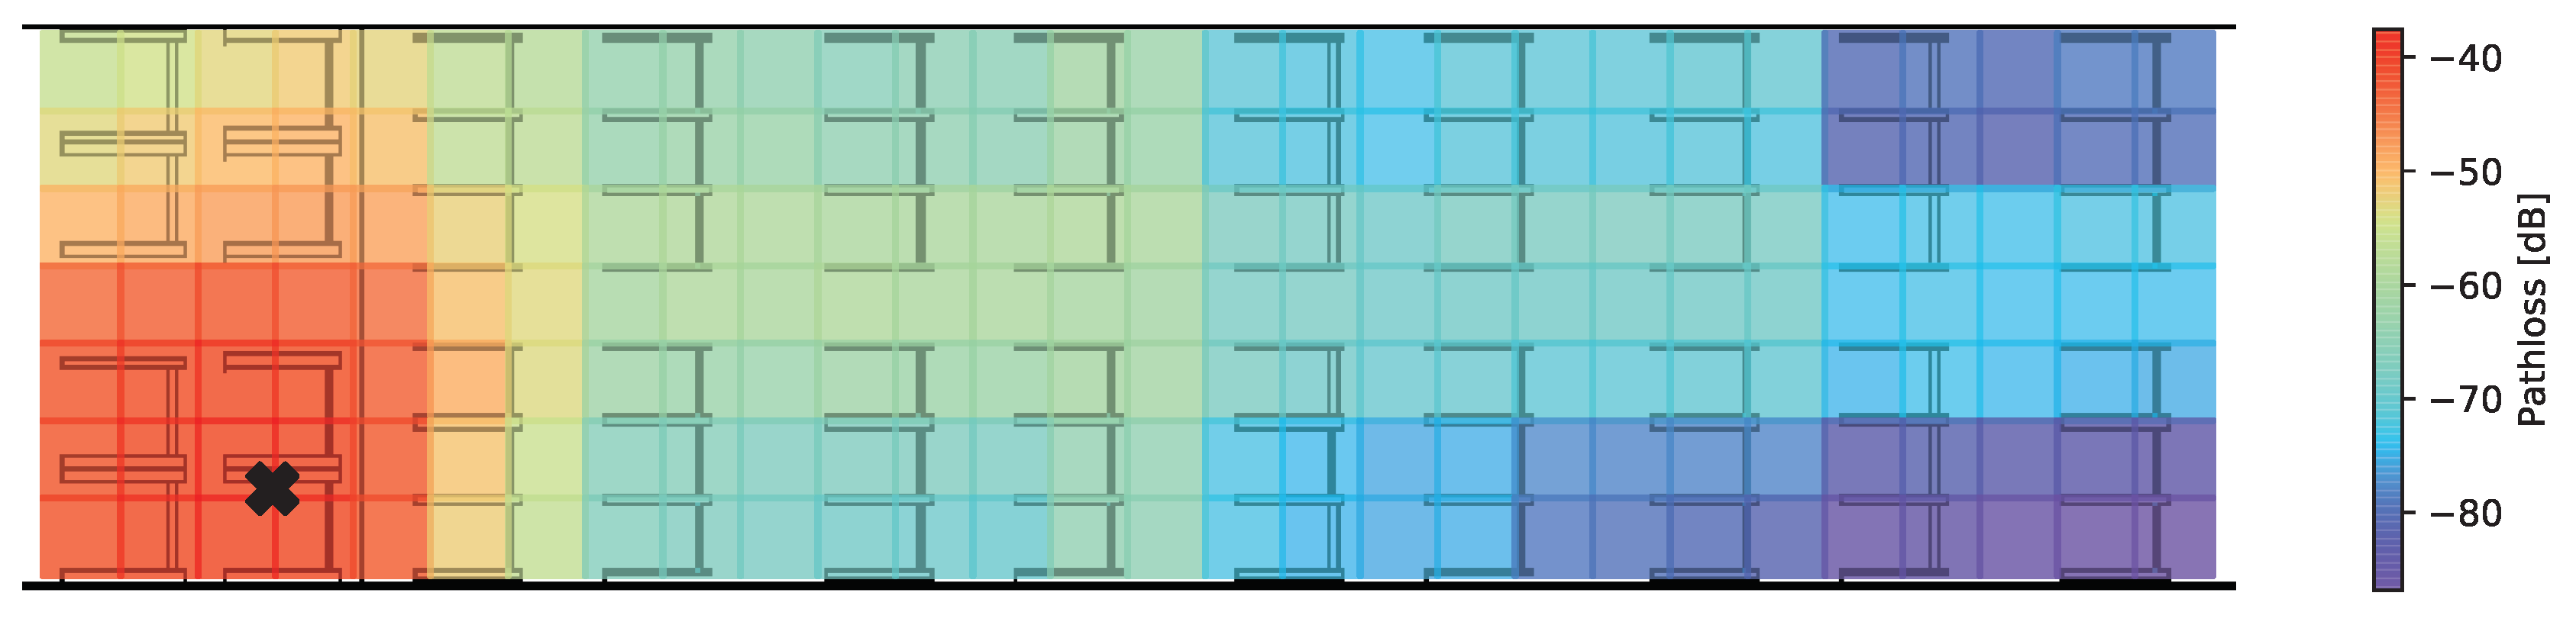
The resulting path-losses are very homogeneous and as can be seen in (
6) only depend on the distance between transmitter and receiver, clearly not taking into account the environment and possible propagation phenomena, leading to a straight forward distance estimation. Additional attenuation caused by objects and structures will result in a heterogeneous propagation behavior, as depicted in
Figure 6. Furthermore, constructive and destructive interference leading to path-loss variations can be observed. This effect is especially observable along the aisle, where fewer obstacles lead to a lower decrease in signal powers compared to the edges.
The variations in these results can essentially be described by (
3). In contrast to the assumed and fixed path-loss in
Figure 5, ray tracing calculates the path-loss as a superposition of signal paths causing different signal strengths. Even if we do not discuss the differences in the simulation results shown above quantitatively, a decorrelation between observable RSSI and spatial allocation is quite obvious.
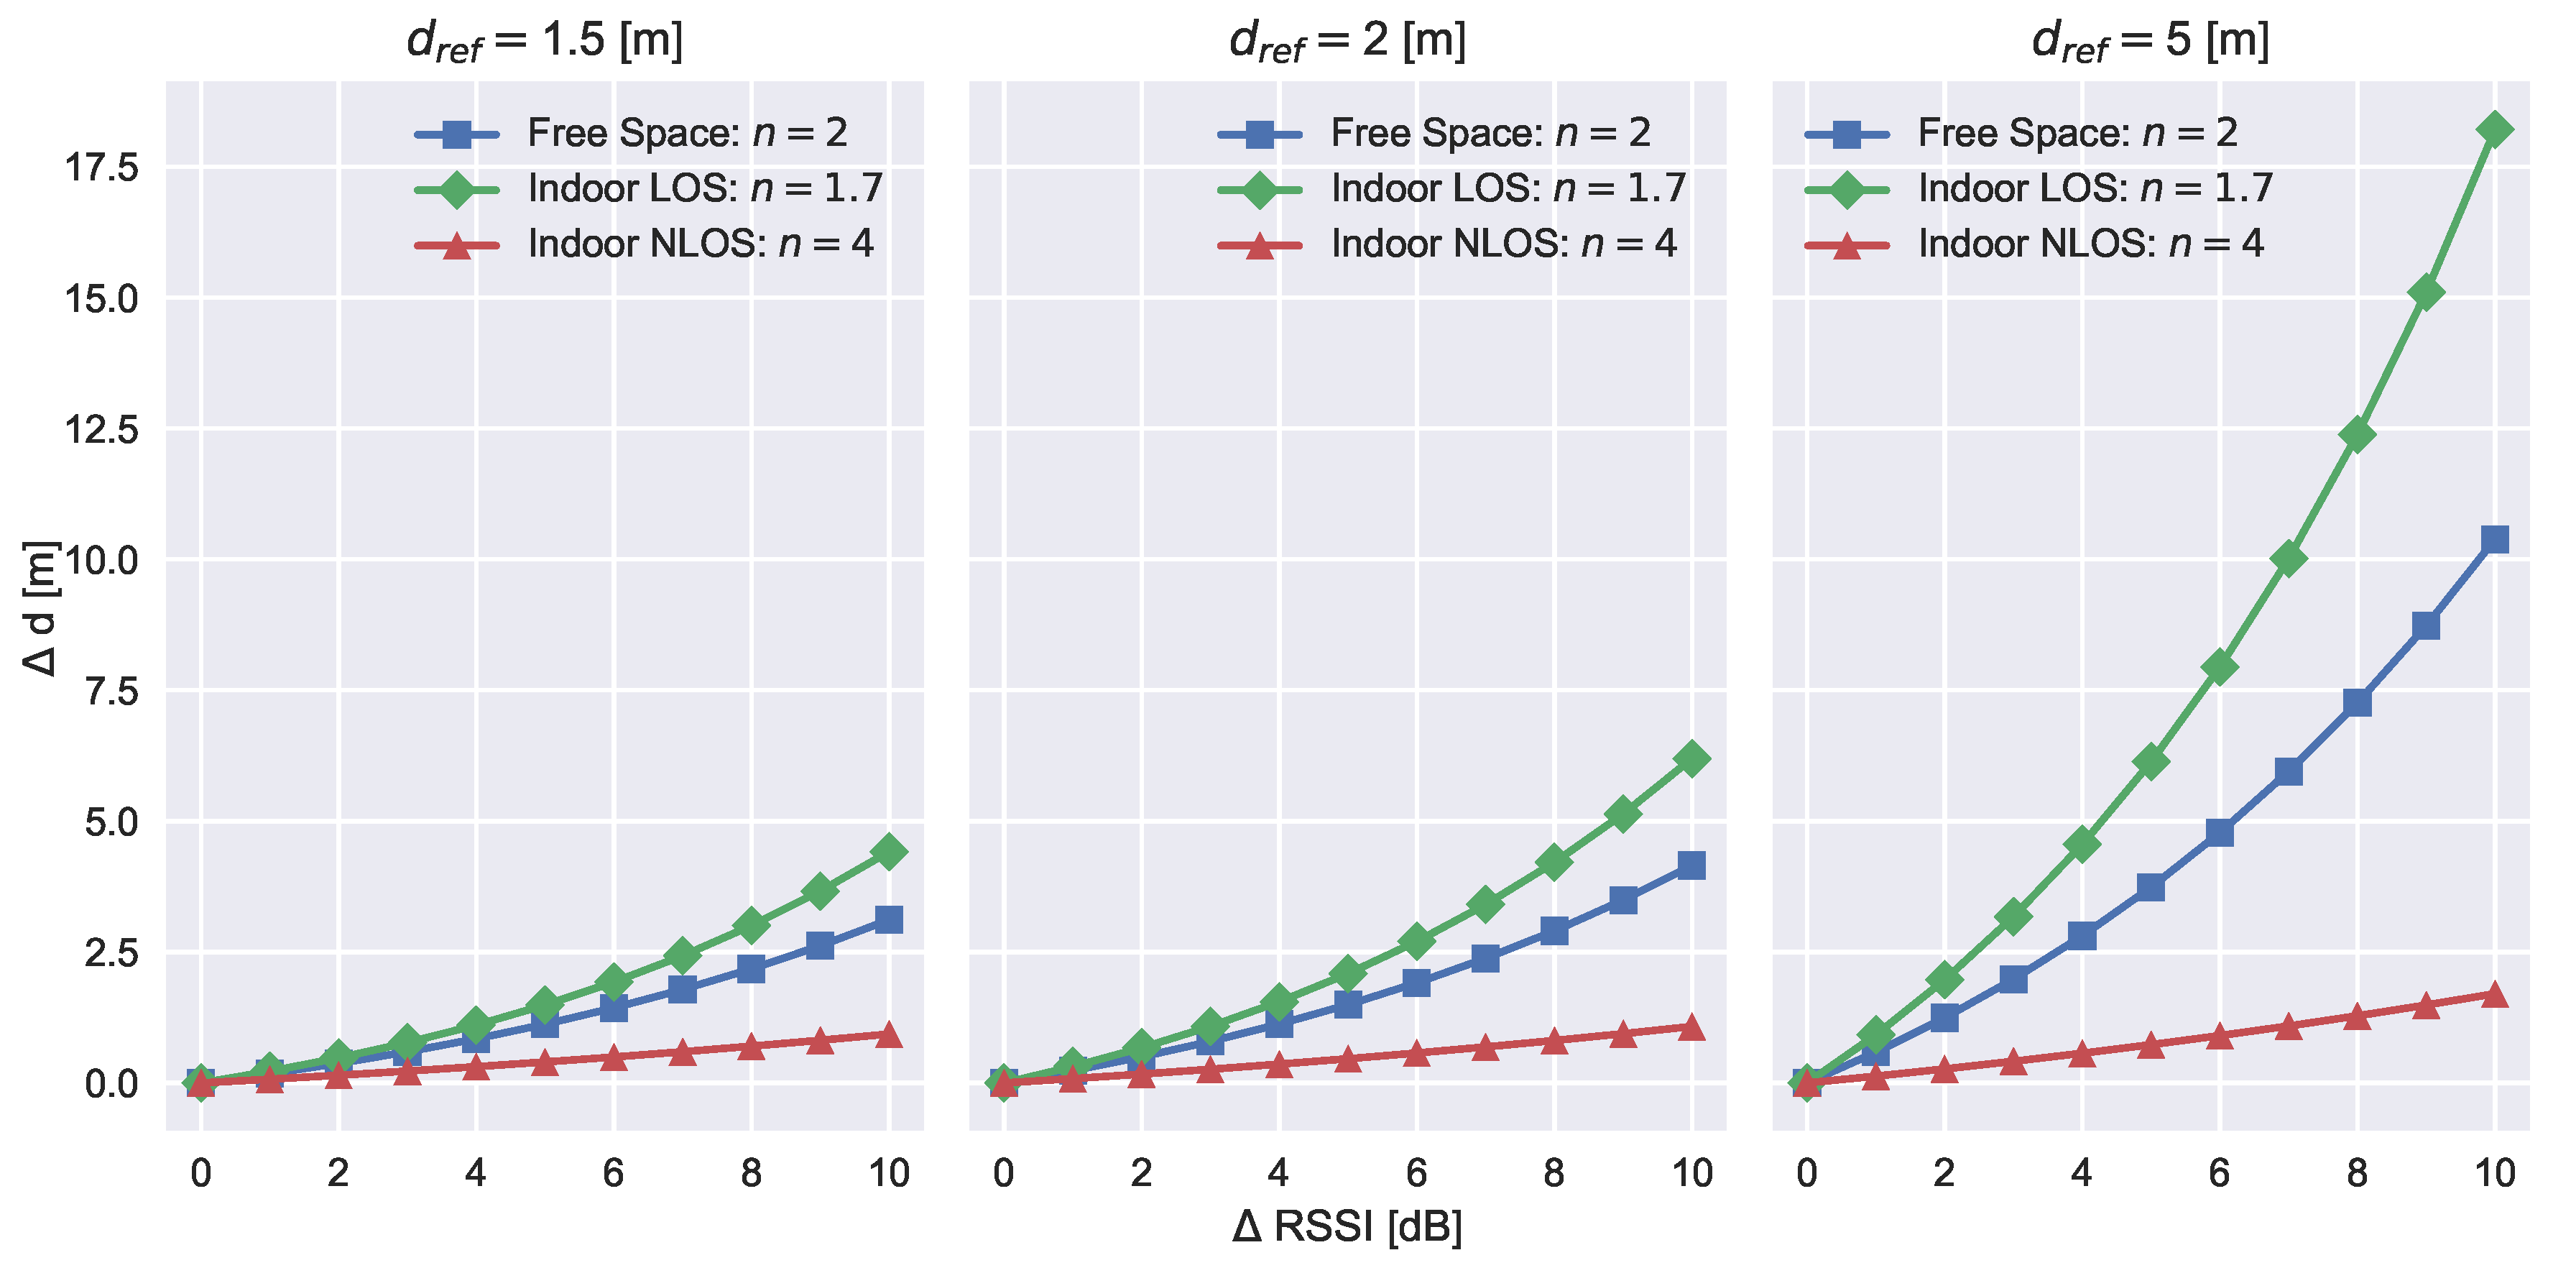
For the introduced application domain of RSSI based contract tracers, the implied consequences of insufficient environmental modeling errors are substantial as they lead to non reliable tracing results. Further supporting this argument is
Figure 7, which shows the distance estimation errors
as a function of measured RSSI errors
. Thus, three reference distances are used (
,
and
with respect to commonly applied path-loss exponents (taken from [
28]).
Due to the logarithmic relation, the difference in estimated distance is always connected to a certain reference distance. The resulting distance errors positively correlate with the true distance between transmitter and receiver while the observable RSSI may remain constant. Hence, a general statement on RSSI measurement error for various constellations resulting in a certain distance estimation error cannot be derived. Additionally, the path-loss exponent plays an important factor in the estimation error.
Figure 6 exhibits that the ray-tracing approach calculates varying path-losses comparing the seats and aisle for similar distances. This effect could be expressed via (
6) by an adaptive modification of path-loss exponents along the seats (e.g.,
) and along the aisle (e.g.,
), which considers the environmental factors in the cabin. However, commonly used mobile devices (e.g., smartphones) do not provide additional information to identify these propagation differences. To further enhance the ranging accuracy, a more in-depth analysis of signal propagation paths is necessary, as the major drawback of RSSI based distance measurements is the incapacity of identifying or dealing with multipath effects.
Expressing the additional paths mathematically can be achieved by utilizing the Channel Impulse Response (CIR)
, which describes the time-domain behavior of the transmission channel consisting of
K time-shifted impulses
represented by the delta function
caused by multipath propagation. The CIR is defined in (
7), where
and
denote the impulse amplitude and reception time delay. The modification of the received amplitudes, phases, and time delays is always strongly related to the transmission environment and the radio channel.
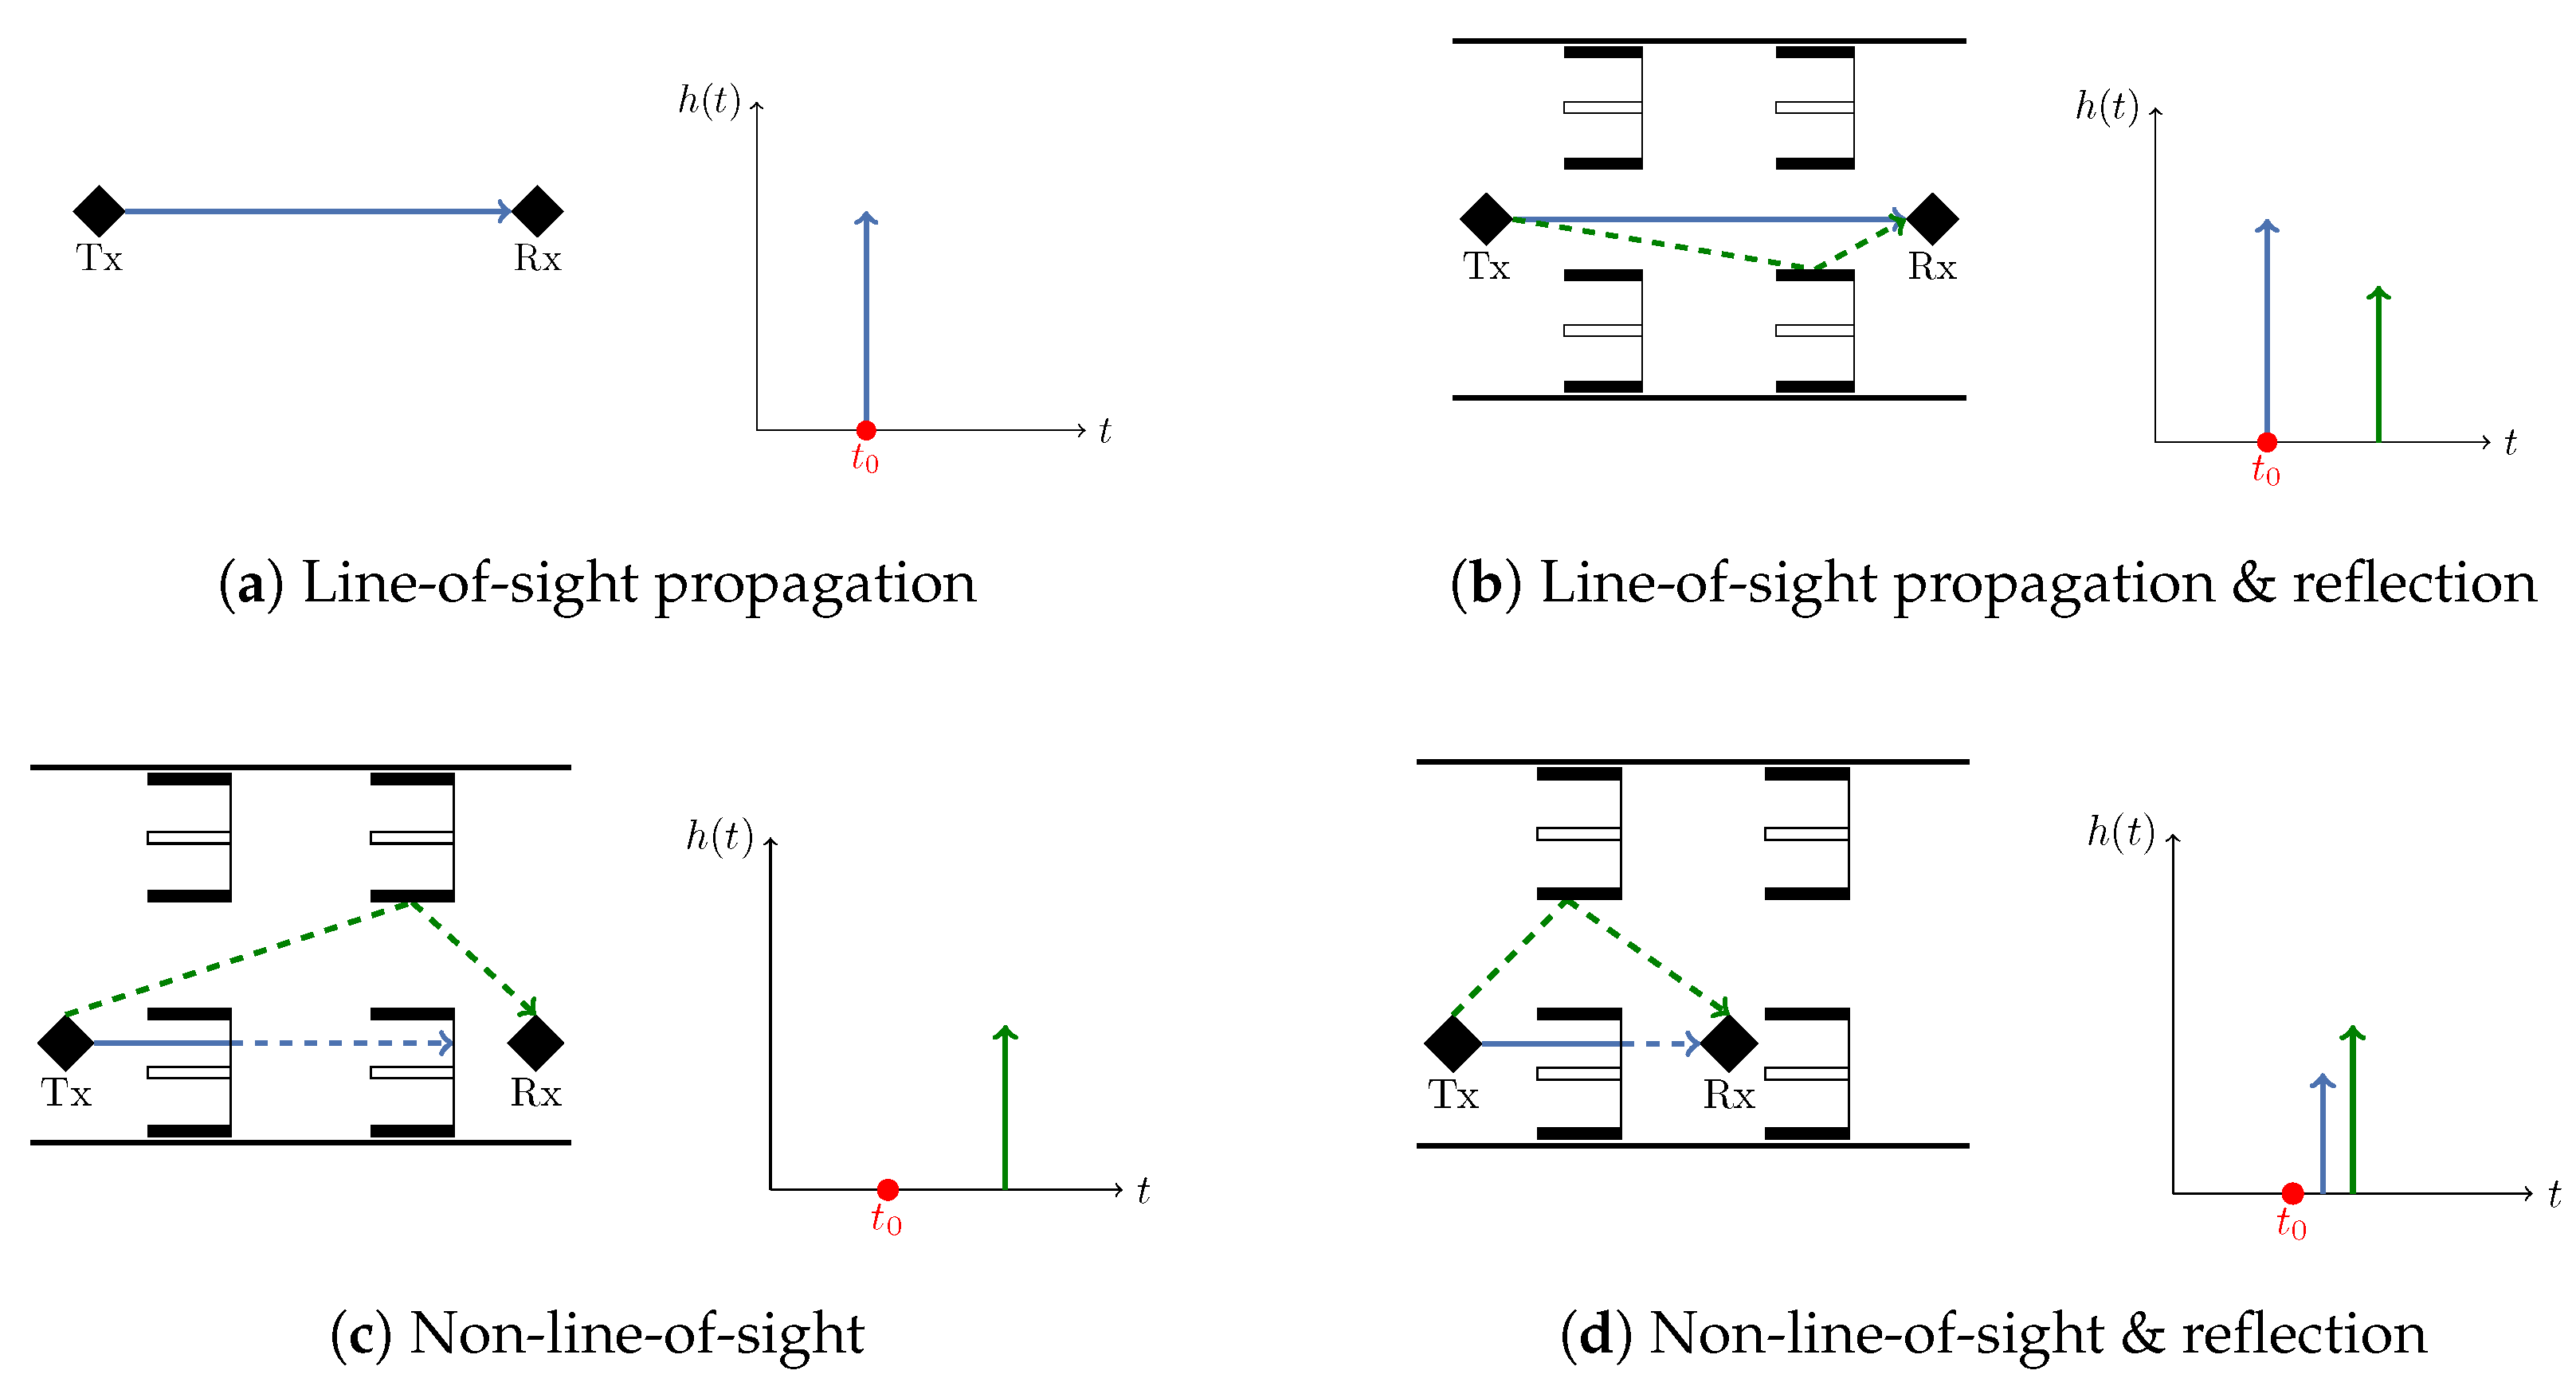
To further develop an understanding of the relation of the environment and the CIR,
Figure 8 gives a schematic overview of how different propagation paths affect the received CIR. Depending on the propagation scenario, leading edge detection on the direct path can be difficult to identify as the direct path can be possibly be attenuated to a level where the amplitude of the peak is below a defined threshold. It is important to note that the strongest path is not necessarily the direct path.
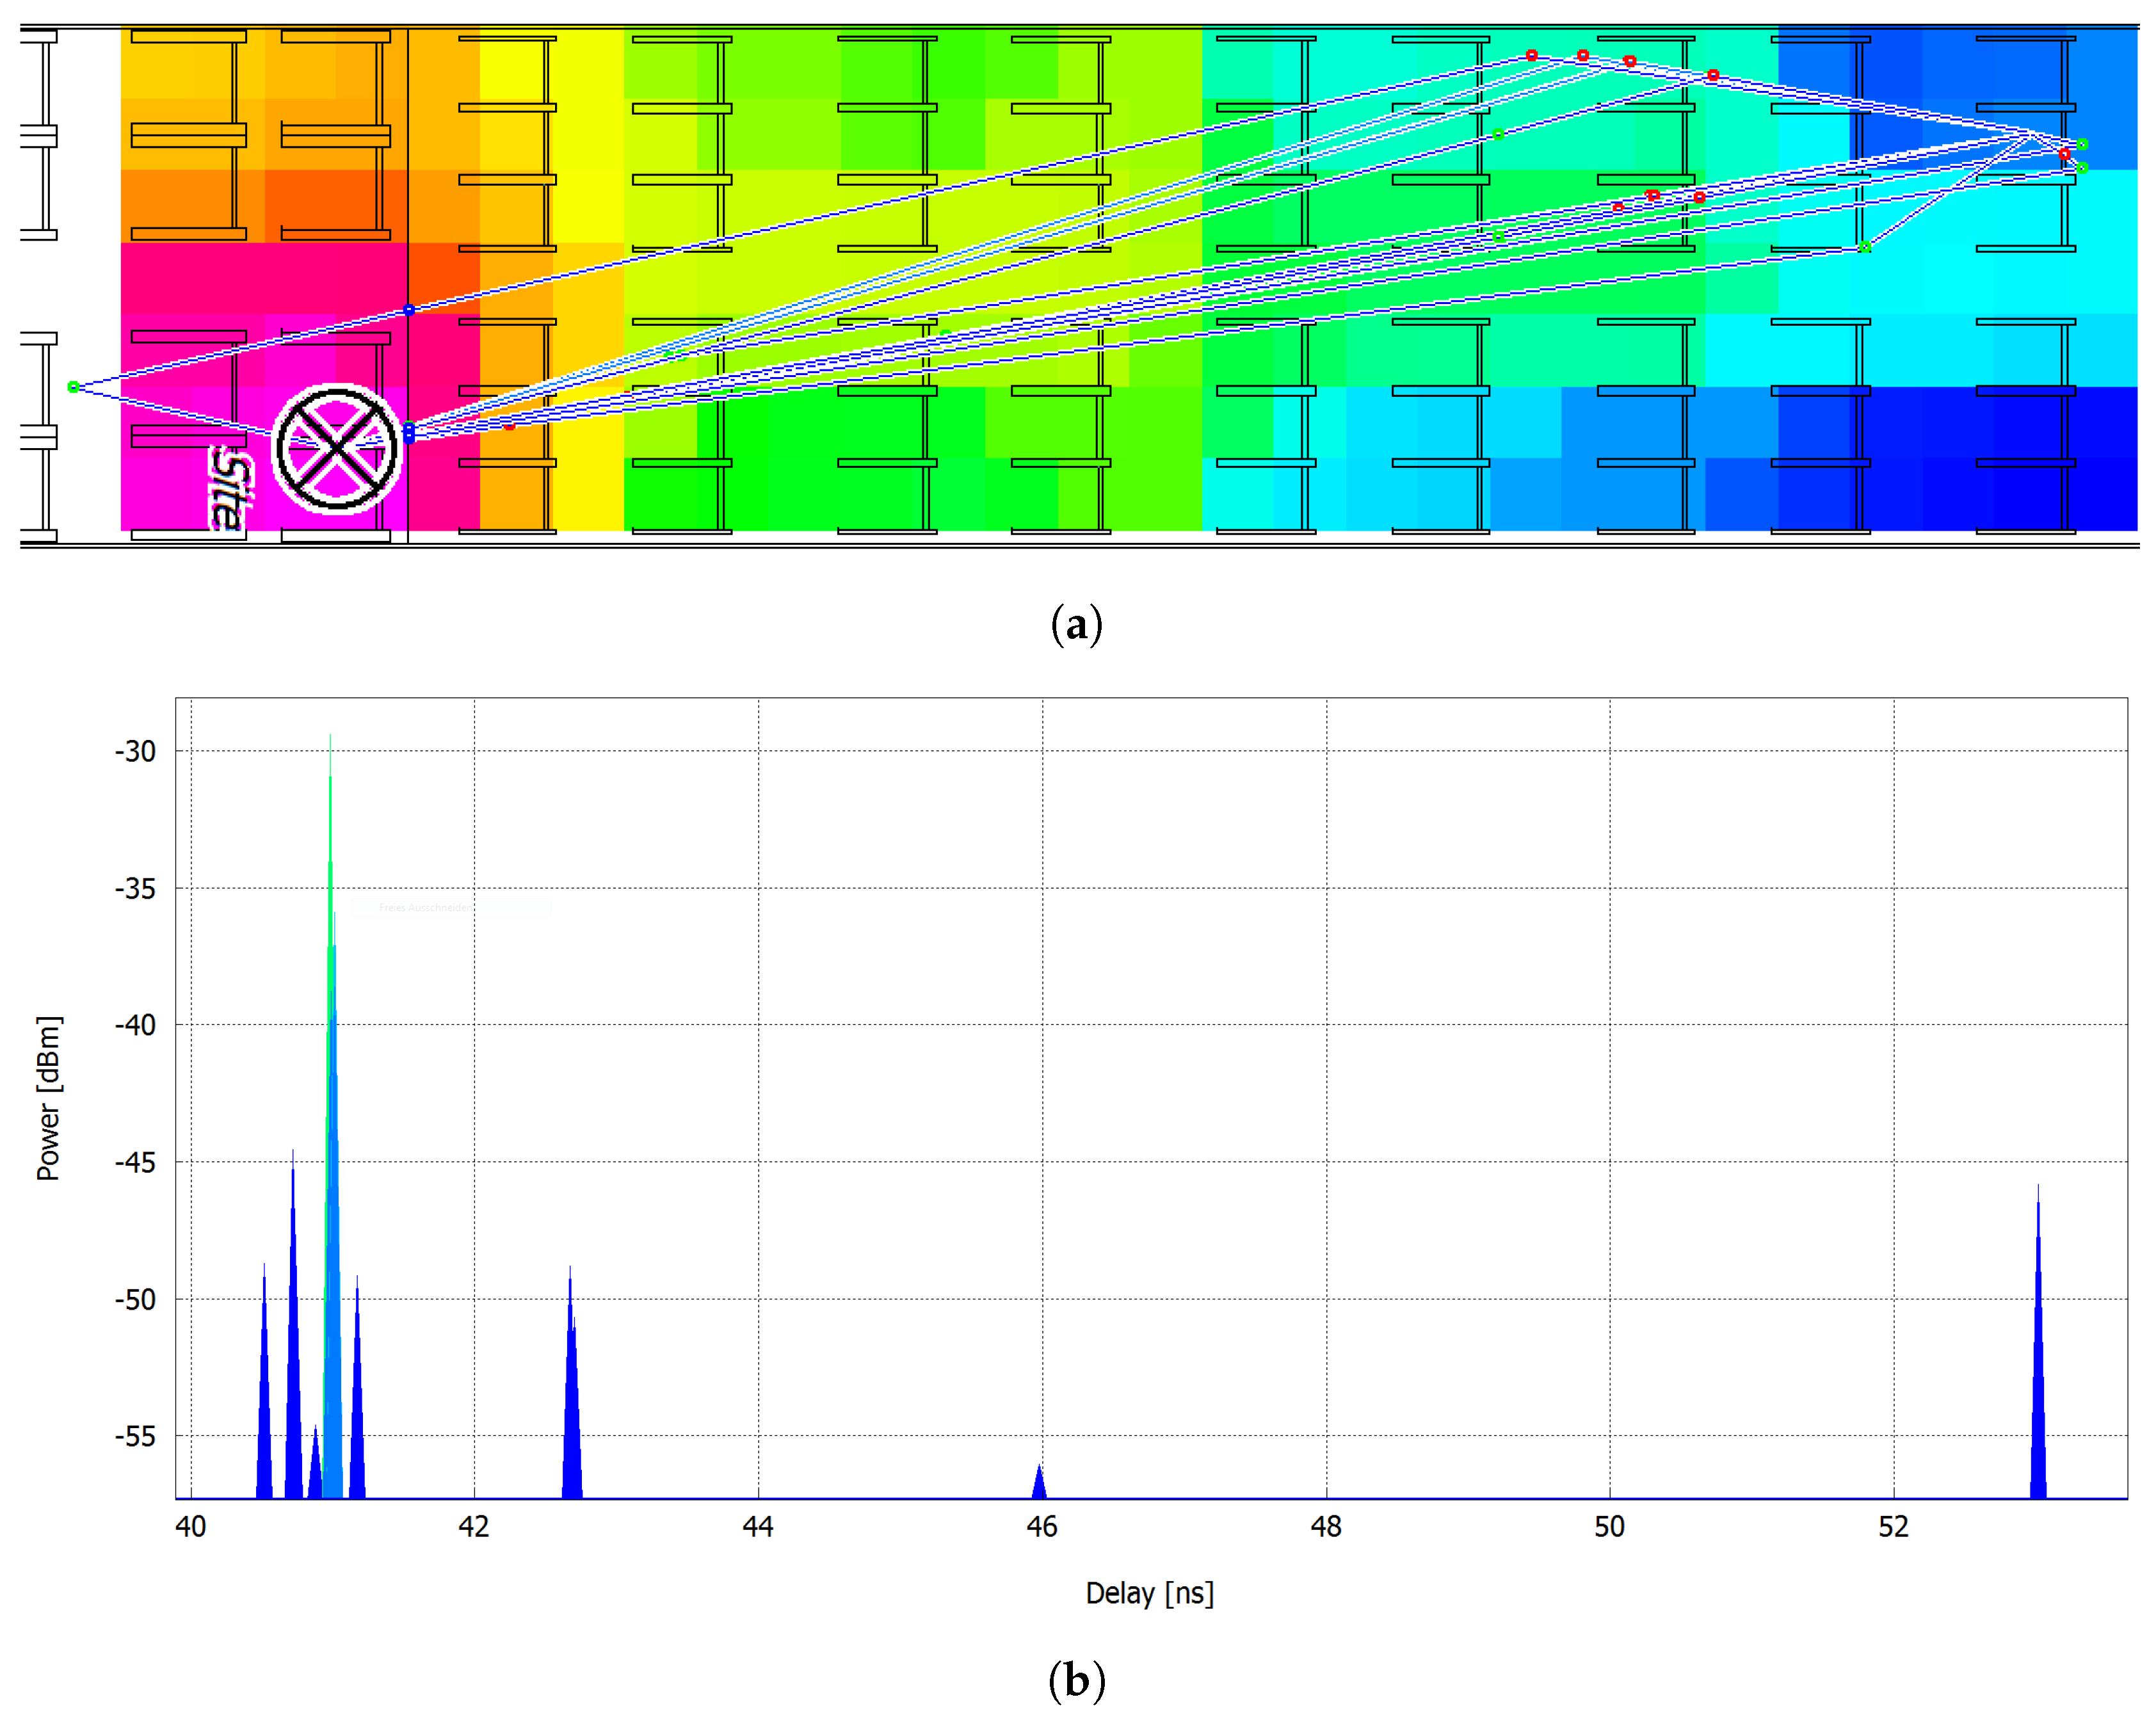
Figure 9 provides a specific example of a multipath reception within the aircraft cabin. Possible signal paths are transmitted from the transmitter located at the left side of the figure to a receiver field on the right (
Figure 9a). Additionally, reception signal powers are visualized. A depiction of the received CIR from the propagation scenario is shown in
Figure 9b, which plots the paths reception power as a function of the time delay.
The figures emphasize two fundamental challenges for technology-aided social distancing in demanding environments like the aircraft cabin or public transportation: (a) dominant path prediction and (b) time resolution. First, due to different spatial paths and superposition, the single signal components of the CIR experience different attenuation. In the given example, this could lead to direct path reception with comparably low power. However, by assessing the CIR, direct path and therefore direct distance estimation is still feasible, even if reflected paths have higher amplitudes due to constructive interference. However, in conditions with a poor signal to noise ratio, the direct path might not even be distinguishable from present noise, hence possibly also leading to erroneous distance estimations. Second, the coloring of the CIR (
Figure 9) reveals a superposition of different signal paths within only a few nanoseconds, which is especially challenging for narrowband technologies as time resolution is depending on available bandwidths. For BLE a bandwidth of
in the
band is available. The sample rate is defined as the inverse of the bandwidth and amounts to about
. In the presented example, seven rays arrive at the receiver in a time interval of
.
5. Conclusions and Outlook
The work presented has discussed the challenges of wireless social distancing and contact tracing in demanding environments, with a specific focus on the aircraft cabin. At the current time, the aircraft cabin is a black-box with no additional information about passengers, crew, and equipment. Future concepts will be enabled by a smart sensor environment, which demands for precise position information (e.g., real-time prediction of boarding time [
39] or dynamic seat allocation in a connected cabin [
40]). In the current pandemic situation, the position information could be further used to ensure an appropriate distance measure between passengers and to facilitate new boarding/deboarding concepts [
25]. We have argued that commonly utilized RSSI measurements can lead to false-positive and false-negative encounter classification, depending on the path-loss model tuning, lowering the reliability and user acceptance of technology-aided social distancing options.
The issue of non-reliable RSSI-based distance determination was supported by a three-dimensional ray-tracing simulation, simulating signal propagation with respect to propagation phenomena, such as reflections, diffraction, and scattering. These environmental effects were also displayed by analyzing a specific scene, discussing the resulting signal paths and CIR. With regards to different reference distances and commonly applied path-loss exponents, we have shown how erroneous RSSI measurements can lead to significant distance estimation errors. The gained insights are also transferable to similar applications such as public transportation, where common RSSI based wireless distance measurements will also not correlate with the actual distances due to multipath reception and signal interference.
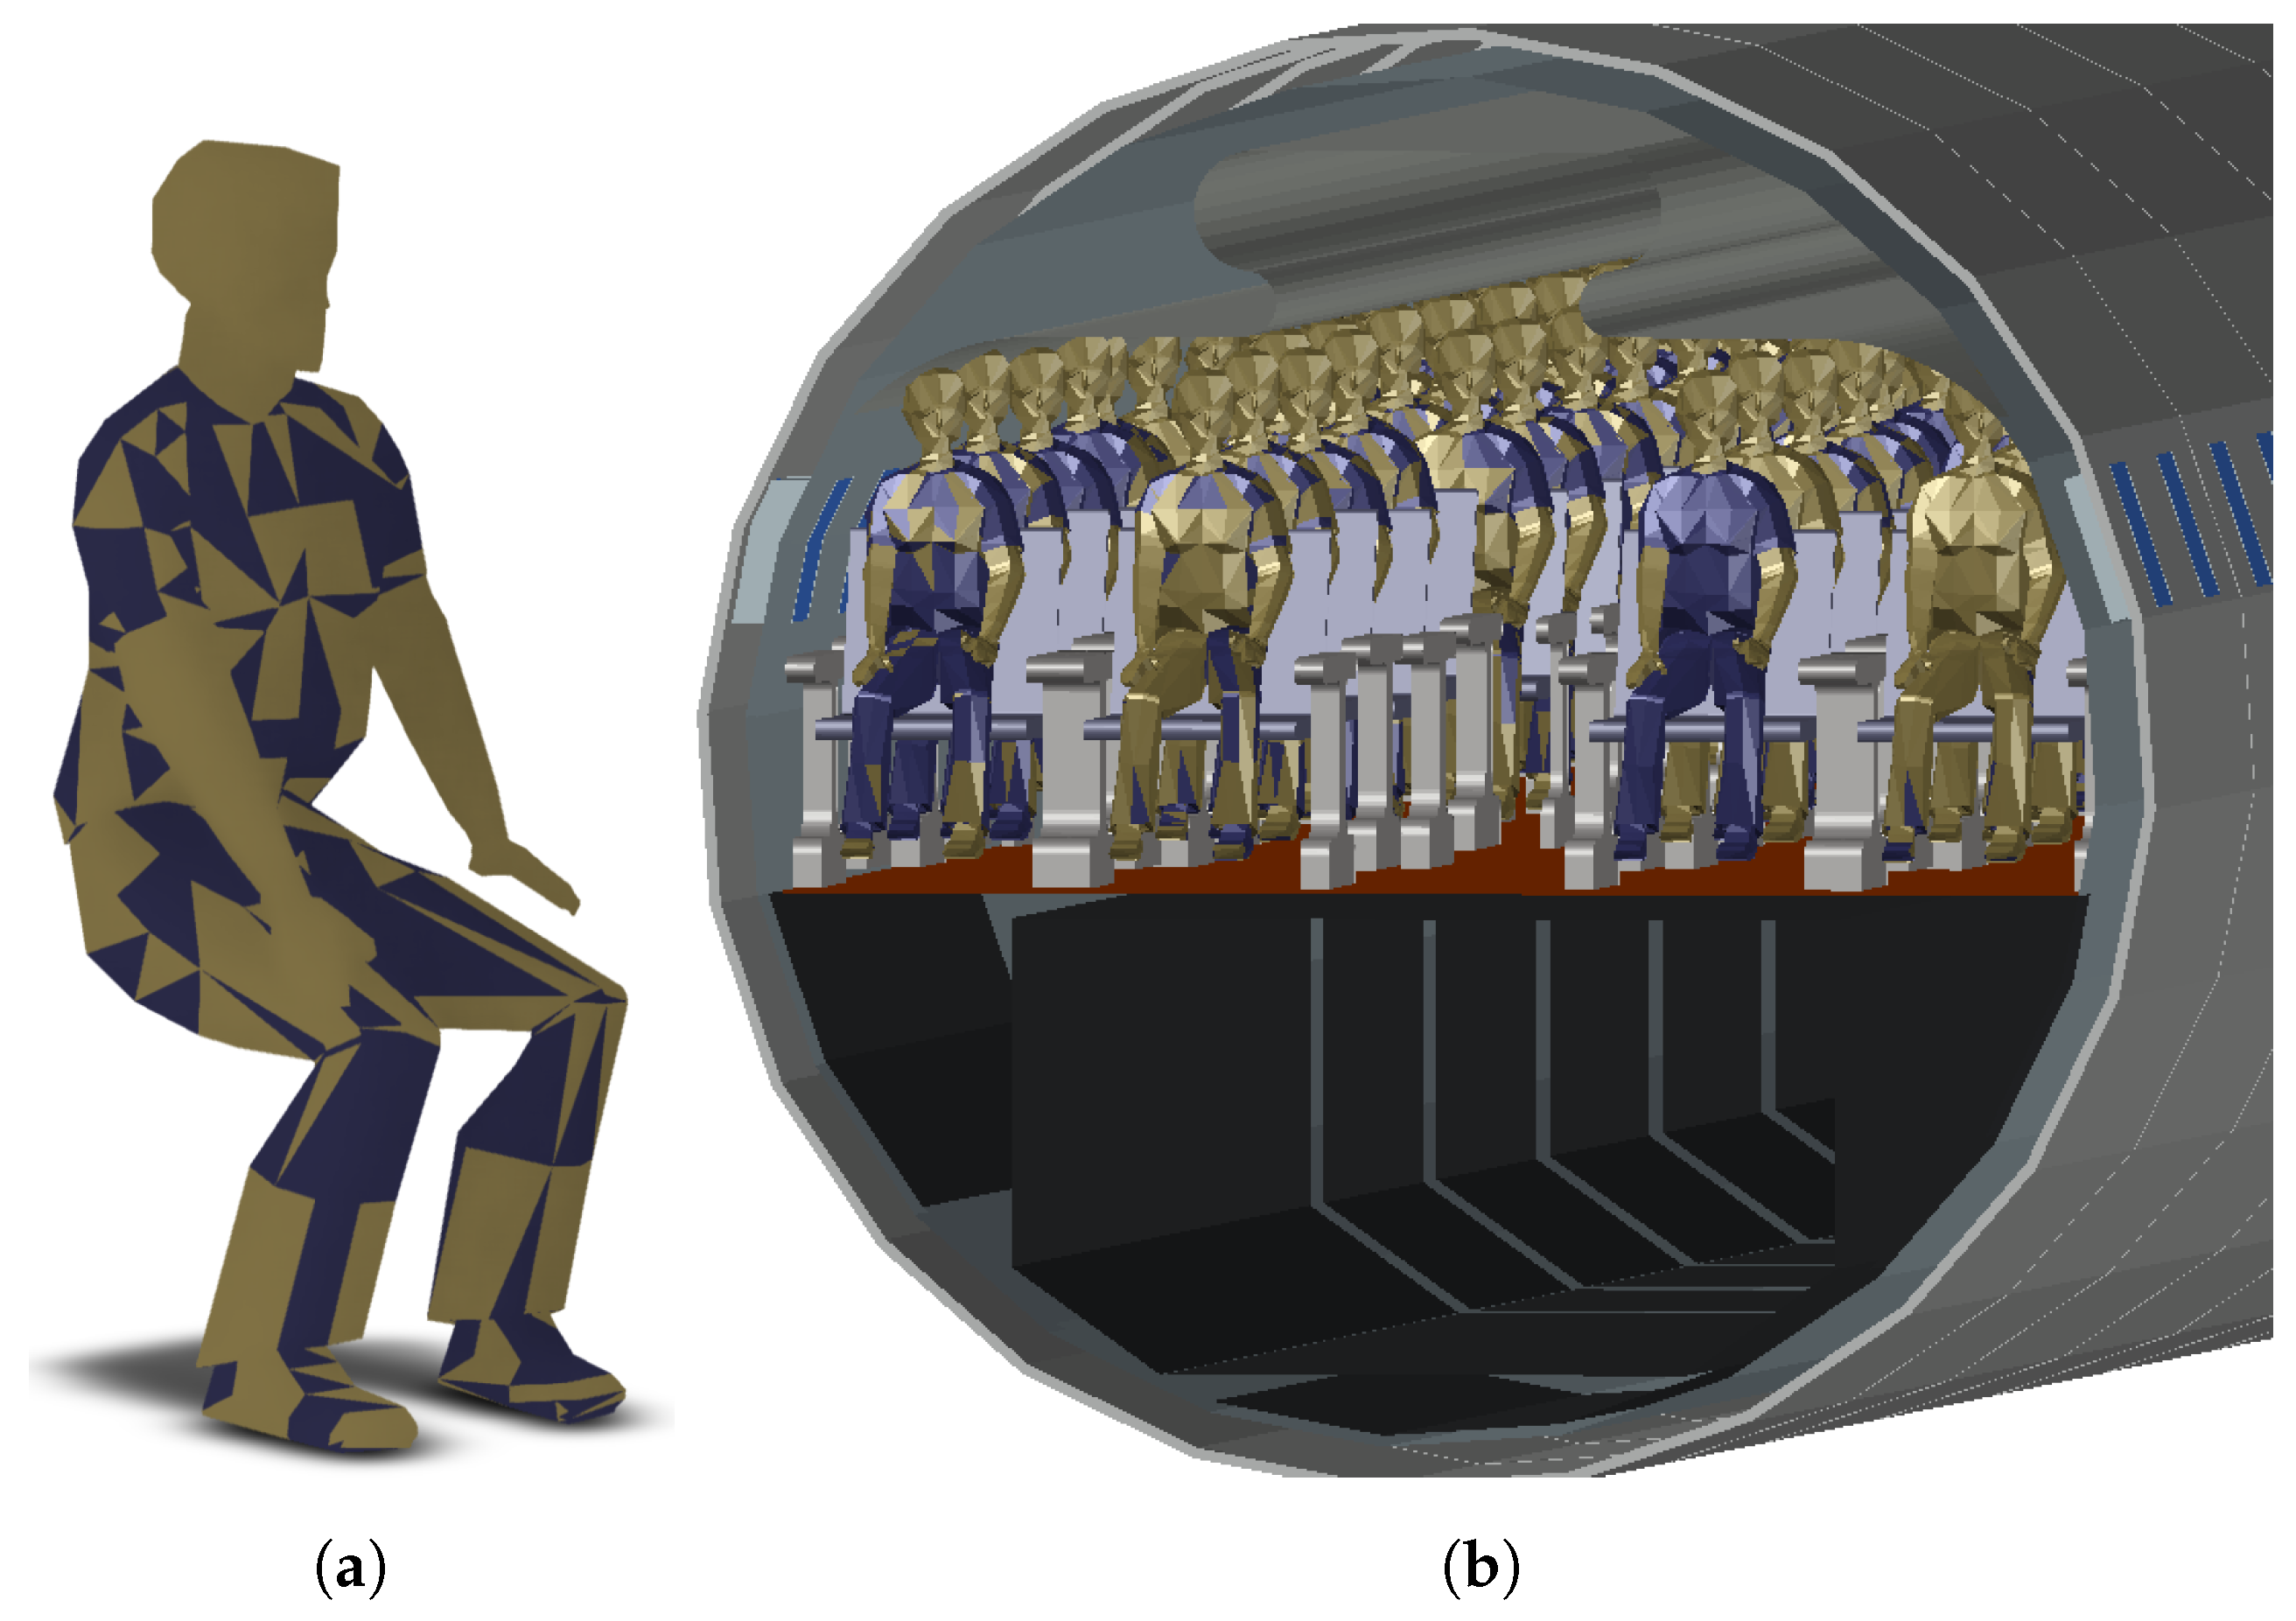
Our simulation does not yet consider the human factor, related immanent attenuation, or movement induced fading. Thus, we already started working on modeling and including passengers in our cabin simulation configuration. The resulting CAD models are shown in
Figure 10.
Next to the discussed issues of RSSI relative user distance estimation, the conversion to connected cabins can also be utilized to enable passenger monitoring and management. Due to the possibility of providing stationary communication devices, absolute positioning can be realized in addition. This also allows usage of more versatile hardware, as market penetration does not factor in anymore since passengers can be equipped with customized hardware during boarding and deboarding. Furthermore, this enables the exploitation of additional signal measurands, such as run-time based on UWB or channel state information (CSI) [
19,
29], as these are typically not (yet) supported by smartphones or similar devices. Using these will allow for more robust distance estimation compared to traditional RSSI ranging. UWB provides a wide frequency spectrum (
), which enables a comparably high time resolution. This allows a distinction of different signal paths making distance estimation more robust against multipath interference. CSI enables the analysis of the CIR and is starting to be available for commercial chips, such as WiFi [
41]. In addition, the first BLE chips that support CSI are also becoming available [
42].
From an application point of view, a possible implementation of the proposed technological approaches could look at the following: All passengers are passed radio beacons during check-in. These beacons could be designed as bracelets or pendants and may be combined with a smart boarding pass. Such smart devices can include a display, speakers and a vibration interface. Using such distance tracing hardware, possible application scenarios include:
Real-time proximity warning: As soon as two passengers are detected below a given proximity threshold, an audio or vibration alarm is triggered in order to warn the respective persons.
Post-processing contact tracing: Radio beacons or smartphone apps are used in order to store proximity information. If a person was tested positive afterward, all former contacts could be informed about this critical encounter. This scenario resembles the scheme of existing contact tracing apps.
Boarding/deboarding scheduling: In order to ensure distancing while boarding/deboarding, passengers may be allocated to distinct groups, which are processed after each other. Group affiliation, boarding path, and time may be communicated via the beacon’s visual interface.
For future work, we intend to incorporate contact tracing and absolute position tracking of passengers in our connected cabin sensor framework, enabling control of passenger flows and therefore actively reducing transmission risks in a pandemic scenario.
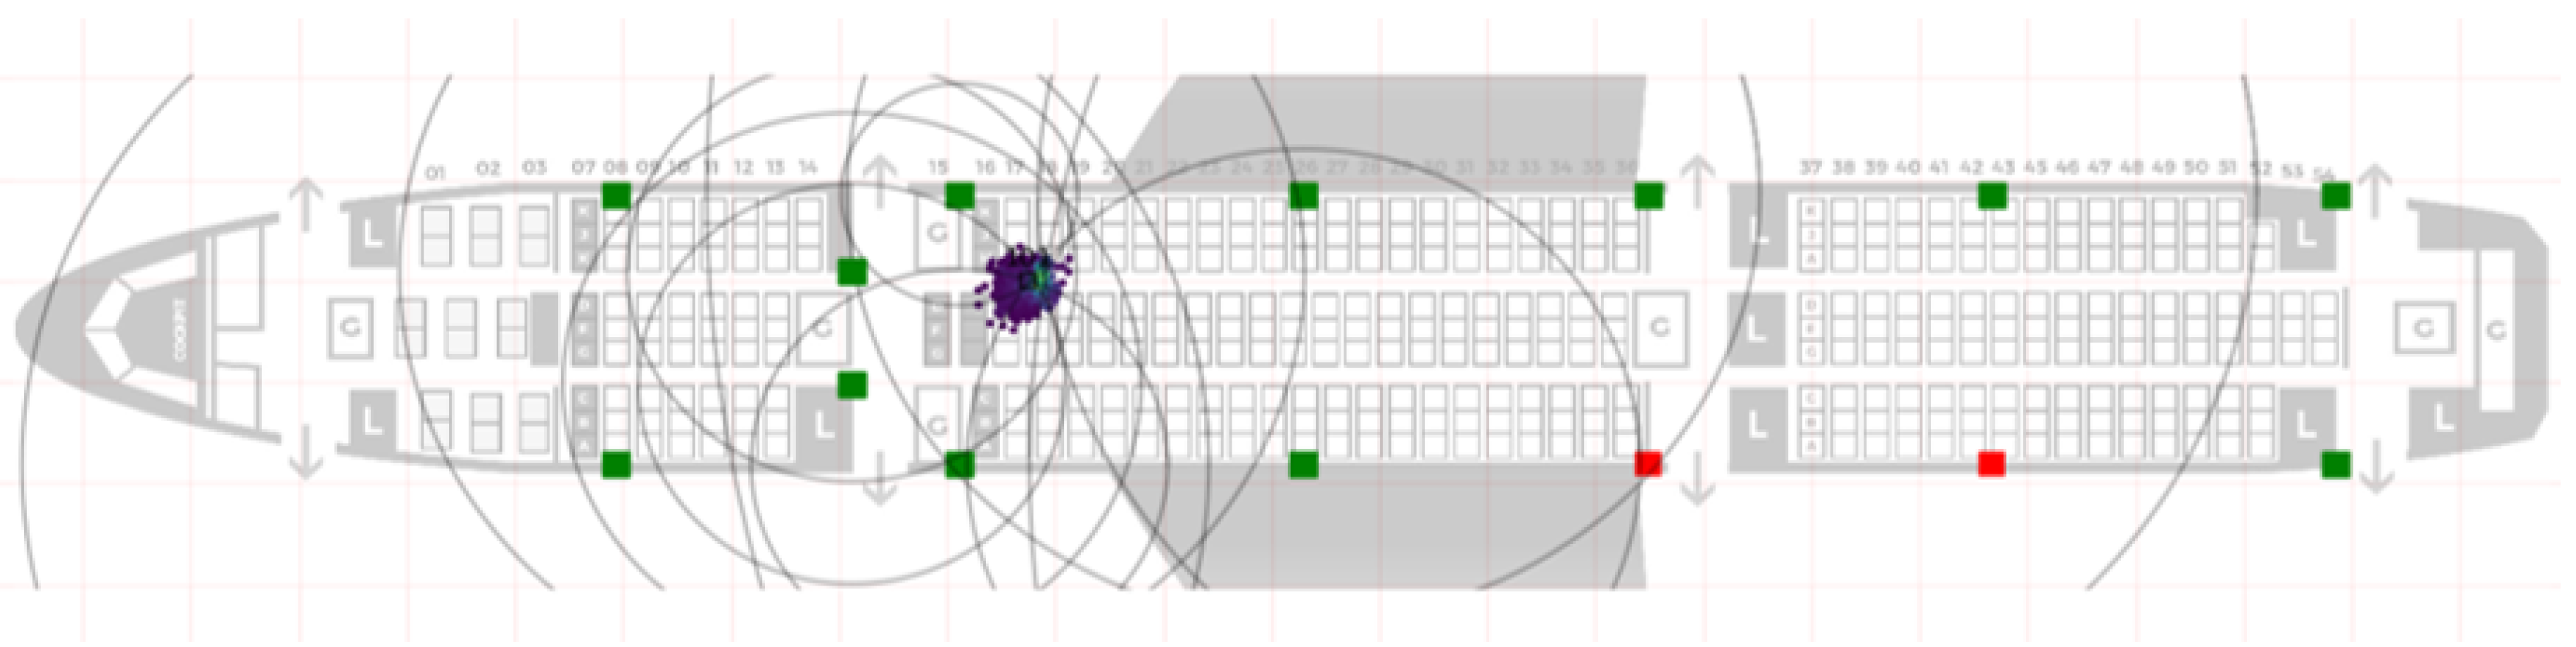
Figure 11 shows a part of our positioning GUI based on stationary anchor nodes and mobile devices using a Particle Filter approach [
43].
Our sensor environment will be a key element to monitor and manage passenger activities in the aircraft cabin by providing an advanced situational awareness about individual positions and system states (e.g., occupation of the aisle or status of overhead compartments). This information will be used as input to ensure safe, operationally efficient, and passenger-oriented processes. Furthermore, we expect that new sensor technology will lead to new product developments and services.

 ,
, 


