Abstract
Many studies have been carried out to evaluate the sustainability of transportation systems, but little attention has been given for the design of roadway intersections. This study aimed to establish a framework and develop a tool to assess the sustainability of roadway intersections from a road-user perspective. Sustainability indicators at the strategic level were extracted from the literature and were utilized with relative weights to develop economic, environmental, and social indices that would be combined into a composite sustainability index (CSI) tool. The tool was applied to four case studies of intersections in Al Ain, United Arab Emirates. For each case study, the sustainability of fifteen design alternatives was evaluated for different scenarios of traffic volume and operational speed. Dimensional indices and the overall CSI were determined using the Multi-Criteria Decision Making method. Results indicated that traffic volume had a significant impact on intersection sustainability ranking, while the effect of operational speed was insignificant. Moreover, weight assignment had an effect on determining the most sustainable design alternative, where the best alternatives of the dimension with the major weight would most likely be the most sustainable. The developed tool would assist decision-makers in other cities to assess intersection projects that correspond to their regional goals.
1. Introduction
With the recent “industrial revolution”, the economic and industrial sectors undertook fast developments. Unfortunately, some of these developments were at the expense of a lot of natural and social equity considerations. As a result, “sustainable development” was introduced to encounter any negative impacts. Sustainable development can be defined as the “development that meets the needs of the present generation without compromising the ability of future generations to meet their own needs”. This definition reflects the three aspects of environment, economy, and social equity [1].
Transportation activities and projects play a big role in urban development that should be carefully considered. The International Energy Agency (IEA) claims that transport activities were responsible for approximately a quarter of the total global greenhouse gas (GHG) emissions in 2016 [2]. Poor air quality also has a significant impact on socio-economic wellbeing. Increased air pollution would lead to an increase in healthcare expenses and loss of working days due to illnesses, as well as a decrease in productivity levels in both public and private companies [3]. Therefore, achieving transport sustainability is a huge step in obtaining sustainable urban development.
Evaluating transportation sustainability has been a highly discussed topic throughout the years. Currently, a common state-of-practice for measuring sustainability in transportation is by matrices of performance indicators. Some developed frameworks and indicator matrices for evaluating transportation sustainability were introduced by several researchers [4,5,6,7,8,9,10,11,12]. However, it should be noted that while most of these studies focused on evaluating road transport sustainability, little attention was given to specifically evaluating the sustainability of the design of roadway intersections.
In the United Arab Emirates (UAE) and especially in the Emirate of Abu Dhabi, sustainable transportation plays an essential role in the achievement of Abu Dhabi’s Vision 2030. The “Plan Abu Dhabi 2030” aims to help respond to current and future development needs, establish a planning culture and introduce strong guiding principles for new development in a sustainable way [13]. An essential part of road projects is the construction of intersections. Intersections in the UAE vary by type and size. Abu Dhabi city itself has more than 460 roundabouts [14]. The aim of this study was to develop a methodology for evaluating the transportation sustainability of intersections using an index-based multiple criteria decision-making technique. The resulting tool generated an index for each design alternative, called the composite sustainability index (CSI), representing its overall sustainability. This methodology is directed towards the macroscopic and strategic planning of road intersections.
2. Materials and Methods
2.1. CSI Framework Development
The first step in developing the CSI tool was to define the sustainability dimensions under consideration followed by the extraction of related indicators from the literature. The indicators reflected the three major sustainability aspects (social equity, economic development, and environmental sustainability) from a road-user perspective. After that, the Multi-Criteria Decision Making (MCDM) method was applied to evaluate the proposed intersection design alternatives based on the chosen set of indicators. Specific weights were assigned to the indicators as part of the Technique of Order Preference by Similarity to Ideal Solution (TOPSIS) analysis of the MCDM method, which enables the determination of the CSI for each design alternative. Figure 1 shows the framework of the proposed methodology.
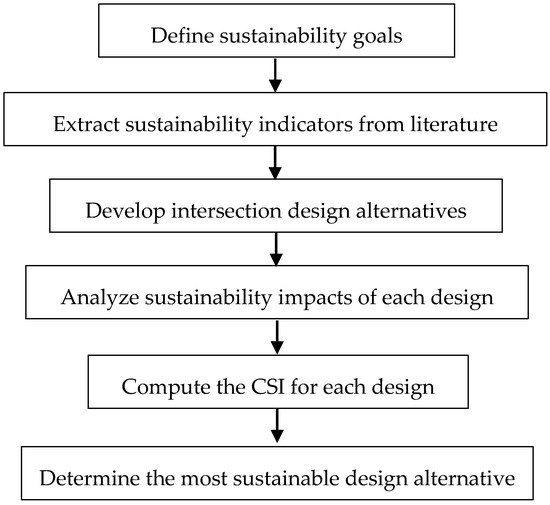
Figure 1.
Proposed methodology framework.
This study defines transportation sustainability as the transport that provides equity and safe access to its users, enhances the economic efficiency of road users, and minimizes the harmful effects of transportation activities on the environment. Hence, the three main pillars of transportation sustainability that are considered in this study are the economic, environmental, and social dimensions.
A common method for choosing the corresponding sustainability indicators is to check their adherence to certain criteria. This study focused on some of the common criteria that were suggested by Castillo and Pitfield [15], namely: (1) Measurability, where the indicator should be measurable in a way that is theoretically sound, reliable and simple to understand. (2) Ease of availability, where the data for the indicator should be available for collection at a reasonable cost and effort. If the data were obtained using a model, the model should be reliable and theoretically acceptable. (3) Interpretability, where the indicator value should provide clear information that all the stakeholders can understand with ease. Moreover, the indicators used in this study would focus on the perspective of the road-user. The study provides a macroscopic dimension that is of use for strategic purposes in the early planning stages. A comprehensive list of indicators that were extracted from the literature is shown in Table 1.

Table 1.
Sustainable transportation indicators collected from the literature.
2.2. Selection of Sustainability Indicators
The extracted list of indicators was refined with respect to the previously mentioned criteria. Several economic, environmental, and social indicators were selected. The percentage of chosen indicators from the comprehensive list (Table 1) ranges from 22% to 38% for the three dimensions, which ensures a fair relative selection process of the sustainability indicators.
The selected economic indicators are initial cost, operational cost, and economic efficiency. Knowledge of the initial cost is necessary for decision makers who care about finding equity in the financial state. Since the employed tool is used for evaluating alternatives in the early stages of transport planning, an exact or even an estimated cost may not be available. Nevertheless, this tool allows the ranking of alternatives as a means of comparison instead of using real values. The operational cost reflects the cost of fuel for operating all the vehicles in addition to the time cost of the passengers occupying those vehicles. Finally, the economic efficiency indicator is represented by the monetary value of the total hourly time traveled. This measure uses the time value factor to directly present the value of the traveled time per vehicle in monetary units. The monetary value makes it easier for stakeholders to understand the economic efficiency indicator.
The environmental dimension includes three main indicators: energy consumption, GHG emissions, and land consumption. Energy consumption has the fuel consumed in liters per vehicle as a performance measure. The emissions considered are CO2, hydrocarbons, CO, and NOx, expressed in kg per hour per vehicle. The last selected environmental indicator is land consumption (the exact area needed for the intersection and approaches) as a measure for quantifying the consumption of natural resources. Minimizing the area consumed would achieve higher scores for sustainable development.
The selected social indicators are mobility, public satisfaction and safety. The chosen performance measures for mobility are vehicles’ average speed (km/h), total passenger miles traveled per hour (m/h), and total travel time of vehicles (h). The average speed represents that of vehicles in the peak hour of the day with the peak demand on the intersection. This gives an indication of how the vehicles maneuver through the intersection and the level of service it can provide. For the total passenger miles traveled, it considers the passengers occupying the vehicles along with the pedestrians crossing the intersection. Public satisfaction can be quantified indirectly by obtaining the average hourly delay per person (for both passengers of the vehicles and pedestrians crossing the intersection). The less the delay, the more satisfied the users would be with the service (of the intersection).
The last indicator of the social dimension of sustainability is safety. Quantifying safety in the early stages of intersection planning can be quite tricky due to lack of data. The suggested method used in this study is the qualitative assessment of safety using a ranking procedure based on previous literature and the number of conflict points of the intersections. However, the ranking in the literature can vary depending on the region or time period of the conducted study due to differences in road users’ behavior and the perceptions of local citizens. Nevertheless, this method seems good enough for the purpose of this study. Customized ranking using the opinions of a specialist panel can be considered when applying this tool in real life to the specific proposed project designs. Another method for ranking the alternatives objectively is by considering the conflict points for each design as having implications for safety. Having more conflict points for a certain intersection design makes the intersection less safe. In this study, those two methods were combined to assess and rank the safety of the different design alternatives of the intersections.
2.3. Calculation of CSI
After determining the set of sustainability indicators, the proposed intersection design alternatives can be evaluated using the MCDM method. This method allows for the observation of trade-offs in each individual sustainability dimension. Hence, stakeholders can have a better understanding of the sustainability impacts regarding each design alternative. TOPSIS analysis is a technique under the MCDM method. It allows the evaluation of the criteria in an individual and collective manner, using various relative weights assigned by stakeholders for dimensions, criteria, and indicators. A brief explanation of the TOPSIS algorithm used is provided below [23].
To evaluate a set of alternatives for a multi-attribute decision making problem with the alternatives defined by A = (A1, A2, …, Am), the criteria set defined by C = (C1, C2, …, Cn), and the jth criteria’s value in the ith alternative defined by xij, the decision matrix can be presented as X = [xij]m×n. Eliminating the effect of the different criteria units and their varying range on the sustainability evaluation would require normalization across the values of the original matrix. Hence, the normalized decision matrix is R = [rij]m×n, where rij is determined by Equation (1).
The weighted decision matrix (V) is determined by multiplying the criteria weights (wj) by the normalized decision matrix, as shown in Equation (2).
The ideal best solution is composed of the optimal value of every attribute from the weighted decision matrix, as shown in Equation (3), and the ideal worst solution is composed of the worst value of every attribute from the weighted decision matrix, as shown in Equation (4).
The ideal best value and ideal worst value are determined by Equations (5) and (6), respectively.
The distance of every possible solution from the ideal best solution and the ideal worst solution are computed, respectively, by Equations (7) and (8).
The relative degree of approximation (CSIi) is calculated by Equation (9).
The object of evaluation, which is sustainability in this study, is ranked according to the value of the relative degree of approximation, which is coded as “CSI” to conveniently represent the composite sustainability index used in this study. The higher the value, the better the sustainability of the alternative.
Relative weights show how much an indicator contributes to the concept of sustainability as a whole and with respect to its relevant dimension of sustainability. Two weighting attempts would be considered. The first attempt would be to equalize the weights across the three dimensions of sustainability and within the set of indicators. The second attempt would be to introduce variations in the main weight distribution of the three dimensions of sustainability. A major part of the weight (80%) would be placed on one dimension, while the other two dimensions would equally share the remaining minor weight (10% each). This variation would alternate through the three dimensions and the difference in the final ranking of the alternatives would be observed. This demonstrates how the interests of specific stakeholders can produce a change in the sustainability direction.
3. Case Study Application
3.1. Considered Cases and Design Alternatives
The previously developed framework was demonstrated in four case studies in Al Ain city, UAE (Figure 2). The case studies include four roundabouts, namely, Asharej Roundabout, Al-Markhaniya Roundabout, Al-Ahliya Roundabout, and Al-Dewan Roundabout. They are connected by four main streets, which are Sheik Khalifa Bin Zayed Street, Hazzaa Bin Sultan Street, Shakhboot Bin Sultan Street, and Zayed Al Awwal Street. Each of the considered roundabouts has four arms with three lanes for each approach, exit lanes, and circulating lanes. Al-Ahliya and Al-Dewan roundabouts have an operational speed of 80 km/h on all four arms while Al-Markhaniya and Asharej roundabouts have varying operational speeds of 80 km/h and 100 km/h. Moreover, Al-Ahliya Roundabout is currently being transformed into a signalized intersection.
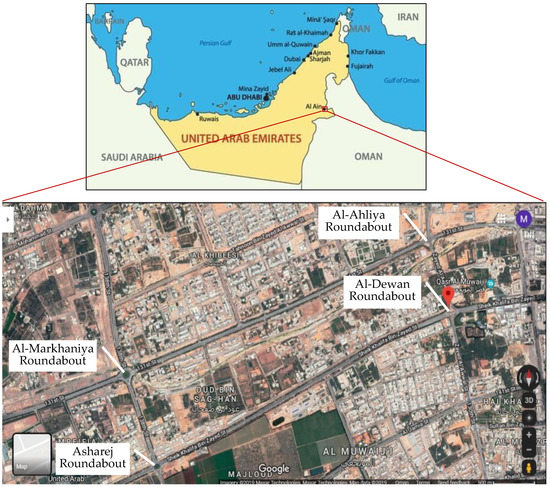
Figure 2.
Location of the roundabouts studied in Al-Ain City [24]. The top map is taken from [25].
For each roundabout, fifteen design alternatives were developed using the Signalised & unsignalised Intersection Design and Research Aid (SIDRA) V7.0 software [26]. The alternatives were grouped into three main categories: at-grade intersections, grade separated intersections with an underpass, and grade separated intersections with an overpass. The design alternatives within each group differ by the type of intersection control they have. The types of intersection control used include a traditional roundabout, a signalized roundabout and traffic signals. A difference in the signalized intersections was further added by introducing one-to-three exclusive turning lanes as three different design alternatives. A brief description of each alternative and its coding (ID) are shown in Table 2. The alternatives were evaluated by TOPSIS while introducing variations in the traffic volume and the operational speeds. The best design alternative with respect to sustainability was determined alongside any existing trade-offs within the individual sustainability dimension. A sensitivity analysis was conducted by varying the weights of the sustainability dimensions and observing the changes in the final ranking.

Table 2.
Description of the design alternatives with their corresponding coding.
The investigated four case studies have three traffic volume variations each. They cover the present (year 2018) traffic volume and two other volumes representing ten years back and ten years later (2008 and 2028). This ten-year period allows one to check whether the decision made based on a traffic volume in the past was justifiable and whether that design is still suitable for current and future traffic volumes or whether it might be changed to another design alternative. In addition, for Al-Ahliya and Al-Dewan roundabouts, two operational speeds were investigated. Hence, fourteen different scenarios were considered. Within each scenario, a set of fifteen different design alternatives were evaluated using the CSI tool that we had developed. Table 3 summarizes the scenarios considered for the four case studies along with the identification number of each case.

Table 3.
Summary of the scenarios under consideration.
3.2. Data Collection
Data collection methods varied from using simulation models (e.g., SIDRA software), to making qualitative assessment based on a literature review, to consulting contractors, and taking direct measurements. Traffic data for the four roundabouts was obtained from the Department of Transport—Abu Dhabi. The traffic volume was taken as the A.M. peak hour (7:15–8:15) volume count on 8 December 2015. This traffic volume was interpolated by using a growth factor of 3% (which was recommended by the North California Department of Transportation (NCDOT) to use for intersections [27]) in order to get the current year traffic volume for 2018, and further interpolated to get the volumes for the years 2008 and 2028.
The quantitative indicators, which are stated next, were measured directly. For instance, the area indicator was determined using the AutoCAD software. The operational cost, fuel consumption, rate of emissions of air pollutants (CO2, NOx, CO and hydrocarbons, which are expressed in kg/h/vehicle), average speed, total passenger miles travelled (person-km/h), total travel time, and the average delay per person were determined using SIDRA V7.0 software.
The monetary value of the total hourly travel time (per vehicle) was indirectly computed by multiplying the total hourly travel time from SIDRA by the average income of UAE citizens (US $14.037/h) and the time value factor (0.4) that was recommended by the American Association of State Highway and Transportation Officials [28]. The average income was computed by dividing the Gross National Income for the UAE (at the end of 2017 this was equal to US $40,988/capita/year [29]) by the working hours determined by article 65 of the UAE Labor Law to be 8 h/day [30].
Moving on to the qualitative indicators, a ranking procedure was applied for safety and initial cost. Several studies were conducted with the intention of comparing safety among different types of intersections. The findings of these studies are summarized in Table 4. Insufficient studies were found that compare the safety of underpasses versus overpasses; however, a reasonable factor that may be considered is the effect of possible flooding on underpass-paired intersections. As such, the overpass is considered safer than an underpass design alternative for the intersections. Table 5 lists the safety ranking based on the findings of the studies summarized in Table 4.

Table 4.
Safety assessment based on literature review.

Table 5.
Ranking of the intersection design alternatives with respect to safety and initial cost.
Determination of an exact cost in the early planning stages for the design alternatives is not possible. Hence, a ranking procedure based on the authors’ experience and best judgment was conducted, resulting in the ranks provided in Table 5. The cost ranking in Table 5 was based on the assumption that the at-grade intersection alternatives have the lowest cost, the intersection alternatives with an overpass have the second highest cost since they require the building of an elevated structure, and finally the intersection alternatives with an underpass have the highest cost since they require the building of a structure with additional earth work (e.g., excavation). The ranking of the type of intersection within the three main groups was arrived at by a process of logical reasoning. A roundabout usually costs more than a signalized intersection due to the earth work and large circulating lanes area. The signalized roundabout, when compared to a regular roundabout, involves some added technology expense for the signals, hence it has a higher cost. Finally, for ranking within the signalized intersections, added lanes mean added cost.
TOPSIS analysis uses an algorithm that eliminates the effect of the different criteria units and their varying range on the sustainability evaluation. Hence, a ranking from 1 to 15 does not differ in effect when using real values. This was checked through a test run of two trials for the same scenario; one trial used ranks and the other used some estimated values for the cost. The values for all of the other criteria were the same in both trials. The final ranking of the alternatives was the same for the first five best sustainable alternatives in both trials.
4. Results and Discussion
TOPSIS analysis was carried out using Equations (1)–(9). Sustainability assessment for the different scenarios within the case studies resulted in three indices in the three dimensions of sustainability and a fourth index of the overall CSI for each design alternative. The results are presented in the form of triangular and radar graphs. Triangular graphs show the explicit dimensional trade-offs for each alternative. Radar graphs show the impacts of the design alternative on the three dimensions of sustainability while comparing several alternatives, with the ideal (best) alternative being closer to the 100% mark.
4.1. Equal Criteria Weights Scheme
The first part of the results focused on the case where the weight was distributed equally among the three main dimensions (one third each) and furthermore equalized within the criteria of each dimension. The radar graph in Figure 3a shows the four indices for the fifteen design alternatives for the Case 2A (Asharej Roundabout—2008) scenario. Figure 3b shows the final ranking of each design alternative for this scenario in a line-graph, while Figure 3c shows the sustainability trade-offs for the most sustainable design alternative, which is O-RA. Figure 3b,c show that the best design alternative (O-RA) has a tendency towards the social dimension when compared to the other design alternatives. The previous analysis was repeated for the remaining spatial and temporal scenarios of the four roundabouts. Table 6 shows the results of the sustainability assessment with the corresponding CSI values and the dimensional tendency for equal weight scheme.
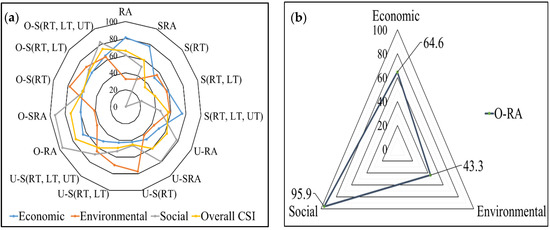
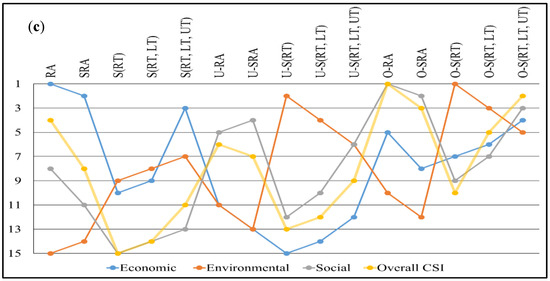
Figure 3.
Sustainability assessment of the Case 2A (Asharej Roundabout—2008) scenario, (a) radar graph of CSI values, (b) dimensional trade-offs of the most sustainable design alternative, and (c) line-graph of CSI ranks.

Table 6.
Sustainability assessment of the case studies’ scenarios with equal weight scheme.
As shown in Table 6, by equalizing the weights of the three aspects of sustainability and equalizing the weights within the criteria, all the scenarios have a tendency towards the social dimension. This implies that the impact on the overall CSI for the most sustainable design alternative comes from the social dimension. In other words, the most sustainable design alternative performs exceedingly well in the social dimension when compared to the other two dimensions of sustainability. This may be attributed to the fact that the design alternatives exhibit a large variation in performance with respect to the social dimension.
Moreover, the overall CSI values are relatively close to each other throughout the years and even when varying the operational speeds. However, a slight increase in the best CSI values can be noticed for the high traffic volume of 2028. Contrary to the idea that more vehicles could cause less sustainable impacts, a higher CSI value may be due to the enhanced utilization of the built facilities when higher volumes are present.
4.2. Effect of Traffic Volume and Operational Speed Variation
The effect of varying the assigned traffic volume on the different case studies has been studied while controlling the operational speed. Three different traffic volume scenarios (for years 2008, 2018 and 2028) have been generated for the four case studies of the four roundabouts. Al-Ahliya and Al-Dewan roundabouts have two extra scenarios where the operational speed was varied (80–100 km/h) while controlling for the traffic volume. The sustainability assessments for each scenario of the four case studies with traffic volume and operational speed variations are shown in Figure 4 and Figure 5, respectively.
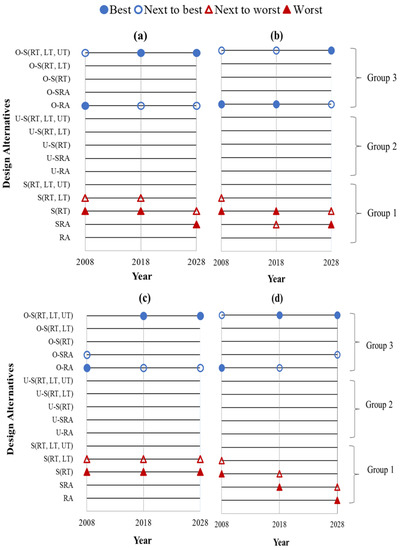
Figure 4.
Sustainability assessment of the four roundabouts with traffic volume variation: (a) Al-Ahliya (Case1), (b) Asharej (Case 2), (c) Al-Markhaniya (Case 3), and (d) Al-Dewan (Case 4); Group 1: at-grade intersections, Group 2: intersections with underpass, Group 3: intersections with overpass.
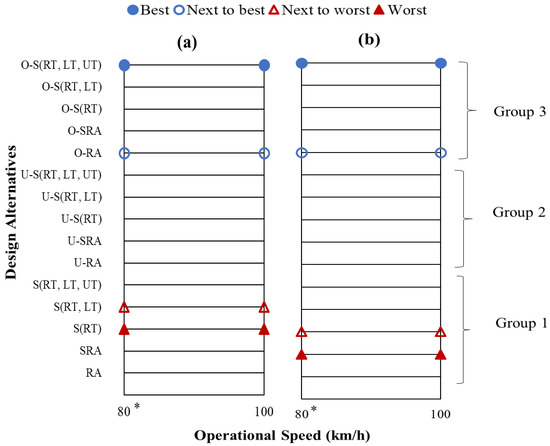
Figure 5.
Sustainability assessment with operational speed variation for (a) Al-Ahliya Roundabout (2018) (Case 1B) and (b) Al-Dewan Roundabout (2018) (Case 4B). (* the original operational speed). Group 1: at-grade intersections, Group 2: intersections with underpass, Group 3: intersections with overpass.
A trend that can be noticed from the traffic volume variation in Figure 4 is that the best alternatives for the lower volumes have a paired roundabout design, while for the higher volumes, the signal paired designs with added exclusive turning lanes are more likely to be more sustainable. Moreover, the most sustainable design for all the volumes has an overpass grade-separated design, while the least sustainable designs are at-grade intersections. This may be due to the fact that the traffic volume gets separated into two sections in the overpass-alternatives, providing smoother flow of traffic. The speed variation did not have a noticeable effect on the final sustainability ranking of the design alternatives, as shown in Figure 5.
4.3. Sensitivity Analysis
The effect of varying the weight of the sustainability dimension on the ranking of the alternatives was observed for some of the case studies’ scenarios. Table 7 shows the results of the sustainability assessment with the corresponding CSI values and the dimensional tendency for the sensitivity analysis where the major weight (80%) alternates between the three main dimensions while the weights of the criteria within each dimension remain equalized.

Table 7.
Sustainability assessment of the case studies’ scenarios with sensitivity analysis a.
The impact on the tendency dimension of the CSI value and rank when applying the sensitivity analysis can be clearly seen in the Al-Markhaniya Roundabout (2028) scenario. The best design alternative when equalizing the weights within the sustainability dimensions was the O-S (RT, LT, UT) alternative (Table 6). However, after assigning the majority of the weight (80%) to each sustainability dimension alternatively, the most sustainable design alternative changed correspondingly (Table 7).
When assigning the majority of the weight to the economic dimension, the best design alternative changed to the at-grade roundabout alternative. It can be seen from Figure 6a that the RA design alternative has the best performance in the economic dimension, hence it ranked as the most sustainable design when the majority of the weight was assigned to the economic dimension. The same reasoning applies when assigning 80% of the weight to the other two sustainability dimensions, as shown in Figure 6b,c. The best design alternative is the one with the best performance in the dimension with the major weight, and vice versa for the worst design alternative.
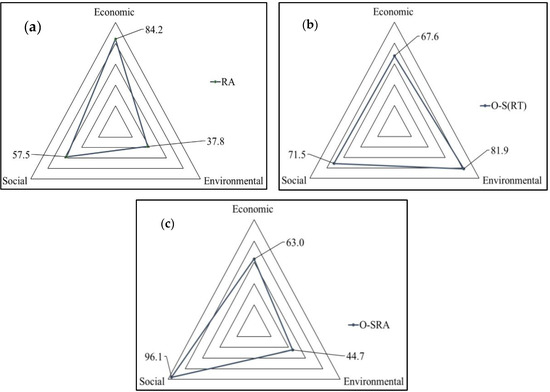
Figure 6.
Most sustainable design alternative for Case 3C (Al-Markhaniya Roundabout, 2028) with 80% weight variation assigned to the (a) economic, (b) environmental, and (c) social dimension.
However, a different observation can be made in other scenarios (e.g., Case 1C, 2A and 4A), where the major impact of a dimension on the overall CSI may not be from the dimension that has the major weight. For instance, when alternating 80% of the weight between the three sustainability dimensions of the Case 4A (Al-Dewan Roundabout 2008) scenario (Table 7), the dimension that contributes the most to the overall CSI is the social dimension regardless of the weight-dominating dimension. Thus, the best design alternative throughout the sensitivity analysis has a tendency towards the social dimension.
However, when examining the ranks of the most sustainable alternative within each dimension while alternating the major weight, it can be seen that the dimension with the major weight ranks the highest with respect to the other alternatives even though it does not have the highest index value. This is demonstrated in Figure 7 where 80% of the weight is assigned to the environmental dimension. This implies that when implementing a sensitivity analysis in the assessment of sustainability, considering the index value alone without including the rank of the alternative may give misleading interpretations of the results. Hence, sustainability assessment is highly affected by weight assignment. The higher the weight assigned to a specific dimension of sustainability, the higher the chance that a design alternative that performs well in that dimension would be considered as the most sustainable design in the overall sustainability assessment. This finding is consistent with the findings of others [43,44].
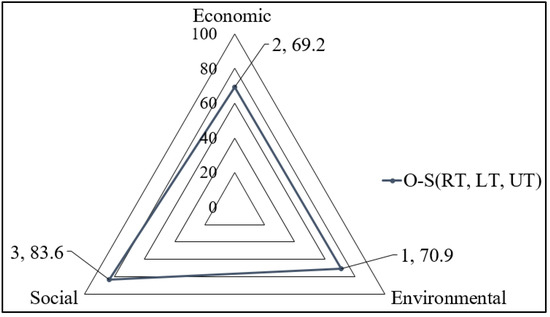
Figure 7.
Sustainability trade-offs for the most sustainable design alternative for the Case 4A (Al-Dewan Roundabout, 2008) scenario (rank, sub-index).
5. Conclusions and Recommendations
A framework of road intersections’ sustainability was built after a thorough literature review. Transportation sustainability was defined and a set of intersection sustainability indicators was extracted in the economic, environmental and social dimensions. The indicators were defined from a road-user perspective and supported a macroscopic point of view. A Composite Sustainability Index (CSI) tool was developed for evaluating the sustainability of intersection design alternatives using a multi-criteria decision making (MCDM) method.
Four case studies of roundabouts in Al-Ain city, UAE were used to demonstrate the applicability of the CSI tool and at the same time explore whether the existing intersections in the city are based on considerations of sustainability. Different design alternatives for different scenarios of traffic volume and operational speed variables were generated and evaluated with respect to sustainability using the CSI tool. It was found that traffic volume had a significant effect when determining the most sustainable design alternative for an intersection, while the operational speed variable had an insignificant impact on the final ranking. The results imply that the current designs of the four case studies are not the most sustainable option. The results from ten years back show that pairing the roundabouts with an overpass would give a more sustainable performance. As for the current and future traffic volumes, adding an overpass and a conversion to a signalized intersection with exclusive turning lanes would enhance the sustainability of the intersections.
Results of the sensitivity analysis show that assigning the majority of the weight to a specific dimension tends to rank the best alternatives towards that specific dimension. This means that, when stakeholders and decision makers want to achieve some specific objectives or have certain constraints that direct their project, they should reflect such requirements in the weights of the criteria. Hence, the CSI tool can be utilized to support and enhance future strategic planning and decision-making of stakeholders by adequately comparing between a set of different intersection design alternatives while balancing between the three dimensions of sustainability. Moreover, even though the CSI tool was applied on case studies in Al-Ain city, it is applicable to assess intersection sustainability in any other region.
For future work, research should focus on: incorporating the design of a whole network of intersections in the evaluation of the transport sustainability of the region; evaluating the sustainability of roadway intersections with the number of lanes as an explicit factor; and including sustainability impacts on other stakeholders and road neighbors in addition to road-users. It should be noted that some of the main limitations of this study include the lack of comprehensive initial cost and safety data and the lack of data from other aspects than the road-user perspective.
Author Contributions
The authors contributed to the work as follows: Conceptualization, M.J.A.-K., Y.S.H., and M.A.M.; methodology, M.J.A.-K., Y.S.H., and M.A.M.; formal analysis, M.J.A.-K.; investigation, M.J.A.-K.; resources, Y.S.H. and M.A.M.; data curation, M.J.A.-K.; writing—original draft preparation, M.J.A.-K.; writing—review and editing, Y.S.H. and M.A.M.; visualization, M.J.A.-K. and M.A.M.; supervision, Y.S.H. and M.A.M.; project administration, M.A.M.; funding acquisition, M.A.M. All authors have read and agreed to the published version of the manuscript.
Funding
This research was funded by the United Arab Emirates University, grant number 21R021.
Conflicts of Interest
The authors declare no conflict of interest.
References
- Brundtland, G.H. Report of the World Commission on Environment and Development: Our Common Future; United Nations: New York, NY, USA, 1987. [Google Scholar]
- International Energy Agency CO2 Emissions from Fuel Combustion 2017-Highlights. Int. Energy Agency 2017, 1, 1–162.
- Environment Agency-Abu Dhabi (EAD). Abu Dhabi State of the Environment Report. 2017. Available online: http://www.soe.ae/environmental-pressures/ (accessed on 28 May 2019).
- Gudmundsson, H. Indicators and Performance Measures for Transportation, Environment and Sustainability in North America; Report from a German Marshall Fund Fellowship 2000 Individual Study Tour October 2000. Research Notes No.148; Ministry of Environment and Energy, National Environmental Research Institute: Roskilde, Denmark, 2001.
- Geurs, K.T.; van Ritsema Eck, J. Accessibility Measures: Review and Applications. Evaluation of Accessibility Impacts of Land-Use Transportation Scenarios, and Related Social and Economic Impact; RIVM Rapport 408505006; Universiteit Utrecht-URU: Utrecht, The Netherlands, 2001. [Google Scholar]
- Zegras, C. Sustainable transport indicators and assessment methodologies. In Proceedings of the Biannual Conference and Exhibit of the Clean Air Initiative for Latin American Cities: Sustainable Transport: Linkages to Mitigate Climate Change and Improve Air Quality, Sao Paulo, Brazil, 25–27 July 2006; Volume 1. [Google Scholar]
- Jeon, C. Incorporating uncertainty into transportation decision making: Sustainability-oriented approach. Transp. Res. Rec. 2010, 2174, 58–67. [Google Scholar] [CrossRef]
- Litman, T. Well Measured: Developing Indicators for Sustainable and Livable Transport Planning; Victoria Transport Policy Institute: Victoria, BC, Canada, 2012. [Google Scholar]
- Zheng, J.; Garrick, N.W.; Atkinson-Palombo, C.; McCahill, C.; Marshall, W. Guidelines on developing performance metrics for evaluating transportation sustainability. Res. Transp. Bus. Manag. 2013, 7, 4–13. [Google Scholar] [CrossRef]
- Reisi, M.; Aye, L.; Rajabifard, A.; Ngo, T. Transport sustainability index: Melbourne case study. Ecol. Indic. 2014, 43, 288–296. [Google Scholar] [CrossRef]
- Puodziukas, V.; Svarpliene, A.; Braga, A. Measures for Sustainable Development of Road Network. Transp. Res. Procedia 2016, 14, 965–972. [Google Scholar] [CrossRef]
- Mansourianfar, M.H.; Haghshenas, H. Micro-scale sustainability assessment of infrastructure projects on urban transportation systems: Case study of Azadi district, Isfahan, Iran. Cities 2018, 72, 149–159. [Google Scholar] [CrossRef]
- Abu Dhabi Urban Planning Council Abu Dhabi Economic Vision 2030—The Official Portal of the UAE Government. Available online: https://government.ae/en/about-the-uae/strategies-initiatives-and-awards/local-governments-strategies-and-plans/abu-dhabi-economic-vision-2030 (accessed on 26 July 2019).
- Dabbour, E.; Al Awadhi, M.; Aljarah, M.; Mansoura, M.; Haider, M. Evaluating safety effectiveness of roundabouts in Abu Dhabi. IATSS Res. 2018, 42, 274–283. [Google Scholar] [CrossRef]
- Castillo, H.; Pitfield, D.E. ELASTIC–A methodological framework for identifying and selecting sustainable transport indicators. Transp. Res. Part D Transp. Environ. 2010, 15, 179–188. [Google Scholar] [CrossRef]
- Lautso, K.; Spiekermann, K.; Wegener, M. Modelling policies for urban sustainability. In Proceedings of the 42nd Congress of the European Regional Science Association: “From Industry to Advanced Services—Perspectives of European Metropolitan Regions”, Dortmund, Germany, 27–31 August 2002; European Regional Science Association (ERSA): Louvain-la-Neuve, Belgium, 2002. [Google Scholar]
- Litman, T. Sustainable transportation indicators: A recommended research program for developing sustainable transportation indicators and data. In Proceedings of the 88th Transportation Research Board Annual Meeting, Washington, DC, USA, 11–15 January 2009; Paper 09-3404. pp. 1–3. [Google Scholar]
- Jeon, C.M.; Amekudzi, A.A.; Guensler, R.L. Sustainability assessment at the transportation planning level: Performance measures and indexes. Transp. Policy 2013, 25, 10–21. [Google Scholar] [CrossRef]
- Tafidis, P.; Sdoukopoulos, A.; Pitsiava-Latinopoulou, M. Sustainable urban mobility indicators: Policy versus practice in the case of Greek cities. Transp. Res. Procedia 2017, 24, 304–312. [Google Scholar] [CrossRef]
- Sakamoto, K. Toward a sustainability appraisal framework for transport. In ADB Sustainable Development Working Paper Series; Asian Development Bank: Mandaluyong, Philippines, 2014. [Google Scholar]
- Haghshenas, H.; Vaziri, M. Urban sustainable transportation indicators for global comparison. Ecol. Indic. 2012, 15, 115–121. [Google Scholar] [CrossRef]
- Winata, D.T.; Rarasati, A.D. Sustainable infrastructure transportation to improve society wellbeing in Karawang. In Proceedings of the 2nd international Tropical Renewable Energy Conference (i-TREC), Bali, Indonesia, 3–4 October 2017. IOP Conf. Ser. Earth Environ. Sci. 2018, 105, 1–8. [Google Scholar] [CrossRef]
- Roszkowska, E. Multi-criteria decision making models by applying the TOPSIS method to crisp and interval data. Mult. Criteria Decis. Mak./Univ. Econ. Katow. 2011, 6, 200–230. [Google Scholar]
- Google Maps Dewan Round About. Available online: https://www.google.com/maps/place/Dewan+Round+About+-+Abu+Dhabi+-+United+Arab+Emirates/@24.2199948,55.7010273,3182m/data=!3m1!1e3!4m5!3m4!1s0x3e8ab17066018f7f:0x861c007bada33162!8m2!3d24.2234801!4d55.7218906 (accessed on 20 August 2019).
- Goway United Arab Emirates, Geography and Maps, Goway Airlines. Available online: https://www.goway.com/travel-information/africa-middle-east/united-arab-emirates/geography-and-maps/ (accessed on 29 August 2020).
- SIDRA Intersection Traffic Engineering|Network Analysis Software|INTERSECTION 8. Available online: http://www.sidrasolutions.com/ (accessed on 21 August 2019).
- Cunningham, C.M.; Findley, D.J.; Davis, J.; Aghdashi, B.; Kim, S. Intersection Life Cycle Cost Comparison Tool User Guide Version 1.0; Institute for Transportation Research and Education: Raleigh, NC, USA, 2016. [Google Scholar]
- AASHTO (American Association of State Highway and Transportation Officials). Highway Safety Manual, 1st ed.; 444 North Capital St., NW, Suite 249: Washington, DC, USA, 2010; Volume 19192. [Google Scholar]
- The World Bank GNI per capita (current LCU)—United Arab Emirates. Available online: https://data.worldbank.org/indicator/NY.GNP.PCAP.CN?locations=AE (accessed on 31 January 2019).
- The Official Portal of the UAE Government 15. Life on land—The Official Portal of the UAE Government. Available online: https://government.ae/en/about-the-uae/leaving-no-one-behind/15lifeonland#keyachievementstowardslifeonland (accessed on 29 January 2019).
- Retting, R.A.; Persaud, B.N.; Garder, P.E.; Lord, D. Crash and injury reduction following installation of roundabouts in the United States. Am. J. Public Health 2001, 91, 628–631. [Google Scholar] [PubMed]
- Wadhwa, L.; Thomson, M. Relative safety of alternative intersection designs. WIT Trans. Built Environ. 2006, 89, 10. [Google Scholar]
- Eshragh, S. Modern Roundabouts and Sustainable Intersection Design. In Proceedings of the International Roundabout Conference, Carmel, Indiana, 18–20 May 2011. [Google Scholar]
- Robinson, B.W.; Rodegerdts, L.; Scarborough, W.; Kittelson, W.; Troutbeck, R.; Brilon, W.; Bondizio, L.; Courage, K.; Kyte, M.; Mason, J. Roundabouts: An Informational Guide; Federal Highway Administration: Washington, DC, USA, 2000. [Google Scholar]
- Natalizio, E.M. Roundabouts with metering signals. In Proceedings of the Institute of Transportation Engineers 2005, Melborne, Australia, 7–10 August 2005; Monash University: Melborne, Australia, 2005. [Google Scholar]
- Robinson, B.W.; Rodegerdts, L.A. Capacity and Performance of Roundabouts: A Summary of Recommendations in the FHWA Roundabout Guide. In Proceedings of the Fourth International Symposium on Highway Capacity, Maui, Hawaii, 27 June–1 July 2000; Transportation Research Board, National Research Council: Washington, DC, USA, 2000; pp. 422–433. [Google Scholar]
- Harwood, D.W.; Bauer, K.M.; Potts, I.B.; Torbic, D.J.; Richard, K.R.; Rabbani, E.R.; Hauer, E.; Elefteriadou, L.; Griffith, M.S. Safety effectiveness of intersection left-and right-turn lanes. Transp. Res. Rec. 2003, 1840, 131–139. [Google Scholar] [CrossRef]
- Federal Highway Administration Intersection Safety—Safety|Federal Highway Administration. Available online: https://safety.fhwa.dot.gov/intersection/other_topics/corridor/cam_tech/index.cfm (accessed on 22 February 2019).
- Maze, T.; Hawkins, N.R.; Burchett, G. Rural Expressway Intersection Synthesis of Practice and Crash Analysis; Center for Transportation Research and Education, Iowa State University: Ames, IA, USA, 2004. [Google Scholar]
- He, Q.; Kamineni, R.; Zhang, Z. Traffic signal control with partial grade separation for oversaturated conditions. Transp. Res. Part C Emerg. Technol. 2016, 71, 267–283. [Google Scholar] [CrossRef]
- Mathew, T. Lecture Notes in Transportation Systems Engineering II. Indian Institute of Technology (Bombay). Available online: http://www.civil.iitb.ac.in/tvm/1100_LnTse/124_lntse/plain/plain.html (accessed on 24 September 2019).
- Shokry, S.; Tanaka, S.; Nakamura, F.; Ariyoshi, R.; Miura, S. A Comparative Study on At-grade Intersections and Grade Separated Intersections in Terms of Land Use Interaction. In Proceedings of the 2017 International Conference of Asian-Pacific Planning Societies, Nagoya, Japan, 24–26 August 2017; Graduate School of Urban Innovation, Yokohama National University: Yokohama, Japan, 2017. [Google Scholar]
- Jeon, C.M. Incorporating Sustainability into Transportation Planning and Decision Making: Definitions, Performance Measures, and Evaluation. Ph.D. Thesis, Georgia Institute of Technology, Atlanta, GA, USA, 2007. [Google Scholar]
- Umer, A.; Hewage, K.; Haider, H.; Sadiq, R. Sustainability assessment of roadway projects under uncertainty using Green Proforma: An index-based approach. Int. J. Sustain. Built Environ. 2016, 5, 604–619. [Google Scholar] [CrossRef]
Publisher’s Note: MDPI stays neutral with regard to jurisdictional claims in published maps and institutional affiliations. |
© 2020 by the authors. Licensee MDPI, Basel, Switzerland. This article is an open access article distributed under the terms and conditions of the Creative Commons Attribution (CC BY) license (http://creativecommons.org/licenses/by/4.0/).