Article

Effects of Land Use Change from Natural Forest to Livestock on Soil C, N and P Dynamics along a Rainfall Gradient in Mexico

1
Instituto de Ecología, Universidad Nacional Autónoma de México, Mexico City 04510, Mexico
2
Instituto de Geografía, Universidad Nacional Autónoma de México, Mexico City 04510, Mexico
3
Centro de Investigación en Ciencias de Información Geoespacial, Consejo Nacional de Ciencia y Tecnología, Mexico City 14240, Mexico
4
Instituto de Geología, Universidad Nacional Autónoma de México, Mexico City 04510, Mexico
5
Facultad de Medicina Veterinaria y Zootecnia, Universidad Nacional Autónoma de México, Mexico City 04510, Mexico
6
Colegio de Posgraduados, Campus Montecillos, Mexico State 56230, Mexico
*
Author to whom correspondence should be addressed.
Sustainability 2020, 12(20), 8656; https://doi.org/10.3390/su12208656
Submission received: 9 September 2020 / Revised: 6 October 2020 / Accepted: 9 October 2020 / Published: 19 October 2020
(This article belongs to the Special Issue Risk-Informed Sustainable Development in the Rural Tropics)

Abstract

:
The effects of converting native forests to livestock systems on soil C, N and P contents across various climatic zones are not well understood for the tropical region. The goal of this study was to test how soil C, N and P dynamics are affected by the land-use change from natural forests to livestock production systems (extensive pasture and intensive silvopastoral systems) across a rainfall gradient of 1611–711 mm per year in the Mexican tropics. A total of 15 soil-based biogeochemical metrics were measured in samples collected during the dry and rainy seasons in livestock systems and mature forests for land-use and intersite comparisons of the nutrient status. Our results show that land-use change from natural forests to livestock production systems had a negative effect on soil C, N and P contents. In general, soil basal respiration and C-acquiring enzyme activities increased under livestock production systems. Additionally, reduction in mean annual rainfall affected moisture-sensitive biogeochemical processes affecting the C, N and P dynamics. Our findings imply that land-use changes alter soil C, N and P dynamics and contents, with potential negative consequences for the sustainability of livestock production systems in the tropical regions of Mexico investigated.

Graphical Abstract

1. Introduction

Globally, soils store at least three times as much carbon (C) as is found in either the atmosphere or living plants [1,2,3], with the largest portion of it found in tropical forests [4,5]. A global examination of the terrestrial C stocks highlighted that the largest soil organic C stocks in tropical lands are subject to the greatest risks [2], and land-use change continues to pose a threat to tropical forests [6,7,8]. Moreover, earth-system models have shown that these C stocks in soils will become increasingly vulnerable during the twenty-first century, since reduced rainfall and large-scale agricultural transformation of forests, primarily to pastureland [9,10], are predicted for large areas of the tropics [11]. Tropical ecosystems dominate the exchange of CO2 between the atmosphere and terrestrial biosphere, yet our understanding of how nutrients control the tropical C dynamics remains far from complete. A better understanding of nitrogen (N) and phosphorus (P) balances in soils can help guide the implementation of mitigation policies and land-use management, since the supplies of one or both nutrients constrain C uptake in the tropics [12]. In contrast to the clear inventory-based assessments of aboveground C on global scales [4], C cycling in soils remains less well understood, due to high biogeochemical variation in the tropics [13].
Environmental factors such as rainfall decline, together with agricultural expansion, generate abrupt, large-scale changes in forestlands and alter soil C, N and P dynamics [14,15,16]. The impacts of converting natural forests to systems for livestock production on soil C, N and P dynamics have been well examined at the stand scales, with studies relating variations in above- and below-ground C input through litterfall and root exudation to these inherently different management practices [17]. However, the influence of wider regional or global-scale conversion of natural forests to livestock on soil C, N and P dynamics is not yet well understood. This is perceived as a key bottleneck in improving the prediction and evaluation of the results of soil C mitigation efforts related to land-use change; it is also an impediment to better understanding the degradation of soil quality. Previous studies have suggested that converting native forests to livestock systems significantly impacts the quantity and quality of C and nutrient inputs [18,19], and that these changes could be sensitive to rainfall regime. Converting annual cropland to perennial pastureland enhanced microbial biomass and enzyme activities involved in C, N and P cycling due to lower fluctuations in soil water content in pastureland [20]. Campo et al. [21] reported that changes in the land cover can increase surface soil C pools in the dry tropics, while converting native forests to pasturelands in the humid tropics significantly decreases C contents in soils. The changes in land use and management may decrease soil organic matter content and significantly alter soil water dynamics, which would have effects on soil organic carbon [22].
Mexico, with a land area of 1.96 million km2, covers climatic gradients, from humid to dry climate zones, and has experienced diverse and intensive land-use change for animal production, mainly in the tropical regions of the country [23], which are responsible for 50% of national livestock production [24]. Today, beef production in the tropics of Mexico is undergoing major changes with the introduction of management practices for long-term sustainable intensification (intensive silvopastoral systems) through more efficient use of water, materials, and energy [25,26]. Intensive silvopastoral systems are an emerging response to the increasing consumption of animal protein in the country [27] and an alternative to extensive pasture systems, which clear the natural cover to open space for cattle grazing [28,29], reducing the biodiversity and ecological services [30,31,32,33,34], and this intensification of livestock production systems could become a key climate change mitigation technology [35]. For example, intensive silvopastoral systems can produce 12 times more meat than extensive pasture systems [36], and their annual methane emissions per tonne of meat produced are 1.8 times lower than those of extensive pastures systems [37]. With its variety of tropical climates and livestock production systems, Mexico can be viewed as a unique laboratory containing complex interactions between climatic zones and human activities, and thus providing an excellent opportunity to examine simultaneous climate and livestock production impacts on soil fertility, particularly on soil C sequestration and background nutrient status.
To better understand the complex interactions among rainfall, livestock strategies, soil, and C, N and P dynamics, we analyzed C and nutrient dynamics across a gradient of sites varying in rainfall amount (from 1661 to 711 mm year−1), using a robust experimental design. The gradient contains 12 sites, including mature tropical forests (as natural forests), extensive pasture and intensive silvopastoral systems located in humid, subhumid and semiarid climates in the southeast of Mexico. In particular, we studied how C, N and P dynamics in the topsoil layer (upper 10 cm of soil) differed between adjacent native forests and livestock systems, and if those differences were related to rainfall amount or livestock production system (i.e., pastures and silvopastoral). We examined soil bulk organic C, and total N and P concentrations. We also measured labile concentrations of soil organic C, total N and total P, since their contents cycle more rapidly and should show a greater proportional response to changes in chemistry due to land use, compared to the response of bulk content. For the study, we also include measures of soil basal respiration, net N transformations, and C, N and P enzyme activity, as indicators of soil C and nutrient biogeochemistry.

2. Material and Methods

2.1. Study Areas

The study was carried out at four sites with different mean annual rainfall (MAR) in Mexico; two located in a dry tropical region, where MAR decreases from 917 to 711 mm, and two in a humid tropical region, where MAR decreases from 1661 to 1232 mm (Table 1). At each location, we evaluated two types of livestock system: extensive pastures systems and intensive silvopastoral systems. In addition, at each location, a natural forest site (tropical forest in all cases) was used as a reference for original soil fertility conditions. The criteria used for the selection of sites were: (i) sites that shared the same mean annual temperature, but located across a gradient of MAR; (ii) the presence of natural forests, pastures and silvopastures within the same edaphic conditions within each site; (iii) extensive pastures with around 25 years of land use; (iv) silvopastures with around 5 years of land use after around 20 years of extensive pasture systems; (v) both livestock production systems located at a distance of no more than 5 km from the reference (i.e., natural forests). To ensure that none of the sites had been subjected to other human activity, sites were selected following consultations with local owners and a review of the regional government’s land-use database.
Long-term climate data from weather stations show that all sites are characterized by a distinct period of low precipitation (four to seven months with rainfall below 100 mm; Table 1). The four sites differ strongly in aridity index (i.e., mean annual rainfall divided by mean annual evapotranspiration). Across the sites, variation in mean annual temperature is less than 1.5 °C, and the climate, semiarid to subhumid, would support from tropical dry to humid forests in the Holdridge Life Zone System [38]. Soils (Inceptisols at the wettest end of the rainfall gradient, and Entisols at all three drier sites) have bulk density and clay content that decrease across sites with decreased rainfall amount, and pH that increases from the wettest site to the driest site of the gradient.
Three mature forest stands at each site were selected. The predominant vegetation at the three drier sites is the seasonally dry tropical forest (i.e., forests subjected to prolonged dry season; [41]), while humid tropical forests dominate at the wettest end of the rainfall gradient. Floristically, Leguminosae is the most important family across studied sites [42,43,44], and the abundance of Leguminosae trees increases with the decrease in MAR.
The average size of extensive pasture system generally increases with the rainfall amount (87.3 ha in the 1232 mm site, 100 ha in the 711 mm site, 123 ha in the 917 mm and 170 ha in the 1661 mm of MAR site). The extensive pasture system at all sites is dual-purpose, for dairy and meat productions. The average age of pastures of this type was 25 years at the four study sites. At the drier sites (711 and 917 mm of MAR), in pasture systems, one head of cattle per hectare graze for ~2 days and rotate every ~35 days, while an average of 1.3 animals per hectare graze for ~7 days and rotate every ~45 days at the wetter locations (1232 and 1661 mm of MAR). Livestock are usually supplemented with poultry litter and mineral salts at both drier sites, and the pastures do not receive applications of inorganic fertilizers. The most common species used as forage are Penniseptum purpureum—Heinrich C.F. Schumacher, Pannicum maximum—Jacq., Cynodon nlemfuensis—McVaugh, and Brachiaria brizantha—Hochst. ex A. Rich. Stapf [45]. Pastures do not receive fertilization at the wetter sites of the rainfall gradient, and the species used as forage are Brachiaria brizantha—Hochst. ex A. Rich. Stapf, Paspalum vaginatum Swartz, Cynodon plectostachyus (K. Schum.) Pilg., Digitaria decumbens Stent., Pennisetum clandestinum Hochst. ex Chiov, and Panicum maximum Jacq. [45]. The establishment of pastures at all study sites was carried out via traditional slash-and-burning of natural forests, followed by ploughing.
The implementation of silvopastoral systems along the rainfall gradient is relatively recent, since the age of the plots range from 4 to 6 years. The establishment of the silvopastoral systems was carried out at sites previously dedicated to extensive pastures for around 20 years, followed by ploughing and the planting of a monoculture of native trees (Leucaena leucocephala (Lam.) de Wit.) in high density (~10,000 per hectare). The average animal load in silvopastoral systems is 3 animals per hectare at both drier sites, which graze for ~1 day, while a larger number of livestock (4 to 6 animals per hectare) graze for ~4 days in the wetter sites; cattle are rotated every ~30 days at all four study sites.

2.2. Soil Sampling and Analysis

Sampling of soils was carried out in the dry (April) and rainy (October) seasons of 2017. One plot (10 × 50 m) was established at each forest stand, pasture and silvopastoral system, and five equidistant (10 m) samples were taken for each type of land use. The topography of all selected plots was even to minimize the effects of local terrain on soil fertility [46]. Samples were taken from the topsoil (0–10 cm in depth), combined into one composite sample per plot and stored at 4 °C prior to analysis. A total of three composite samples (from three independent landowners) per site for each type of land use were taken. The upper 10 cm of the soil profile concentrates organic C in tropical dry and tropical humid forests of Mexico [21]. Soil samples were air-dried and sieved (2 mm mesh), and gravimetric water content in fresh soil samples was determined prior to analysis to correct the soil weight used in each determination. Although water content in fresh soils did not vary among land uses or across sites, samples taken in the dry season had less moisture than those taken in the rainy season (23.7 ± 2.1 and 43.9 ± 4.1%, respectively; mean ± 1 standard error).
Soil texture [47] and pH (in water) were determined prior to C, N and P analyses. Total and inorganic C (carbonates) concentrations were analyzed in an automated C analyzer (SCHIMADZU 5005A), by grinding a 5-g air-dried subsample (100-mesh screen). Organic C was estimated from the difference between total and inorganic C concentrations. The concentration of total N and total P was determined by acid digestion [48] using an NP analyzer (Technicon Autoanalyzer III). Soil available P was extracted using the Bray and Kurtz [49] method for acidic soil (pH ≤ 7), and the Olsen method was used for alkaline soils (pH > 7). After extraction, available soil P concentrations were determined with the colorimetrical method [48].
Carbon and N concentrations in soil microbial biomass were determined by chloroform fumigation–extraction methods [50] using replicated samples of fresh soil. Fumigated and non-fumigated samples were incubated at 24 °C for 24 h. Microbial biomass C was extracted with 0.5 MK2SO4, filtered (Wathman No. 42 paper), and the concentration of C was measured using an automated C analyzer. Microbial C was estimated from the difference between C concentrations in the fumigated and the non-fumigated extracts, and a conversion factor kC equal to 0.45 [50] was used. Microbial biomass N was extracted in a similar way, after filtering through Wathman No. 1 paper, the filtrate was digested in acid and the total concentration of N was determined using an automated NP analyzer. Microbial N concentration was calculated in a similar way to microbial C, using a conversion factor kN of 0.57 [51].
Soil basal respiration was determined from duplicated fresh subsamples (20 g) incubated at 25 °C. Soil subsamples were moistened to 50% water-filled pore space following light tamping in a jar (700 mL) containing vials of water to maintain humidity and 10 mL of 1.0 M NaOH to absorb CO2. Alkali traps were replaced at 1, 2, 3, 5, 7, 14, 21 and 28 days and were removed at 35 days. Evolved CO2 was determined by titration of alkali with 0.5 M HCl [52]. Soil basal respiration was calculated using measurements from days 3 to 35 to avoid the majority of flush due to drying and rewetting. The CO2 flux produced was standardized per gram of soil organic C.
We measured mineral N concentrations (NO3 plus NH4) and net N mineralization and nitrification rates using 2 M KCl extraction and aerobic incubation methods. Mineral N concentrations were measured by extracting a 15-g sub-sample in 100 mL 2 M KCl [53]. The soil KCl solution was shaken for 1 h and allowed to settle overnight. A 20 mL aliquot supernatant was transferred to vials and frozen for analysis (initial mineral N concentration). Nitrogen mineralization and nitrification rates were measured during 15-day aerobic incubations [53]. A second sub-sample was wetted to field water holding capacity with distilled water, maintained at field capacity moisture and incubated at 25 °C for 15 days before extraction, using KCl (final mineral N concentration). Analysis of both initial and final mineral N concentrations was done on an Autoanalyzer system using procedures to determine NO3–N plus NO2–N, which were reported as NO3–N, and using the salycilate–hypochlorite procedure for NH4–N. Nitrogen mineralization rate was determined from the difference between mineral N concentrations at the start and end of the incubation, and results were expressed on a basis of mean daily mineral N production. Likewise, nitrification rate was determined from the difference in NO3–N concentration at the beginning and end of the incubation, and results were expressed in similar units.
We measured the indicator enzymes most commonly used to infer growth-limiting C sources and nutrients: ß-1, 4-glucosidase (BG; enzyme commission number: EC 3.2.1.21) and polyphenol oxidase (POX; EC 1.10.3.1) to infer C-acquiring enzymes, ß-1, 4-N-acetylglucosaminidase (NAG; EC 3.2.1.14) to infer N acquiring enzymes, and acid phosphatase (AP; EC 3.1.3.1) to infer P acquiring enzymes [54], following the method proposed by Jackson et al. [55]. The enzyme assays were incubated at 25 °C for 2 h and their absorbance was recorded using a microplate reader at 410 nm for ß-1, 4-glucosidase, ß-1, 4-N-acetylglucosaminidase and acid phosphatase activities, and at 460 nm for polyphenol oxidase activity. The concentration of pNP (or tyrosine, for polyphenol oxidase) detected in the soil sample was corrected by subtracting the sum of absorption from the sample and substrate control wells, and enzyme activities were calculated as follows:
EA = (final absorbance)/(C × incubation time × soil dry mass)
where EA is the enzyme activity expressed in µmol of pNP (or tyrosine, for polyphenol oxidase) released per gram of soil per hour (µmol g−1 h−1), and C is the conversion factor that relates absorbance to µmol of pNP (or tyrosine, for polyphenol oxidase) for each enzyme activity.

2.3. Statistical Analyses

For each metric, a one-way ANOVA was performed, testing the effects of the rainfall regimen and the effect of the land-use change. The ANOVA residuals were explored for normality using the Shapiro–Wilk’s test. Data were transformed logarithmically when the assumptions of normality did not occur; the following soil metrics violated the normality assumptions: microbial biomass C and N concentrations, net N transformation rates and the activity of the ß-1, 4-glucosidase. The honest significant difference (HSD) test was used when statistical differences (p < 0.05) were observed across sites, or among land uses in each site. The interactions between soil metrics, land uses (natural forests, pastures and silvopastoral systems) and rainfall regime (MAR) were explored using a principal component analysis (PCA). In addition, correlation matrices were used as a way to depict the relationships between soil metrics within each site in both sampling seasons (i.e., dry and rainy seasons). All statistical analyses were performed using R statistical software [56].

3. Results

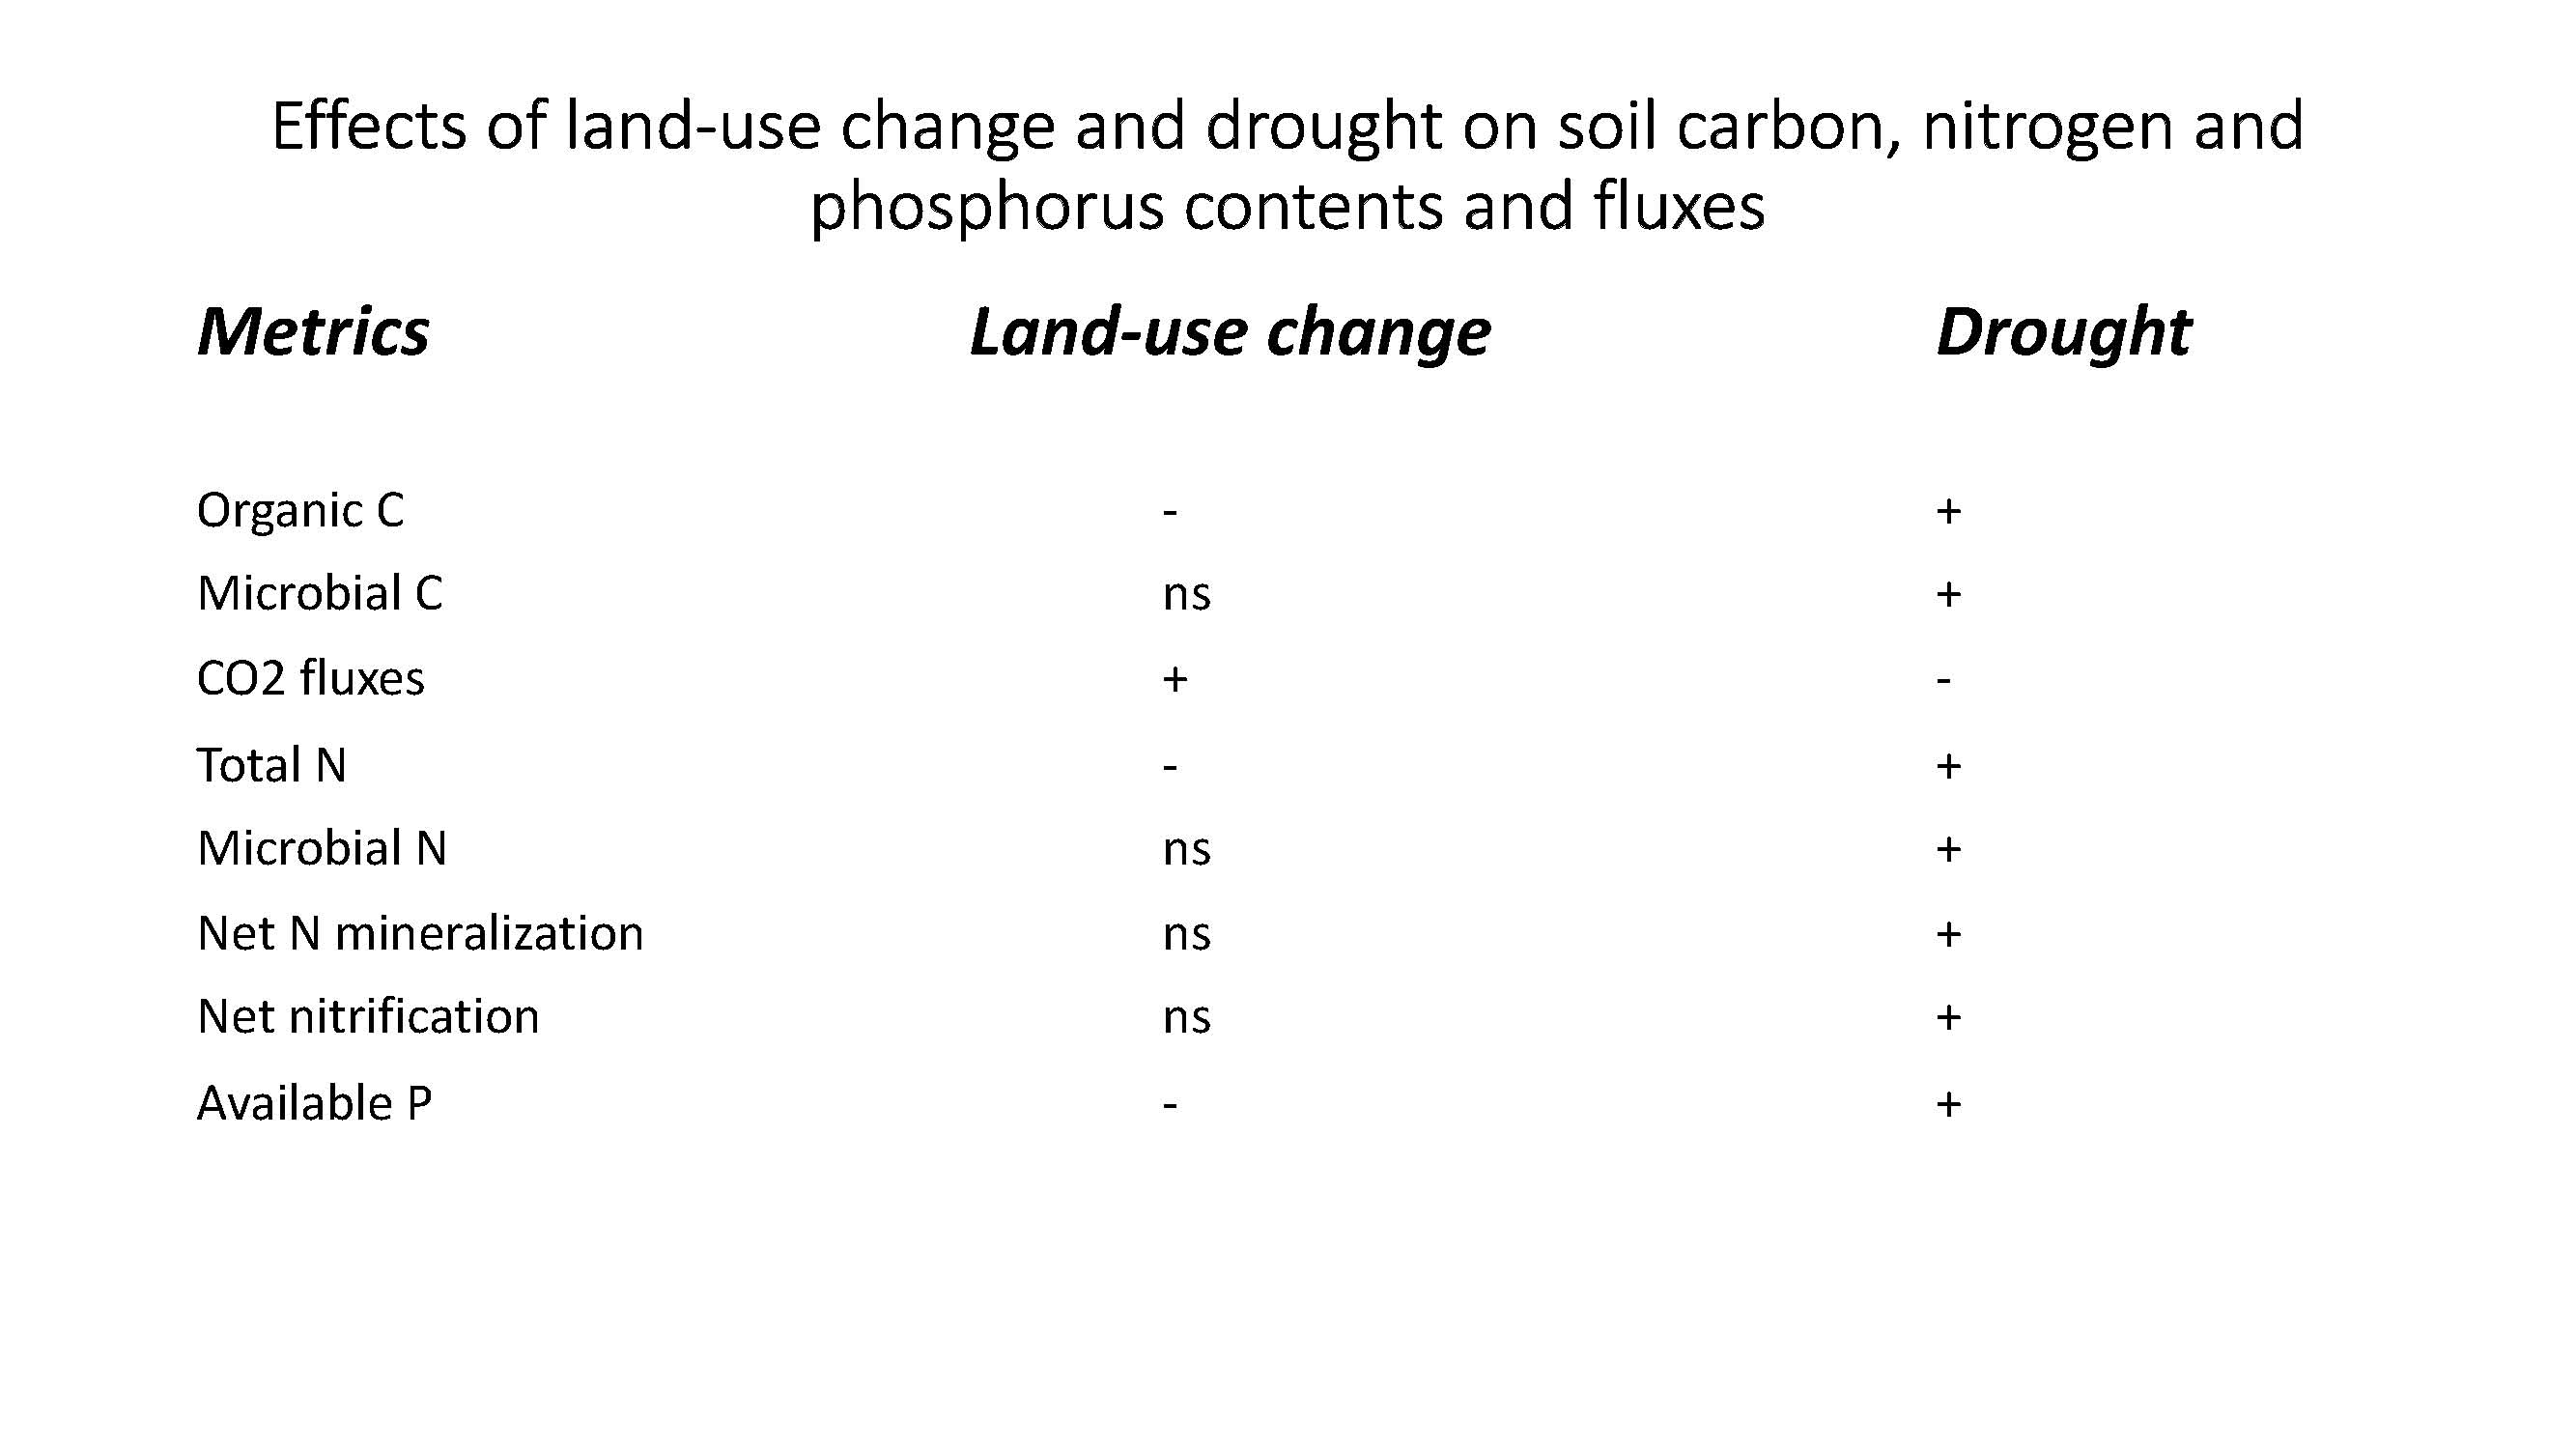
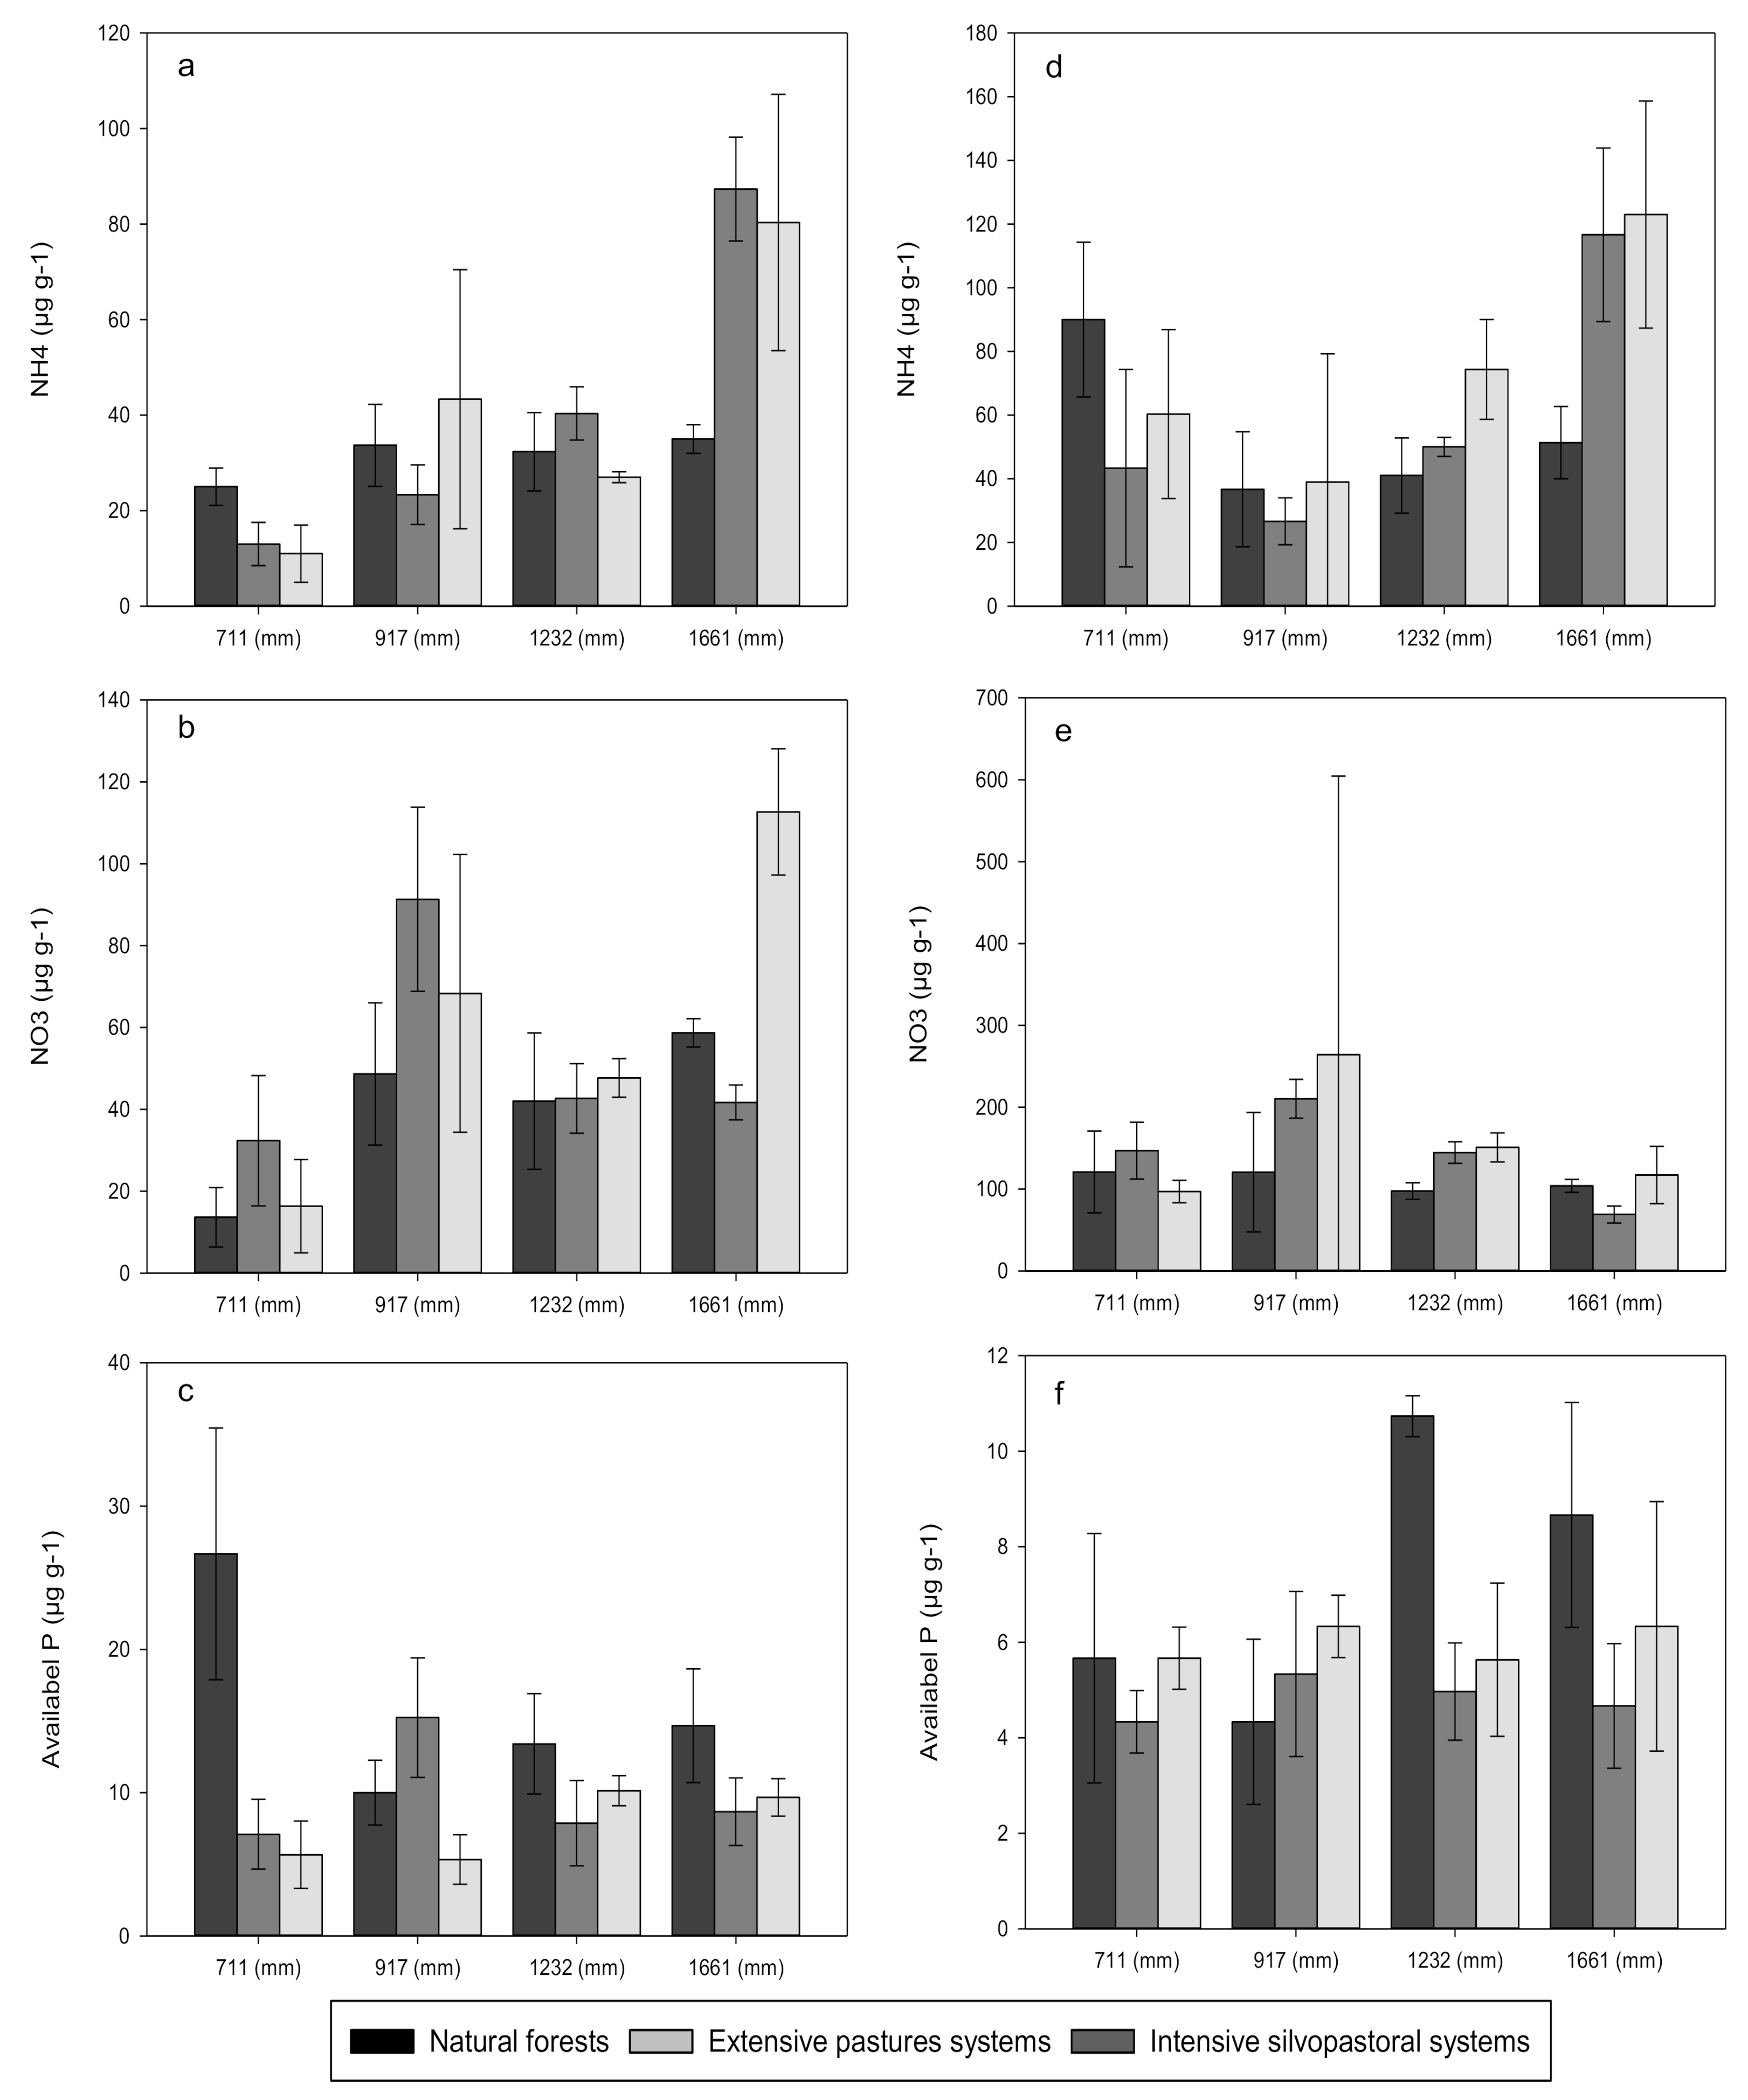
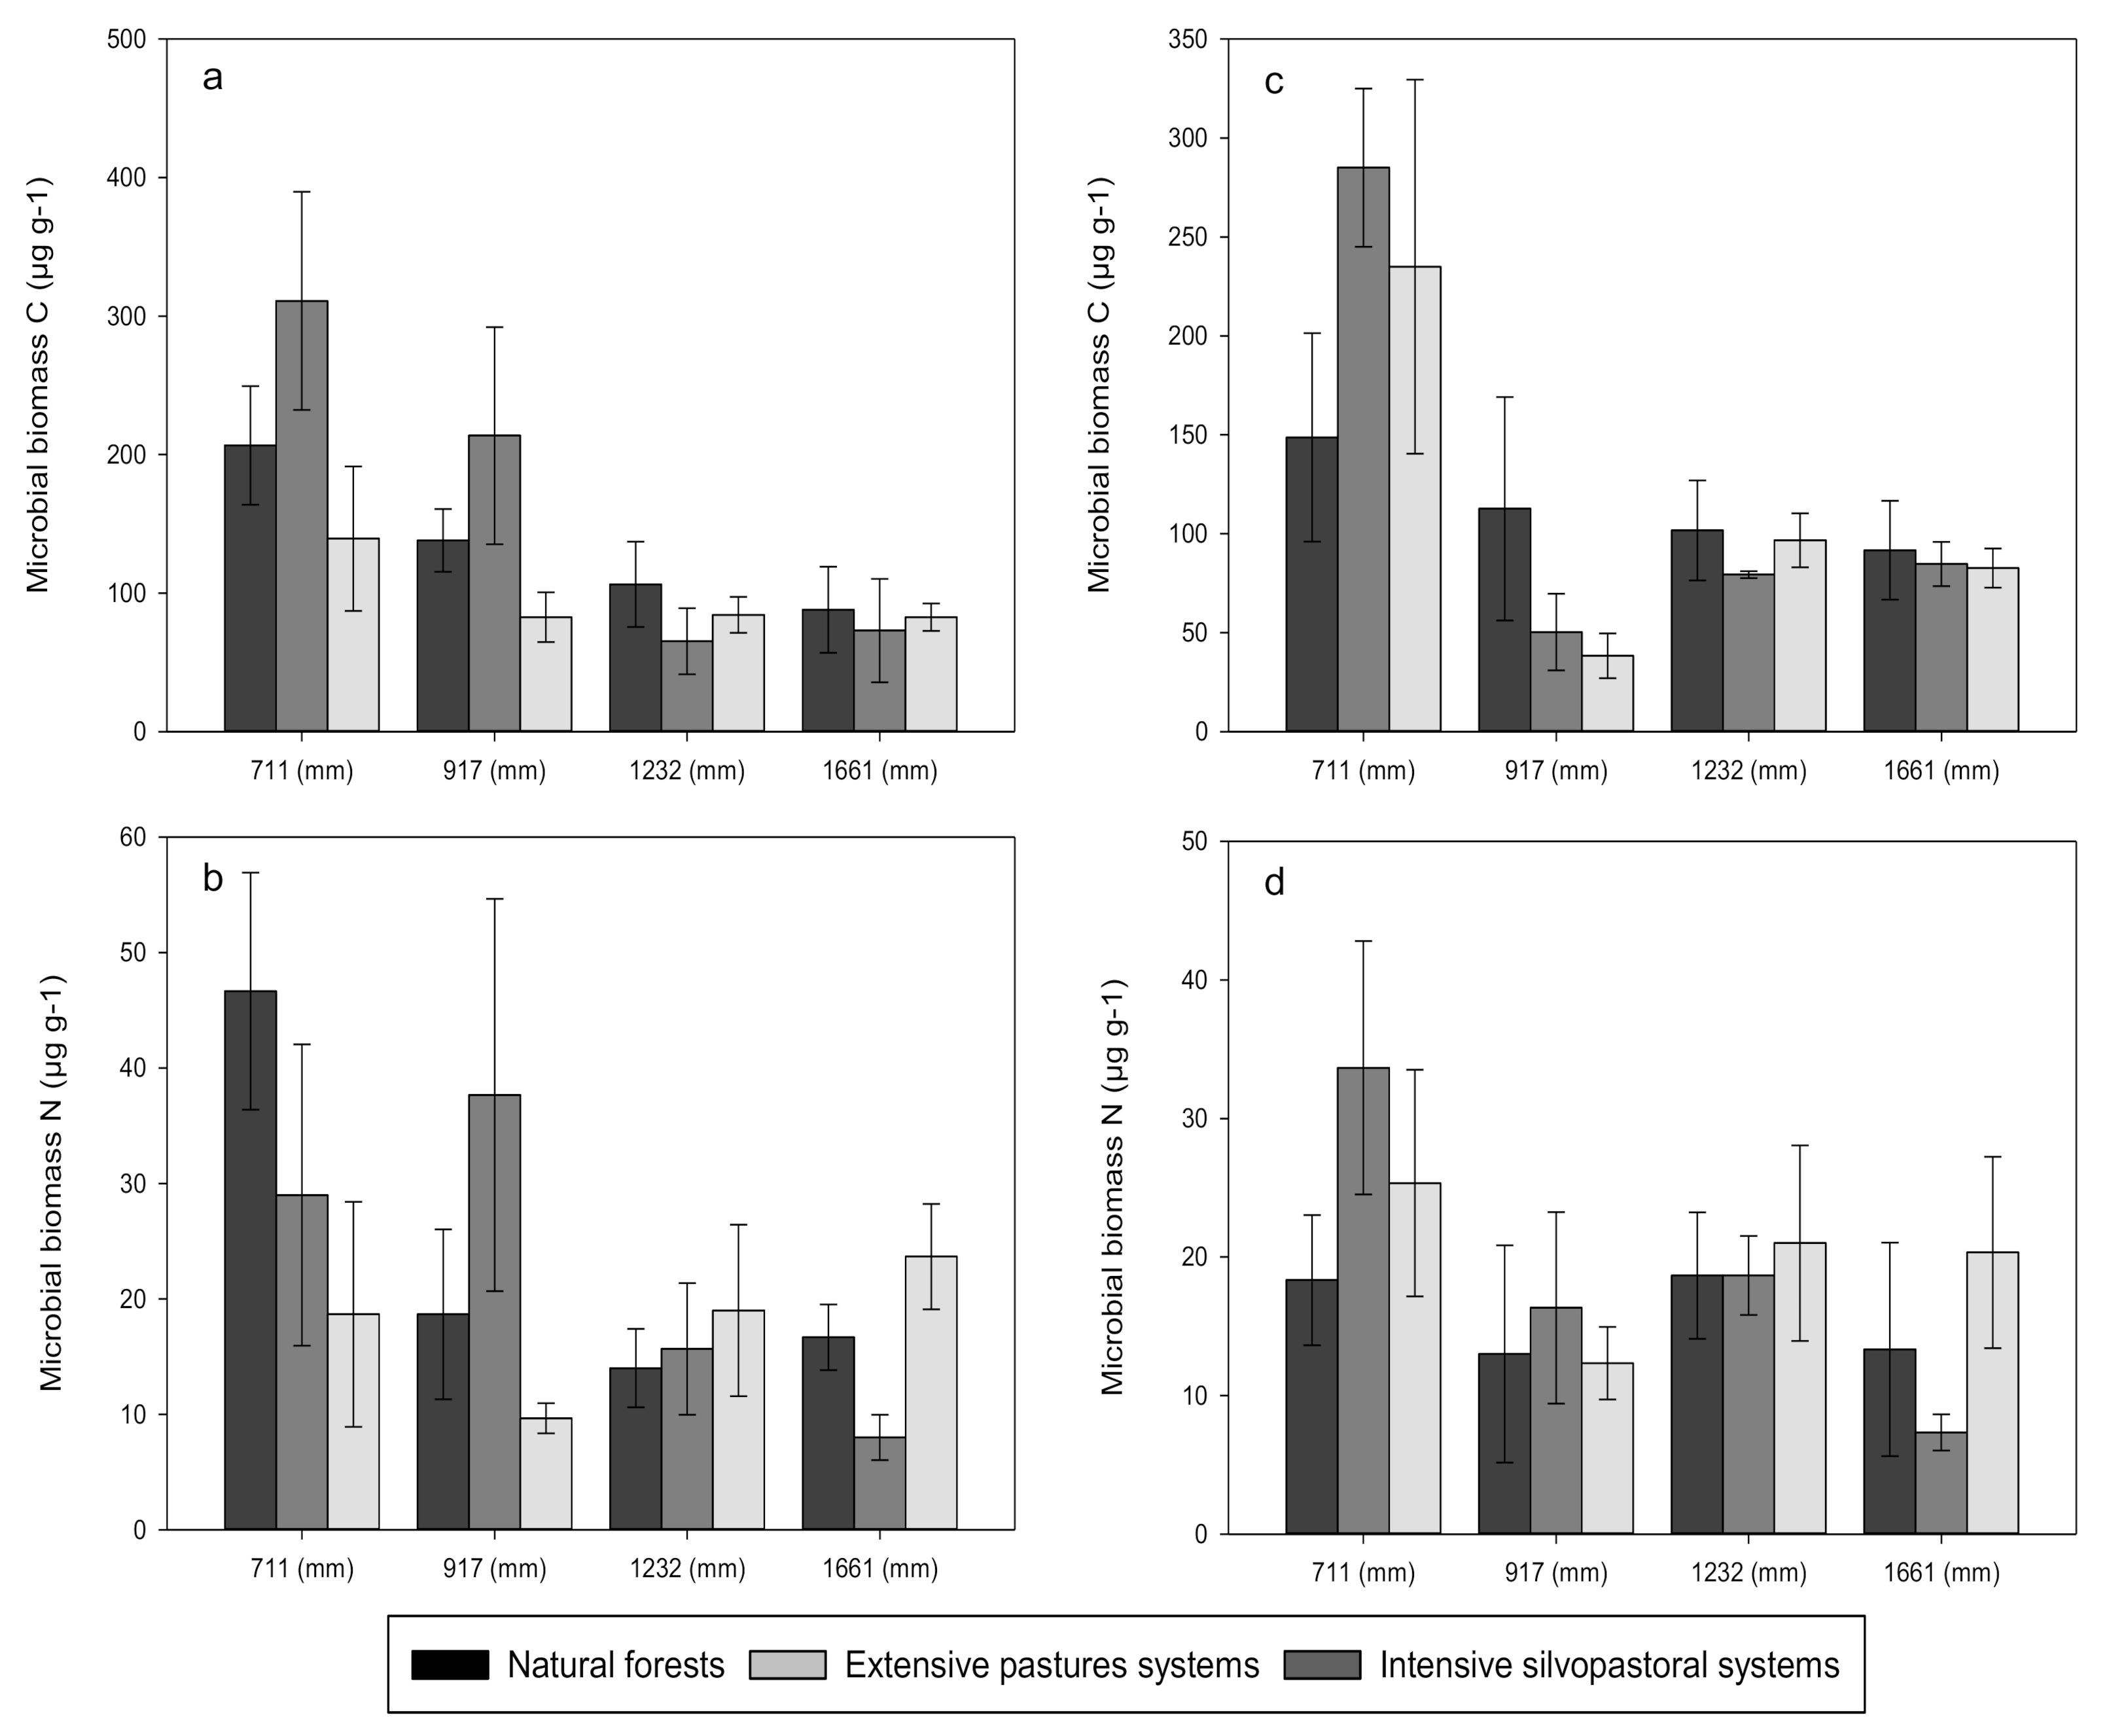
3.1. Carbon, Nitrogen and Phosphorus Concentrations

Soil organic C, total N, total P and, microbial biomass C and N concentrations were the highest at the driest end of the rainfall gradient and decrease with rainfall increase, meanwhile NH4 concentration was higher in the wettest end of the rainfall gradient (Figure 1, Figure 2 and Figure 3, Table 2). Rainfall regime did not have a significant effect on soil NO3 and available P concentrations (Figure 2). Rainfall seasonality did not affect the organic C, total N, total P, and microbial biomass C and N concentrations in soils. However, NH4 and NO3 concentrations were higher in the rainy season than in the dry season. In contrast to the seasonal variation in soil inorganic N concentrations, available P concentration was consistently higher in soils taken in the dry season than those taken in the rainy season.
Land-use change from natural forests to both livestock production systems (i.e., extensive pasture and intensive silvopastoral systems) decreased soil organic C, total N and P available concentrations (Figure 1 and Figure 2, Table 2). In contrast, no significant changes in NO3, NH4, total P and microbial biomass C and N concentrations were detected with land-use change (Figure 1, Figure 2 and Figure 3). Finally, no significant changes in soil C, N and P concentrations were detected between livestock production systems.

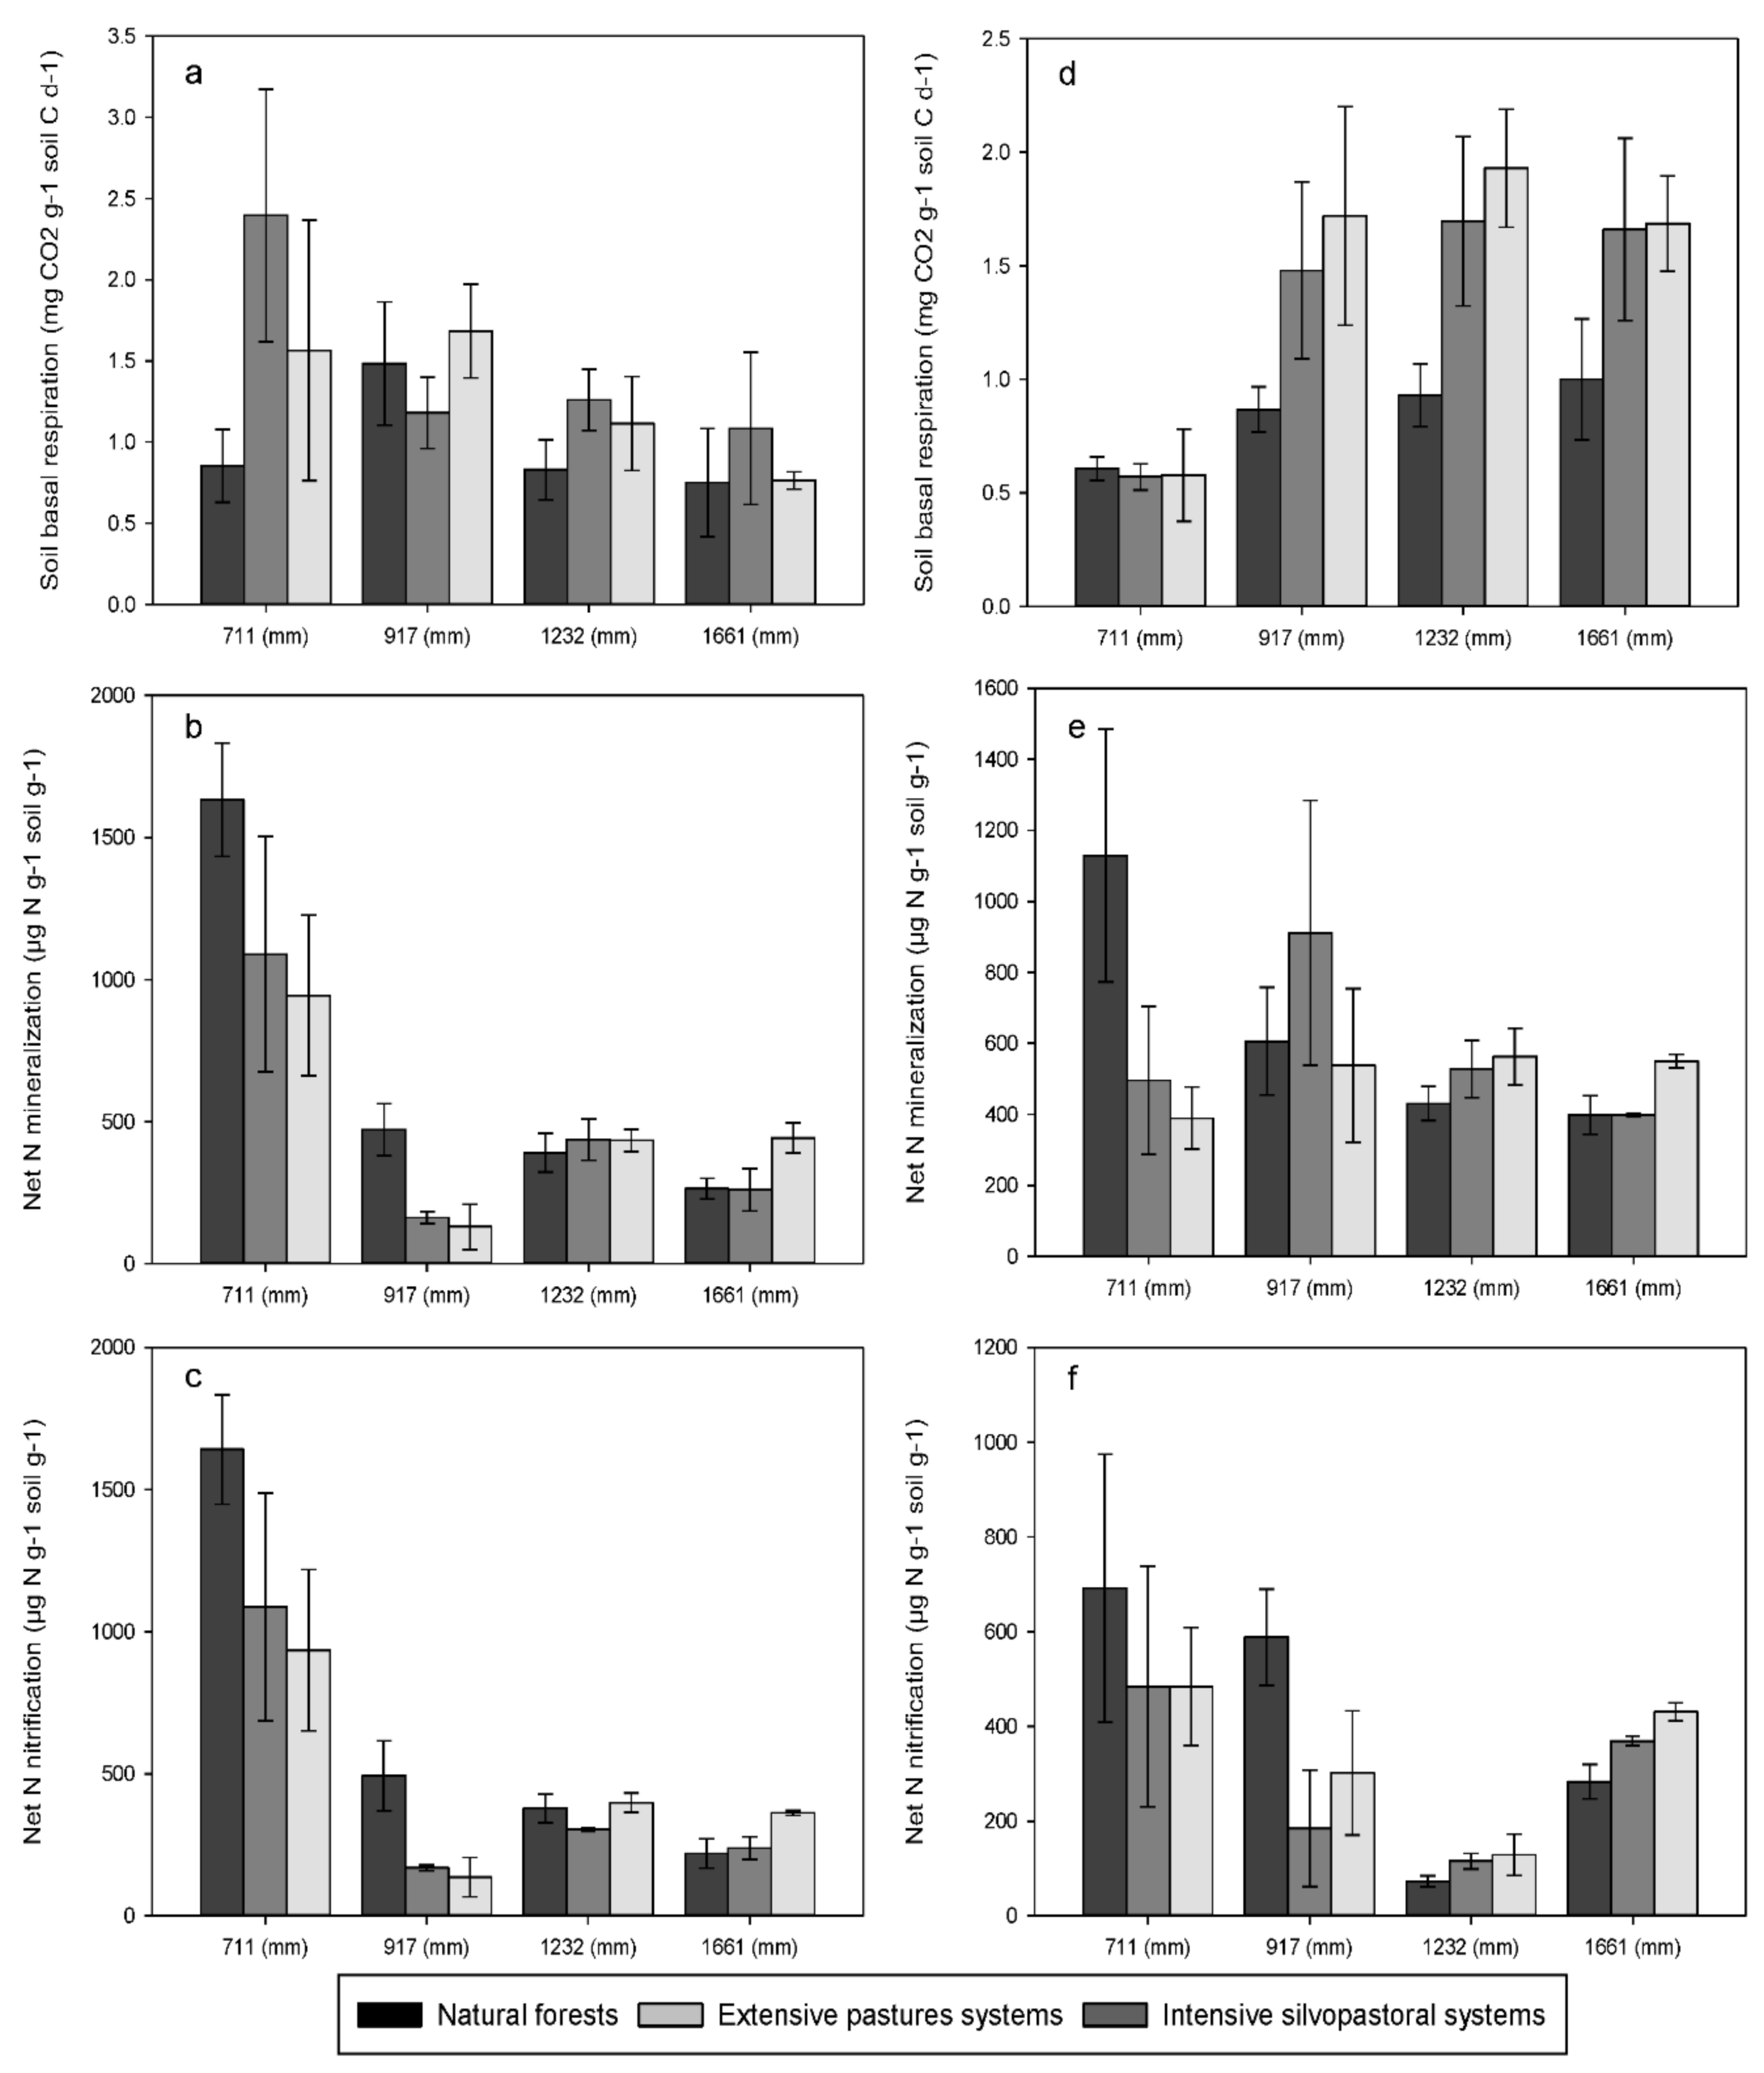
3.2. Soil Basal Respiration and Net Nitrogen Transformations

The soil basal respiration was greater in wetter sites (i.e., sites with 1232 and 1661 mm of MAR) than in the drier counterparts (i.e., sites that receive 711 and 917 mm of MAR) (Figure 4, Table 2). In addition, net N transformations differed considerably among sites reflecting changes in rainfall amount. However, the paired comparisons using the Tukey–Kramer HSD test show that soils from the driest end of the rainfall gradient had the highest N transformations, and net N mineralization and net nitrification rates decreased with increase in rainfall amount. The season did not have a significant effect on soil basal respiration. However, large variation in net N transformations between seasons were observed, with higher net N mineralization and net nitrification rates in the rainy season than in the dry season.
Land-use change from natural forests to extensive pasture and intensive silvopastoral systems increased soil basal respiration (Figure 4, Table 2). However, net N transformations did not change with land-use change irrespective of the livestock production system. No significant changes in these soil C and N fluxes were observed between pasture and silvopastoral systems.

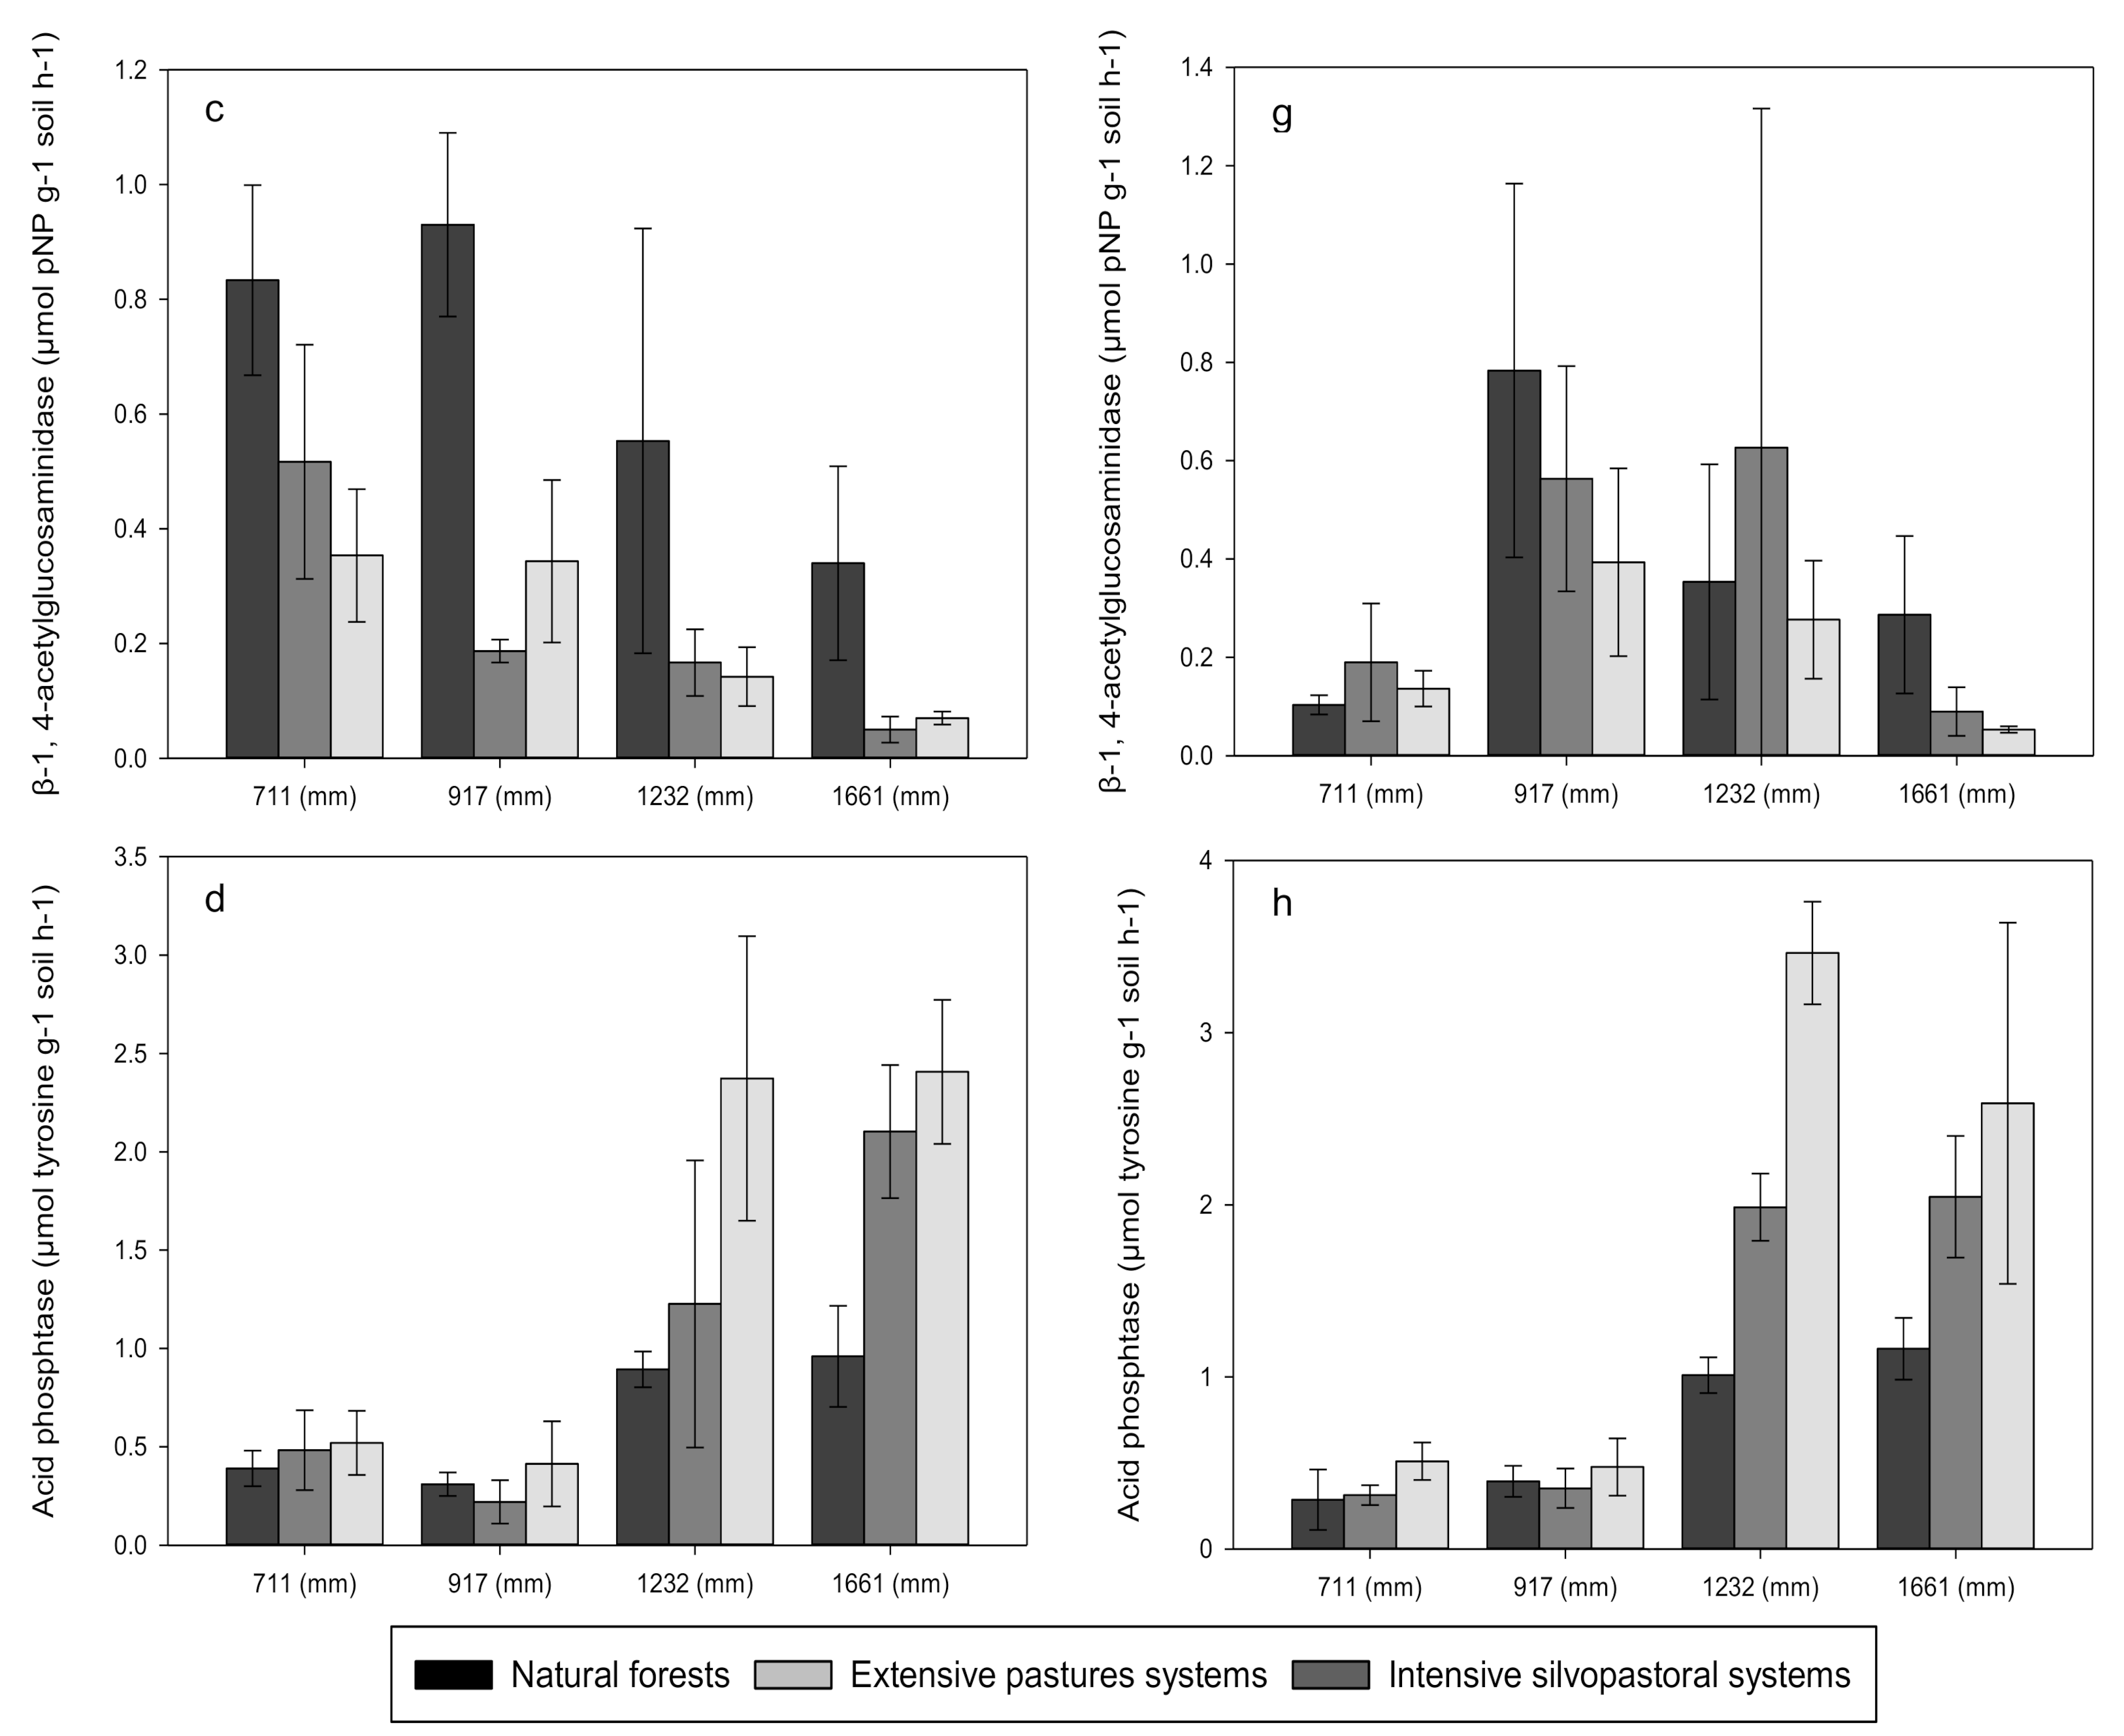
3.3. Enzyme Activities

The activity of C- and N-acquiring enzymes varied significantly among sites; but changes were not consistently related to rainfall regime (Figure 5, Table 2). Intermediate sites across the gradient (i.e., sites that receive 911 and 1232 mm of MAR) had higher polyphenol oxidase and 4-N-acetylglucosaminidase, or ß-1, 4-glucosidase activities, respectively, whereas the wettest site showed the lowest activity for the three enzymes. In contrast, soils from the wettest end of rainfall gradient had the highest acid phosphatase activity, reflecting the low concentration of available P. Rainfall seasonality did not have consistent effect on the activity of C-, N- and P-acquiring enzymes (e.g., on polyphenol oxidase, ß-1, 4-N-acetylglucosaminidase, and acid phosphatase) across sites. However, generally the activity of ß-1, 4-glucosidase was greater in soils collected in the dry season than in soils collected in the rainy season.
The land use did not affect the activity of C-acquiring enzymes in soils (Figure 5, Table 2). However, there were significant differences in the activity of N- and P-acquiring enzymes between natural forests and intensive silvopastoral systems across sites, with an increase in the ß-1, 4-N-acetylglucosaminidase and acid phosphatase activities under the legume-silvopastoral system. No significant changes in N- and P-acquiring enzyme activities were detected in between extensive pastures and natural forests, or with intensive silvopastoral systems.

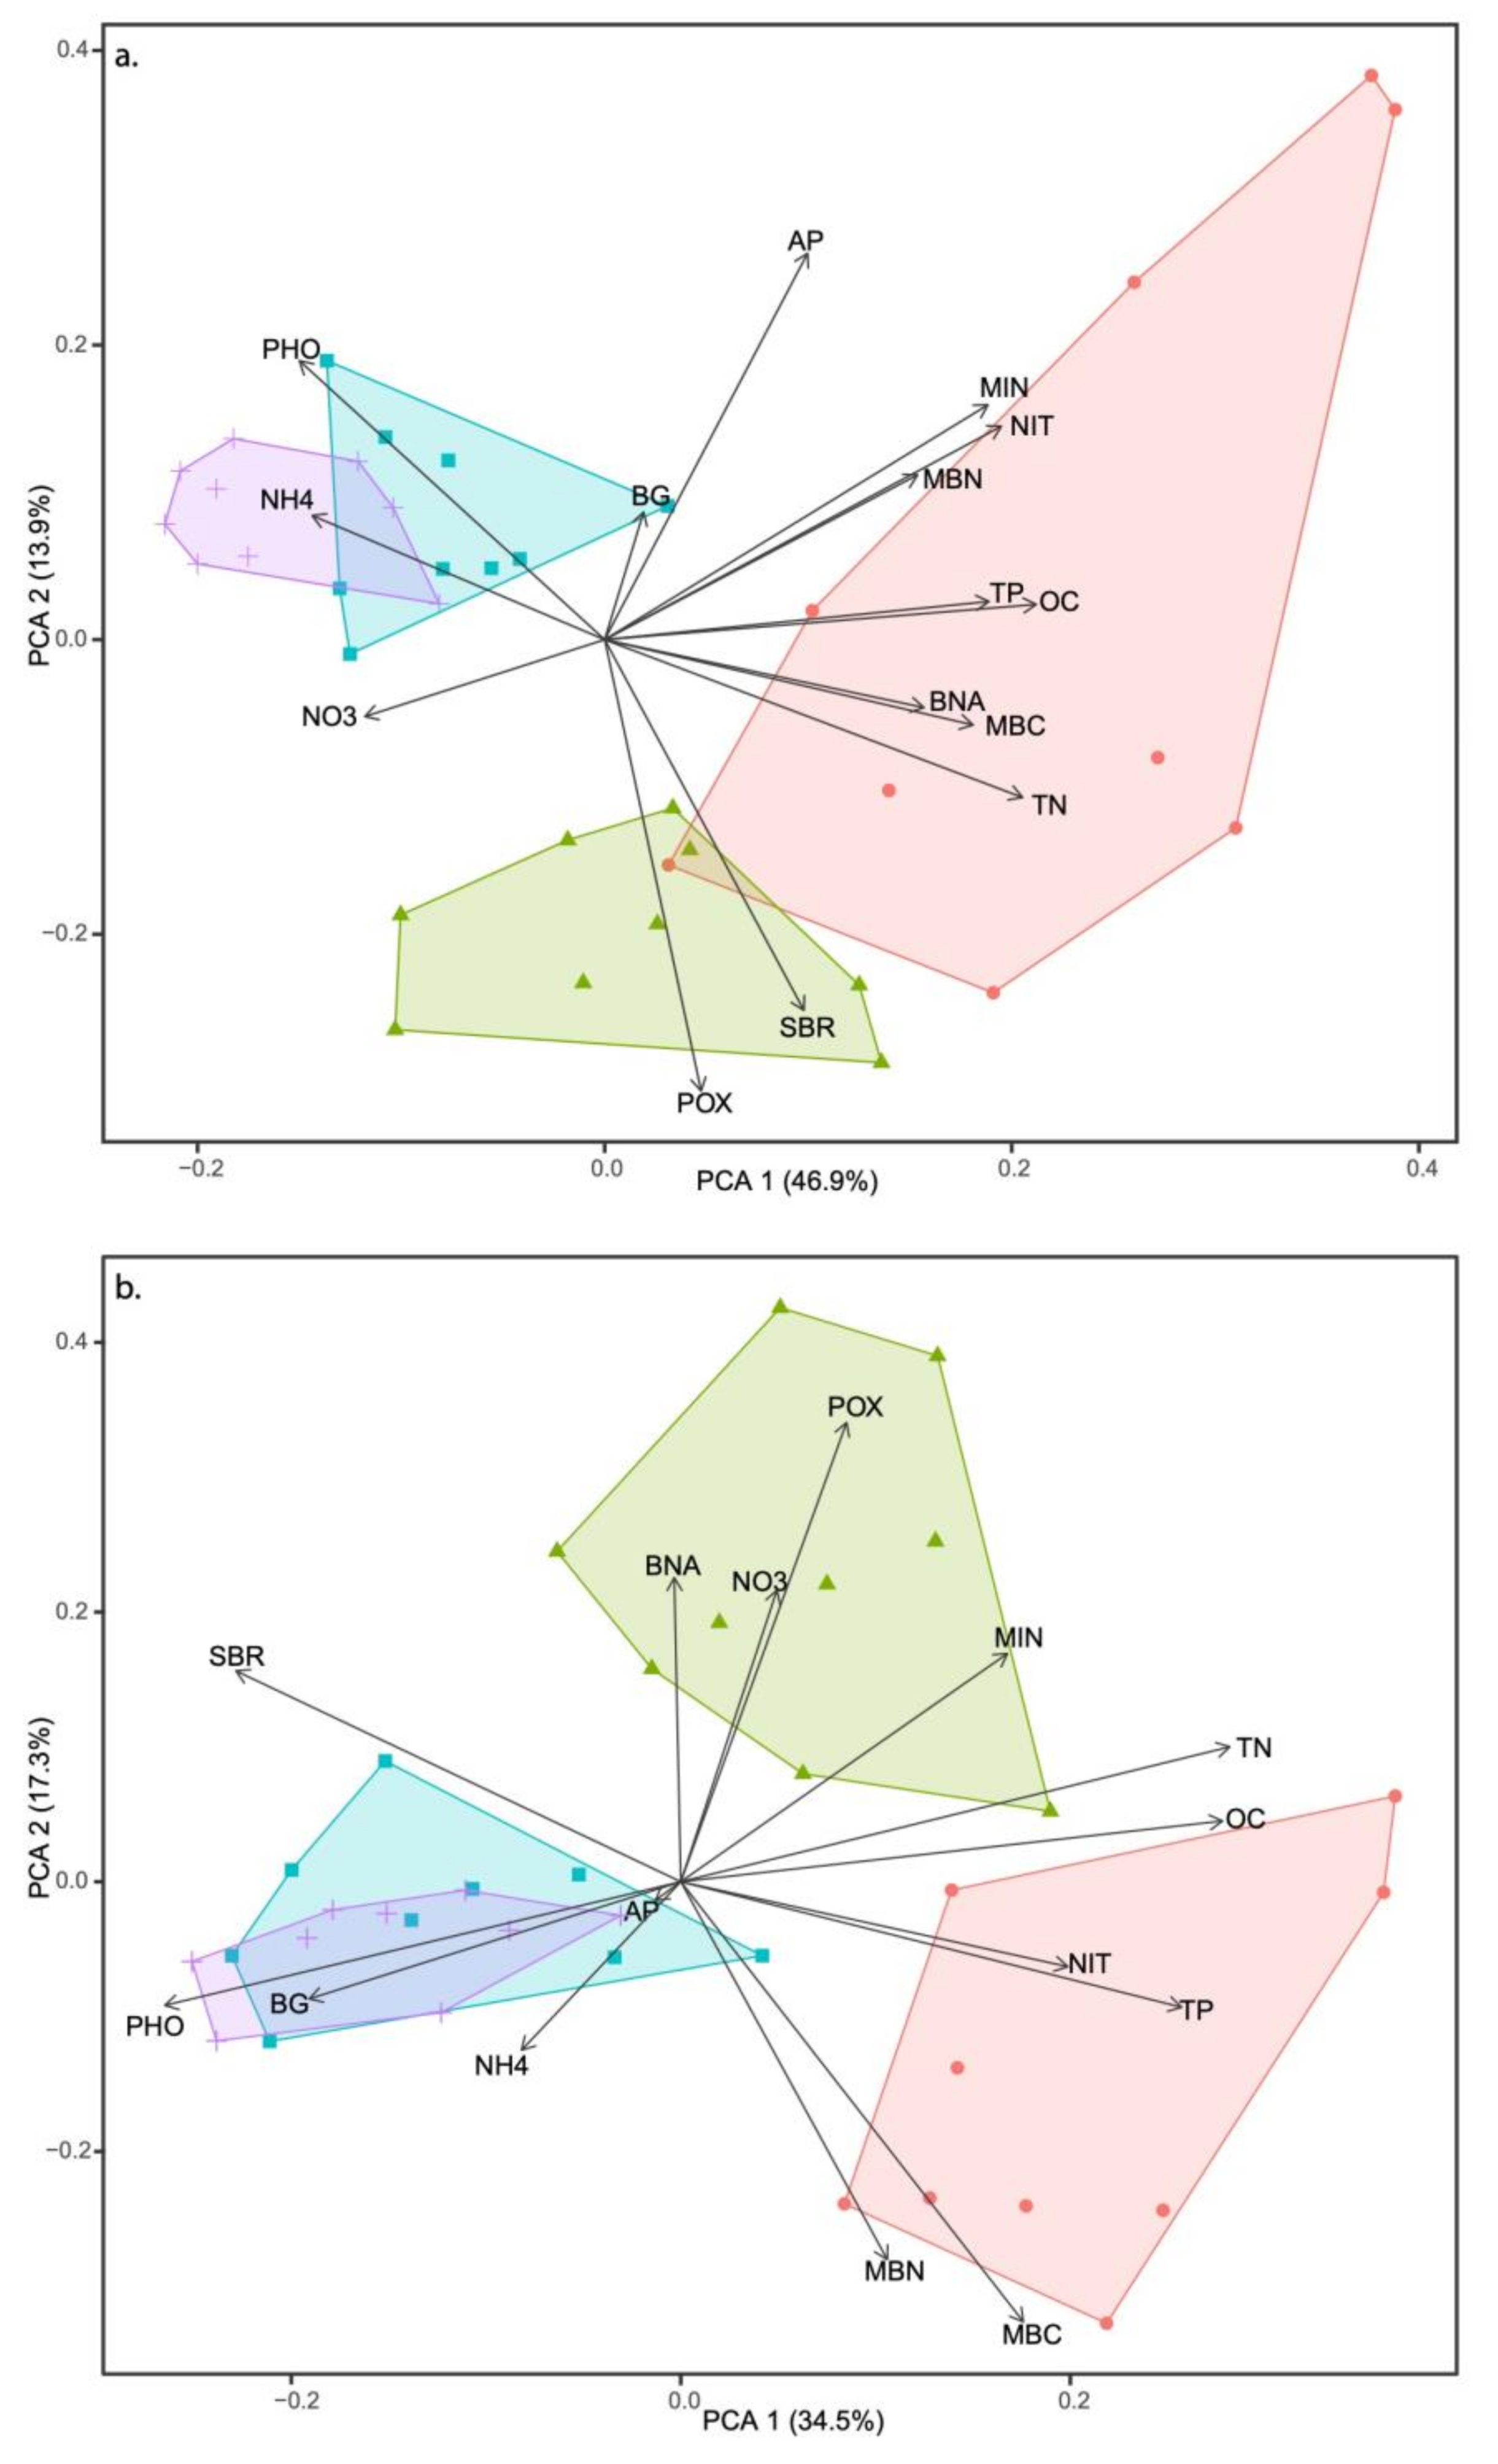
3.4. Multivariate Analysis and Soil Metric Relationships

The PCA allowed us to observe the effects of rainfall on soil metrics in each land-use system in the dry and rainy seasons (Figure 6). The two firsts principal components explained 61 and 52 percent of data variation for the dry and rainy seasons, respectively (Table 3 and Table 4). Across the entire data set, the first principal axis summarized 47 percent of the variation in soil metrics in the dry season (Figure 6a, Table 3). Organic C, total N, NH4 and acid phosphatase had the highest correlation scores on this axis. Sites found at the negative end of PC1 exhibited the lowest activity of acid phosphatase (pastures and silvopastoral systems at 1232 and 1661 mm of MAR) and the highest NH4 concentrations (pastures and silvopastoral systems at the wettest end of the rainfall gradient) (Figure 2 and Figure 5). By contrast, sites found at the positive end (natural forests and pastures at the driest end of the rainfall gradient) exhibited the highest organic C and total N concentrations (Figure 1). The second axis accounted for 14 percent of the variation. Available P and polyphenol oxidase explained the second-largest fraction of the explained variation in soil characteristics. Sites found at the negative end of PC2 exhibited the highest polyphenol oxidase activities irrespective of land use (sites at 917 mm of MAR). By contrast, sites found at the positive end (all land uses at the driest end of the gradient) exhibited low phosphatase activity.
On the other hand, in the rainy season, the first principal axis summarized 34 percent of the variation (Figure 6b, Table 4). The importance of organic C, total N and acid phosphatase detected in the soils of the dry season was also observed in the first PC of the rainy season soil samples. Sites found at the negative end of PC1 exhibited high values in acid phosphatase activities under livestock production systems (the wetter sites; i.e., extensive pastures and silvopastoral systems at 1232 and 1661 mm of MAR). Furthermore, the positive end of the PC1, reflect the highest organic C and total N concentrations in soils under the natural forests at the 711 mm of MAR. The second axis accounted for 17 percent of the variation. Polyphenol oxidase and microbial biomass C and N explained the second-largest fraction of the explained variation in soils. Sites found at the negative end of PC2 exhibited the highest concentrations of microbial biomass C and N under extensive pastures and intensive silvopastoral systems at the driest end of the rainfall gradient. By contrast, sites found at the positive end of this spectrum exhibited the highest polyphenol oxidase activity under extensive pastures and intensive silvopastoral systems, but in sites at 917 mm of MAR.
The correlation matrix (Pearson’s correlation test) across the rainfall gradient show a relevant pattern among soil C, N and P metrics impacted by the rainfall regime (Tables S1–S4). Consistently, two groups of interacting soil metrics appeared. The first group was composed by the sites at the driest and the wettest ends of the gradient with more significant associations between soil metrics (44 in the case of the site that receive 711 mm of rainfall, and 48 in the case of the site that receive 1661 mm of rainfall). The second group was composed by sites at the intermediate range of the rainfall gradient, that show a lower number of significant associations among soil metrics (20 and 35, for sites at 917 mm and 1232 mm of MAR, respectively).

4. Discussion

4.1. Effects of Forest Conversion on Soil Carbon, Nitrogen and Phosphorus Dynamics

The present study provides a quantitative overview of C, N and P concentrations, and metrics of their fluxes in the upper mineral soil layer under natural forests and converted livestock lands across the southeast of Mexico. First, we found a loss of organic C, total N and available P with land-use change. Although this organic C trend is consistent with the meta-analysis of Guo and Gifford [57], who reported that the accumulation of organic C in the mineral soil is altered with the conversion of forest cover to pastures, the significant variation in C values across sites following the conversion from natural forests to livestock production systems was probably due to differences in soil type and vegetation, and effects of land-use disturbance on soil parameters. Nonetheless, our study still suggests that land-use change alters the C-holding capacity of soil as regards short C retention capacity, and that intensive management practices (e.g., clear-cutting and slash burning for site preparation and pruning) and rainfall conditions could favor increased soil C losses [58]. On the other hand, the loss observed in the total N is unexpected, considering the inputs of N with the animal excreta in both livestock production systems. Moreover, although biological N fixation is the primary source of N input in tropical lands [59], the observed loss in soil total N at study sites after the conversion to intensive silvopastoral system indicates that land-use change did alter significantly the balance between N input and loss, with consequences for N retention in this agricultural ecosystem.
The significant differences in C and N observed at study sites due to forest conversion could be related to differences in both quantity and quality of C and N inputs through litter and different management practices between native forests and livestock production systems. Plant species differ in their C sequestration potential, and land-use change by changing woody tree species covers with recalcitrant C compounds [60] to non-woody pasture species or leguminous trees, would be expected to alter the sequestration potential of C. Besides the expected large differences in litter inputs to the soil between natural forests and N-rich litter in silvopastoral systems, forest floor mass and nutrients under the natural forests species had a large quantity of organic materials poorly decomposed that would be incorporated into the mineral soils, as has been observed in these forest ecosystems [61], while a high rate of litter decomposition is expected in silvopastoral systems due to high N concentration and low content of recalcitrant compounds in litter from leguminous trees [62].
Soil basal respiration has been used as a powerful index to evaluate the alterations of soil C cycle [63]. In the present study, land-use change increased the soil basal respiration suggesting a higher ratio of labile soil organic C (i.e., soil organic C pool with “fast” decomposition [64,65]) to the total soil organic C under pastures and Leucaena plantations than under natural forests, probably reflecting the expected differences across land uses in the quantity and/or quality of the C inputs. It is known that it is the ratio of labile soil organic C to total soil organic C, rather than the total soil organic C content itself, that influences soil quality [66], due to its key role for metabolically active microbes [67] and nutrient supply to growing plants [68]. These expected differences in the contribution of labile soil organic C to soil total organic C among land uses could be related to the chemical recalcitrance of root tissue in the studied native forests [60]. On the other hand, management involving no-till in livestock production systems allows the accumulation of labile forms of organic C in soil surface layers [69,70], while more stable organic C accumulates under native forest soils [71]. In addition, inputs of dung-derived C and N often induce microbial priming effects, promoting soil organic matter decomposition [72]. Aside from these possible drivers of changes in soil organic C mineralization, the observed differences in CO2 fluxes between natural forests and livestock systems could persist for an extended period considering that organic C stabilization in soil is relatively long-lasting (between 20 and 60 years; [73]).
Additionally, we observed a generalized loss in soil available P values after land-use change, despite the fact that dung is rich in P [74]. Moreover, the activity of the acid phosphatase under silvopastoral systems increased relative to its activity under natural forests, with largest changes in the wettest end of the rainfall gradient. We cannot determine whether such increase in P-acquiring enzymes under intensive silvopastoral systems resulted from an increase in P-demand by Leucaena plantations (thus exacerbating the possible direct nutrient limitation to soil microbes). Generally, P supply limits ecosystem function in tropical zones [12] and in the study region [74]. The land-cover change of native forests to extensive pasture systems maybe does not change this situation. However, the intensive silvopastoral systems maybe makes P-limitation worse, as indicated also by the low availability of P in the soils. Although this hypothesis of pervasive P limitation in silvopastoral systems could be verified with a study of primary production at the ecosystem level, because microbial biomass C:N:P ratios are relatively invariant across ecosystems [75], differences in microorganism efforts to acquire P should be expected between ecosystems that differ in nutrient supply in order to maintain microorganism homeostasis [76], (i.e., soils poor in P have high levels of activity of P-acquiring enzymes, as was observed in the intensive silvopastoral systems).

4.2. Effects of Rainfall Regime on Soil Carbon, Nitrogen and Phosphorus Dynamics

Climatic variables have strong impacts on soil organic C, N and P contents and fluxes in tropical and extratropical soils [5,77], and previous studies suggested that rainfall is the primary factor controlling soil C, N and P dynamics in water-limited tropical ecosystems [15,78]. Our study indicates that organic C, total N and available P, and microbial biomass C and N concentrations increased with decreased rainfall in both natural forests and livestock production systems. This result is in line with those obtained by Burke et al. [79] who reported that rainfall clearly has a direct role regionally and globally in the amount of soil C and nutrients stored. These patterns indicate that C and nutrient accumulation reflect a strong decrease in decomposition rate with the decrease in MAR reflecting also enrichment in organic matter recalcitrance with decrease in rainfall amount [60,80]. Moreover, the soil basal respiration rates decreased with the decrease in rainfall amount, suggesting a moisture limitation for soil C mineralization. In addition, the net N transformations differed considerably among sites with changes in rainfall amount. However, in contrast with the pattern observed for the C mineralization across sites, the observed highest N transformations in soils from the driest end of the gradient, with the largest values in samples taken in the dry season, suggested that there is a large potential of N losses when the rainy season starts. Thus, the expected reduction in rainfall in the southeast of Mexico [81] could open the N cycle irrespective of land use. Thus, our study also suggests that climate change could affect moisture-sensitive biogeochemical processes, and a N limitation could occur in native forests and livestock production systems if drought intensity increases.
Overall, our study demonstrated that soils (both under native forests and livestock systems) at the driest end of the rainfall gradient had C, N and P accumulation during the dry season, probably due to the decrease in decomposition [62] and soil leaching during the rainless period. These large pools of resources in the dry season could be a large input of C and nutrients to microbial biomass and vegetation demands when the rainy season starts. Correlation analysis allowed us to identify variations in the interaction among soil C and nutrient dynamics across sites affected by both the amount and seasonality of rainfalls. In line with Finzi et al. [82], and Delgado-Baquerizo et al. [83] who propose that drought increase would uncouple the C, N and P cycles, our study indicates that the strength of relationships among soil metrics for C, N and P cycles decreased with the decreases in MAR from the 1661 mm rainfall site to the 917 mm rainfall site, indicating that the cycles of C, N and P in the soil are less coupled with drought. A recent study in Texas found that greater soil water content favored soil bacterial communities [84]. Contrary to this trend, the association between soil variables increase below 917 mm of MAR. This could be due to more intense and prolonged seasonal drought that limits soil leaching and favors the microbial control of soil C and nutrient dynamics [85,86,87].
Regarding the sustainability of the livestock sector in the southeast of Mexico, our study on the consequences of the land-use change and climatic variation in soil nutrient dynamics allows us to conclude that the regulatory mechanisms of soil fertility in these two grazing livestock systems will vary, depending on the details of the site’s nutrient limitations and the expected drought intensification. Aside from these short- and long-term scenarios, the large extension of degraded land in the region [88] creates the opportunity for scaling up tropical forest restoration plans [89] or even the use of intensive leguminous tree plantations, which could be a positive contribution to reduce the massive impact of land use on tropical ecosystems, increase the landscape ecosystem services [8], and limit the contribution of the livestock sector to national N emission [90].

5. Conclusions

The analysis derived from our soil biogeochemical measurements provides an estimate of the response of tropical forest ecosystem and the sensitivity of land-use-change effects to increase in drought in the tropical region of Mexico. Our study indicates that expected climate change could impact moisture-sensitive biogeochemical processes, altering future carbon, nitrogen and phosphorus balances in soils under natural forests, and also in agricultural ecosystems, with potential negative consequences for the sustainability of livestock production systems in these tropical regions. Achieving the agricultural sustainability in these regions depends on limiting drought effects on soil carbon and nutrient losses with a better understanding of their biogeochemical dynamics as well as of the interactions among their cycles.

Supplementary Materials

The following are available online at https://www.mdpi.com/2071-1050/12/20/8656/s1, Table S1: Pearson correlation coefficients for soil metrics in sites that receive 711 mm of total annual rainfall, Table S2: Pearson correlation coefficients for soil metrics in sites that receive 917 mm of total annual rainfall, Table S3: Pearson correlation coefficients for soil metrics in sites that receive 1232 mm of total annual rainfall, Table S4: Pearson correlation coefficients for soil metrics in sites that receive 1661 mm of total annual rainfall

Author Contributions

Conceptualization—J.C., F.G.; formal analysis and data management—D.F., P.O.-F., T.F.A., A.R.-V., B.C.-V., J.D.E., J.C.; writing—original draft preparation—T.F.A., J.C.; writing—review and editing—J.C. All authors have read and agreed to the published version of the manuscript.

Funding

This research was made possible through support from the Mexican Consejo Nacional de Ciencia y Tecnología to D.F. and P.O.-F.; and by the Universidad Nacional Autónoma de México (PAPIIT grant 2015 RV200715).

Acknowledgments

We would like to thank Enrique Solís and Ofelia Beltrán-Paz for their valuable contribution on the soil analyses. We thank the landowners and managers for allowing access to their land and logistical help in the field.

Conflicts of Interest

The authors declare no conflict of interest.

References

  1. Cias, P.; Sabine, C.; Bala, G.; Bopp, L.; Brovkin, V.; Canadell, J.; Chhabra, A.; DeFries, R.; Galloway, J.; Heimann, M.; et al. Carbon and Other Biogeochemical Cycles. In Climate Change 2013: The Physical Science Basis. Contribution of Working Group I to the Fifth Assessment Report of the Intergovernmental Panel on Climate Change; Stocker, T.F., Qin, D., Plattner, G.-K., Tignor, M., Allen, S.K., Boschung, J., Nauels, A., Xia, Y., Bex, V., Midgley, P.M., Eds.; Cambridge University Press: Cambridge, UK, 2013; pp. 465–570. [Google Scholar]
  2. Scharlemann, J.P.W.; Tanner, E.V.J.; Hiederer, R.; Kapos, V. Global soil carbon: Understanding and managing the largest terrestrial carbon pool. Carbon Manag. 2015, 5, 81–91. [Google Scholar] [CrossRef]
  3. Quéré, C.L.; Andrew, R.J.; Canadell, J.G.; Sitch, S.; Korsbakken, J.I.; Peters, G.P.; Manning, A.C.; Boden, T.A.; Tans, P.P.; Houghton, R.A.; et al. Global carbon budget 2016. Earth Syst. Sci. Data 2016, 8, 605–649. [Google Scholar] [CrossRef] [Green Version]
  4. Pan, Y.; Birdsey, R.A.; Fang, J.; Houghton, R.; Kauppi, P.E.; Kurz, W.A.; Phillips, O.L.; Shvidenko, A.; Lewis, S.L.; Canadell, J.G.; et al. A large and persistent carbon sink in the World’s forests. Science 2011, 333, 988–993. [Google Scholar] [CrossRef] [PubMed] [Green Version]
  5. Carvalhais, N.; Forkel, M.; Khomik, M.; Bellarby, J.; Jung, M.; Migliavacca, M.; Μu, M.; Saatchi, S.; Santoro, M.; Thurner, M.; et al. Global covariation of carbon turnover times with climate in terrestrial ecosystems. Nature 2014, 514, 213–217. [Google Scholar] [CrossRef] [PubMed] [Green Version]
  6. Friedlingstein, P.; Houghton, R.A.; Marland, G.; Hackler, J.; Boden, T.A.; Conway, T.J.; Canadell, J.G.; Raupach, M.R.; Ciais, P.; Le Quéré, C. Update on CO2 emissions. Nat. Geosci. 2010, 3, 811–812. [Google Scholar] [CrossRef]
  7. Houghton, R.A.; Nassikas, A.A. Global and regional fluxes of carbon from land use and land cover change 1850–2015. Glob. Biogeochem. Cycles 2017, 31, 1–17. [Google Scholar] [CrossRef]
  8. Veldkamp, E.; Schmidt, M.; Powers, J.S.; Corre, M.D. Deforestation and reforestation impacts on soils in the tropics. Nat. Rev. Earth Environ. 2020. [Google Scholar] [CrossRef]
  9. Graesser, J.; Aide, T.M.; Grau, H.R.; Ramankutty, N. Cropland/pastureland dynamics and the slowdown of deforestation in Latin America. Environ. Res. Lett. 2015, 10, 034017. [Google Scholar] [CrossRef]
  10. DeSy, V.; Herold, M.; Achard, F.; Avitabile, V.; Baccini, A.; Carter, S.; Clevers, J.G.; Lindquist, E.; Pereira, M.; Verchot, L. Tropical deforestation drivers and associated carbon emission factors derived from remote sensing data. Environ. Res. Lett. 2019, 14, 094022. [Google Scholar] [CrossRef] [Green Version]
  11. Chadwick, R.; Good, P.; Martin, G.; Rowell, D.P. Large rainfall changes consistently projected over substantial areas of tropical land. Nat. Clim. Chang. 2016, 6, 177–181. [Google Scholar] [CrossRef]
  12. Townsend, A.R.; Cleveland, C.C.; Houlton, B.Z.; Leck, C.; White, J.W. Multi-element regulation of the tropical forest carbon cycle. Front. Ecol. Environ. 2011, 9, 9–17. [Google Scholar] [CrossRef] [Green Version]
  13. Townsend, A.R.; Asner, G.P.; Cleveland, C.C. The biogeochemical heterogeneity of tropical forests. Trends Ecol. Evol. 2008, 23, 424–431. [Google Scholar] [CrossRef] [PubMed]
  14. Kauffman, J.B.; Sanford, R.L., Jr.; Cummings, D.L.; Salcedo, I.; Sampaio, E.V.S.B. Biomass and nutrient dynamics associated with slash fires in Neotropical dry forests. Ecology 1993, 74, 140–151. [Google Scholar] [CrossRef]
  15. Allen, K.; Dupuy, J.M.; Gei, M.G.; Hulshof, C.; Medvigy, D.; Pizano, C.; Salgado-Negret, B.; Smith, C.M.; Trierweiler, A.; van Bloem, S.J. Will seasonally dry tropical forests be sensitive or resistant to future changes in rainfall regimes? Environ. Res. Lett. 2017, 12, 094002. [Google Scholar] [CrossRef] [Green Version]
  16. Singh, J.S.; Chaturvedi, R.K. Tropical Dry Deciduous Forest: Research Trends and Emerging Features; Springer: New York, NY, USA, 2017. [Google Scholar]
  17. Post, W.M.; Kwon, K.C. Soil carbon sequestration and land-use change: Processes and potential. Glob. Chang. Biol. 2000, 6, 317–327. [Google Scholar] [CrossRef] [Green Version]
  18. Asner, G.P.; Archer, S.R. Livestock and the Global Carbon Cycle. In Livestock in a Changing Landscape: Drivers, Consequences and Responses; Steinfeld, H., Mooney, H.A., Schneider, F., Neville, L.E., Eds.; Island Press: Washington, DC, USA, 2010; pp. 69–82. [Google Scholar]
  19. Galloway, J.; Dentener, F.; Burke, M.; Dumont, E.; Bouwman, A.F.; Kohn, R.A.; Mooney, H.A.; Seitzinger, S.; Kroeze, C. The Impact of Animal Production Systems on the Nitrogen Cycle. In Livestock in a Changing Landscape: Drivers, Consequences and Responses; Steinfeld, H., Mooney, H.A., Schneider, F., Neville, L.E., Eds.; Island Press: Washington, DC, USA, 2010; pp. 83–95. [Google Scholar]
  20. Bhandari, K.B.; West, C.P.; Acosta-Martínez, V.; Cotton, J.; Cano, A. Soil health indicators as affected by diverse forage species and mixtures in semi-arid pastures. Appl. Soil Ecol. 2018, 132, 179–186. [Google Scholar] [CrossRef]
  21. Campo, J.; García-Oliva, F.; Navarrete-Segueda, A.; Siebe, C. Stocks and dynamics of organic carbon in tropical forest ecosystems of Mexico. Terra Latinoamericana 2016, 34, 31–38. [Google Scholar]
  22. Suseela, V.; Conant, R.T.; Wallenstein, M.D.; Dukes, J.S. Effects of soil moisture on the temperature sensitivity of heterotrophic respiration vary seasonally in an old-field climate change experiment. Glob. Change Biol. 2012, 18, 336–348. [Google Scholar] [CrossRef]
  23. Mendoza-Ponce, A.; Corona-Núñez, R.; Kraxner, F.; LeDuc, S.; Patrizio, P. Identifying effects of land use cover changes and climate change on terrestrial ecosystems and carbon stocks in Mexico. Glob. Environ. Change 2018, 56, 12–23. [Google Scholar] [CrossRef] [Green Version]
  24. Galeana-Pizaña, J.M.; Couturier, S.; Monsivais-Huertero, A. Assessing food security and environmental protection in Mexico with a GIS-based Food Environmental Efficiency index. Land Use Pol. 2018, 76, 442–454. [Google Scholar] [CrossRef]
  25. Rivera Huerta, A.; Güereca, L.P.; Rubio Lozano, M.S. Environmental impact of beef production in Mexico through life cycle assessment. Resour. Conserv. Recycl. 2016, 109, 44–53. [Google Scholar] [CrossRef]
  26. Rivera Huerta, A.; Rubio Lozano, M.S.; Padilla-Rivera, A.; Güereca, L.P. Social sustainability assessment in livestock production: A social life cycle assessment approach. Sustainability 2019, 11, 4419. [Google Scholar] [CrossRef] [Green Version]
  27. Tello, J.; Garcillán, P.P.; Ezcurra, E. How dietary transition changed land use in Mexico. Ambio 2020. [Google Scholar] [CrossRef] [PubMed]
  28. Dirzo, R.; García, M.C. Rates of deforestation in Los Tuxtlas, a neotropical area in Southeast Mexico. Conserv. Biol. 1992, 6, 84–90. [Google Scholar] [CrossRef] [Green Version]
  29. Bray, D.B.; Klepeis, P. Deforestation, forest transitions, and institutions for sustainability in Southeastern Mexico, 1900–2000. Environ. Hist. 2005, 11, 195–223. [Google Scholar] [CrossRef]
  30. Balvanera, P.; Cotler, H.; Oropeza, O.A.; Aguilar Contreras, A.; Aguilera Peña, M.; Aluja, M.; Andrade Cetto, A.; Arroyo Quiroz, I.; Ashworth, L.; Astier, M.; et al. State and Trends of Ecosystem Services. In Natural Capital of Mexico, vol II.; Sarukhán, J., Dirzo, R., González, R., March, I.J., Eds.; CONABIO: Mexico City, Mexico, 2009; pp. 185–245. (In Spanish) [Google Scholar]
  31. Reid, R.S.; Bedelian, C.; Said, M.Y.; Kruska, R.L.; Mauricio, R.M.; Castel, V.; Olson, J.; Thornton, P.K. Global Livestock Impacts on Biodiversity. In Livestock in a Changing Landscape: Drivers, Consequences and Responses; Steinfeld, H., Mooney, H.A., Schneider, F., Neville, L.E., Eds.; Island Press: Washington, DC, USA, 2010; pp. 111–137. [Google Scholar]
  32. Broom, D.M.; Galindo, F.A.; Murgueitio, E. Sustainable, efficient livestock production with high biodiversity and good welfare for animals. Proc. R. Soc. Biol. Sci. 2013, 280, 2013–2025. [Google Scholar] [CrossRef] [Green Version]
  33. Nahed-Toral, J.; Valdivieso-Pérez, A.; Aguilar-Jiménez, R.; Cámara-Cordova, J.; Grande-Cano, D. Silvopastoral systems with traditional management in southeastern Mexico: A prototype of livestock agroforestry for cleaner production. J. Clean. Prod. 2013, 57, 266–279. [Google Scholar] [CrossRef]
  34. Williams, D.R.; Alvarado, F.; Green, R.E.; Manica, A.; Phalan, B.; Balmford, A. Land-use strategies to balance livestockproduction, biodiversity conservation and carbon storage in Yucatan, Mexico. Glob. Chang. Biol. 2017, 23, 5260–5272. [Google Scholar] [CrossRef] [Green Version]
  35. Havlik, P.; Valin, H.; Herrero, M.; Obersteiner, M.; Schmid, E.; Rufino, M.C.; Mosnier, A.; Thornton, P.K.; Böttcher, H.; Conant, R.T.; et al. Climate change mitigation through livestock system transitions. Proc. Nat. Acad. Sci. USA 2014, 111, 3709–3714. [Google Scholar] [CrossRef] [Green Version]
  36. Murgueitio, E.; Chará, J.; Barahona, R.; Cuartas, C.; Naranjo, J. Los sistemas silvopastoriles intensivos (SSPi), herramienta de mitigación y adaptación al cambio climático. Trop. Subtrop. Agroecosys. 2014, 17, 501–507. [Google Scholar]
  37. Murgueitio, E.; Calle, Z.; Uribe, F.; Calle, A.; Solorio, B. Native trees and shrubs for the productive rehabilitation of tropical cattle ranching lands. For. Ecol. Manag. 2011, 261, 1654–1663. [Google Scholar] [CrossRef]
  38. Holdridge, L.R.; Grenke, W.C.; Hatheway, W.H.; Liang, T.; Tosi, J.A. Forest Environment in Tropical Life Zones: A Pilot Study; Pergamon Press: New York, NY, USA, 1971. [Google Scholar]
  39. García, E. Modificación al Sistema de Clasificación Climática de Koeppen; Universidad Nacional Autónoma de México: Mexico City, Mexico, 2004. [Google Scholar]
  40. Middleton, N.; Thomas, D. World Atlas of Desertification; Edward Arnold: London, UK, 1997. [Google Scholar]
  41. Mooney, H.A.; Bullock, S.H.; Medina, E. Introduction. In Seasonally Dry Tropical Forests; Bullock, S.H., Mooney, H.A., Medina, E., Eds.; Cambridge University Press: Cambridge, UK, 1995; pp. 1–8. [Google Scholar]
  42. Flores-Guido, J.S.; Durán, R.; Ortíz, J.J. Comunidades Vegetales Terrestres. In Biodiversidad y Desarrollo Humano en Yucatán; Durán, R., Méndez, M., Eds.; CICY, PPD-FMAM, CONABIO, SEDUMA: Merida, Mexico, 2010; pp. 125–129. [Google Scholar]
  43. Gómez-Pompa, A.; Krömer, T.; Castro-Cortéz, R. Atlas de la Flora de Veracruz. Un Patrimonio Natural en Peligro; Gobierno del Estado de Veracruz: Veracruz, Mexico, 2010. [Google Scholar]
  44. Burgos-Hernández, M.; Castillo-Campos, G.; Vergara-Tenorio, M. Potentially useful flora from the tropical rainforest in central Veracruz, Mexico: Considerations for their conservation. Acta Botánica Mexicana 2014, 109, 55–77. [Google Scholar] [CrossRef] [Green Version]
  45. INEGI. Actualización del Marco Censal Agropecuario. 2016. Available online: http://www.beta.inegi.org.mx/proyectos/agro/amca/ (accessed on 24 February 2020).
  46. Porder, S.; Johnson, A.H.; Xing, H.X.; Brocard, G.; Goldsmith, S.; Pett-Ridge, J. Linking geomorphology, weathering and cation availability in the Luquillo Mountains of Puerto Rico. Geoderma 2015, 249, 100–110. [Google Scholar] [CrossRef]
  47. Gee, G.W.; Bauder, J.W. Particle-size Analysis. In Methods of Soil Analysis. Part 1; Klute, A., Ed.; Soil Science Society of America: Madison, WI, USA, 1986; pp. 383–411. [Google Scholar]
  48. Anderson, J.M.; Ingram, J.S.I. Tropical Soil Biology and Fertility: A Handbook of Methods; CAB International: Wallingford, UK, 1993. [Google Scholar]
  49. Bray, R.H.; Kurtz, L.T. Determination of total, organic and available forms of phosphorus in soils. Soil Sci. 1945, 59, 39–46. [Google Scholar] [CrossRef]
  50. Vance, E.D.; Brookes, P.C.; Jenkinson, D.S. An extraction method for measuring soil microbial biomass. Soil Biol. Biochem. 1987, 19, 703–707. [Google Scholar] [CrossRef]
  51. Jenkinson, D.S. The Determination of Microbial Biomass Carbon and Nitrogen in Soil. In Advances in Nitrogen Cycling in Agricultural Ecosystems; Wilson, J.R., Ed.; CAB International: Wallingford, UK, 1988; pp. 368–386. [Google Scholar]
  52. Anderson, J.P.E. Soil Respiration. In Methods of Soil Analysis: Chemical and Microbiological Properties, Part II; Page, A.L., Miller, R.M., Kenny, D.R., Eds.; American Society of Agronomy: Madison, WI, USA, 1982; pp. 831–871. [Google Scholar]
  53. Robertson, G.; Wedin, D.; Groffman, P.; Blair, J.; Holland, E.; Nadelhoffer, K.; Harris, D.F. Soil Carbon and Nitrogen Availability: Nitrogen Mineralization, Nitrification, and Soil Respiration Potentials. In Standard Soil Methods for Long-Term Ecological Research; Robertson, G.P., Coleman, D.C., Bledsoe, C.S., Sollins, P., Eds.; Oxford University Press: New York, NY, USA, 1999; pp. 258–271. [Google Scholar]
  54. Sinsabaugh, R.L.; Hill, B.H.; Follstad Shah, J.J. Ecoenzymatic stoichiometry of microbial organic nutrient acquisition in soil and sediment. Nature 2009, 468, 795–798. [Google Scholar] [CrossRef] [PubMed]
  55. Jackson, C.R.; Tyler, H.L.; Millar, J.J. Determination of microbial extracellular enzyme activity in waters, soils and sediments using high throughput microplate assays. J. Vis. Exp. 2013, 80, e50399. [Google Scholar] [CrossRef] [Green Version]
  56. R Core Team. R: A Language and Environment for Statistical Computing; R Foundation for Statistical Computing: Vienna, Austria, 2013; Available online: https://www.R-project.org/ (accessed on 28 July 2020).
  57. Guo, L.B.; Gifford, M. Soil carbon stocks and land use change: A meta-analysis. Glob. Chang. Biol. 2002, 8, 345–360. [Google Scholar] [CrossRef]
  58. Yang, Y.S.; Guo, J.; Chen, G.; Xie, J.; Gao, R.; Li, Z.; Jin, Z. Carbon and nitrogen pools in Chinese fir and evergreen broadleaved forests and changes associated with felling and burning in mid-subtropical China. Forest Ecol. Manag. 2005, 216, 216–226. [Google Scholar] [CrossRef]
  59. Wang, Y.P.; Houlton, B.Z. Nitrogen constraints on terrestrial carbon uptake: Implications for the global carbon-climate feedback. Geophys. Res. Lett. 2009, 36, L24403. [Google Scholar] [CrossRef] [Green Version]
  60. Campo, J.; Merino, A. Variations in soil carbon sequestration and their determinants along a precipitation gradient in seasonally dry tropical forest ecosystems. Glob. Chang. Biol. 2016, 22, 1942–1956. [Google Scholar] [CrossRef] [PubMed]
  61. Cuevas, R.M.; Hidalgo, C.; Payán, F.; Etchevers, J.D.; Campo, J. Precipitation influences on active fractions of soil organic matter in seasonally dry tropical forests of the Yucatan: Regional and seasonal patterns. Eur. J. For. Res. 2013, 132, 667–677. [Google Scholar] [CrossRef]
  62. Bejarano, M.; Crosby, M.M.; Parra, V.; Etchevers, J.D.; Campo, J. Precipitation regime and nitrogen addition effects on leaf litter decomposition in tropical dry forests. Biotropica 2014, 46, 415–424. [Google Scholar] [CrossRef]
  63. Hertel, D.; Harteveld, M.A.; Leuschner, C. Conversion of a tropical forest into agroforest alters the fine root-related carbon flux to the soil. Soil Biol. Biochem. 2009, 41, 481–490. [Google Scholar] [CrossRef]
  64. Jenkinson, D.S.; Ladd, J.N. Microbial Biomass in Soil: Measurement and Turnover. In Soil Biochemistry; Paul, E.A., Ladd, J.N., Eds.; Marcel Dekker: New York, NY, USA, 1981; pp. 415–471. [Google Scholar]
  65. Falloon, P.D.; Smith, P. Modelling refractory soil organic matter. Biol. Fertil. Soils 2000, 30, 388–398. [Google Scholar]
  66. Loveland, P.; Webb, J. Is there a critical level of organic matter in the agricultural soils of temperate regions: A review. Soil Tillage Res. 2003, 70, 1–18. [Google Scholar] [CrossRef]
  67. Fontaine, S.; Bardoux, G.; Abbadie, L.; Mariotti, A. Carbon input to soil may decrease soil carbon content. Ecol. Lett. 2004, 7, 314–320. [Google Scholar] [CrossRef]
  68. Lagomarsino, A.; Moscatelli, M.C.; De Angelis, P.; Grego, S. Labile substrates quality as the main driving force of microbial mineralization activity in a poplar plantation soil under elevated CO2 and nitrogen fertilization. Sci. Total Environ. 2006, 372, 256–265. [Google Scholar] [CrossRef]
  69. Angers, D.A.; Eriksen-Hamel, N.S. Full-inversion tillage and organic carbon distribution in soil profiles: A meta-analysis. Soil Sci. Soc. Am. J. 2008, 72, 1370–1374. [Google Scholar] [CrossRef]
  70. Powlson, D.S.; Stirling, C.M.; Jat, M.L.; Gerard, B.G.; Palm, C.A.; Sanchez, P.A.; Cassman, K.G. Limited potential of no-till agriculture for climate change mitigation. Nat. Clim. Chang. 2014, 4, 678–683. [Google Scholar] [CrossRef]
  71. Ludwig, M.; Achtenhagen, J.; Miltner, A.; Eckhardt, K.-U.; Leinweber, P.; Emmerling, C.; Thiele-Bruhn, S. Microbial contribution to SOM quantity and quality in density fractions of temperate arable soils. Soil Biol. Biochem. 2015, 81, 311–322. [Google Scholar] [CrossRef]
  72. Bloor, J.M.G. Additive effect of dung amendment and plant species identity on soil processes and soil inorganic nitrogen in grass monocultures. Plant Soil 2015, 396, 189–200. [Google Scholar] [CrossRef]
  73. West, T.O.; Post, W.M. Soil organic carbon sequestration rates by tillage and crop rotation: A global data analysis. Soil Sci. Soc. Am. J. 2002, 66, 1930–1946. [Google Scholar] [CrossRef] [Green Version]
  74. Campo, J.; Vázquez-Yanes, C. Effects of nutrient limitation on aboveground carbon dynamics during tropical dry forest regeneration in Yucatán, Mexico. Ecosystems 2004, 7, 311–319. [Google Scholar] [CrossRef]
  75. Cleveland, C.C.; Liptzin, D. C:N:P stoichiometry in soil: Is there a “Redfield ratio” for the microbial biomass? Biogeochemistry 2007, 85, 235–252. [Google Scholar] [CrossRef]
  76. Sinsabaugh, R.L.; Belnap, J.; Findlay, S.G.; Shah, J.J.F.; Hill, B.H.; Kuehn, K.A.; Kuske, C.R.; Litvak, M.E.; Martinez, N.G.; Moorhead, D.L.; et al. Extracellular enzyme kinetics scale with resource availability. Biogeochemistry 2014, 121, 287–304. [Google Scholar] [CrossRef]
  77. Vitousek, P. Nutrient Cycling and Limitation: Hawai’i as a Model. System; Princeton University Press: Princeton, NJ, USA, 2004. [Google Scholar]
  78. Ochoa-Hueso, R.; Arca, V.; Delgado-Baquerizo, M.; Hamonts, K.; Piñeiro, J.; Serrano-Grijalva, L.; Shawyer, J.; Power, S.A. Links between soil microbial communities, functioning, and plant nutrition under altered rainfall in Australian grassland. Ecol. Monogr. 2020. [Google Scholar] [CrossRef]
  79. Burke, I.C.; Yonker, C.M.; Parton, W.J.; Cole, C.V.; Flach, K.; Schimel, D.S. Texture, climate, and cultivation effects on soil organic matter content in U.S. grassland soils. Soil Sci. Soc. Am. J. 1989, 53, 800–805. [Google Scholar] [CrossRef]
  80. Jasso-Flores, I.; Galicia, L.; Chávez-Vergara, B.; Merino, A.; Tapia-Torres, Y.; García-Oliva, F. Soil organic matter dynamics and microbial metabolism along an altitudinal gradient in Highland tropical forests. Sci. Total Environ. 2020, 741, 140143. [Google Scholar] [CrossRef]
  81. Conde, C.; Estrada, F.; Martínez, B.; Sánchez, O.; Gay, C. Regional climate change scenarios for Mexico. Atmósfera 2011, 24, 125–140. [Google Scholar]
  82. Finzi, A.C.; Austin, A.T.; Cleland, E.E.; Frey, S.D.; Houlton, B.Z.; Wallenstein, M.D. Responses and feedbacks of coupled biogeochemical cycles to climate change: Examples from terrestrial ecosystems. Front. Ecol. Environ. 2011, 9, 61–67. [Google Scholar] [CrossRef] [Green Version]
  83. Delgado-Baquerizo, M.; Maestre, F.T.; Gallardo, A.; Bowker, M.A.; Wallenstein, M.D.; Quero, J.L.; Ochoa, V.; Gozalo, B.; García-Gómez, M.; Soliveres, S.; et al. Decoupling of soil nutrient cycles as a function of aridity in global drylands. Nature 2013, 502, 672–676. [Google Scholar] [CrossRef] [PubMed]
  84. Bhandari, K.B.; Longing, S.D.; West, C.P. Soil microbial communities in corn fields treated with atoxigenic Aspergillus flavus. Soil Syst. 2020, 4, 35. [Google Scholar] [CrossRef]
  85. Singh, J.S.; Raghubanshi, A.S.; Singh, R.S.; Srivastava, S.C. Microbial biomass acts as a source of plant nutrients in dry tropical forests and savanna. Nature 1989, 338, 499–500. [Google Scholar] [CrossRef]
  86. Campo, J.; Jaramillo, V.J.; Maass, J.M. Pulses of soil phosphorus availability in a tropical dry forest: Effects of seasonality and level of wetting. Oecologia 1998, 115, 167–172. [Google Scholar] [CrossRef]
  87. Gei, M.G.; Powers, J.S. Nutrient Cycling in Tropical Dry Forests. In Tropical Dry Forests in the Americas; Sánchez-Asofeifa, A., Powers, J.S., Fernandes, G.W., Quesada, M., Eds.; CRC Press: Boca Raton, FL, USA, 2014; pp. 141–156. [Google Scholar]
  88. Krasilnikov, P.; Gutiérrez-Castorena, M.C.; Ahrens, R.J.; Cruz-Gaistardo, C.O.; Sedov, S.; Solleiro-Rebolledo, E. The Soils of Mexico; Springer: New York, NY, USA, 2013. [Google Scholar]
  89. Tobón, W.; Urquiza-Haass, T.; Koleff, P.; Schröter, M.; Ortega-Álvarez, R.; Campo, J.; Lindig-Cisneros, R.; Sarukhán, J.; Bonn, A. Restoration planning using a multi-criteria approach to guide Aichi targets in a megadiverse country. Conserv. Biol. 2017, 31, 1086–1097. [Google Scholar] [CrossRef]
  90. Instituto Nacional de Ecologia y Cambio Climático. Inventario Nacional de Gases y Compuestos de Efecto Invernadero. Available online: https://www.gob.mx/inecc/acciones-y-programas/inventario-nacional-de-emisiones-de-gases-y-compuestos-de-efecto-invernadero (accessed on 5 October 2020).
Figure 1. Soil organic carbon, total nitrogen and total phosphorus concentrations in dry (ac) and rainy (df) seasons under natural forests, pastures and silvopastoral systems along a rainfall gradient. Data are means and confidence intervals.
Sustainability 12 08656 g001
Figure 2. Soil ammonium, nitrate and available phosphorus concentrations in dry (ac) and rainy (df) seasons under natural forests, pastures and silvopastoral systems along a rainfall gradient. Data are means and confidence intervals.
Sustainability 12 08656 g002
Figure 3. Soil microbial biomass carbon and microbial biomass nitrogen concentrations in dry (a,b) and rainy (c,d) seasons under natural forests, pastures and silvopastoral systems along a rainfall gradient. Data are means and confidence intervals.
Sustainability 12 08656 g003
Figure 4. Soil basal respiration, net nitrogen mineralization and net nitrification in dry (ac) and rainy (df) seasons under natural forests, pastures and silvopastoral systems along a rainfall gradient. Data are means and confidence intervals.
Sustainability 12 08656 g004
Figure 5. Activities of ß-1, 4-glucosidase, polyphenol oxidase, ß-1, 4-N-acetylglucosaminidase and acid phosphatase in soils in dry (ad) and rainy (eh) seasons from natural forests, pastures and silvopastoral systems along a rainfall gradient. Data are means and confidence intervals.
Sustainability 12 08656 g005aSustainability 12 08656 g005b
Figure 6. Principal components (PC) analyses biplots of the soil metric data for sites along a rainfall gradient in dry (a) and rainy (b) seasons. Red circles 711-mm of mean annual rainfall sites; green triangles 917 mm of mean annual rainfall sites; blue squares 1232 mm of mean annual rainfall sites; lilac symbols 1611 mm of mean annual rainfall sites.
Sustainability 12 08656 g006
Table 1. Location and characteristics of four study sites across the southeast of Mexico.
Location20°51′ N, 89°37′ W21°08′ N, 88°09′ W19°24′ N, 96°22′ W20°01′ N, 97°06′ W
Altitude (m)102014121
Mean annual temperature (°C) 225.725.325.424.4
Mean annual rainfall (mm year−1) 271191712321661
Potential evapotranspiration (mm year−1) 11719167715611215
Aridity index 20.41 (semiarid)0.55 (dry subhumid)0.79 (humid)1.37 (humid)
Water stress monthsOctober–MayNovember–MayOctober–MayJanuary–April
Mean month rainfall in water stress months
(mm month−1) 327532980
Soil bulk density (g cm−3)0.80.80.91.1
Soil clay content (%)12.112.515.415.5
Soil pH (H2O)8.07.67.45.1
1 Long-term climatic data (1975–2019 period; Comisión Nacional de Aguas personal communication). 2 Aridity Index [39,40]. 3 Water stress months are the number of months per year with rainfall < 100 mm.
Table 2. Site, season and land-use effects on soil carbon, nitrogen and phosphorus metrics along a rainfall gradient in Southeast Mexico.
MetricSource of Variation
SiteSeasonLand Use
F
Organic C (OC)34.6 ***0.595 NS8.45 **
Total N (TN)50.5 ***1.33 NS6.47 **
NH423.0 ***13.9 ***0.626 NS
NO34.36 NS59.8 ***1.55 NS
Total P (TP)43.0 ***0.676 NS2.61 NS
Available P (AP)0.565 NS29.9 ***6.48 **
Microbial biomass C (MBC)32.0 ***1.14 NS3.44 NS
Microbial biomass N (MBN)16.4 ***0.860 NS0.042 NS
Soil basal respiration (SBR)2.95 *0.124 NS6.76 **
Net N mineralization (MIN)17.4 ***4.20 *1.13 NS
Net nitrification (NIT)32.9 ***4.15 *1.05 NS
ß-1, 4-glucosidase (BG)8.06 *8.94 **3.36 NS
Polyphenol oxidase (POX)37.0 ***2.85 NS2.21 NS
ß-1, 4-N-acetylglucosaminidase (BNA)10.1 **0.851 NS4.69 *
Acid phosphatase (PHO)70.1 ***0.305 NS6.84 *
Significance main effect: NS, p > 0.05; *, p < 0.05; **, p < 0.01; ***, p < 0.001.
Table 3. Eigenvalues, cumulative percent variation, and eigenvectors of the first three principal components (PCs) for the soil metrics in the dry season.
PC1PC2PC3
Eigenvalue7.0452.0911.440
Cumulative percent variation46.960.870.4
Eigenvectors
Organic C (OC)0.940.060.14
Total N (TN) 0.91−0.260.12
NH4−0.640.200.12
NO3−0.52−0.130.58
Total P (TP)0.840.06−0.14
Available P (AP)0.440.630.49
Microbial biomass C (MBC)0.80−0.140.001
Microbial biomass N (MBN)0.680.270.31
Soil basal respiration (SBR)0.43−0.61−0.41
Net N mineralization (MIN)0.840.39−0.15
Net nitrification (NIT)0.870.35−0.13
ß-1, 4-glucosidase (BG)0.080.21−0.43
Polyphenol oxidase (POX)0.21−0.740.34
ß-1, 4-N-acetylglucosaminidase (BNA)0.70−0.110.17
Acid phosphatase (PHO)−0.670.46−0.29
Table 4. Eigenvalues, cumulative percent variation, and eigenvectors of the first three principal components (PCs) for the soil metrics in the rainy season.
PC1PC2PC3
Eigenvalue5.1742.6012.025
Cumulative percent variation34.451.765.2
Eigenvectors
Organic C (OC)0.890.100.11
Total N (TN)0.900.230.22
NH4−0.26−0.280.74
NO30.160.490.22
Total P (TP)0.82−0.21−0.04
Available P (AP)−0.04−0.03−0.14
Microbial biomass C (MBC)0.56−0.740.01
Microbial biomass N (MBN)0.34−0.630.03
Soil basal respiration (SBR)−0.720.350.30
Net N mineralization (MIN)0.530.380.58
Net nitrification (NIT)0.63−0.140.46
ß-1, 4-glucosidase (BG)−0.61−0.200.51
Polyphenol oxidase (POX)0.270.770.29
ß-1, 4-N-acetylglucosaminidase (BNA)−0.010.51−0.50
Acid phosphatase (PHO)−0.84−0.210.34
Publisher’s Note: MDPI stays neutral with regard to jurisdictional claims in published maps and institutional affiliations.

