Article

Relationships among Beliefs, Attitudes, Time Resources, Subjective Norms, and Intentions to Use Wearable Augmented Reality in Art Galleries

1
Creative AR & VR Hub, Faculty of Business & Law, Manchester Metropolitan University, All Saints Building, Manchester M15 6BH, UK
2
School of Management, Kyung Hee University, 26 Kyungheedae-ro, Dongdaemun-gu, Seoul 02447, Korea
3
Smart Tourism Research Center, Kyung Hee University, 26 Kyungheedae-ro, Dongdaemun-gu, Seoul 02447, Korea
4
Smart Tourism Education Platform, Kyung Hee University, 26 Kyungheedae-ro, Dongdaemun-gu, Seoul 02447, Korea
*
Author to whom correspondence should be addressed.
Sustainability 2020, 12(20), 8628; https://doi.org/10.3390/su12208628
Submission received: 8 September 2020 / Revised: 10 October 2020 / Accepted: 15 October 2020 / Published: 18 October 2020

Abstract

:
As a result of interactive and immersive technologies such as augmented reality, almost every service business has changed their ways of engaging with consumers. However, there has been little research on acceptance and use of wearable augmented reality (AR) in interactive services in museums and art galleries. Therefore, the aim of this study was to investigate the causal relationships among customers’ beliefs, evaluation, attitudes, perceived behavior control (time resources), subjective norms, and intentions to use wearable AR and visit a tourist attraction (an art gallery) using the theory of planned behavior. The results showed that time resources affected intention to visit an art gallery, while attitude toward wearable AR had an impact on intention to use wearable AR. Subjective norms were found to predict intentions, and the intention to use wearable AR was found to influence the intention to visit an art gallery.

1. Introduction

The development of augmented reality (AR) as a widely used technology is largely a result of AR’s potential to create immersive experiences being recognized by developers of applications such as Pokemon Go. [1]. As a result of these interactive and immersive services, almost every service business has changed their ways of engaging with consumers. The idea of interactive services is that businesses find customers virtually in order to entice them to visit real world shops [2]. In the museum and art gallery context, previous studies have examined the link between online visual interfaces and offline museum visits [3]. Despite numerous previous studies have been paid to the potential of augmented reality (AR) to enhance the visitor experience in the context of cultural heritage tourism, museums, theme parks, and science festivals [4,5,6,7,8,9,10,11,12], little research has focused on the use of AR in the context of interactive services. AR has the potential to be an effective tool in interactive services since AR can generate virtual 3D images or information that can be superimposed onto visitors’ direct environment, enhancing the visitors’ experience. For instance, with wearable smartglasses, people can receive digital information superimposed onto artifacts or masterpieces. However, so far, whether a wearable AR experience using digital technology can increase the number of people making physical visits to art galleries has not been examined.
The theory of planned behavior (TPB) was developed by Ajzen [13] to predict an individual’s intention to engage in a certain behavior at a specific time and place. The TPB was developed from the theory of reasoned action (TRA). According to the TPB, perceived behavioral control, attitudes, and subjective norms are variables that influence behavioral intentions and actual behavior. The TPB has been applied in tourism studies to investigate tourists’ intentions in the context of wine-based vacations [14], green hotel visitation [15], travel decision-making influenced by risk and uncertainty [16], tourism destination choice via eWOM [17], and accommodation managers’ crisis planning [18]. In addition, due to its usefulness in predicting individual intentions, the TPB has been used to explain tourists’ adoption and usage of information technologies in the tourism and hospitality context [19,20,21,22,23]. Nevertheless, little research has applied the TPB to acceptance and use of wearable AR in interactive services in museums and art galleries. Therefore, the purpose of this study is to fill this gap between theory and practice by investigating the causal relationships among visitors’ beliefs about wearable AR (usability, enjoyment, and aesthetics), wearable AR evaluations, attitudes to wearable AR, time resources (perceived behavioral control), subjective norms, and behavioral intentions. Most importantly, this study aims to address an unresolved issue in the literature by exploring whether behavioral intentions to use wearable AR lead to the actual intention to visit an art gallery.

2. Literature Review

2.1. Interactive Services

An interactive service enables a user to display desired information, such as news, financial, and cultural information, and perform desired transactional services through various types of digital displays [24]. The advantage of using AR in art galleries is that it enhances visitors’ real gallery experience using digital information. A number of previous studies have investigated the visitor experience in museums [25,26] or the enhancement of the visitor experience through technologies such as audio guides [27], PDAs [28,29], or mobile phones [6,30,31,32]. However, research examining the interactive experience of using wearable AR is scarce [3]. Pallud and Straub [3] investigated the in-museum experience and the website experience in the same study and found that the intention to revisit the website relates to the intention to visit the museum. This finding shows that museum technology should not always be investigated independently. In fact, stronger conclusions regarding the actual success of technological innovations can be drawn when the effects on the museum visit are incorporated [3]. This was confirmed in the retail context, as Farag et al. [33] found that in-store shopping has a positive effect on online buying. Although the effect is in the opposite direction from that in Pallud and Straub’s [3] museum context, it shows that incorporating interactive service has important implications for behavioral intentions.

2.2. Augmented Reality and Wearables

AR is changing the way tourists experience their immediate surroundings through an overlay of digital content on the real environment. The emergence of mobile technologies has increased the popularity of AR applications [6]. According to Han et al. [7], the tourism industry can greatly benefit from AR, as tourists normally have little or no knowledge about a destination and, therefore, an enhancement of the environment through digital information can greatly increase tourist satisfaction. Tourist destinations such as Deoksugung Palace (Deoksugung in My Hands), Dublin (Dublin AR), Tuscany (Tuscany+), and Basel (Augmented Reality for Basel) have been in the forefront of the implementation of AR [6,7,8,34]. In addition, researchers have found that the utilization of mobile AR has positive effects on tourists’ behavioral intentions [35,36,37,38,39]. In the Korean cultural heritage context, Chung et al. [4] found that a positive attitude toward the use of mobile AR can have positive effects on both the behavioral intention to use AR and the intention to visit destinations or visitor attractions.
Other studies took a more theoretical approach and identified user acceptance [8,36,37,40,41] or the AR tourism experience [6,10,12,37,38,39,42,43]. The development of wearable devices, such as Microsoft’s Hololens, added a new dimension of interactivity to AR. Tourists are able to use wearable AR applications in a more intuitive and immersive setting, as the need to hold a mobile device in front of the face is obviated through head-mounted displays. Thus, wearable devices make the entire experience more natural and are therefore considered superior for experiencing AR [44].

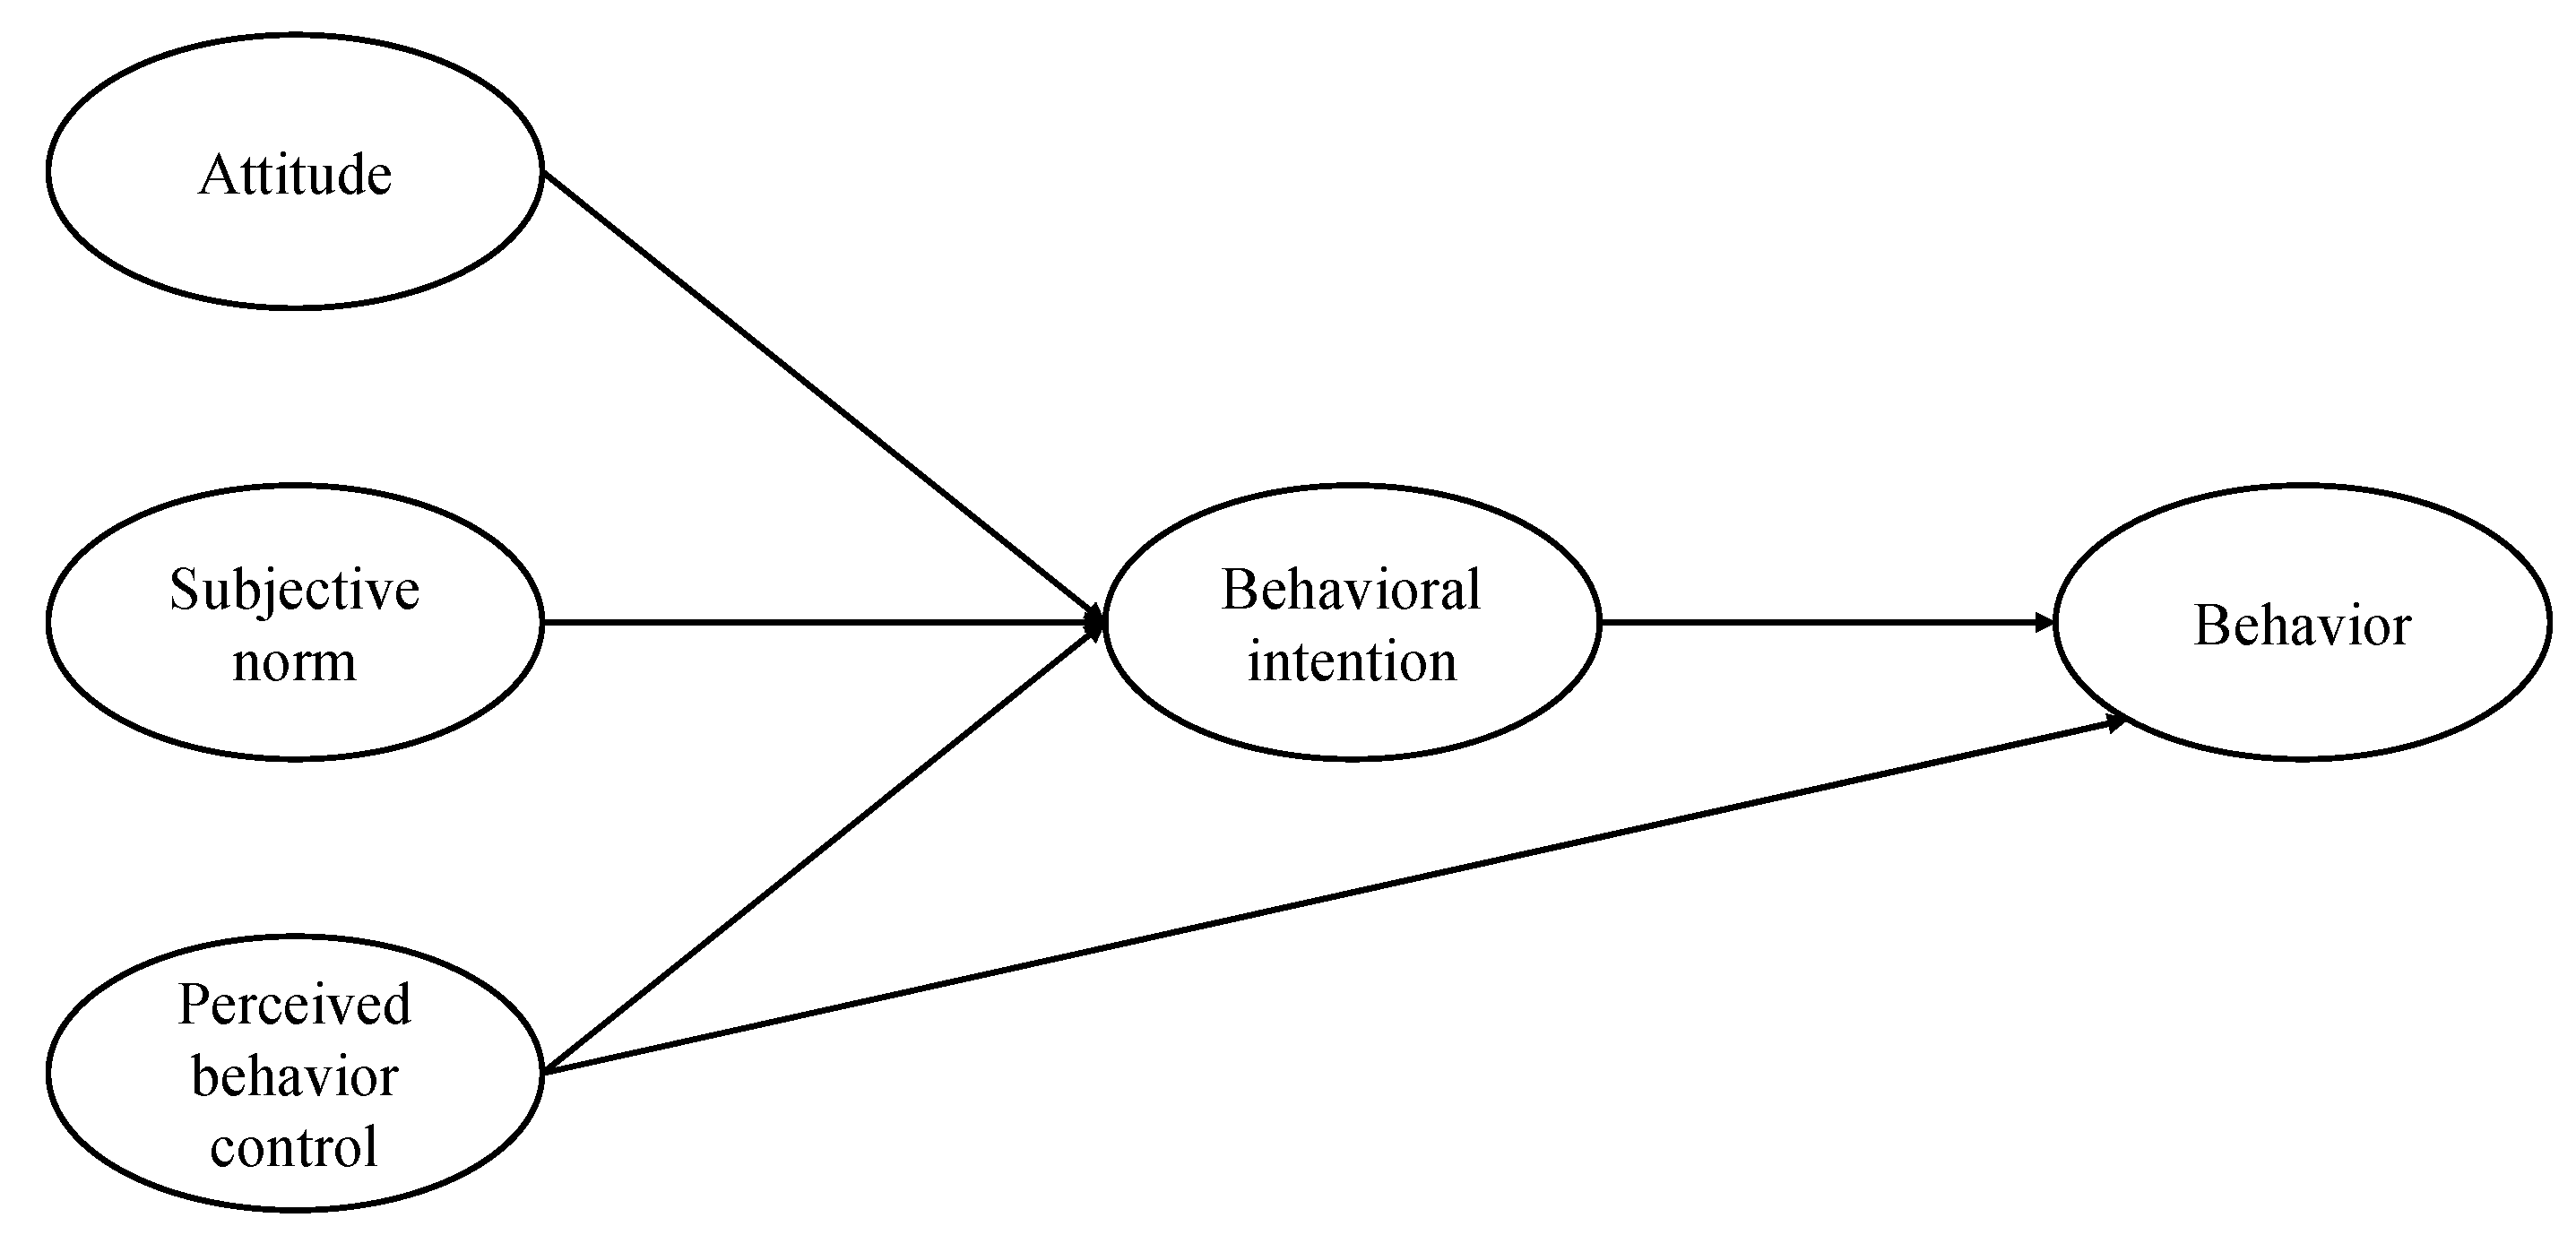
2.3. Theory of Planned Behavior

Fishbein and Ajzen [45] proposed the TRA, which postulates that behavioral intentions result from two distinct components: Attitude toward the behavior and subjective norms. Both are critical determinants of actual behavior. Behavioral beliefs are beliefs concerning the behavior, and influence an individual’s attitude toward performing a specific behavior, while normative beliefs are beliefs about whether others approve of a specific behavior [46]. Based on the TRA, Ajzen [13] developed the TPB, which includes perceived behavioral control as an exogenous variable that influences both behavioral intentions and actual behavior (Figure 1). Perceived behavioral control has relevance to the possession of requisite resources and opportunities to perform a specific behavior. For instance, individuals tend to have greater perceived behavioral control over their behavior when they think that they have enough resource opportunities and ability to overcome any obstacles they might encounter [46,47]. Therefore, the TPB has been regarded as extending the boundary conditions of pure volitional control of TRA [48]. Several researchers have compared the TPB with the TRA and found that the TPB has greater explanatory power [46,49].
Although the TPB was developed in the 1980s, it is still in active use as a theoretical framework, especially in the field of information technology. The TPB has been valued for its usefulness in predicting and explaining individuals’ acceptance or use of technology [50]. Numerous researchers have integrated the TPB with other theories or models to explain the determinants of users’ adoption or use of cutting-edge technologies [51,52]. In addition, self-efficacy has been widely used instead of perceived behavioral control because perceived behavioral control is regarded as less understood [53]. Since perceived behavioral control has its roots in self-efficacy [48], perceived behavior control is conceptually related to self-efficacy. However, unlike self-efficacy, which is one’s perceived control over internal factors, perceived behavioral control is related to both internal and external factors [53,54]. Therefore, we adopted the TPB as a theoretical framework in this study and investigated the impact of attitudes toward wearable AR, subjective norms, and time resources (perceived behavioral control) on behavioral intentions (intention to use wearable AR and intention to visit an art gallery).

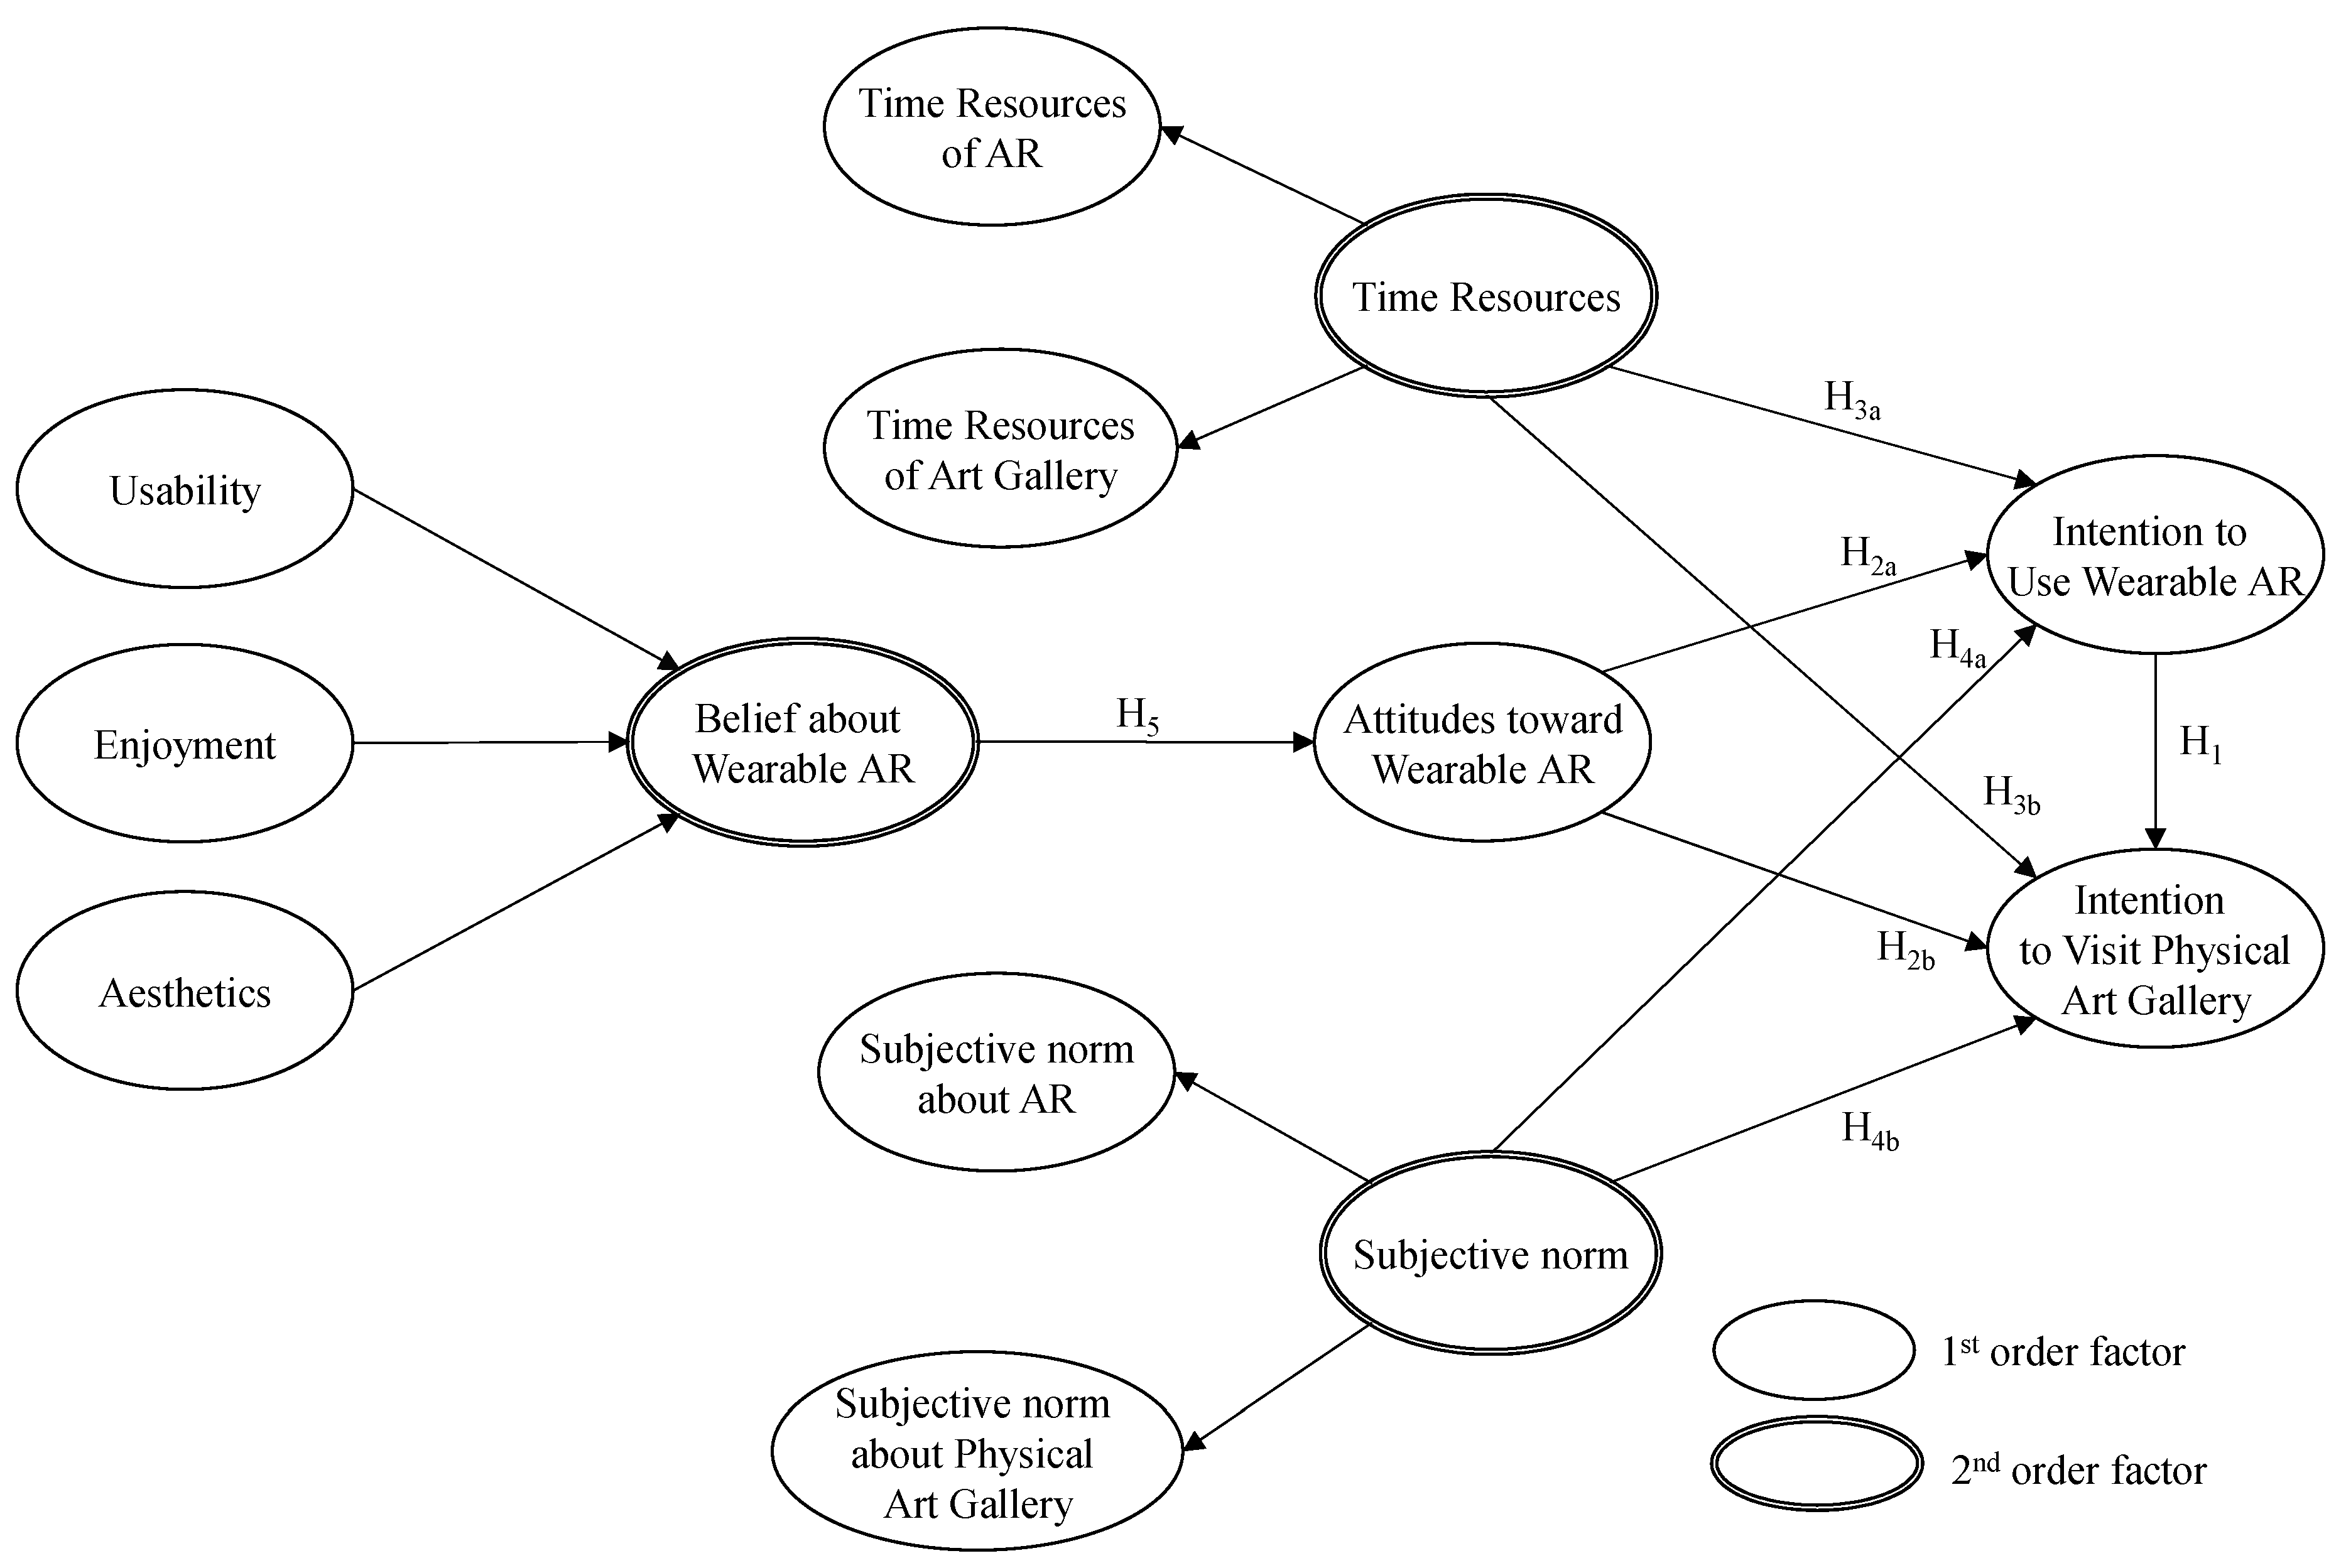
3. Theoretical Framework and Hypotheses Development

3.1. Research Model

In order to investigate the role of wearable AR, which may lead to the intention to visit a physical art gallery, as a tool of interactive services, we proposed the following research model (Figure 2). Our contribution to knowledge is as follows. First, in order to examine whether there is a positive relationship between the intention to use technology and the intention to visit a physical visitor attraction, we distinguished the intention to use wearable AR from the intention to visit an art gallery. Second, by adopting the TPB as a theoretical framework, we investigated the impact of attitudes toward wearable AR, subjective norms and time resources on behavioral intentions. Finally, the present study has second-order constructs (wearable AR evaluation, subjective norms, and time resource). Although Hair, Ringle, and Sarstedt [55] demonstrated that all first-order constructs constitute reflective measurement, in which the indicators are considered to play the role of latent constructs, wearable AR evaluation has a formative measurement in the present study, because first- order variables (usability, enjoyment, and aesthetics) presumably lead to wearable AR evaluations.

3.2. Hypotheses Development

3.2.1. Behavioral Intentions

Because the present research takes into account visitors’ beliefs after the initial use of wearable AR and their impacts on attitudes toward and intentions to visit the physical art gallery, the post-acceptance model of information system continuance has theoretical relevance [56]. Therefore, in the present study, intention to use wearable AR can be defined as the continuance of intention to use AR service in an art gallery. Behavioral intentions have been a common variable in previous research on the relationship between attitudes and behavior; however, research assessing the effect of behavioral intention to use information systems on the behavioral intention to visit physical spaces is scarce [3]. Especially given the novelty of wearable AR, previous research has not assessed how the intention to use wearable AR affects the intention to visit art galleries.
As the focus of museums and art galleries has shifted from the display of collections to visitors’ education and entertainment experiences [3], numerous cutting-edge technologies such as AR services have been provided to enhance visitors’ experiences [6] by conveying historical information and enhancing enjoyment [57]. The goal of these technologies is to encourage visitors to revisit museums and art galleries by giving them a memorable experience. Based on this logic, wearable AR services in museums and physical art galleries can be useful for interactive services, connecting the virtual environment and physical attractions. Therefore, we propose the following hypothesis:
Hypothesis 1 (H1).
Intention to use wearable AR has a positive effect on the intention to visit a physical art gallery.

3.2.2. Attitude

In the present study, the attitude toward wearable AR is defined as the degree of evaluative affect that an individual associates with using AR services in an art gallery [58]. Attitudes have been treated as the strongest predictor of behavioral intentions in both the tourism and technology acceptance contexts [17,19]. Using the TPB, Reza and Samiei [17] investigated the impact of electronic word-of-mouth on tourism destination choice and found that attitudes have a strong effect on the intention to visit a destination. Within the IS and tourism context, Huh et al. [19] found that attitudes influence employees’ intentions to use technology in upscale Korean hotels. Interestingly, Cheng et al. [59] investigated the effect of attitudes from the customers’ point of view. They examined how the attitude towards negative word-of-mouth is positively related to the behavioral intention of engaging in negative communication. Nonetheless, this uses the traditional approach from the TPB, assessing the effect of attitudes on the intention to use wearable AR and the intention to visit the art gallery as proposed by Pallud and Straub [3]. The following hypotheses are therefore proposed:
Hypothesis 2a (H2a).
Attitudes toward a wearable AR have a positive effect on intentions to use wearable AR.
Hypothesis 2b (H2b).
Attitudes toward a wearable AR have a positive effect on intentions to visit a physical art gallery.

3.2.3. Time Resources as a Facilitating Conditions

Facilitating conditions can be conceptualized as substitutes for perceived behavioral control since they are conceptually similar [60]. In our study, time resources (time availability) are defined as the extent to which visitors have enough time to use AR services in an art gallery in the future, and were used to examine the influence of time resources on the intention to use wearable AR as well as the intention to visit the art gallery.
According to Parasuraman (2000), people tend to avoid using new technologies because of the time it takes to learn them. Since wearable AR users are obliged to engage in the time-consuming process of connecting to the Internet to download the data [61], a non-trivial amount of time is required in order to use wearable AR. Furthermore, previous studies have found that time availability is one of the key factors that influences behavior in cultural settings [3,62]. A study by Martin [62] showed that insufficient time was the primary reason for the British public not visiting museums. More recent research by Pallud and Straub [3] showed that time resources played a significant role in determining visitors’ intention to visit museums and revisit museum websites. Accordingly, we propose the following hypotheses:
Hypothesis 3a (H3a).
Time resources have a positive effect on intention to use wearable AR.
Hypothesis 3b (H3b).
Time resources have a positive effect on intention to visit a physical art gallery.

3.2.4. Subjective Norm

Subjective norms are important variables that influence behavioral intentions, and according to Ajzen [13], subjective norms reflect the perceived opinions of the most respected family and friends. In this study, a subjective norm is defined as the perception that most people who are important to him or her think he or she should use wearable AR services in the art gallery [63]. Subjective norms have been found to influence technology acceptance, especially in the early stage of individual experiences with IS [64]. In addition, in the museum context, subjective norms are a key variable that accounts for behavioral intention to use technology and also to visit physical museums and art galleries. Previous studies have also found that the intention to use an information system is determined by subjective influence [65,66,67,68]. Therefore, we propose the following hypotheses:
Hypothesis 4a (H4a).
Subjective norms have a positive effect on the intention to use wearable AR.
Hypothesis 4b (H4b).
Subjective norms have a positive effect on intention to visit a physical art gallery.

3.2.5. Belief about Wearable of AR

Positive evaluations of online platforms (e.g., museum websites) have been found to positively affect attitudes toward museums [3]. To assess beliefs about wearable AR, we relied on the conceptualization of AR characteristics developed by Chung et al. [4] and Jung et al. [9]. The three dimensions of wearable AR evaluation are usability, enjoyment, and aesthetics. Our definition of wearable AR usability was adopted from previous studies on ease of use. Perceived ease of use is the degree to which a person trusts that the use of a specific technology will be effortless [4]. Perceived ease of use is a basic construct in the technology acceptance model and has a significant effect on attitudes towards using technology, which in turn affect behavioral intentions to use technology [69]. The definition of wearable AR enjoyment specifies the extent to which enjoyment can be derived from using the wearable AR application. Past research has considered perceived ease of use in relation to the enjoyment of interacting with computer systems and to the experience during computer interaction. As wearable AR applications are the natural habitat of hedonic systems, we can expect wearable AR enjoyment to play an important role in influencing attitudes toward wearable AR.
Wearable AR aesthetics is similar to the visual appeal of AR [4]. Visual appeal pertains to the display of fonts and other visual elements such as graphics; it enhances the presentation of information systems [70]. Visual attractiveness appeared to be a dominant factor in tourism experiential outcomes. Previous research ascertained that wearable AR systems reinforce the user’s view of the real world and that a user’s familiarity with wearable AR applications affect attitudes towards wearable AR applications [4,9,37,38,39,43]. Therefore, we propose the following hypotheses:
Hypothesis 5 (H5).
Beliefs about wearable AR have a positive effect on attitudes toward wearable AR.

4. Methods

4.1. Study Site

This study was conducted as part of the wearable AR project at an art gallery in the United Kingdom. The gallery is one of the country’s finest art museums and houses fine and decorative art works, which have been designated as being of national importance. The gallery is renowned for its 19th-century British paintings and attracts more than half a million visitors each year. The purpose of the project was to enhance visitors’ experience in the art gallery through the provision of additional information about paintings using wearable devices.
The wearable AR application developed for the art gallery consisted of information about each artist, their paintings, related paintings, and location and sharing functions. The application included basic text information (Figure 3) and provided the additional functionality of reading further information aloud.

4.2. Measurements

Since measurement items were adopted from previous research [3,71,72,73] and one of them that has been found to decrease reliability and validity was excluded, the number of items is one less than that in previous research. All items were measured on a seven-point Likert scale from strongly disagree (1) to strongly agree (7), except for attitudes toward AR, in which 7 was “pleasant,” “enjoyable,” “good”, and “valuable,” and 1 was “unpleasant,” “unenjoyable,” “bad,” and “worthless.” This procedure yields 35 measurement items. Usability (five items), enjoyment (three items), aesthetics (four items), attitudes toward wearable AR (four items), time resources (four items), subjective norms (four items), intention to use wearable AR (three items), and intention to visit physical Art Gallery (four items).
As stated above, beliefs about wearable AR and time resources and the subjective norms were measured as second-order constructs. To be more specific, beliefs about wearable AR evaluation are formative scales since usability, enjoyment, and aesthetic sensibilities about wearable AR are assumed to influence wearable AR evaluation. Conversely, subjective norms and time resources are reflective scales, as subjective norms were considered to be influenced by subjective norms about both wearable AR and physical art galleries, and overall time resources are presumably a product of time resources for using wearable AR and for visiting a physical art gallery.

4.3. Data Collection

The data were collected at a modern art gallery in Manchester. The art gallery is famous for 19th century British paintings, and each year, it attracts more than 730,000 visitors, which makes it the most visited museum or gallery in Manchester (Manchester City Council, 2019).
A total of 211 participants was recruited by systematic random sampling. The first participant was chosen at random, and after that, every 10th visitor was approached. Systematic random sampling is considered more reliable and accurate than random sampling [74]. Researchers approached every 10th gallery visitor at the entrance to the art gallery and asked if he or she would participate in the study. Those who agreed were asked to try the wearable AR application for about 30 min and then complete the questionnaire. The operation and application of the device were explained prior to the experiment so that the participants could familiarize themselves with it. After excluding inappropriate responses such as missing values and unreliable responses, we had a sample of 196 participants.
When using PLS, the sample size is required to be greater than 10 times the number of items in the most complex variables [74], which is 5 in this study (usability). Therefore, this study needed to obtain a sample of greater than 50 valid responses, and the requirement was satisfied.

4.4. Respondents’ Profile

We summarize the characteristics of the respondents in Table 1. Of all of the respondents, 101 (51.5%) are female, and 95 (48.5%) are male; more than half are between 18 and 34 (107, 54.6%) and highly educated (more than a bachelor’s degree) (128, 65.3%). About one-quarter (26.5%) of respondents have an annual income of less than £20,000.

5. Analysis and Results

5.1. Measurement Model

The research model was tested by using structural equation modeling. Before structural equation modeling was undertaken, confirmatory factor analysis was conducted to validate our measurement model. Content, discriminant and convergent validity were examined by using Smart PLS. First, since we consulted previous literature to create measurement items, the content validity of our survey had already been established by other researchers. Second, we conducted factor analysis, and the results showed that 10 factors were classified. After excluding an item that reduces reliability and validity, all factor loadings were higher than the 0.5 cut-off and were statistically significant (Table 2). Third, we calculated composite reliability (C.R), Cronbach’s α, and average variance extracted (AVE) in order to establish reliability and convergent validity [75]. As shown in Table 2, C.R and Cronbach’s α were found to be greater than 0.7, and AVE was found to be greater than 0.5; thus, the analysis indicated that all of the constructs satisfied the requirements.
Finally, we calculated the square root of the AVE in order to establish discriminant validity (Table 3). According to Fornell and Larcker’s [75] criteria, the square root of AVE associated with a specific construct must exceed its correlation with other constructs. As shown in Table 3, the square root of AVE of each construct is greater than its correlation with other constructs; thus, the discriminant validity of our survey was established. Furthermore, skewness and kurtosis of constructs were calculated to confirm their normality [76]. The absolute value of skewness is recommended to be less than 3; that of kurtosis is recommended to be less than 10. As shown in Table 3, skewness values ranged from −1.289 to −0.492, exhibiting a positively skewed distribution. Kurtosis values ranged from −0.203 to 2.566. Therefore, the items of the present study were normally distributed.

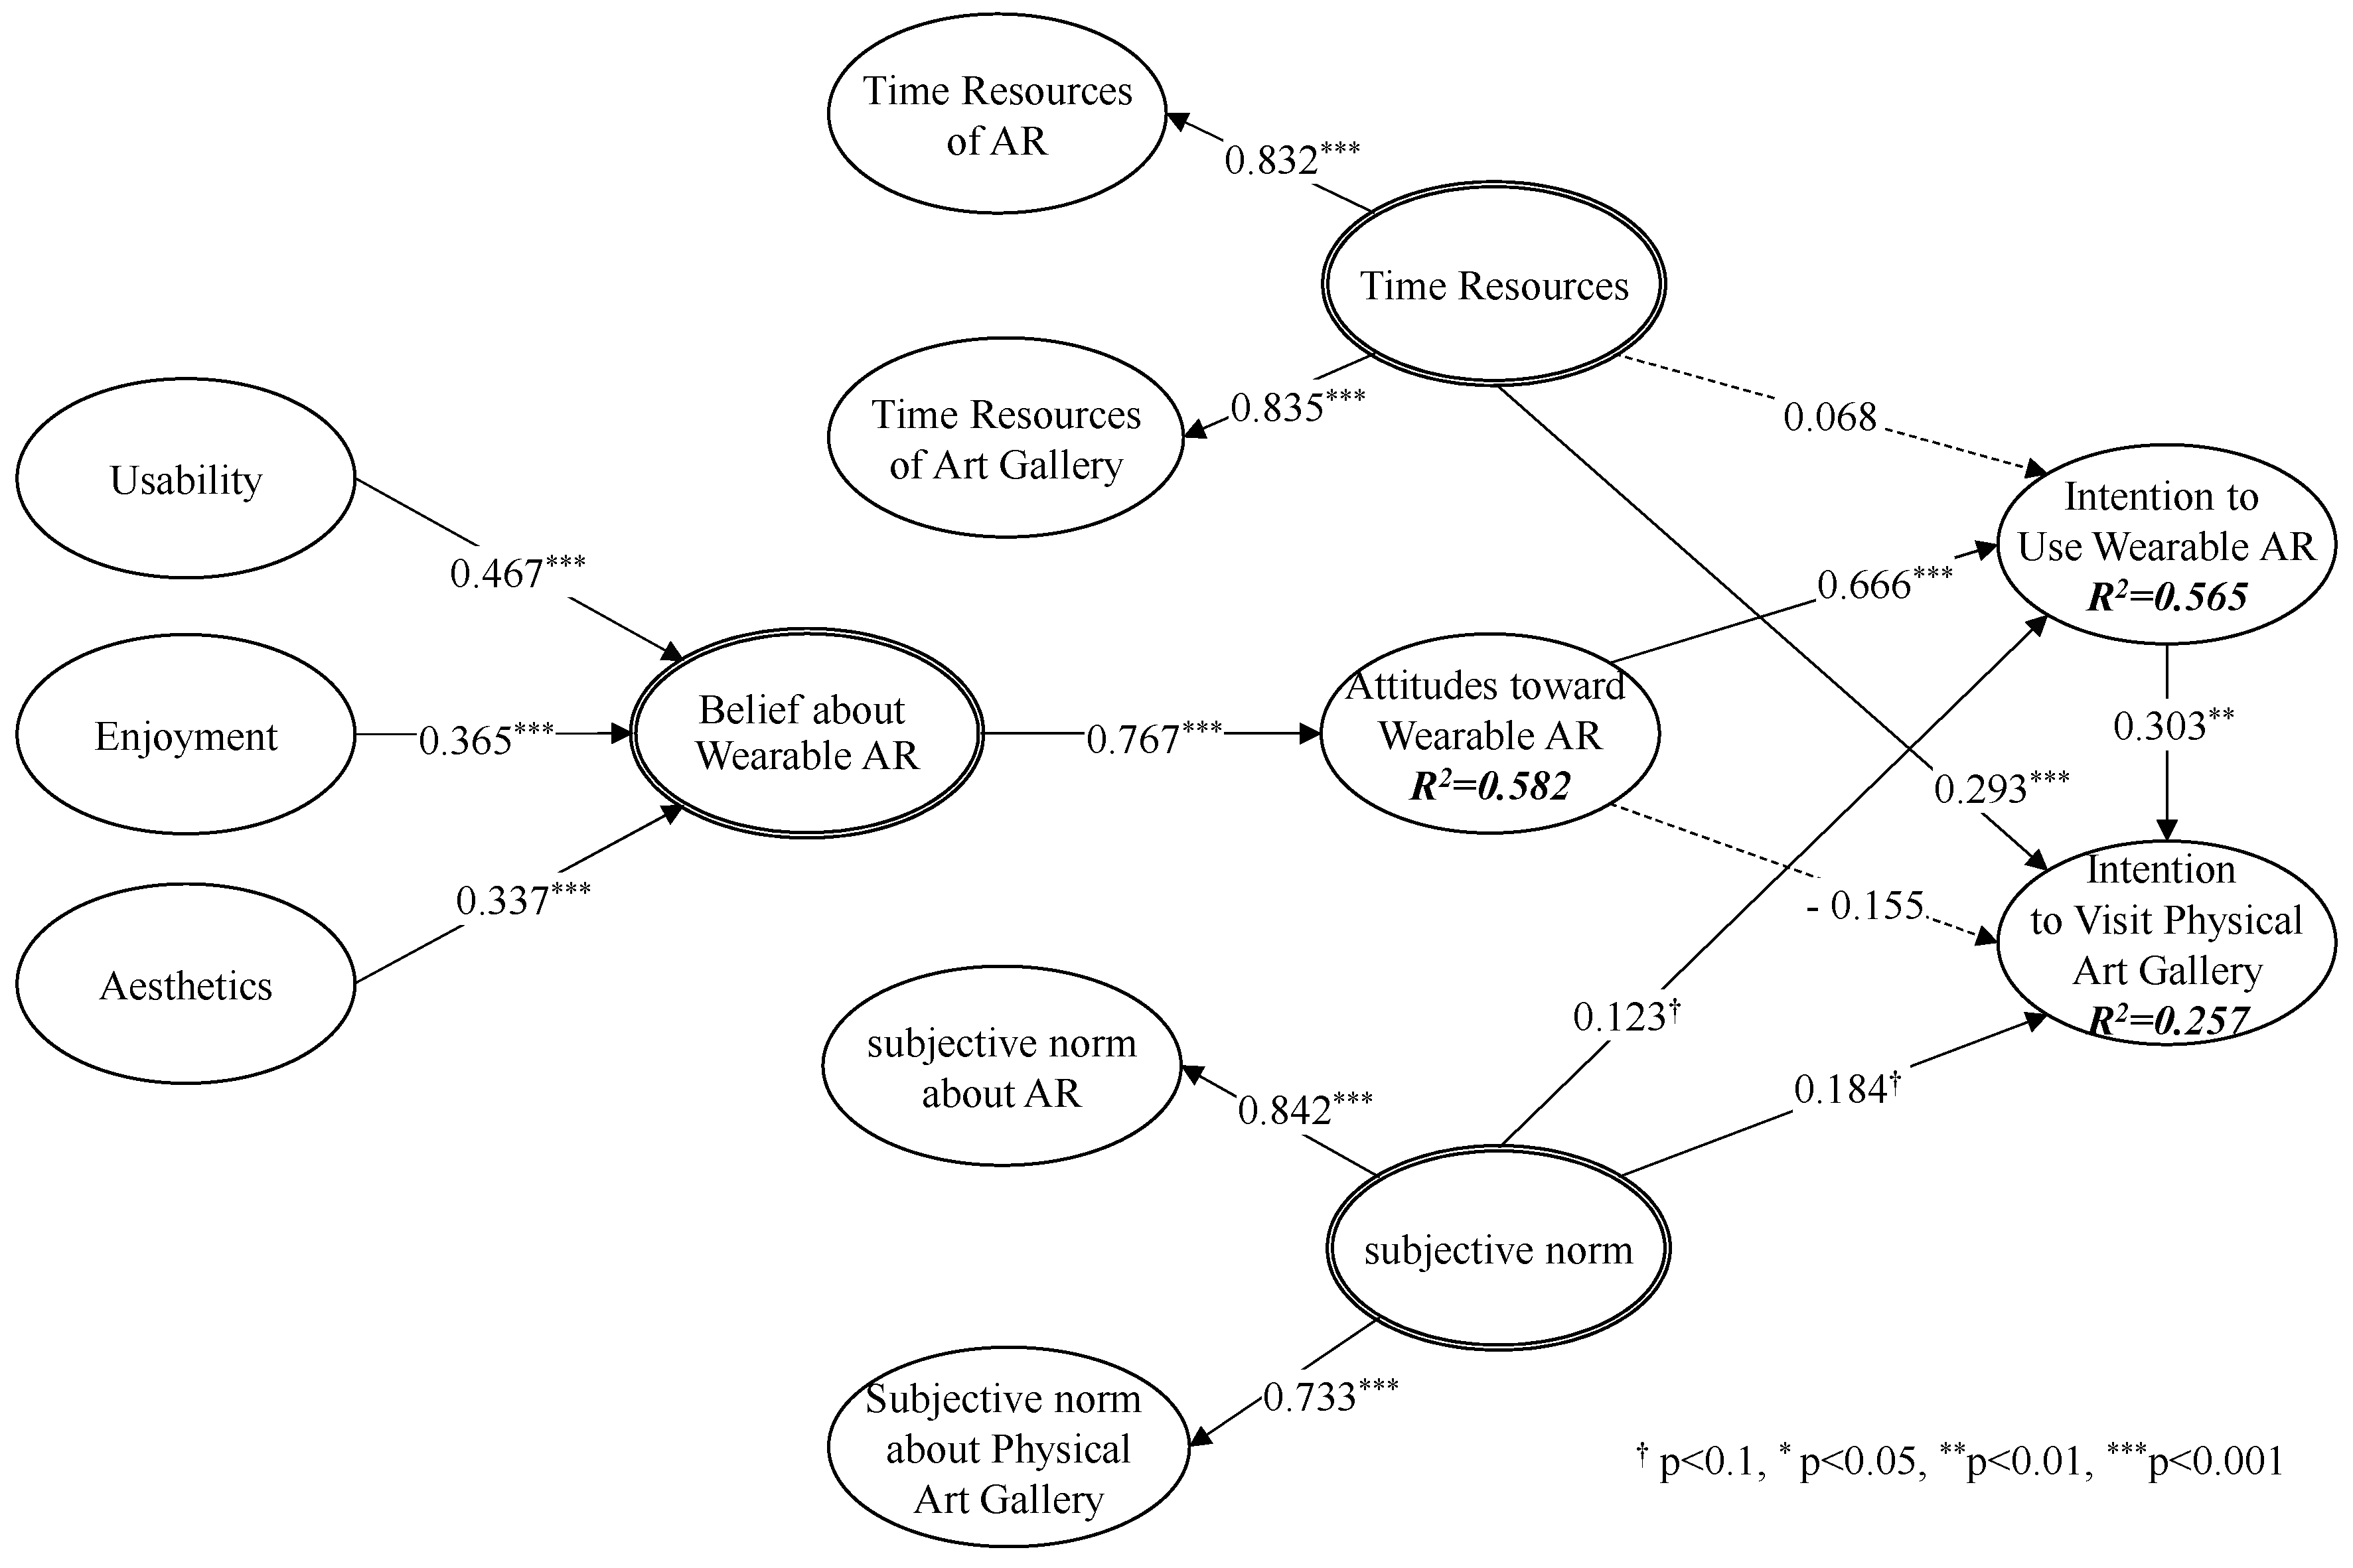
5.2. Structural Model

A structural equation model was conducted to test the proposed model. The size of the bootstrapping sample used in the PLS analyses was 5000, as suggested by Hair et al. [77]. The outcome of the structural model and results of the hypothesis tests are displayed in Figure 4 and Table 4. Hypothesis 1, which postulates that intention to use wearable AR has a positive effect on the intention to visit art gallery, was supported (β = 0.272, t = 2.395). Thus, it can be assumed that wearable AR plays an important role in interactive services.
Additionally, Hypotheses 2a and 2b postulate a positive relationship between attitudes toward AR and the intention to use AR and the intention to visit art gallery, respectively. While Hypothesis 2a was supported, as attitudes toward AR had a positive relationship with the intention to use AR (β = 0.666, t = 10.800, p < 0.001), Hypothesis 2b was not supported (β = −0.067, t = 1.352, p = n.s). Therefore, attitudes toward wearable AR were found to only affect intentions to visit the physical art gallery through the intention to use wearable AR.
Hypotheses 3a and 3b postulate a positive relationship between time resources and intention to use wearable AR and intention to visit art gallery, respectively. Although Hypothesis 3a was not supported (β = 0.068, t = 1.365, p = n.s), Hypothesis 3b was supported: Time resources are positively related to intention to visit the art gallery (β = 0.326, t = 3.563, p < 0.001). Therefore, it can be assumed that having enough time to enjoy wearable AR and visit an art gallery may elicit the intention to visit physical art gallery.
Hypotheses 4a and 4b postulate that subjective norms have a positive effect on intention to use wearable AR and intention to visit the art gallery, respectively. Supporting these hypotheses, subjective norms were found to have a positive influence on intention to use wearable AR (β = 0.124, t = 1.713, p < 0.1), and intention to visit a physical art gallery (β = 0.163, t = 2.252, p < 0.05). Thus, subjective norms can be regarded as an important predictor of both intention to use AR and intention to visit an art gallery.
Finally, Hypothesis 5 postulates that AR evaluation has a positive effect on attitudes toward wearable AR. Beliefs about wearable AR were found to have a significant positive effect on attitudes toward AR (β = 0.763, t = 22.795, p < 0.001); thus, Hypothesis 5 was supported. First-order variables (usability, enjoyment, and aesthetics), which were regarded as formative measurements of wearable AR evaluation, were also found to influence beliefs about wearable AR.

6. Discussion and Conclusions

6.1. Discussion

The aim of this study was to examine the causal relationships between visitors’ beliefs about AR (usability, enjoyment, and aesthetics) and their attitudes toward wearable AR, and the impact of attitudes toward wearable AR, time resources, and subjective norms on the intention to use wearable AR and the intention to revisit the physical art gallery. The results indicate that usability, enjoyment, and aesthetics were important variables that influence user experience of wearable AR. These findings are consistent with previous research, confirming the effects of usability, enjoyment, and aesthetics on user experiences [3]. This study found that usability had a slightly stronger effect on user experience than enjoyment and aesthetics. This indicates that within the wearable AR environment, users are more concerned with usability, which can be linked to the relative novelty factor of using smartglasses.
The study revealed that attitudes positively influenced intentions to use wearable AR; however, they did not influence intentions to visit the art gallery. It was also found that there is a direct relationship between intention to use wearable AR and intention to visit the art gallery, and therefore, intentions to visit the art gallery seem to be mediated by intentions to use wearable AR. This finding indicates that art gallery visitors who had a good wearable AR experience developed a stronger interest in the art gallery’s objects and subsequently had a stronger desire to revisit in the future. This finding implies that well-designed wearable AR applications could induce visitors to use wearable AR and arouse their interest in visiting the physical art gallery. Furthermore, these findings support previous research by confirming the effects of visual interfaces on physical museum visits [3] and show that the use of wearable AR is linked to the intention to revisit the physical art gallery.
Time resources (facilitating conditions) are external circumstances that constrain or facilitate individuals’ actions [78]; the present study confirmed that time resources played a key role in determining an individual’s intentions to visit an art gallery. In previous studies, a good understanding of the Internet and inexpensive Internet access were used as facilitating conditions whilst help, specialized instructions, training, legal protections, and corporate policies to assess were utilized as facilitating conditions for mobile Internet [67]. More recently, Pallud and Straub [3] examined other facilitating conditions such as cultural background/experience and time availability which constrain a museum visitor’s behavior.
Our findings revealed that although time resources played an important role in determining individuals’ intentions to visit a physical art gallery, they did not influence intentions to use wearable AR. This finding indicates that individuals who have more free time will be able to make a physical visit to an art gallery, as this can be considered a leisure activity. However, even though they have more time resources (leisure time), individuals may not be able to use wearable AR simply because smartglasses are not easily available to the public and, therefore, this may be a key constraining factor on intention to use wearable AR.
The present study also showed that subjective norms are an additional predictor of intentions to visit the art gallery. According to previous research [79], subjective norms affect high culture practices, and in this study, a visit to an art gallery was considered a social activity. Our findings revealed that subjective norms played a significant role in determining an individual’s intentions to use wearable AR and also his or her intentions to visit an art gallery in person. This supports previous research on AR smartglasses by Rauschnabel [44], who found that social needs are an important determinant of adoption.

6.2. Theoretical and Practical Implications

This study has numerous theoretical and practical implications. One of the key theoretical contributions of this study is to apply and extend the TPB, focusing on wearable AR, in the tourism context. The TPB has been researched extensively in several contexts, including the tourism industry [16]; however, a focus on wearable AR is a new contribution to the field. Another contribution is the implementation of interactive factors (wearable AR and physical art gallery) within the constructs of subjective norms, time resources, and intention to use into the TPB. Using this approach, we assessed how a new and innovative technology not only influences the future behavior of using this technology but also actual visitation behavior, as this can be considered an important determinant of technology success. In addition, according to Dieck and Jung [37], further research is needed in the area of wearable AR adoption, and the present study contributed to the literature by confirming the influence of technology adoption factors on behavioral intentions to use wearable AR. Furthermore, the present study added another dimension to existing adoption research by exploring the effect of technology on the actual visit intention. Finally, another contribution of this study is that it extended the research of Pallud and Straub [3], who investigated the model in the museum context focusing on websites through the investigation of wearable AR using TPB.
In practical terms, the findings of the present study add to museum and art gallery managers’ knowledge of visitors’ perceptions and behavioral intentions with regards to wearable AR applications. This will lead gallery managers to be more likely to make an investment in IT in the future in order to enhance visitor experience. Our findings have important implications for the future implementation of this new and innovative technology from the management perspective. For visitors to form a favorable attitude toward and intention to use wearable AR and consequently physically visit an art gallery, wearable AR developers should ensure that the application is easy to use with well-integrated functions, and that it offers an enjoyable and interesting experience and has a creative layout. In addition, our findings show that a good experience with wearable AR applications contributes to the intention to revisit the art gallery. Therefore, if art gallery managers want to use a wearable AR application to attract more visitors, they should consider creating more user-friendly and aesthetic interfaces with entertaining and enjoyable content, which could encourage positive attitudes toward using and actual use of wearable AR applications as well as increased likelihood of visiting the art gallery in person.

6.3. Limitations and Future Research Directions

The present study has some limitations. First, a larger sample than 196 would have enhanced the possibility of generalizing the findings to a wider population. However, for the present study, PLS overcomes this limitation, as it requires a smaller sample size to generate reliable results. Second, the study was conducted in a single art gallery in the UK. Therefore, findings may be particularly applicable to the UK art gallery sector, and future research should be conducted in other cultural settings for comparative purposes. Third, in terms of the construct of facilitating conditions in the TPB, the present study solely investigated time resources, and other facilitating conditions should be included to account for the full spectrum of this construct. In addition, the present study investigated wearable AR using the approach of interactive services. However, research investigating the link between virtual or mixed reality, a combination of both augmented and virtual reality, and museums and art galleries is scarce. Therefore, future research could concentrate on virtual or mixed reality in the context of museums and art galleries.

Author Contributions

T.J. supervision, M.C.T.D. writing original draft, H.L. writing original draft and N.C. writing–review and editing. All authors have read and agreed to the published version of the manuscript.

Funding

This work was supported by the Ministry of Education of the Republic of Korea and the National Research Foundation of Korea (NRF-2019S1A3A2098438).

Conflicts of Interest

The authors declare no conflict of interest.

References

  1. Rauschnabel, P.A.; Rossmann, A.; tom Dieck, M.C. An adoption framework for mobile augmented reality games: The case of Pokémon Go. Comput. Hum. Behav. 2017, 76, 276–286. [Google Scholar] [CrossRef] [Green Version]
  2. TechCrunch, Why Online2Offline Commerce is a Trillion Dollar Opportunity. Available online: https://techcrunch.com/2010/08/07/why-online2offline-commerce-is-a-trillion-dollar-opportunity/ (accessed on 17 October 2020).
  3. Pallud, J.; Straub, D.W. Effective website design for experience-influenced environments: The case of high culture museums. Inf. Manag. 2014, 51, 359–373. [Google Scholar] [CrossRef]
  4. Bekele, M.K.; Pierdicca, R.; Frontoni, E.; Malinverni, E.S.; Gain, J. A survey of augmented, virtual, and mixed reality for cultural heritage. J. Comput. Cul. Herit. 2018, 11, 1–36. [Google Scholar] [CrossRef]
  5. Guerra, J.P.; Pinto, M.M.; Beato, C. Virtual reality shows a new vision for tourism and heritage. Eur. Sci. J. 2015, 11, 45–54. [Google Scholar]
  6. Chung, N.; Lee, H.; Kim, J.Y.; Koo, C. The Role of Augmented Reality for Experience-Influenced Environments: The Case of Cultural Heritage Tourism in Korea. J. Travel Res. 2017. [Google Scholar] [CrossRef]
  7. Han, D.; Jung, T.; tom Dieck, M.C. Exploring visitors’ Augmented Reality Smart Glasses (ARSG) Adoption in the Cultural Tourism Context. Leis. Stud. 2019, 38, 618–633. [Google Scholar] [CrossRef]
  8. Jung, T.; Chung, N.; Leue, M.C. The determinants of recommendations to use augmented reality technologies: The case of a Korean theme park. Tour. Manag. 2015, 49, 75–86. [Google Scholar] [CrossRef]
  9. Jung, T.; tom Dieck, M.C. Augmented Reality, Virtual Reality and 3D Printing for the Co-Creation of Value for the Visitor Experience at Cultural Heritage Places. J. Place Manag. Dev. 2017, 10, 140–151. [Google Scholar] [CrossRef]
  10. Bilgihan, A.; Nusair, K.; Okumus, F.; Cobanoglu, C. Applying flow theory to booking experiences: An integrated model in an online service context. Inf. Manag. 2015, 52, 668–678. [Google Scholar] [CrossRef]
  11. Olya, H.; Jung, T.; tom Dieck, M.C.; Ryu, K. Engaging Visitors of Science Festivals Using Augmented Reality: Asymmetrical Modelling. Int. J. Contemp. Hosp. Manag. 2020, 32, 769–796. [Google Scholar] [CrossRef]
  12. Ajzen, I. From intentions to actions: A theory of planned behavior. In Action-Control: From Cognition to Behavior; Kuhl, J., Beckman, J., Eds.; Springer: Berlin/Heidelberg, Germany, 1985; pp. 11–39. [Google Scholar]
  13. Sparks, B. Planning a wine tourism vacation? Factors that help to predict tourist behavioural intentions. Tour. Manag. 2007, 28, 1180–1192. [Google Scholar] [CrossRef] [Green Version]
  14. Han, H.; Hsu, L.; Sheu, C. Application of the Theory of Planned Behavior to Green Hotel Choice: Testing the Effect of Environmental Friendly Activities. Tour. Manag. 2010, 31, 325–334. [Google Scholar] [CrossRef]
  15. Quintal, V.A.; Lee, J.A.; Soutar, G.N. Risk, uncertainty and the theory of planned behavior: A tourism example. Tour. Manag. 2010, 31, 797–805. [Google Scholar] [CrossRef]
  16. Reza Jalilvand, M.; Samiei, N. The impact of electronic word of mouth on a tourism destination choice: Testing the theory of planned behavior (TPB). Internet Res. 2012, 22, 591–612. [Google Scholar] [CrossRef]
  17. Wang, J.; Ritchie, B. Understanding accommodation managers’ crisis planning intention: An application of the theory of planned behaviour. Tour. Manag. 2012, 33, 1057–1067. [Google Scholar] [CrossRef]
  18. Huh, H.J.; Kim, T.T.; Law, R. A comparison of competing theoretical models for understanding acceptance behavior of information systems in upscale hotels. Int. J. Hosp. Manag. 2009, 28, 121–134. [Google Scholar] [CrossRef]
  19. Casaló, L.; Flavián, C.; Guinalíu, M. Determinants of the intention to participate in firm-hosted online travel communities and effects on consumer behavioral intentions. Tour. Manag. 2010, 31, 898–911. [Google Scholar] [CrossRef]
  20. Kim, D.; Park, J.; Morrison, A. A model of traveller acceptance of mobile technology. Int. J. Tour. Res. 2008, 10, 393–407. [Google Scholar] [CrossRef]
  21. Kim, T.; Lee, J.; Law, R. An empirical examination of the acceptance behaviour of hotel front office systems: An extended technology acceptance model. Tour. Manag. 2008, 29, 500–513. [Google Scholar] [CrossRef]
  22. Martín, H.; Herrero, Á. Influence of the user’s psychological factors on the online purchase intention in rural tourism: Integrating innovativeness to the UTAUT framework. Tour. Manag. 2012, 33, 341–350. [Google Scholar] [CrossRef]
  23. Filepp, R.; Gordon, M.L.; Bidwell, A.W.; Young, F.C.; Wolf, A.M.; Meo, S.; Abrahams, L. U.S. Patent 5,347,632, 24 October 1994.
  24. Goulding, C. The museum environment and the visitor experience. Eur. J. Mark. 2000, 34, 261–278. [Google Scholar] [CrossRef]
  25. Sheng, C.W.; Chen, M.C. A study of experience expectations of museum visitors. Tour. Manag. 2012, 33, 53–60. [Google Scholar] [CrossRef]
  26. Wakkary, R.; Hatala, M. Situated play in a tangible interface and adaptive audio museum guide. Pers. Ubiquitous Comput. 2007, 11, 171–191. [Google Scholar] [CrossRef] [Green Version]
  27. Kim, J.; Ahn, K.; Chung, N. Examining the Factors Affecting Perceived Enjoyment and Usage Intention of Ubiquitous Tour Information Services: A Service Quality Perspective. Asia Pac. J. Tour. Res. 2013, 18, 598–617. [Google Scholar] [CrossRef]
  28. Wang, Y.; Stash, N.; Sambeek, R.; Schuurmans, Y.; Aroyo, L.; Schreiber, G.; Gorgels, P. Cultivating personalized museum tours online and on-site. Interdiscip. Sci. Rev. 2009, 34, 139–153. [Google Scholar] [CrossRef] [Green Version]
  29. Kim, J.Y.; Chung, N.; Ahn, K.M. The impact of mobile tour information services on destination travel intention. Inf. Dev. 2017. [Google Scholar] [CrossRef]
  30. Lee, H.; Chung, N.; Koo, C. Moderating Effects of Distrust and Social Influence on Aesthetic Experience of Augmented Reality: Motivation-Opportunity-Ability Model Perspective. In Proceedings of the 17th International Conference on Electronic Commerce, Soul, Korea, 3–5 August 2015; p. 22. [Google Scholar]
  31. Mason, M. The Dimensions of the Mobile Visitor Experience: Thinking beyond the Technology Design. Int. J. Incl. Mus. 2012, 5, 51–72. [Google Scholar] [CrossRef]
  32. Farag, S.; Schwanen, T.; Dijst, M.; Faber, J. Shopping online and/or in-store? A structural equation model of the relationships between e-shopping and in-store shopping. Transp. Res. Part A Policy Pract. 2007, 41, 125–141. [Google Scholar] [CrossRef] [Green Version]
  33. Jung, T.; Lee, H.; Chung, N.; tom Dieck, M.C. Cross-Cultural Differences in Accepting Mobile Augmented Reality. Int. J. Contemp. Hosp. Manag. 2018, 30, 1621–1645. [Google Scholar] [CrossRef]
  34. Bae, S.; Jung, T.H.; Moorhouse, N.; Suh, M.; Kwon, O. The Influence of Mixed Reality on Satisfaction and Brand Loyalty in Cultural Heritage Attractions: A Brand Equity Perspective. Sustainability 2020, 12, 2956. [Google Scholar] [CrossRef] [Green Version]
  35. Jung, T.; tom Dieck, M.C.; Lee, H.; Chung, N. Moderating Role of Long-Term Orientation on Augmented Reality Adoption. Int. J. Hum. Comput. Interact. 2020, 36, 239–250. [Google Scholar] [CrossRef]
  36. Tom Dieck, M.C.; Jung, T. A theoretical model of mobile augmented reality acceptance in urban heritage tourism. Curr. Issues Tour. 2018, 21, 154–174. [Google Scholar] [CrossRef]
  37. Tom Dieck, M.C.; Jung, T.; tom Dieck, D. Enhancing Art Gallery Visitors’ Learning Experience Using Wearable Augmented Reality: Generic Learning Outcomes Perspective. Curr. Issues Tour. 2018, 21, 2014–2034. [Google Scholar] [CrossRef]
  38. Tom Dieck, M.C.; Jung, T.; Rauschnabel, P. Determining Visitor Engagement through Augmented Reality at Science Festivals: An Experience Economy Perspective. Comput. Hum. Behav. 2018, 82, 44–53. [Google Scholar] [CrossRef]
  39. Kalantari, M. Consumers’ Adoption of Wearable Technologies: Literature Review, Synthesis, and Future Research Agenda. Int. J. Technol. Mark. 2017, 3, 274–307. [Google Scholar] [CrossRef]
  40. Leue, M.C.; tom Dieck, D.; Jung, T. A theoretical model of augmented reality acceptance. eRev. Tour. Res. 2014, 5, 1–5. [Google Scholar]
  41. Yovcheva, Z.; Buhalis, D.; Gatzidis, C. Engineering Augmented Tourism Experiences. In Information and Communication Technologies in Tourism; Cantoni, L., Xiang, Z., Eds.; Springer: Berlin/Heidelberg, Germany, 2013; pp. 24–36. [Google Scholar]
  42. Tussyadiah, I.; Jung, T.; tom Dieck, M.C. Embodiment of Wearable Augmented Reality Technology in Tourism Experiences. J. Travel Res. 2018, 57, 597–611. [Google Scholar] [CrossRef] [Green Version]
  43. Rauschnabel, P.A. Virtually enhancing the real world with holograms: An exploration of expected gratifications of using augmented reality smart glasses. Psychol. Mark. 2018, 35, 557–572. [Google Scholar] [CrossRef]
  44. Fishbein, M.; Ajzen, I. Belief, Attitude, Intention, and Behaviour: An Introduction to Theory and Research. Reading; Addison-Wesley: Boston, MA, USA, 1975. [Google Scholar]
  45. Madden, T.J.; Ellen, P.S.; Ajzen, I. A comparison of the theory of planned behavior and the theory of reasoned action. Pers. Soc. Psychol. Bull. 1992, 18, 3–9. [Google Scholar] [CrossRef]
  46. Ajzen, I. Perceived behavioral control, self-efficacy, locus of control, and the theory of planned behavior. J. Appl. Soc. Psychol. 2002, 32, 665–683. [Google Scholar] [CrossRef]
  47. Ajzen, I. The theory of planned behavior. Organ. Behav. Hum. Decis. Process. 1991, 50, 179–211. [Google Scholar] [CrossRef]
  48. Jackson, E.; Quaddus, M.; Islam, N.; Stanton, J. Sociological Factors Affecting Agricultural Price Risk Management in Australia. Rural Sociol. 2009, 74, 546–572. [Google Scholar] [CrossRef]
  49. Bhattacherjee, A. Acceptance of e-commerce services: The case of electronic brokerages. IEEE Trans. Syst. Man Cybern. Part A Syst. Hum. 2000, 30, 411–420. [Google Scholar] [CrossRef] [Green Version]
  50. Leng, G.S.; Lada, S.; Muhammad, M.Z.; Ibrahim, A.A.H.A.; Amboala, T. An exploration of social networking sites (SNS) adoption in Malaysia using technology acceptance model (TAM), theory of planned behavior (TPB) and intrinsic motivation. J. Internet Bank. Commer. 2011, 16, 1–27. [Google Scholar]
  51. Teo, T.; Tan, L. The theory of planned behavior (TPB) and pre-service teachers’ technology acceptance: A validation study using structural equation modeling. J. Technol. Teach. Educ. 2012, 20, 89–104. [Google Scholar]
  52. Amaro, S.; Duarte, P. An integrative model of consumers’ intentions to purchase travel online. Tour. Manag. 2015, 46, 64–79. [Google Scholar] [CrossRef]
  53. Armitage, C.J.; Conner, M. Efficacy of the theory of planned behaviour: A meta-analytic review. Br. J. Soc. Psychol. 2001, 40, 471–499. [Google Scholar] [CrossRef] [Green Version]
  54. Hair, J.F.; Ringle, C.M.; Sarstedt, M. PLS-SEM: Indeed a silver bullet. J. Mark. Theory Pract. 2011, 19, 139–152. [Google Scholar] [CrossRef]
  55. Bhattacherjee, A. Understanding Information Systems Continuance: An Expectation-Confirmation Model. MIS Q. 2001, 25, 351–370. [Google Scholar] [CrossRef]
  56. Fritz, F.; Susperregui, A.; Linaza, M.T. Enhancing cultural tourism experiences with augmented reality technologies. In Proceedings of the 6th International Symposium on Virtual Reality, Archaeology and Cultural Heritage (VAST), Pisa, Italy, 8–11 November 2005. [Google Scholar]
  57. Davis, F.D. User acceptance of information technology: System characteristics, user perceptions and behavioral impacts. Int. J. Man Mach. Stud. 1993, 38, 475–487. [Google Scholar] [CrossRef] [Green Version]
  58. Cheng, S.; Lam, T.; Hsu, C.H. Negative word-of-mouth communication intention: An application of the theory of planned behavior. J. Hosp. Tour. Res. 2006, 30, 95–116. [Google Scholar] [CrossRef]
  59. Godin, G.; Valois, P.; Lepage, L. The pattern of influence of perceived behavioral control upon exercising behavior: An application of Ajzen’s theory of planned behavior. J. Behav. Med. 1993, 16, 81–102. [Google Scholar] [CrossRef] [PubMed]
  60. Lee, H.; Chung, N.; Jung, T. Examining the cultural differences in acceptance of mobile augmented reality: Comparison of South Korea and Ireland. In Information and Communication Technologies in Tourism; Springer International Publishing: Berlin/Heidelberg, Germany, 2015; pp. 477–491. [Google Scholar]
  61. Martin, A. The impact of free entry to museums. Cult. Trends 2002, 47, 3–11. [Google Scholar] [CrossRef]
  62. Ajzen, I.; Fishbein, M. Understanding Attitudes and Predicting Social Behavior; Prentice Hall: Englewood Cliffs, NJ, USA, 1980. [Google Scholar]
  63. Venkatesh, V.; Davis, F.D. A theoretical extension of the technology acceptance model: Four longitudinal field studies. Manag. Sci. 2000, 46, 186–204. [Google Scholar] [CrossRef] [Green Version]
  64. Abushanab, E.; Pearson, J. Internet banking in Jordan: The unified theory of acceptance and use of technology (UTAUT) perspective. J. Syst. Inf. Technol. 2007, 9, 78–97. [Google Scholar] [CrossRef]
  65. Eckhardt, A.; Laumer, S.; Weitzel, T. Who influences whom? Analyzing workplace referents’ social influence on its adoption and non-adoption. J. Inf. Technol. 2009, 24, 11–24. [Google Scholar] [CrossRef]
  66. Lu, Y.; Cao, Y.; Wang, B.; Yang, S. A study on factors that affect users’ behavioral intention to transfer usage from the offline to the online channel. Comput. Hum. Behav. 2011, 27, 355–364. [Google Scholar] [CrossRef]
  67. Wang, Y.; Wu, M.; Wang, H. Investigating the determinants and age and gender differences in the acceptance of mobile learning. Br. J. Educ. Technol. 2009, 40, 92–118. [Google Scholar] [CrossRef]
  68. Davis, F.D. Perceived usefulness, perceived ease of use, and user acceptance of information technology. MIS Q. 1989, 13, 319–340. [Google Scholar] [CrossRef] [Green Version]
  69. Liu, Y.; Li, H.; Hu, F. Website attributes in urging online impulse purchase: An empirical investigation on consumer perceptions. Decis. Support Syst. 2013, 55, 829–837. [Google Scholar] [CrossRef]
  70. Agarwal, R.; Venkatesh, V. Assessing a firm’s web presence: A heuristic evaluation procedure for the measurement of usability. Inf. Syst. Res. 2002, 13, 168–186. [Google Scholar] [CrossRef] [Green Version]
  71. Gilmore, J.; Pine, J. The Experience Economy: Work is Theatre and Every Business a Stage; Harvard Business Press: Brighton, MA, USA, 1999. [Google Scholar]
  72. Pavlou, P.A.; Fygenson, M. Understanding and predicting electronic commerce adoption: An extension of the theory of planned behavior. MIS Q. 2006, 30, 115–143. [Google Scholar] [CrossRef]
  73. Babbie, E. The Practice of Social Research; Cengage Learning: Boston, MA, USA, 2015. [Google Scholar]
  74. Fornell, C.; Larcker, D. Evaluating structural equation models with unobservable variables and measurement errors. J. Mark. Res. 1981, 18, 39–50. [Google Scholar] [CrossRef]
  75. Tabachnick, B.G.; Fidell, L.S. Multivariate analysis of variance and covariance. Using Multivar. Stat. 2007, 3, 402–407. [Google Scholar]
  76. Venkatesh, V.; Morris, M.G.; Davis, G.B.; Davis, F.D. User acceptance of information technology: Toward a unified view. MIS Q. 2003, 27, 425–478. [Google Scholar] [CrossRef] [Green Version]
  77. Hair, J.F.; Hult, G.T.M.; Ringle, C.; Sarstedt, M. A Primer on Partial Least Squares Structural Equation Modeling (PLS-SEM), 2nd ed.; Sage Publications: Thousand Oaks, CA, USA, 2017. [Google Scholar]
  78. Bourdieu, P.; Darbel, A. The Love of Art: European Art Museums and Their Public; Standford University Press: Palo Alto, CA, USA, 1990. [Google Scholar]
  79. Obeidy, W.K.; Arshad, H.; Huang, J.Y. An acceptance model for smart glasses based tourism augmented reality. In AIP Conference Proceedings; AIP Publishing LLC: College Park, MD, USA, 2017; Volume 1891, p. 020080. [Google Scholar]
Figure 1. Theory of planned behavior (Ajzen, 1985).
Sustainability 12 08628 g001
Figure 2. Research model.
Sustainability 12 08628 g002
Figure 3. Examples of wearable augmented reality (AR) experience and text information.
Sustainability 12 08628 g003
Figure 4. Results of PLS analysis.
Sustainability 12 08628 g004
Table 1. Sample description.
Profile CategoryN%
Gender
male10151.5
female9548.5
Age
18–245327.0
25–345427.6
35–442814.3
45–542814.3
55–64189.2
65+157.7
Education
High school2010.2
Some College3216.3
Associate Degree/Diploma168.2
Bachelor’s Degree6432.7
Master’s Degree4422.4
Doctoral Degree84.1
Professional Degree (e.g., JD, MD)126.1
Income
Less than £20,0005226.5
£20,000–£49,9994824.5
£50,000–£99,9995528.1
£100,000–£149,9992110.7
More than £150,000136.6
no response73.6
Total196100.0
Table 2. Reliability and cross-loadings.
ConstructLoadingt-ValueC.R 1α 2AVE 3
Belief about wearable
AR
UsabilityI think that I would like to use the Wearable AR application frequently.0.75914.6210.8880.8420.614
I thought the Wearable AR application was easy to use.0.82319.932
I found the various functions in the Wearable AR application were well integrated.0.83121.740
I would imagine that most people would learn to use the Wearable AR application very quickly.0.66810.386
I felt very confident using the Wearable AR application.0.82620.254
EnjoymentLooking at the paintings through Wearable AR application was enjoyable.0.91929.8110.9320.8900.821
Looking at the paintings through Wearable AR application was interesting.0.86227.104
Looking at the paintings through Wearable AR application was pleasant.0.93532.265
AestheticsI find that the design of the Wearable AR application looks pleasant.0.79915.0330.8780.8160.643
The layout of the Wearable AR application is fascinating.0.81415.018
I find the design of the Wearable AR application to be creative.0.84415.328
I find that the design of the Wearable AR application looks aesthetic.0.74811.615
Attitude toward wearable ARFor you, using the Wearable AR application of the art gallery within the next 30 days would be…
unpleasant (1)—pleasant (7)
0.91416.5100.9610.9460.862
Unenjoyable (1)—Enjoyable (7)0.95635.733
Bad (1)—Good (7)0.93140.186
Worthless (1)—Valuable (7)0.91142.579
Intention to use wearable ARAssuming I had access to the Wearable AR application of this art gallery, I intend to use it.0.98054.8140.9820.9720.947
Given that I had access to the Wearable AR application of this art gallery. I predict that I would use it.0.97758.102
It is likely that I will actually use to the Wearable AR application of this art gallery.0.96271.620
Intention to visit
physical art gallery
Given the opportunity, I intend to visit the physical art gallery.0.92417.9450.9590.9350.886
It is likely that I will actually visit the physical art gallery.--
I will visit the physical art gallery again after experiencing the Wearable AR application.0.95023.221
I will continue to visit the physical art gallery in the future after experiencing the Wearable AR application.0.94923.845
Subjective normARMost people who are important to me would use this Wearable AR application.0.94940.7840.9470.8890.900
Most people who are important to me would think that it is good idea to use this Wearable AR application.0.94856.579
GalleryMost people who are important to me would visit the physical art gallery.0.94837.5630.9450.8830.895
Most people who are important to me would think that it is a good idea to visit the physical art gallery.0.94580.328
Time
Resource
ARI expect to have the time needed to use this Wearable AR application within the next 30 days.0.95743.7350.9540.9030.912
I will make time for me to use this Wearable AR application within the next 30 days.0.95346.764
GalleryI expect to have the time needed to visit the physical art gallery within the next two months.0.96116.1760.9570.9110.918
There would always be time for me to visit the physical art gallery within the next two months.0.95515.295
1 Composite Reliability; 2 Cronbach’s α; 3 Average Variance Extracted.
Table 3. Correlation and discriminant validity.
ConstructsCorrelation of ConstructsMeanS.D (1)SkewnessKurtosis
(1)(2)(3)(4)(5)(6)(7)(8)
(1) Usability0.784 5.0961.093−0.6750.446
(2) Enjoyment0.5950.906 5.5411.279−1.2151.280
(3) Aesthetics0.6020.5770.802 5.2181.086−0.6120.494
(4) Attitudes toward wearable AR0.7050.6960.5300.928 5.2681.477−0.8100.239
(5) Intention to use wearable AR0.6860.2140.3050.2260.941 5.1601.625−0.904−0.013
(6) Intention to visit Art Gallery0.2940.6630.5420.7380.9730.973 5.5411.213−1.2122.208
(7) Subjective norm 0.4170.4220.4960.4460.4450.3540.750 4.7401.110−0.4920.614
(8) Time resource0.2480.1650.2250.2470.2780.4070.3570.7974.1211.428−0.109−0.203
Note: The Bold diagonal elements in the “correlation of constructs” matrix are the square root of the average variance extracted (AVE). For adequate discriminant validity, the diagonal elements should be greater than the corresponding off-diagonal elements. (1) Usability in the table.
Table 4. Standardized structural estimates and tests of the hypotheses.
HypothesesEstimatest-ValueResults
H1Intention to use wearable ARIntention visit Art Gallery0.3042.808supported
H2aAttitudes toward wearable ARIntention to use wearable AR0.66611.378supported
H2bAttitudes toward wearable ARIntention visit Art Gallery−0.1551.515Not supported
H3aTime resourceIntention to use wearable AR0.0681.429Not supported
H3bTime resourceIntention visit Art Gallery0.2933.530Supported
H4aSubjective normIntention to use wearable AR0.1231.737supported
H4bSubjective normIntention visit Art Gallery0.1841.768supported
H5AR evaluationAttitudes toward wearable AR0.76722.022supported
R2
Attitudes toward wearable AR0.582 (58.2%)
Intention to use wearable AR0.565 (56.5%)
Intention to visit Art Gallery0.257 (25.7%)
Publisher’s Note: MDPI stays neutral with regard to jurisdictional claims in published maps and institutional affiliations.

