Article

Evaluation and Factor Analysis of the Intensive Use of Urban Land Based on Technical Efficiency Measurement—A Case Study of 38 Districts and Counties in Chongqing, China

1
College of Resources and Environment, Southwest University, Chongqing 400715, China
2
School of Finance, Central University of Finance and Economics, Beijing 102206, China
*
Author to whom correspondence should be addressed.
Sustainability 2020, 12(20), 8623; https://doi.org/10.3390/su12208623
Submission received: 10 September 2020 / Revised: 14 October 2020 / Accepted: 15 October 2020 / Published: 18 October 2020

Abstract

:
Reasonable evaluation of the intensive urban land use has emerged as an important issue and hot topic for urban development. This paper aims to construct a unified framework for evaluating the intensive use of urban land and analyzing its influence channels. It combines the advantages of the approach of the indicator system and that of efficiency measurement, and provides an empirical test to apply this analytical framework using the panel data of 38 districts and counties in Chongqing, China, ranging from 2009 to 2018. To achieve our goals, we used the panel data model and stochastic frontier analysis (SFA) model with decomposed technical inefficiency. Our results show that: (1) the level of intensive use of urban land in all districts and counties of Chongqing is steadily increasing, and the gap among regions is narrowing, (2) all districts and counties of Chongqing face severe and increasing difficulty in improving their intensive urban land use, and, (3) currently, the degree of external dependence is not a stable influential factor for land-use efficiency and intensive potential in these districts and counties, and improving the land use structure, increasing population density, strengthening fiscal expenditure on education, and promoting transportation convenience can markedly reduce land use inefficiency and simultaneously increase intensive land use. In conclusion, the framework for evaluating intensive use of urban land based on the SFA model with decomposed technical inefficiency can better integrate intensive land-use evaluation and the factor analysis process, and retain the scalability of factor analysis. For all districts and counties in Chongqing, we clarify several effective channels to promote the intensive use of urban land, which provides reference and technical support for formulating land policies.

1. Introduction

To pursue a sustainable development has become a widespread consensus among global cities. The post-2015 United Nations sustainable development agenda clarifies the urban sustainable development as “to make cities and human settlements inclusive, safe, resilient and sustainable” [1], thus the sustainable development in cities involves in the coordination development of three key systems: economy, society, and environment [2]. As an essential element in production, Land resources underpin urban development. Empirical studies find that unreasonable urban sprawl is the important reason for the increasing of urban social and environmental costs, which definitely hinders the process of sustainable development [3,4]. Therefore, scientific and reliable intensive use of urban land can serve as the crucial principal to encounter the challenge and contradiction for sustainable urban development.
Unlike the developed and highly urbanized regions in Europe or North America, China is currently at a stage of rapid urbanization as the largest developing country worldwide, the booming economy and the massive migrants to the city have led cities to expand sharply their way outward. As a result, the use of land resources is also promptly growing in China. According to statistics from China’s Ministry of Natural Resources, China’s urban construction land area reached 395,700 km2 in 2017, an increase of 18.58% from 2009, and the urbanization rate increased from 48.34% to 58.52% during the same period. In recent years, however, unreasonable management of urban land has caused blind and excessive expansion during the process of urban development in China, triggering prevalent metropolitan problems such as conflicts between land supply and demand, excessive occupation of arable land and destruction of the ecological environment [5,6,7,8,9]. The intensive use of land resources has, therefore, gradually become the basic requirement of intensive growth of the urban economy and the fundamental way of building a resource-saving society. As the essential work of the intensive use of urban land, how to evaluate that of the urban land has naturally become a research focus and drawn continued attention of scholars.
It is crucial to grasp the content of the intensive use of land to evaluate that of the urban land reasonably. Some scholars have delved into the nature of the intensive use of urban land from the perspectives of resource input, land use pattern, and comprehensive benefits of land use [10], emphasizing that this form of intensive use is to improve the efficiency of land resource utilization by reasonably allocating input resources and optimizing the use of land resources against resource scarcity [10,11]. There is, though, an optimal level of this type of land use thanks to the diminishing marginal returns with the increase of input elements [12]. Existing literature shows that the content of evaluation on the intensive use of urban land includes two aspects, i.e., the level of and the potential for intensive land use. The latter measures the difference between the current level and the optimal level, under certain economic and technical conditions and to the requirements for urban planning, thus complementing the former [13]. As for evaluation approaches, scholars often use methods based on indicator systems, including multi-factor comprehensive evaluation [14,15,16,17,18], fuzzy evaluation [19,20], entropy weight [6,21], PSR (pressure—state—response) [22], PCA (principal component analysis) [23,24], artificial neural network [25,26], and multi-objective decision [27], to evaluate directly the level of and potential for the intensive use of urban land. Nevertheless, such methods are intrinsically restricted by the selection of relevant evaluation indicators as they are too subjective to be of remarkable practical guiding significance [13]. At the same time, the indicator systems for different research objects are highly heterogeneous and vary greatly because of the specific characteristics of the research objects, making it difficult to form a unified and widely applicable evaluation system [28]. On the other hand, more and more scholars have begun to pay attention to the inner link between the intensive use of urban land and the efficiency of land use, believing that promoting the former is also a process of improving the latter while the loss of the latter indicates the existence of excessive investment of resources and potential for the former. With the assistance of various efficiency measurement methods of urban land use, including technical efficiency measurement based on stochastic frontier analysis (SFA) [13,29,30], data envelopment analysis (DEA) [31,32,33,34,35], and total factor productivity (TFP) [36,37], scholars have not only conducted a more objective and rigorous quantitative evaluation of the level of and potential for the intensive use of urban land, but also provided empirical evidence for the interoperability between the evaluation and efficiency measurement of this form of land use. Subjective as it is, the index-system evaluation method, combined with urban development stages and planning goals, is still conducive to analyzing the driving factors of the intensive use of urban land from the economic, social, environmental, and policy aspects. The method thus contributes to clarifying the influence channels of the level of and potential for this type of land use. On the contrary, current literature on evaluating the intensive urban land use based on efficiency measurement only focuses on the objective measurement of its level and potential from the perspective of input and output, but does not involve investigations into the influence mechanism and channels, thus being flawed in the analysis process.
The SFA-based technical efficiency method has become hugely popular in efficiency measurement because it has the advantage of separating random disturbances from technical inefficiency, which conduces to better accuracy in technical inefficiency measurement [38]. Battese and Coelli [39] linearly expanded the “technical inefficiency” items in the SFA model [40] by adding the process of exploring possible variation channels of the items. This provides an opportunity for the efficiency measurement evaluation and influence factor analysis of the intensive urban land use at the same time. Nevertheless, the existing related research gives no attention to this perspective and there are also no corresponding empirical tests. As for the form, the non-input output factors affecting production activities directly put an effect on the technical efficiency of the urban land use through technical inefficiency items, which represents the level of urban land-use efficiency. In the meantime, this impact will also be passed on to the evaluation of the potential for the intensive urban land use through the measurement of technical efficiency loss. Hence the SFA-based technical efficiency model with the expansion of technical inefficiency items can unify the evaluation of the intensive urban land use and the analysis of relevant influence channels. In this way, it not only maintains the objectivity of the efficiency measurement method but also absorbs the advantages of the previous indicator system evaluation method in analyzing impact mechanisms, thus providing a more comprehensive analytical framework for evaluating the intensive urban land use. In addition, as for regional distribution, the existing literature mainly focuses more on the central and eastern cities and urban agglomerations of China, and less on western ones. Actually, there are stark disparities among these regions in such aspects as economic development, geographic location, spatial structure and ecological environment, and the corresponding evaluation and influence channels are bound to be different. Hence, the related research urgently needs to be enriched. At the same time, in terms of evaluation scale, the current research literature on the intensive urban land use in West China concentrates on two yardsticks, one at the extreme of regional space above the provincial level [41,42] and the other extreme, the microscopic urban functional zones [43], lacking literature on the in-between.
Based on the above two considerations, we used the panel data of 38 districts and counties in southwest China’s Chongqing to measure their level of and potential for the intensive use of urban land and explored possible influence channels on them, while empirically testing the more objective and unified analysis framework provided by the Battese and Coelli model [39]. The paper provides a more complete and clear way of understanding the evaluation process of the intensive urban land use, which facilitates the practice and management of the intensive urban land use and, to some extent, remedies the research limitations on regions and yardsticks.

2. Research Area and Methods
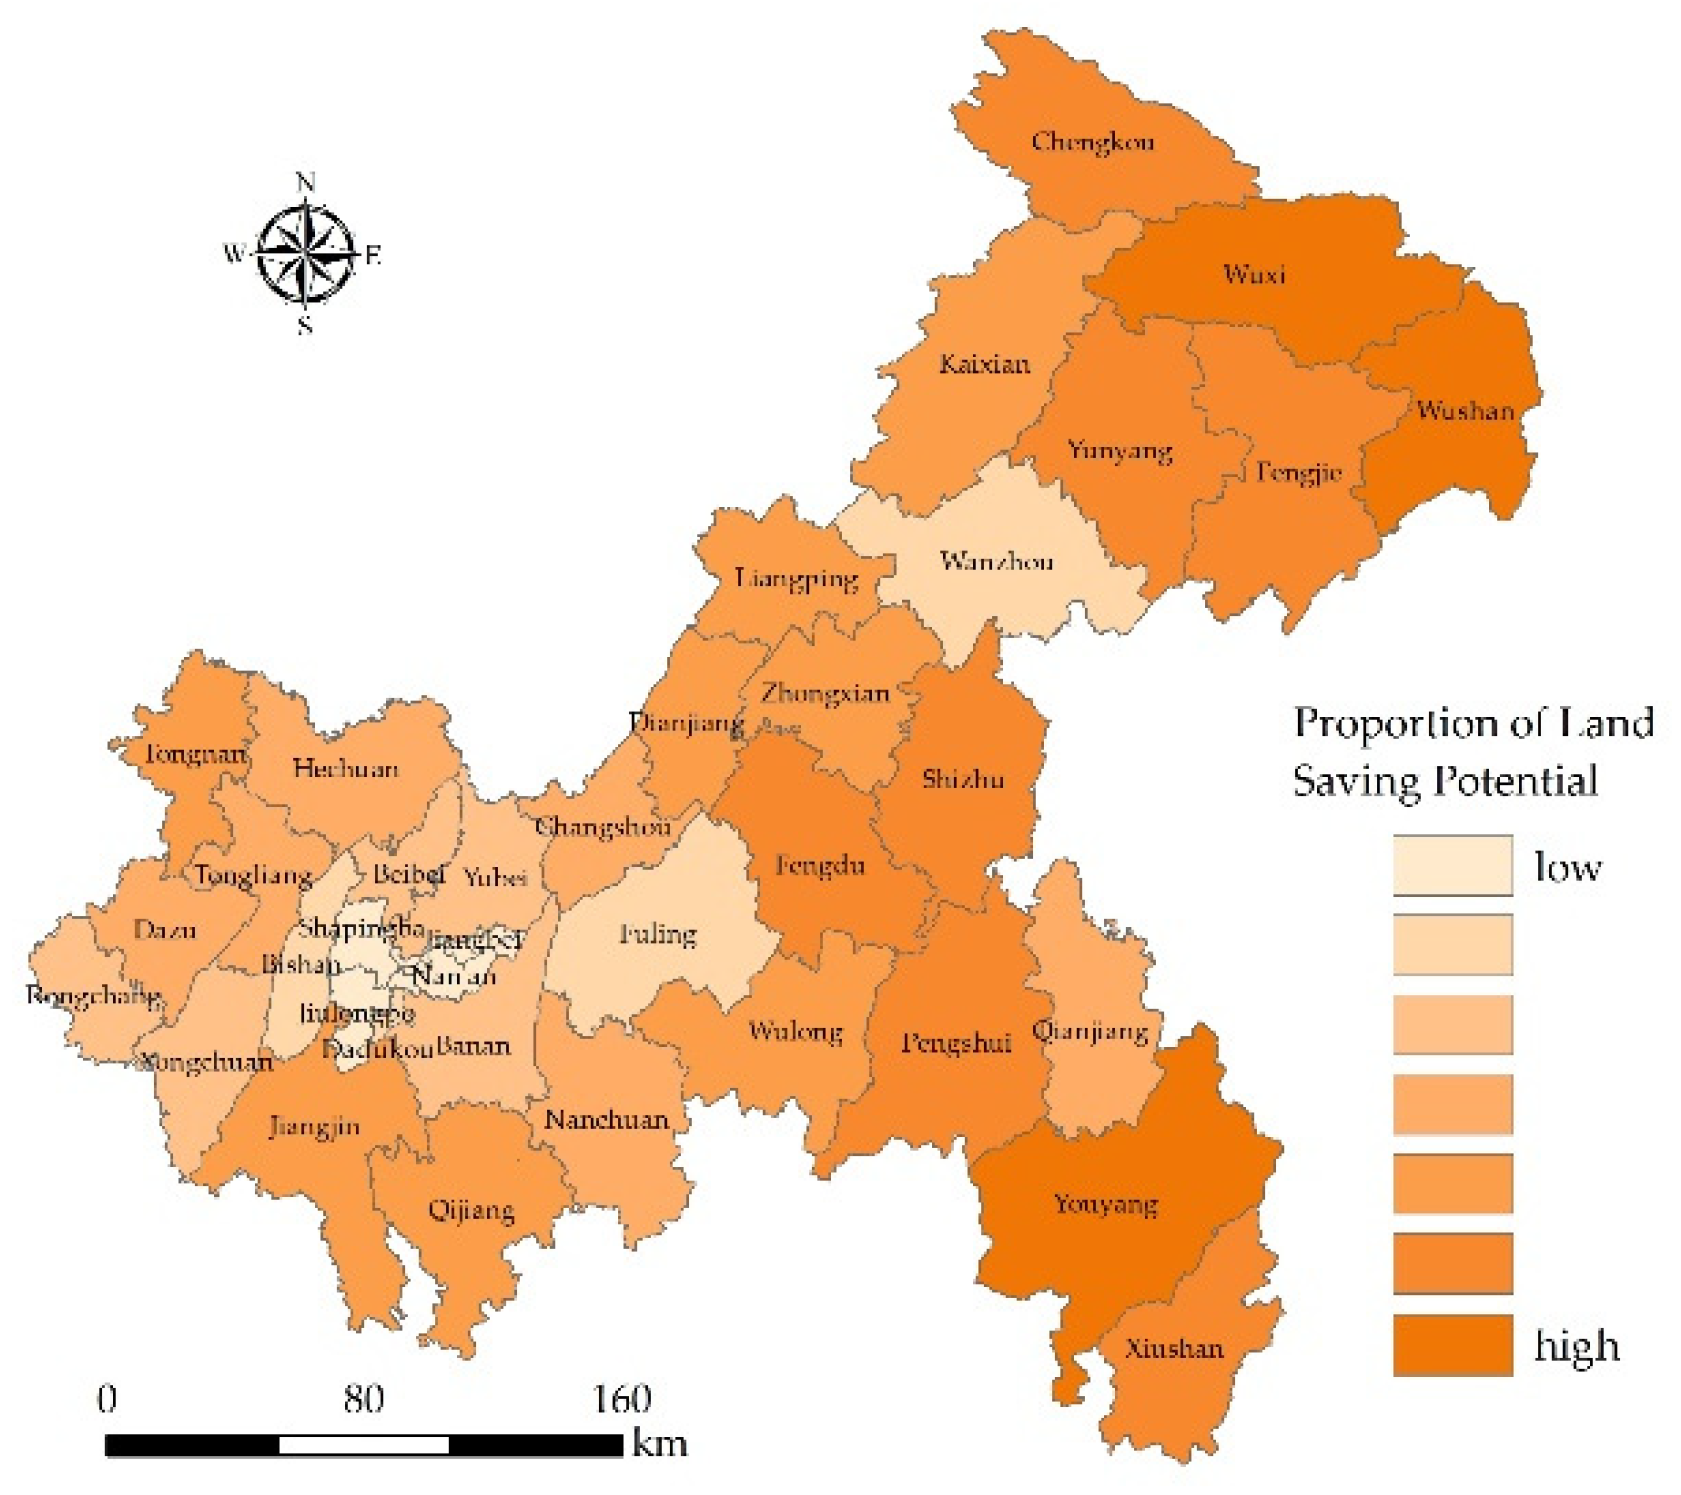
2.1. Research Area

Chongqing is the only municipality directly under the Central Government in the central and western regions of China and also one of the important national central cities. It covers an area of 82,400 km2 and has 38 districts and counties under its jurisdiction (Figure 1 shows the geographical location of Chongqing and its corresponding land use status in 2018. The land use remote sensing monitoring data and administrative boundary data are obtained from the Resource and Environment Science and Data Center, Chinese Academy of Sciences.). In 2018, the permanent population of Chongqing exceeded 31 million, with a density of 376.46 people per km2, ranking 11th in China. The terrain of Chongqing gradually lowers from north and south to the Yangtze River reaches. The northwest and central parts of Chongqing are dominated by hills and low mountains with slopes, thus known as “the mountain city.” Specifically, the mountainous areas account for 76% while the river valley and flat plain area only account for 2%. Accordingly, the geographical conditions of Chongqing are more severe than the plains in China.
When investigating the evolution of Chongqing’s land use structure, however, some scholars found that Chongqing faces rapid urban expansion and gradually declining compactness in the expansion process [44]. Then, the need to optimize the allocation of elements, rationally plan the structure of urban land use, promote the intensive use of urban land, and boost economic and social development with higher quality has become all the more urgent for this area. In this context, it is crucial to evaluate rationally the intensive urban land use in districts and counties of Chongqing, to reveal their spatial and temporal evolution characteristics, and to explore the reasons for their changes.

2.2. Methods

2.2.1. Technical Efficiency Model and the Level of the Intensive Urban Land Use

Considering that the panel data covers the trend factor (time) information and also has relatively minor constraints for the assumption about parameter distribution in the parameter estimation process, we chose the panel data model. Following the setting of Battese and Coelli’s (1992) framework [38],
y i t = f ( x i t ; β ) · exp ( v i t u i t ) u i t = u i · η i t   η i t = exp ( η t ) , t ϱ ( i )
where x i t and y i t denote the input and output vectors associated with the production unit i   ( i = 1 , 2 , , N ) at time t ( t = 1 , 2 , , T ) respectively, β represents a vector of unknown parameters to be estimated, and ϱ ( i ) is the duration of the production unit i in the observation period T. Besides, v i t represents a random shock in the production activities, and u i t is a non-negative technical inefficiency item. When u i t is 0, it indicates that production unit i is on the frontier of production, otherwise it represents the efficiency loss when production unit i is not in fully effective production at time t . η i t is then the time-variation trend of technical inefficiency item. Here, v i t and u i t are independent of each other: v i t is assumed to be independent and identically distributed N ( 0 , σ v 2 ) , and the density function of u i t is also independent and identically distributed and follows a non-negative truncated (at zero) normal distribution.
The setting of the production function in the model adopts the form of trans-log production function. This setting can not only deal with unbalanced panel data, but also comprehensively reflect the interplay among input elements and trends, transcending the limitation of the Cobb-Douglas function in which the elastic sum of input elements is 1. So, there is,
l n y i t =   β 0 + n = 1 N   β n l n x n i t + 1 2 n = 1 N m = 1 M   β n m l n x n i t l n x m i t + n = 1 N   β n t t l n x n i t +   β t t +   β t t t 2 + v i t u i t
N indicates the number of input elements; time t   ( t = t c u r r e n t t b a s e ) is the proxy variable in the technical change, represented by a quadratic nonlinear function [45]. ε i t = v i t u i t means mixed error terms. However, since v i t and u i t cannot be estimated directly, Battese and Coelli (1992) also transformed the parameter.
σ ε 2 = σ v 2 + σ u 2 , γ = σ u 2 / σ ε 2  
Here, the statistic γ is used to identify the contribution of the volatility stemming from non-input output factors (affecting the technical inefficiency item) to the overall error. When γ is large and significant, it is necessary to bring in technical inefficiency.
To measure the land-use efficiency more reasonably from the input-output perspective, we employed the land input scale to unitize each variable, with LL, KL, and WL representing labor, capital, and energy input per unit land area, respectively, and GDPL representing the GDP output per unit land area. Then we gained the trans-log regression model, as follows:
l n G D P R L i t =   β 0 +   β 1 l n L L i t +   β 2 l n K L i t +   β 3 l n W L i t +   β t t + 1 2 β 11 ( l n L L i t ) 2 + 1 2 β 22 ( l n K L i t ) 2 + 1 2 β 33 ( l n W L i t ) 2 + 1 2 β t t t 2 +   1 2 β 12 l n L L i t l n K L i t +   1 2 β 13 l n L L i t l n W L i t + 1 2 β 23 l n K L i t l n W L i t +   β 1 t t l n L L i t +   β 2 t t l n K L i t +   β 3 t t l n W L i t + v i t u i t
Accordingly, we calculated the technical efficiency (TE) of the production unit i at time   t and used it to measure the level of the intensive urban land use,
T E i t = E ( y i t | x i t , v i t , u i t ) E ( y i t | x i t , v i t , u i t = 0 ) = y i t y i t * = f ( x i t ; β ) · e x p ( v i t u i t ) f ( x i t ; β ) · e x p ( v i t ) = e x p ( u i t )

2.2.2. Loss of Technical Efficiency and Potential of Urban Land Intensive Use

Technical efficiency measures the output ratio of a certain production unit to the production frontier unit under a given input. When there is a loss of technical efficiency, it means that the existing resources are redundant and the utilization efficiency is on the decline, preventing the input-output efficiency of the production unit from reaching the optimal level. There is, therefore, room for saving input resources and for growth in the output of production units. The existing literature has also proposed two measurement methods of potential for the intensive urban land use, i.e., land-saving potential and output growth potential [13,30]. In the interest of length limit, we drew on the land-saving potential to explore the potential for the intensive urban land use of each district or county in Chongqing.
With Formula (5), the technical efficiency loss (TEL) of urban land use can be calculated,
T E L i t = 1 T E i t = 1 e x p ( u i t )
Accordingly, the calculation formula of urban land-saving potential is,
L a n d S a v i n g i t =   l a n d i t × T E L i t =   l a n d i t × { 1 exp ( u i t ) }

2.2.3. Factor Analysis on the Level of and Potential for the Intensive Urban Land Use

Exploring the driving factors of the intensive urban land use is instrumental in deepening the understanding of its internal mechanisms and basic evaluation process, so as to make its future changes and development trends somewhat predictable. Accordingly, sustainable utilization measures can be formulated to promote the intensive use of urban land. Since the factors influencing the intensive urban land use are numerous and complex, apart from the channels analyzed via the indicator system evaluation method, we also noted that factors affecting the technical efficiency of urban land use could similarly impact the level of and potential for the intensive urban land use. The existing literature explores the factors impacting the evaluation of the intensive urban land use mainly from the angles of economy, society, environment, institution, accessibility, and technology [24,34,46,47,48,49,50,51]. On that basis, we selected the following factors with the available data, taking into account the geographical features and economic and social development stages of Chongqing.
1. Land use structure: the urban land of Chongqing is evenly spread and the stock land is inefficiently utilized [44]. Blind over-expansion of the city engenders waste of resources, incompatible with the loading capacity of the resources and environment. Hence, we selected the land use structure to measure the rationality of the expansion speed of urban construction in districts and counties of Chongqing, expressed by the proportion of the land area for construction to total land resources in each district or county.
2. Population density: it reflects the tension between people and land, expressed by the number of people per square kilometer. When the population density is low, the increase in population density may increase the urban economic scale, whereas congestion and information friction caused by high population density adversely impact urban economic development. Although Chongqing is relatively densely populated, the specific impact of the density still entails testing.
3. Openness: external dependence represents the degree of economic openness and reflects the open environment of districts and counties in Chongqing. As an inland area with a height of openness, the development of Chongqing benefits from its unique open environment. In the process of promoting the intensive urban land use, it is vital to consider the impact of economic openness, expressed as the ratio of total import and export to GDP.
4. Transportation convenience: transport infrastructure is the artery of urban development. Some scholars used urban road scale per capita to represent the factor of transport infrastructure [46], but the former can only measure the degree of congestion within the city, rather than the convenience of regional economic and social interaction between the city and the outside. As Chongqing is located in the hinterland of Southwest China, the degree of convenience in transportation plays a pivotal role in its economic development. Then we used highway density (highway mileage per square kilometer (including expressway, I–IV levels highway mileage)) to quantify it.
5. Education expenditure intensity: technical progress depends on the gradual accumulation of intangible human capital such as knowledge and experience. In consideration of data availability, we used the intensity of education expenditure as a proxy variable for technology.
The linear expansion of technical inefficiency in Battese and Coelli model [39] suggests that the influence factors of technical inefficiency acts on the level and potential for the intensive urban land use through technical efficiency and its loss, thus unifying the efficiency measurement and channel analysis of this form of land use,
u i t = z i t ·   δ + W i t
where, z i t is a set of explanatory variables of technical inefficiency terms, δ is the corresponding coefficient to be estimated, and W i t is the residual term. Combined with the above analysis and selection process of influence factors, LandS, PopD, Open, Transp, and EduExp were used to represent land use structure, population density, economic openness, convenience in transportation, and education expenditure intensity respectively. The factor analysis equation of technical inefficiency is as follows,
u i t =   δ 1 l n L a n d S i t + δ 2 l n P o p D i t + δ 3 l n O p e n i t + δ 4 l n T r a n s p i t + δ 5 l n E d u E x p i t + W i t

3. Data Sources and Descriptive Statistics

The research data comes from China City Statistical Yearbook, China County Statistical Yearbook, Chongqing Statistical Yearbook, and several sources from the Chongqing Municipal People’s Government, Chongqing Municipal Bureau of Planning and Natural Resources, Chongqing Municipal Water Resources Bureau. (According to the existing statistical data of all districts and counties in Chongqing that can be disclosed in line with the law, the fossil energy consumption data is not available; the electricity consumption data is based on the power supply company, which has inter-provincial and inter-regional power supply problems and does not match the research unit. Given that water resources are inputs and necessities for production and life, the water consumption of the secondary and tertiary industries was used as a proxy variable for energy consumption in each district or county.) Data observation ranges from the year of 2009 to 2018.
We obtained 5 input-output variables, of which the number of employees, fixed capital investment, water consumption in the secondary and tertiary industries, and construction-use area were taken as input variables of labor, capital, energy, and land utilization, respectively, and GDP in the secondary and tertiary industry as the output variable. Meanwhile, we deflated GDP and fixed capital investment according to the circumstances in the year of 2010. Descriptive statistics of variables are shown in Table 1.

4. Empirical Analysis

4.1. Technical Efficiency Measurement

Table 2 shows the regression results of the technical efficiency model. Specifically, model 1 considers both the impact of technical changes and the interaction terms (including quadratic terms) between variables, but the coefficient value of technology inefficiency (η) in the results is small and insignificant, in opposition to the assumption that the model may have technical changes. Model 2 only considers the influence of variable interaction terms, excluding technical changes; yet the fixed capital input coefficient of the model is negative, inconsistent with the fact. The empirical results of models 3 and 4 are relatively ideal. Neither of them considers the effects of variable interaction terms; instead, they only distinguish the existence of technical changes. The results show that the technical inefficiency value (0.77) in model 3 is notably lower than that (2.40) in model 4, after considering technical progress (the coefficient is significantly positive in the model). The implication is that model 4 greatly overestimates the impact of technical inefficiency on account of ignoring technical progress, thereby deviating the measurement of the land use potential of each district or county from the actual value. It should also be noted that the results of models 1 and 2 show that the coefficient of the quadratic term of labor input per unit of land is significantly positive, indicating that the “labor” element is in a utility-increasing stage during the observation period and has a scale effect, thus one of the effective ways for all districts and counties to increase the current level of intensive use of land by promoting employment to increase labor input. Model 5, therefore, also adds the influence of the quadratic term of the labor factor on the basis of model 3 and finds that the corresponding μ and γ have decreased, further correcting the technical inefficiency estimated in the model. Based on comprehensive and comparative analysis, we can see that the setting of model 5 is the most reasonable. The value of the statistic γ is 0.8527, implicating that the technical inefficiency accounts for 85.27% of the total disturbance, or, the major part of the disturbance stems from technical inefficiency.

4.2. Evolution of the Level of Intensive Urban Land Use

We use technical efficiency to measure the level of intensive use of urban land in each district or county of Chongqing. On the whole, the average level of intensive use in Chongqing increased from 0.4479 in 2009 to 0.5891 in 2018, with an average annual growth rate of 1.57 percentage points, revealing a steady growing trend. Take 2018 for example: 20 districts and counties reported a lower level of intensive land use than the average. Although the lowest level in Wuxi County was only 0.3315, as opposed to the highest 0.9884 in Yuzhong District, reflecting a huge gap, the difference between the two narrowed slightly from 0.7601 in 2009 to 0.6527 in 2018. In general, therefore, the intensive use of urban land in all districts and counties of Chongqing has been steadily increasing year by year, and the regional gap has also narrowed.
On the other hand, Figure 2 shows the level of urban land intensive use in districts and counties categorized into different groups according to their technical efficiency. (Owing to length limit, the districts and counties in Chongqing fall into groups according to the level of intensive land use (technical efficiency) in 2018, and the average value is taken by groups. The specific division from high to low is: 0.9~1.0, Yuzhong, Jiangbei, Jiulongpo, and Nan’an districts; 0.8~0.9, Shapingba, Dadukou, and Fuling districts; 0.7~0.8, Bishan and Wanzhou districts; 0.6~0.7, Beibei, Yubei, Ba’nan, Yongchuan, Rongchang, Tongliang Qianjiang, and Dazu districts; 0.5~0.6, Changshou, Hechuan, Nanchuan, Wulong, Qijiang, and Jiangjin district as well as Zhongxian County; 0.4~0.5, Kaizhou, Liangping, and Tongnan districts. As well as Dianjiang, Fengjie, Xiushan, Shizhu, Pengshui, Fengdu, Yunyang, and Chengkou counties; 0.3~0.4, Youyang, Wushan, and Wuxi counties. For complete data, please contact the authors.) It can be seen that the three groups below the average level witness the greatest ten-year improvement—sequentially 0.1281, 0.1335, 0.1305 corresponding to groups of 0.5~0.6, 0.4~0.5, 0.3~0.4. In terms of concentration, in 2018, the level of intensive land use in 15 districts and counties ranged from 0.5 to 0.7, but the number of districts and counties below 0.7 accounted for more than three-quarters, indicating large leeway to improve the level of utilization efficiency for most districts and counties. Figure 3 shows the technical efficiency of land use in all districts and counties in 2018. From the perspective of the location, the districts and counties with the intensity above 0.6 basically concentrated in the west of Chongqing except Wanzhou and Qianjiang districts and roughly radially distributed from the city proper.

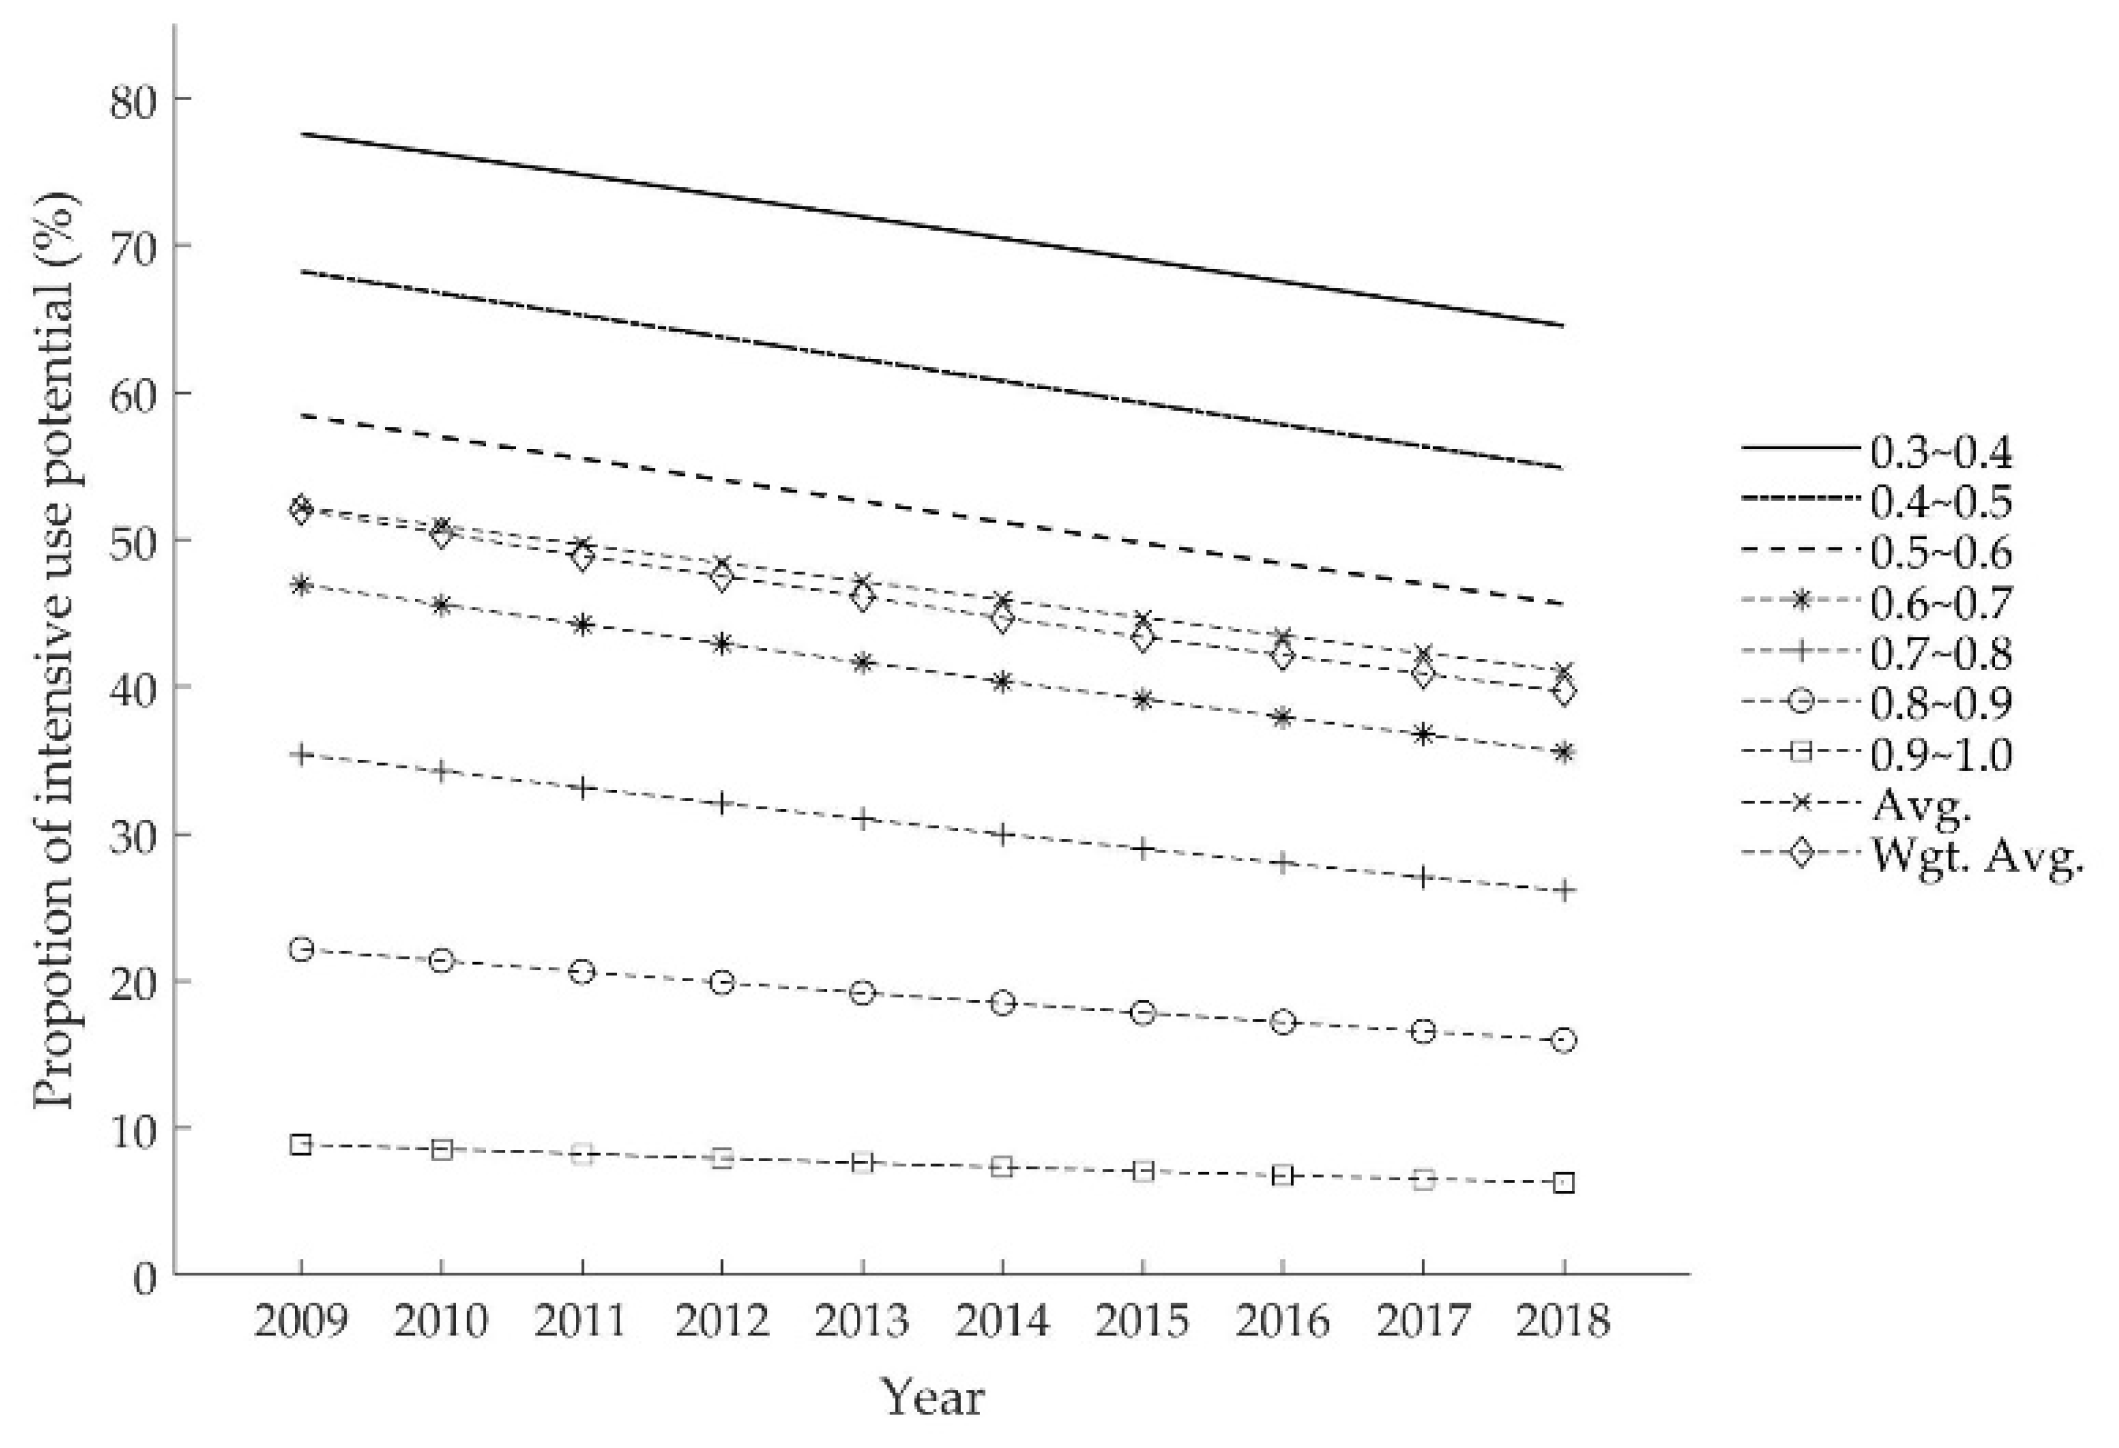
4.3. The Measurement and Analysis of the Potential for the Intensive Urban Land Use

From the evolution trend of the average land-saving level in Figure 4, it can be found that the potential for intensive land use of all districts and counties in Chongqing sees a moderate downward trend, which negatively corresponds to the level of intensive use calculated by technical efficiency. In 2018, the land-saving potential of Chongqing was 2581.41 km2, down by 286.90 km2 from the 2868.31 km2 in 2009. The annual decrease in these years averaged 1%, reflecting the severity and persistence of the process to improve the land-use efficiency. The chart shows that on average, the potential of each district or county is in the range of 70~80 km2 during the observation period, and the years with a faster decrease in potential are 2011~2015 and 2016~2018, with an average annual decline of 1.29% and 1.98%, respectively.
Equation (6) shows that the land-saving potential of each district or county is jointly determined by the related land-use scale and efficiency. With districts and counties grouped by the same criteria, Figure 4 shows the land-saving potential of the 7 groups. Although the group 0.5~0.6 is in the middle level of land-use efficiency, the land-saving potential of it is much higher than the other groups. The reason is that the land-use scale of Jiangjin, Qijiang, and Hechuan districts in the group is large and therefore increases the absolute value of saving potential of this group. The group 0.4~0.5 ranks second, slightly higher than the groups 0.3~0.4 and 0.6~0.7, which is also due to the dominant role of the land-use scale. Though the land-use efficiency of the latter two differs greatly, the land-saving potential of the two has remained basically the same since 2013, as the larger land-use scale of Yubei and Yongchuan districts also raises the potential value of this group in 0.6~0.7 group. Then the group 0.7~0.8 follows closely and the land-saving potential is also above 60 km2. Next, the land-saving potential of the groups 0.8~0.9 and 0.9~1.0 is far lower than the others. One reason is that these two groups cover six of the nine main districts of Chongqing and their economic and social development and resource input are comparatively advantageous, resulting in the relatively high land-use efficiency. A second factor is the small land-use scale within these two groups, especially in Yuzhong and Dadukou districts (no more than 55 km2). Judging from the extreme values, the gap between the maximum and minimum land-saving potentials also slightly narrows from 193.63 km2 to 179.25 km2. In addition, except groups 0.5~0.6 and 0.8~0.9 which slightly reverse in 2010 and 2010~2011 respectively, the land-saving potential of each group during the observation period steadily decreases. Of course, these also imply large room to improve land-use efficiency for all districts and counties of Chongqing.
The value of the land-saving potential reflects the room that can be improved by the intensive use of urban land in each district or county, highlighting the plight of improving the land-use efficiency. The proportion of potential for the intensive urban land use, calculated according to the ratio of land-saving potential to the land input area, directly reflects the difficulty of improving land-use efficiency of districts and counties in different years. A comprehensive analysis of the two perspectives, therefore, helps to understand the potential for this kind of intensive use more specifically.
Figure 5 shows the proportion of potential for the intensive urban land use in each group. In general, the proportion of all districts and counties decreased year by year. The average potential proportion of these jurisdictions dropped from 52.21% in 2009 to 41.09% in 2018. At the same time, the proportion of overall potential for intensive land use of Chongqing (the ratio of the sum of the land-saving potential of each district and the sum of input land area) went down from 51.99% to 39.68%. Since the larger the proportion, the greater the room to improve the intensive urban land use and the easier to boost efficiency, improving the efficiency of land use in Chongqing gradually became more difficult along with the increase in the potential for this form of land use. In terms of regional difference, the gap between the highest and lowest proportion of for intensive land use of these areas also witnessed a trend of shrinkage over time, indicating a gradual convergence in terms of the difficulty in improving efficiency. For all groups, the sorting between these groups was exactly the opposite of that of technical efficiency. This resulted from the level of urban development, since the higher the degree of urban development, the higher the efficiency of land use, and the more difficult it is for further improvement.
Figure 6 and Figure 7 show the scale and proportion of urban land-saving potential of districts and counties of Chongqing in 2018. Under the dual influence of land input scale and utilization efficiency, Yubei, Jiangjin, Hechuan, and Kaizhou districts had relatively large potential for intensive land use, all with over 100 km2, indicating that insufficient allocation on factors of production and excessive land exploitation in these areas were more serious than in the others. Additionally, the proportion of land-saving potential in the six districts of the city proper and Fuling District was less than 20%, for which improving the degree of intensive land use will become tremendously thorny.

5. Factor Analysis

5.1. Factor Analysis on the Intensive Urban Land Use in Chongqing

As mentioned above, the influence factors of technical inefficiency have an effect on the level of and potential for the intensive urban land use through technical efficiency and its loss. Table 3 shows the results of the factor analysis of “technical inefficiency as the explained variable.”
The Hausman test shows that for each district or county with notable individual characteristics, the fixed effects model (FE) is appropriate and the following analysis is based on FE and the regression results. First, the signs of the coefficients of the average education expenditure intensity, transportation convenience, land use structure, and population density are all negative, with the significance level lower than 5%. This suggests that the percentage increase of these four types of factors will slash the technical inefficiency and then improve the technical efficiency of land use in all districts and counties. More specifically, the coefficient of the education expenditure intensity is 0.03, meaning that for every one-percentage increase in that intensity, the technical inefficiency of land use decreases by 0.03%, and transportation convenience by 0.09%. This manifests that raising expenditures in education and speeding up and optimizing the construction of transportation infrastructure can effectively improve the level of the intensive urban land use in all districts and counties. Second, the impact of land use structure and population density on the technical inefficiency is relatively massive, up to 0.42 and 0.57 respectively.
The reason is that the intensive use of urban land pertains to the stage of urban development. First, the land use structure reflects, to a certain extent, the stage of urban development and also measures the rationality of the expansion speed of urban construction. Second, effective urban planning markedly reduces the technical inefficiency of land use and increases the level of intensive use. And third, population density reflects the tension of the relationship between humankind and land. From previous calculations of technical efficiency, we can see the current supply of urban labor in Chongqing apparently has a scale effect, so the increase in population density also significantly promotes the intensive use of urban land. On the other hand, it should be noted that the regression coefficient of openness is positive and the magnitude is 0.006. This positive sign indicates that the open environment of each district or county may reduce the land-use efficiency. The reason for it may be that the higher the city’s external dependence, the greater the impact of external demand on production activities and the greater the external risk it bears. Meanwhile, in market competition, external products may form a crowding-out effect on local output, which in turn will diminish its land-use efficiency. The coefficient of external dependence, however, is not statistically significant, and the influence of it is relatively small.
In terms of model estimation, the Battese and Coelli [39] model adopts a two-step method, i.e., estimating the technical efficiency model first and then conducting factor analysis on the technical inefficiency term. Coelli and Battese [52] improved the estimation method, using a one-step method to estimate the above two processes at the same time to make up for the estimation bias caused by different distribution of the error terms in the previous method. To ensure robustness of the results, we also used the one-step method to test whether the estimation of the technical inefficiency model was robust. The results showed that the education expenditure intensity coefficient climbed up noticeably and the regression coefficients of other factors lessened. This emphasizes again the importance of strengthening talent cultivation and promoting the intensive use of urban land from the technical aspect. In addition, the signs of factors were consistent with the results of the two-step method except the sign of openness that changed insignificantly.
Combining the results of the two-step method, we confirm that openness is not a significantly robust factor; hence, the efforts to create an open environment and promote import and export have no significant effect on the intensive use of urban land in each district or county of Chongqing at the current stage.

5.2. Heterogeneous Analysis on Sub-Regions

Furthermore, we investigated the heterogeneous influences of previous factors via the division of the urban functional areas in Chongqing. (In 2020, in order to accelerate the promotion of high-quality urban development, the Chongqing Municipal People’s Government redefined the functional urban area of the city and divided it into three sub-regions, namely, the main city metropolitan area, northeastern-Chongqing town cluster, and southeastern-Chongqing town cluster. Specifically, the main city metropolitan area includes Yuzhong, Jiangbei, Shapingba, Jiulongpo, Nan’an, Beibei, Yubei, Banan, Changshou, Jiangjin, Hechuan, Yongchuan, Nanchuan, Qijiang, Dazu, Bishan, Tongliang, Tongnan, and Rongchang districts; northeastern-Chongqing town cluster: Wanzhou, Kaizhou, and Liangping districts as well as Chengkou, Fengdu, Dianjiang, Zhongxian, Yunyang, Fengjie, Wushan, and Wuxi counties; southeastern-Chongqing town cluster: Qianjiang, Wulong, Shizhu, Xiushan, Youyang, and Pengshui counties.) Table 4 shows the “one-step” regression results of factor analysis of three sub-regions of Chongqing.
Firstly, the coefficients of education expenditure in all sub-regions are around −0.3 and significant at the 1% level, suggesting that augmenting fiscal expenditure in education is an important way to promote the intensive use of urban land. Secondly, economic openness does not show statistical significance in the southeastern and northeastern regions of Chongqing; yet for the main city metropolitan area, the coefficient of openness is −0.036 and significant at the 10% level, thus indicating that economic openness can, to a certain extent, promote the intensive use of urban land in this sub-region. This form of land use there, however, is not significantly influenced by the land structure, demonstrating that the construction-land expansion rate there is in equilibrium at this stage. The positive coefficient, though, implies that further excessive urban expansion may hinder the intensive use of urban land. Thirdly, the transportation infrastructure in southeastern and northeastern Chongqing, driven by economic backwardness, is relatively behind that of the main city metropolitan area. Hence, the per-unit increment in transportation infrastructure has a greater impact on the intensive use of urban land, as shown by the larger size of the regression coefficient of transportation. In addition, the influence of population density shows obvious heterogeneity in these three sub-regions. Located in Wuling Mountains, the southeastern region of Chongqing sees seriously limited socio-economic development, and the per-unit increase in population density has the most obvious effect on the intensive use of urban land. In comparison, the main city metropolitan area has the highest population density but the impact of it is least. In the aggregate, the results of this part show that population density has a positive effect on land intensive use in all regions of Chongqing.

6. Results, Conclusions, and Discussion

6.1. Results and Conclusions

With the help of the SFA model with decomposed technical inefficiency, this study not only provides a more objective analysis framework for the intensive urban land use and its potential evaluation from the perspective of input and output, but more importantly, the analysis framework also integrates the exploration of influence channels of the level of and potential for the intensive use through technical inefficiency term. It absorbs the advantages of the index system evaluation method while retaining the scalability of factor analysis, thus forming a more complete research paradigm. In order to test this framework, we used panel data from 38 districts and counties in Chongqing and further consolidated the empirical foundation for applying technical efficiency measurement to evaluating the intensive use of urban land. The empirical findings are as follows.
(1) The results of technical efficiency measurement showed the level of the intensive use of urban land in all districts and counties increased steadily from 2009 to 2018. On the whole, the average level of intensive land use in Chongqing increased by 14.12 percentage points and the max-min gap within the region was bridged by 10.74 percentage points. On the other hand, although the potential of the intensive urban land use characterized by the land-saving potential in all districts and counties saw a steady decline, the potential scale of Chongqing only reduced by 10%, indicating grimness in improving land-use efficiency. At the same time, the overall proportion of land-saving potential dropped by 12.31 percentage points to 39.68%, signifying a gradual increase in the difficulty in improving the efficiency of land use.
(2) By selecting appropriate factors, we also analyzed the impact of non-input output factors on technical inefficiency, which temporarily influenced the level of and potential for the intensive urban land use. Our results showed that the degree of external dependence was not a stable factor affecting land-use efficiency and intensive use potential of each district or county, but the intensity of education investment, transportation convenience, land use structure, and population density (labor supply) could significantly improve land-use efficiency.
(3) Furthermore, we also studied the heterogeneous effects of these factors in different functional regions of Chongqing and found that economic openness had a moderate influence on promoting the intensive use of land in the main city metropolitan area. For economic openness to have a greater role, the government, therefore, could formulate reasonable open-up policies. For regions in southeast and northeast Chongqing, the key to enhancing the intensive use of urban land is to accelerate infrastructure construction and direct the inflow of people for more supply of laborers.
We therefore conclude that the framework provides a process of intensive land-use evaluation and the influence channel analysis in an integrated manner, helping us to better develop a more objective and comprehensive understanding of intensive use of urban land. Additionally, at the current stage of urban development in all districts and counties of Chongqing, the effective and stable channels to increase the level of the intensive urban land use are to increase social education expenditures, enhance human capital stock to promote technical progress, speed up developing infrastructure to improve transportation convenience, rationally plan urban expansion and optimize land resource allocation, and earnestly guide and guarantee the employment of the labor force. These findings are instructive for local government to form sound policies on the management of urban land resource and to achieve a sustainable development pattern.

6.2. Discussion

Intensification (potential) and efficiency (loss) have conceptual and logical linkages, this study utilizes the technical efficiency measurement method by incorporating the idea behind the indicator system evaluation method and constructs a unified analytical framework for the intensive urban land use. Through an in-depth study of a typical region in China, our research reflects the urgency of promoting the intensive use of urban land and maintaining sustainable urban development for China. Although we have explored the possible influences on the intensive use of urban land from several socio-economic aspects, the issue to improve the intensive use of urban land needs to be treated with a comprehensive and integrated thinking, incorporating social benefits, economic benefits, ecological benefits, etc. In fact, many scholars have examined the socio-economic effects of urban land intensification as well as its ecological effects. Socio-economic development, ecological protection, and intensive land use have a symbiotic and coupled relationship [6,15,50,53,54], and the coordinated development of these three elements forms the basis of sustainable development of cities [55,56,57,58]. The government, as the leader of urban development, should also pay more attention to this relationship when making the policies, so as to scientifically and effectively promote a resource-saving and environment-friendly society.
It should be pointed out that our study still has some shortcomings and defects. First, the technical efficiency model measures the input and output efficiency of urban land use [13]. As mentioned previously, the land output should consider undesired output with negative externalities from the perspective of comprehensive ecological benefits. In fact, this is also what many scholars conduct when measuring land-use efficiency for cities nationwide [46]. Therefore, the use of technical efficiency methods to assess the level of and potential for the intensive urban land use naturally needs to be included in the scope of related research. Owing to the unavailability of relevant indicator data, this study has not been able to carry out this part of the work.
Secondly, the characteristics and changing process of the intensive urban land use are closely related to the spatial and temporal scales, and thus the driving factors of the intensive urban land use are different at different scales [59]. This is why we explored the significance of these factors by taking all districts and counties as a whole after selecting non-input output factors to estimate this kind of intensive use. This kind of analysis, though, has great limitations and is incapable of reflecting the heterogeneities of influence factors in different districts and counties (or different areas). For example, population density is a prominent factor affecting the intensive use of urban land. Some literature proposes that population density has an “inverted U-shaped” relationship with urban land-use efficiency [46], which indicates that the increase in population density can boost labor supply and output, but an excess of density also leads to slower information diffusion of production activities, lower operating efficiency, and other costs. Our research finds that the population density plays a positive role on the whole or three sub-regions, but given the influence of population density under different city sizes [23,58,60,61], it is also an operational direction for analyzing the heterogeneous impacts of population density on land-use efficiency in different areas of Chongqing.
As pointed out in the introduction, there are many ways to measure urban land-use efficiency, including technical efficiency and production efficiency. As a matter of fact, the former is only one aspect of the latter, which also comprises allocation efficiency considering the price factor. Furthermore, it is also necessary to introduce ecological factors when using eco-efficiency to measure the intensive urban land use. At the same time, the SFA-based technical efficiency measurement is merely one of the many efficiency measurement methods and the specific model itself may have shortcomings. For example, the Malmquist index has the advantage of decomposing technical efficiency into pure technical efficiency and scale efficiency over the SFA model, facilitating detailed understanding of technical efficiency [35], but it is impossible to further analyze the influence mechanism as the latter does. The choice of a model, therefore, is still subject to the specific subject matter.
In the final analysis, it is noteworthy that urban construction land includes industrial, commercial, and residential land, among which there are significant differences in terms of land-use function, resource consumption, output benefit, etc. Consequently, the results of the intensive land-use evaluation and analysis of influence factors for various types of land are also inevitably different. Currently, there are relevant studies on urban industrial land in the literature [61,62,63,64], yet with few discussions on the characteristics of commercial and residential land and intensive use evaluation [65]. Further research could thus be conducted in this direction.

Author Contributions

J.W., conceptualization, formal analysis, visualization, writing—original draft, writing—review and editing; K.S., data curation, formal analysis, methodology; J.N. and D.X., supervision, validation, funding acquisition. All authors have read and agreed to the published version of the manuscript.

Funding

This research is funded by National Key R&D Program of China, grant number 2018YFD0200701.

Conflicts of Interest

The authors declare no conflict of interest.

References

  1. Klopp, J.M.; Petretta, D.L. The urban sustainable development goal: Indicators, complexity and the politics of measuring cities. Cities 2017, 63, 92–97. [Google Scholar] [CrossRef]
  2. Pacione, M. Urban Geography: A Global Perspective; Routledge: London, UK, 2009. [Google Scholar]
  3. Hasse, J.E.; Lathrop, R.G. Land resource impact indicators of urban sprawl. Appl. Geogr. 2003, 23, 159–175. [Google Scholar] [CrossRef]
  4. Wang, S.; Zhou, C.; Wang, Z.; Feng, K.; Hubacek, K. The characteristics and drivers of fine particulate matter (PM2. 5) distribution in China. J. Clean. Prod. 2017, 142, 1800–1809. [Google Scholar] [CrossRef]
  5. Liu, Y.S.; Fang, F.; Li, Y. Key issues of land use in China and implications for policy making. Land Use Policy 2014, 40, 6–12. [Google Scholar] [CrossRef]
  6. Malherbe, H.; Pauleit, S.; Lorz, C. Mapping the loss of ecosystem services in a region under intensive land use along the southern coast of South Africa. Land 2019, 8, 51. [Google Scholar] [CrossRef] [Green Version]
  7. Quintas-Soriano, C.; Castro, A.J.; Castro, H.; García-Llorente, M. Impacts of land use change on ecosystem services and implications for human well-being in Spanish drylands. Land Use Policy 2016, 54, 534–548. [Google Scholar] [CrossRef]
  8. Moein, M.; Asgarian, A.; Sakieh, Y.; Soffianian, A. Scenario-based analysis of land-use competition in central Iran: Finding the trade-off between urban growth patterns and agricultural productivity. Sustain. Cities Soc. 2018, 39, 557–567. [Google Scholar] [CrossRef]
  9. Chowdhury, M.; Hasan, M.E.; Abdullah-Al-Mamun, M.M. Land use/land cover change assessment of Halda watershed using remote sensing and GIS. Egypt. J. Remote Sens. Space Sci. 2020, 23, 63–75. [Google Scholar] [CrossRef]
  10. Wang, Q.; Wang, W.M.; Jin, W. New perspectives and methods of the research into the intensive urban land use in China: Literature review and prospect. China Popul. Resour. Environ. 2017, 27, 104–109. (In Chinese) [Google Scholar] [CrossRef]
  11. Lau, S.S.Y.; Giridharan, R.; Ganesan, S. Multiple and intensive land use: Case studies in Hong Kong. Habitat Int. 2005, 29, 527–546. [Google Scholar] [CrossRef]
  12. Chen, Y.R.; Mei, Y.; Wang, C.M.; Wang, S.Y.; Jiang, H.H. A Study of Intensive Use of Urban Land. Sci. and Technol. Manag. Land Resour. 2006, 5, 7–12. [Google Scholar]
  13. Wang, X.D.; Liu, X.Q.; Pei, T.; Wang, Z.B. Potential evaluation of the intensive urban land use in the Beijing-Tianjin-Hebei region based on measurement of technical efficiency. Acta Geogr. Sin. 2019, 74, 1853–1865. (In Chinese) [Google Scholar]
  14. Jiao, X.L.; Zhu, H.H.; Song, W.; He, R.J.; Shu, Y.; Liu, L. Empirical study on evaluation of land intensive use in development zones based on GIS. DEStech Trans. Environ. Energy Earth Sci. 2019. [Google Scholar] [CrossRef]
  15. Zitti, M.; Ferrara, C.; Perini, L.; Carlucci, M.; Salvati, L. Long-term urban growth and land use efficiency in Southern Europe: Implications for sustainable land management. Sustainability 2015, 7, 3359–3385. [Google Scholar] [CrossRef] [Green Version]
  16. Zhou, L.; Shi, Y.; Cao, X. Evaluation of Land Intensive Use in Shanghai Pilot Free Trade Zone. Land 2019, 8, 87. [Google Scholar] [CrossRef] [Green Version]
  17. Kaur, H.; Garg, P. Urban sustainability assessment tools: A review. J. Clean. Prod. 2019, 210, 146–158. [Google Scholar] [CrossRef]
  18. Meijering, J.V.; Tobi, H.; Kern, K. Defining and measuring urban sustainability in Europe: A Delphi study on identifying its most relevant components. Ecol. Indic. 2018, 90, 38–46. [Google Scholar] [CrossRef]
  19. Caputo, P.; Pasetti, G.; Ferrari, S. Implementation of an urban efficiency index to comprehend post-metropolitan territories—The case of Greater Milan in Italy. Sustain. Cities Soc. 2019, 48, 101565. [Google Scholar] [CrossRef]
  20. Heydari, M.; Honarbakhsh, A.; Pajoohesh, M.; Zangiabadi, M. Land use optimization using the fuzzy mathematical-spatial approach: A case study of Chelgerd watershed, Iran. J. Environ. Eng. Landsc. Manag. 2018, 26, 75–87. [Google Scholar] [CrossRef]
  21. Barbosa, J.A.; Bragança, L.; Mateus, R. Assessment of land use efficiency using BSA tools: Development of a new index. J. Urban Plan. Dev. 2015, 141, 04014020. [Google Scholar] [CrossRef]
  22. Cao, J.W.; Li, S.J.; Li, G.H.; Qi, L.; Du, W.T. Evaluating intensive land use of Fuyu City based on the PSR model and the entropy weight method. J. Northeast Norm. Univ. Nat. Sci. Ed. 2019, 51, 125–132. (In Chinese) [Google Scholar]
  23. Hui, E.C.; Wu, Y.; Deng, L.; Zheng, B. Analysis on coupling relationship of urban scale and intensive use of land in China. Cities 2015, 42, 63–69. [Google Scholar] [CrossRef]
  24. Masini, E.; Tomao, A.; Barbati, A.; Corona, P.; Serra, P.; Salvati, L. Urban growth, land-use efficiency and local socioeconomic context: A comparative analysis of 417 metropolitan regions in Europe. Environ. Manag. 2019, 63, 322–337. [Google Scholar] [CrossRef] [PubMed]
  25. Grekousis, G.; Manetos, P.; Photis, Y.N. Modeling urban evolution using neural networks, fuzzy logic and GIS: The case of the Athens metropolitan area. Cities 2013, 30, 193–203. [Google Scholar] [CrossRef]
  26. Qiao, W.; Gao, J.; Liu, Y.; Qin, Y.; Lu, C.; Ji, Q. Evaluation of intensive urban land use based on an artificial neural network model: A case study of Nanjing City, China. Chin. Geogr. Sci. 2017, 27, 735–746. [Google Scholar] [CrossRef]
  27. Yang, J.; Jin, G.; Huang, X.; Chen, K.; Meng, H. How to measure urban land use intensity? A perspective of multi-objective decision in wuhan urban agglomeration, China. Sustainability 2018, 10, 3874. [Google Scholar] [CrossRef] [Green Version]
  28. Wan, J.J.; Chen, X. Spatial Pattern and Spillover Effect of Intensive Urban Land Use Efficiency from the Perspective of Land Development Rights. Econ. Geogr. 2018, 38, 160–167. (In Chinese) [Google Scholar]
  29. Liu, S.; Xiao, W.; Li, L.; Ye, Y.; Song, X. Urban land use efficiency and improvement potential in China: A stochastic frontier analysis. Land Use Policy 2020, 99, 105046. [Google Scholar] [CrossRef]
  30. Wang, X.; Shen, X.; Pei, T. Efficiency loss and intensification potential of urban industrial land use in three major urban agglomerations in China. Sustainability 2020, 12, 1645. [Google Scholar] [CrossRef] [Green Version]
  31. Hong, J.; Tamakloe, R.; Tak, J.; Park, D. Two-Stage Double Bootstrap Data Envelopment Analysis for Efficiency Evaluation of Shared-Bicycle Stations in Urban Cities. Transp. Res. Rec. 2020. [Google Scholar] [CrossRef]
  32. Chen, Y.; Chen, Z.; Xu, G.; Tian, Z. Built-up land efficiency in urban China: Insights from the General Land Use Plan (2006–2020). Habitat Int. 2016, 51, 31–38. [Google Scholar] [CrossRef]
  33. Zhu, X.; Zhang, P.; Wei, Y.; Li, Y.; Zhao, H. Measuring the efficiency and driving factors of urban land use based on the DEA method and the PLS-SEM model—A case study of 35 large and medium-sized cities in China. Sustain. Cities Soc 2019, 50, 101646. [Google Scholar] [CrossRef]
  34. Deilmann, C.; Hennersdorf, J.; Lehmann, I.; Reißmann, D. Data envelopment analysis of urban efficiency—Interpretative methods to make DEA a heuristic tool. Ecol. Indic. 2018, 84, 607–618. [Google Scholar] [CrossRef]
  35. Pouriyeh, A.; Khorasani, N.; Lotfi, F.H.; Farshchi, P. Efficiency evaluation of urban development in Yazd City, Central Iran using data envelopment analysis. Environ. Monit. Assess. 2016, 188, 618. [Google Scholar] [CrossRef] [PubMed]
  36. Huang, D.Q.; Hong, L.X.; Liang, J.S. Analysis and Evaluation of Industrial Land Efficiency and Intensive Use in Fujian Province. Acta Geogr. Sin. 2009, 64, 479–486. [Google Scholar]
  37. Hong, H.; Xie, D.; Liao, H.; Tu, B.; Yang, J. Land use efficiency and total factor productivity—Distribution dynamic evolution of rural living space in Chongqing, China. Sustainability 2017, 9, 444. [Google Scholar] [CrossRef] [Green Version]
  38. Lovell, C.A.K. Production frontiers and productive efficiency. In The Measurement of Productive Efficiency: Techniques and Applications; Fried, H., Lovell, C.A.K., Schmidt, S.S., Eds.; Oxford University Press: New York, NY, USA, 1993. [Google Scholar]
  39. Battese, G.E.; Coelli, T.J. A model for technical inefficiency effects in a stochastic frontier production function for panel data. Empir. Econ. 1995, 20, 325–332. [Google Scholar] [CrossRef] [Green Version]
  40. Battese, G.E.; Coelli, T.J. Frontier production functions, technical efficiency and panel data: With application to paddy farmers in india. J. Product. Anal. 1992, 3, 153–169. [Google Scholar] [CrossRef]
  41. Tian, D.S. Intensive urban land use in Western China. J. Chang’an Univ. Nat. Sci. Ed. 2010, 30, 100–104. (In Chinese) [Google Scholar]
  42. Zhu, Z.Y.; Miao, J.J. Countermeasure on the coordinative degree of urban land use and ecological economy of Chengdu-Chongqing Urban Agglomeration. Urban Probl. 2017, 5, 58–66. [Google Scholar]
  43. Huang, L.X.; He, L. Evaluating intensive use of core urban land based on block scale: A case study of Yuzhong district, Chongqing. J. Southwest Univ. Nat. Sci. Ed. 2015, 37, 81–88. (In Chinese) [Google Scholar]
  44. Lu, C.Y.; Wen, F.; Yang, Q.Y. Path analysis of influence factors of urban land use structure: A case study of Chongqing. Sci. Geogr. Sin. 2012, 32, 936–943. (In Chinese) [Google Scholar]
  45. Kumbhakar, S.C. Stochastic Frontier Analysis; Cambridge University Press: Cambridge, UK, 2000. [Google Scholar]
  46. Wang, L.J.; Li, H.; Shi, C. Urban land-use efficiency, spatial spillover, and determinants in China. Acta Geogr. Sin. 2015, 70, 1788–1799. [Google Scholar]
  47. Paulsen, K. Geography, policy or market? New evidence on the measurement and causes of sprawl (and infill) in US metropolitan regions. Urban Stud. 2014, 51, 2629–2645. [Google Scholar] [CrossRef]
  48. Li, Y.L.; Shu, B.R.; Wu, Q. Urban land use efficiency in China: Spatial and temporal characteristics, regional difference and influence factors. Econ. Geogr. 2014, 34, 133–139. (In Chinese) [Google Scholar]
  49. Wang, J.T.; Ji, K.W. An empirical research on the factors influencing urban land intensive use: Based on the data of 34 sample cities in China. Econ. Geogr. 2009, 29, 1172–1176. [Google Scholar]
  50. Wu, C.; Wei, Y.D.; Huang, X.; Chen, B. Economic transition, spatial development and urban land use efficiency in the Yangtze River Delta, China. Habitat Int. 2017, 63, 67–78. [Google Scholar] [CrossRef]
  51. Mahmoud, H.; Divigalpitiya, P. Spatiotemporal variation analysis of urban land expansion in the establishment of new communities in Upper Egypt: A case study of New Asyut city. Egypt. J. Remote Sens. Space Sci. 2019, 22, 59–66. [Google Scholar] [CrossRef]
  52. Coelli, T.J.; Battese, G.E. Identification of factors which influence the technical inefficiency of Indian farmers. Aust. J. Agric. Econ. 1996, 40, 103–128. [Google Scholar] [CrossRef]
  53. Cen, X.; Wu, C.; Xing, X.; Fang, M.; Garang, Z.; Wu, Y. Coupling intensive land use and landscape ecological security for urban sustainability: An integrated socioeconomic data and spatial metrics analysis in Hangzhou city. Sustainability 2015, 7, 1459–1482. [Google Scholar] [CrossRef] [Green Version]
  54. Wang, Z.; Chen, J.; Zheng, W.; Deng, X. Dynamics of land use efficiency with ecological intercorrelation in regional development. Landsc. Urban Plan. 2018, 177, 303–316. [Google Scholar] [CrossRef]
  55. Wu, K.Y.; Zhang, H. Land use dynamics, built-up land expansion patterns, and driving forces analysis of the fast-growing Hangzhou metropolitan area, eastern China (1978–2008). Appl. Geogr. 2012, 34, 137–145. [Google Scholar] [CrossRef]
  56. Jiang, W.; Cai, Y.; Tian, J. The application of minimum cumulative resistance model in the evaluation of urban ecological land use efficiency. Arab. J. Geosci. 2019, 12, 714. [Google Scholar] [CrossRef]
  57. Yang, X.; Wu, Y.; Dang, H. Urban land use efficiency and coordination in China. Sustainability 2017, 9, 410. [Google Scholar] [CrossRef] [Green Version]
  58. He, S.; Yu, S.; Li, G.; Zhang, J. Exploring the influence of urban form on land-use efficiency from a spatiotemporal heterogeneity perspective: Evidence from 336 Chinese cities. Land Use Policy 2020, 95, 104576. [Google Scholar] [CrossRef]
  59. Zhao, X.F.; Huang, X.J.; Chen, Y.; Chen, Z.G. Research progress in urban land intensive use. J. Nat. Resour. 2010, 25, 1979–1996. [Google Scholar]
  60. Halleux, J.M.; Marcinczak, S.; van der Krabben, E. The adaptive efficiency of land use planning measured by the control of urban sprawl. The cases of the Netherlands, Belgium and Poland. Land Use Policy 2012, 29, 887–898. [Google Scholar] [CrossRef]
  61. Li, C.; Gao, X.; He, B.J.; Wu, J.; Wu, K. Coupling coordination relationships between urban-industrial land use efficiency and accessibility of highway networks: Evidence from Beijing-Tianjin-Hebei urban agglomeration, China. Sustainability 2019, 11, 1446. [Google Scholar] [CrossRef] [Green Version]
  62. Yin, G.; Lin, Z.; Jiang, X.; Qiu, M.; Sun, J. How do the industrial land use intensity and dominant industries guide the urban land use? Evidences from 19 industrial land categories in ten cities of China. Sustain. Cities Soc. 2020, 53, 101978. [Google Scholar] [CrossRef]
  63. Xie, H.; Chen, Q.; Lu, F.; Wu, Q.; Wang, W. Spatial-temporal disparities, saving potential and influential factors of industrial land use efficiency: A case study in urban agglomeration in the middle reaches of the Yangtze River. Land Use Policy 2018, 75, 518–529. [Google Scholar] [CrossRef]
  64. Tu, F.; Yu, X.; Ruan, J. Industrial land use efficiency under government intervention: Evidence from Hangzhou, China. Habitat Int. 2014, 43, 1–10. [Google Scholar] [CrossRef]
  65. Xiong, Y.; Chen, Y.; Peng, F.; Li, J.; Yan, X. Analog simulation of urban construction land supply and demand in Chang-Zhu-Tan Urban Agglomeration based on land intensive use. J. Geogr. Sci. 2019, 29, 1346–1362. [Google Scholar] [CrossRef] [Green Version]
Figure 1. Geographical location of the research area and its land use patterns.
Sustainability 12 08623 g001
Figure 2. Evolution of the level of the intensive urban land use in grouped districts and counties of Chongqing.
Sustainability 12 08623 g002
Figure 3. Technical efficiency of urban land use in districts and counties of Chongqing in 2018.
Sustainability 12 08623 g003
Figure 4. Evolution of the potential for intensive urban land use in grouped districts and counties from 2009–2018.
Sustainability 12 08623 g004
Figure 5. Evolution of proportion of intensive urban land use potential in grouped districts and counties of Chongqing from 2009–2018.
Sustainability 12 08623 g005
Figure 6. The scale of land-saving potential for districts and counties of Chongqing in 2018.
Sustainability 12 08623 g006
Figure 7. The proportion of land-saving potential for districts and counties of Chongqing in 2018.
Sustainability 12 08623 g007
Table 1. Statistical description of variables.
VariablesDescriptionMeanMedianStandard deviationMinimumMax
Input-Output
Land area for constructionkm2160.01153.7973.5117.94417.08
GDPin 100 million Yuan315.29217.11277.4119.551235.61
Fixed capital investmentin 100 million Yuan295.92238.12209.729.921264.53
Water consumption10 thousand tons11,107.97581.4914,867.0553798,051
Number of employees10 thousand units32.6429.2316.626.1775.68
Influential Factors
Land use structure%13.259.3413.121.1977.22
Population density10 thousand/km20.280.220.17270.104.00
Openness%13.692.8136.530.01254.95
Transportation conveniencekm/km218.8015.5713.953.0690.99
Education expenditure intensity%/km232.9629.4818.664.03113.99
Table 2. Regression results of the technical efficiency model.
VariablesModel 1Model 2Model 3Model 4Model 5
Const.3.9219(3.26) ***3.7454(3.15) ***1.5073(7.45) ***3.5162(6.34) ***2.5939(7.30) ***
LnLL1.7265(3.57) ***1.6115(3.56) ***0.2715(6.18) ***0.2548(5.89) ***1.0909(4.60) ***
LnKL−0.6425(−1.45)−0.3902(−1.58)0.1416(3.89) ***0.1316(3.56) ***0.1675(4.62) ***
LnWL−0.0257(−0.09)0.0210(0.07)0.0937(3.46) ***0.0989(6.34) ***0.0823(3.05) ***
t0.1327(2.06) ** 0.0570(7.28) *** 0.0576(8.39) ***
LnLL20.1945(3.41) ***0.1942(4.00) *** 0.1271(3.05) ***
LnKL2−0.0064(−0.08)−0.0184(−0.54)
LnWL2−0.0049(−0.26)−0.00004(−0.00)
t20.0003(0.17)
LnLL × LnKL−0.1385(−1.31)−0.1305(−2.42) **
LnLL × LnWL−0.0409(−0.77)−0.0106(−0.21)
LnKL × LnWL0.0973(1.63)0.0344(1.16)
LnLL × t−0.0043(−0.26)
LnKL × t−0.0143(−0.73)
LnWL × t−0.0132(−1.46)
μ0.7882(4.38) ***0.6539(4.36) ***0.7666(5.79) ***2.4003(4.49) ***0.5425(4.35) ***
η−0.0075(−0.48)0.0264(2.72) ***0.0323(4.91) ***0.0317(5.10) ***0.0408(5.32) ***
  σ ε 2   0.1971(2.75) ***0.1328(3.24) ***0.1256(3.73) ***0.1244(4.19) ***0.1097(3.31) ***
γ0.9247(32.17) ***0.8839(23.45) ***0.869(23.49) ***0.869(25.99) ***0.853(18.22) ***
Log likelihood169.4734165.1070153.1337153.1937159.4391
Note: ** and *** in the table represent the significance levels of 5% and 1%, respectively. The values in parentheses are the corresponding t statistics.
Table 3. Regression results of the factor analysis on the intensive urban land use.
VariablesFEREVariablesOne-Step
Const.−0.967 ***(−6.40)−0.342 ***(−3.72)Const.−0.902 ***(−6.78)
LnEduEpx−0.033 **(−2.56)−0.033 **(−2.44)LnEduEpx−0.231 ***(−3.66)
LnOpen0.006(1.64)0.004(1.10)LnOpen−0.003(−0.45)
LnTransp−0.092 ***(−5.47)−0.144 ***(−10.40)LnTransp−0.018 **(−2.31)
LnLandS−0.417 ***(−9.49)−0.265 ***(−9.47)LnLandS−0.065 **(−2.25)
LnPopD−0.566 ***(−15.39)−0.476 ***(−14.44)LnPopD−0.255 ***(−4.61)
R Square0.7890.785Log Likelihood119.56
Hausman test   χ 2 = 41.01 , choose FE model
Note: **, and *** in the table represent the significance levels of 10%, 5% and 1% respectively. The values in parentheses are the corresponding t statistics.
Table 4. “One-step” regression results of factor analysis for sub-regions of Chongqing.
VariablesMain City Metropolitan AreaNortheast ChongqingSoutheast Chongqing
Const.1.1642 ***(4.45)0.7425 ***(2.75)−2.9503 ***(−6.32)
LnEduEpx−0.3374 ***(−5.41)−0.2857 ***(−5.27)−0.3234 ***(−5.75)
LnOpen−0.0361 *(−1.84)0.0014(0.12)0.0038(0.32)
LnTransp−0.0566 **(−2.27)−0.1786 **(−2.14)−0.0934 **(−2.17)
LnLandS0.0267(0.71)−0.1729 ***(−2.59)−0.2659 **(−2.18)
LnPopD−0.0598 ***(−2.89)−0.3502 ***(−4.38)−1.4556 ***(−6.48)
Log Likelihood58.937956.064667.3775
Note: *, **, and *** in the table represent the significance levels of 10%, 5% and 1% respectively. The values in parentheses are the corresponding t statistics.
Publisher’s Note: MDPI stays neutral with regard to jurisdictional claims in published maps and institutional affiliations.

