Abstract
The impact of sea-level rise on coastal towns is expected to be a major challenge, with millions of people exposed. The climate-induced risk assessment of coastal areas subject to flooding plays an essential role in planning effective measures for adaptation plans. However, in European legislation, as well as in the regional plans adopted by the member states, there is no clear reference to urban settlement, as this concept is variable and difficult to categorise from the policy perspective. This lack of knowledge makes it complicated to implement efficient adaptation plans. This research examines the presence of the issue in Portugal’s coastal settlements, the European coastal area most vulnerable to rising sea levels, using the case of seashore streets as the most exposed waterfront public urban areas. Using the morphometric classification of the urban fabric, we analyse the relationship between urban typology and legislative macro-areas aimed at providing integrated adaptation plans. The study suggests that there is only a minimal relationship between the proposed classification and the geographical zones currently identified in coastal planning policies. Such incongruence suggests the need for change, as the policy should be able to provide a response plan tailored to the specificities of urban areas.
1. Introduction
Sea level change is one of the most apparent consequences of climate change [1], with an impact on both societies and the environment [2]. Global mean sea level (GMSL) has risen by about 16.2 cm since 1900, and according to the Intergovernmental Panel for Climate Change (IPCC), it “will continue to rise well beyond 2100 (high confidence). Increasing global warming will amplify further the exposure of small islands, low-lying coastal areas and deltas to the risks associated with sea level rise (SLR) with impact on human and ecological systems, including increased saltwater intrusion, flooding and damage to infrastructure” [3] (p. 32).
Historically, coastal zones have attracted humans for their rich resources; for logistical activities, as they offer access points to marine trade and transport; for recreational or cultural activities; or simply because of their special sense of place at the interface between land and sea. The associated coastal growth, land conversion and urbanisation have therefore exposed increasingly large numbers of people and assets to existing hazards and sea level rise and related effects, with repercussions on the levels of risk and vulnerability directly along coastlines and in populated deltas [4].
The effects of sea level rise on coasts are not uniform, but vary considerably geographically and over a range of temporal scales; further, there is no uniform characterisation of coastal zones [4]. The assessment of the vulnerability of coastal zones subject to SLR flooding plays an important role in planning measures to tackle coastal flooding risk assessment and adaptation [5]. Over the past two decades, scientists have developed several approaches to identify coastal vulnerability (Coastal Vulnerability Index, CVI) [6], which are being transformed into policy documents. In 2007 the EU issued Directive 2007/60/EC [7], which requires each member state to carry out a preliminary assessment and mapping of river basins and coastal areas at risk of flooding due to climate change, in order to mitigate risks to human health, the environment, cultural heritage and economic activity. Although Chapter 13 of the Directive states that “flood risk management plans should therefore take into account the particular characteristics of the areas they cover and provide for tailored solutions according to the needs and priorities of those areas” [7], there is no mention of the urban agglomeration.
The planning framework of the coastal strip is characterised by a fragmentation between state, regional and local competences and implementation tools. It should be noted that in the national flood risk maps issued by the member states, there is no definition of urban areas in the subdivision of the coast into administrative geographical regions. Therefore, in 2018, the European Court of Auditors sought to establish through the Floods Directive [8] whether the flood risk prevention, protection and preparedness activities implemented under the 2007 Directive were based on sound analysis and whether they were effective (the member states implemented the Directive in five stages: 1—preliminary flood risk assessment, 2—areas of potential significant flood risk (APSFR), 3—flood hazard maps, 4—flood risk maps, 5—flood risk management plan (PGRA)). The Court found that in the PGRA implementation plans (the Legislative Decree, issued according to the European Directive 2007/60/EC, introduced Flood Risk Management Plans (PGRA) as a mandatory requirement for the mapping of areas at risk through the identification and assessment of the damage), the flood risk management plans issued by the member states contain gaps in the spatial planning of flood risk management [8] (paragraph III), not integrating it with the impact of climate change (paragraph 80) or natural and man-made territory. In the first cycle of implementation of the Floods Directive, the member states with a coastline (Bulgaria, Spain, Italy, the Netherlands, Romania and Slovenia) visited by the Court’s auditors had generally defined specific areas with significant potential flood risk in coastal areas, except for Portugal (paragraph 83). The methodology used by the member states in defining coastal areas at risk of flooding did not identify cities and infrastructure in coastal regions as parameters for mapping (see paragraphs 83 to 85 to 111). The implementation objective requested by the Commission to the member states in July 2019 was the modelling of appropriate tools to better analyse and predict the effects of climate change in flood and coastal flood risk management to be integrated into PGRAs. In existing European legislation, the assessment of flood risk areas is the responsibility of the river basin authority, i.e., the planning activity takes place at the geographical district level of the river basin, excluding the city as the subject of study. The governance of resources for the planning of flood risk areas is proving to be a real test case for the models adopted (or in the process of being adopted) in the member countries of the European Union. The laws of the European states must ensure the existence of a regulatory system to coordinate the territorial bodies for adaptation to climate change, in order not to incur new infringement proceedings before the Court of Justice of the EU for inefficiency and ineffectiveness in flood risk management.
This paper demonstrates the limit of existing policy for climate adaptation to adequately capture the specificity of the urban form of coastal towns, due to the systemic complexity of urban forms being often overlooked when policies are formulated [9]. The proposed study provides an innovative methodology for the definition of a subdivision framework for climate adaptation planning. In the case of Portuguese coastal legislative plans (the EU Directive 2007/60/EC was transposed into national law in 2010 by Decree-Law No 115/2010 of 22 October 2010, and risk mapping is the responsibility of the Environment Agency (APA), as the national water authority), the approaches currently adopted for flood mitigation and management tend to omit the urban form of settlements and its relation to the risk of coastal flooding at local [10] and temporal scales [11]. To analyse the issue, we use the case study of 30 seashore streets, the most affected areas of Portuguese coastal towns, Europe’s most vulnerable coastal area, illustrating the incongruence between the implemented legislation and the efficient models of adaptation coordination.
2. Portugal’s Legislative Coastal Programmes
Following the extreme weather events of 2002, 2009 and 2014, the Portuguese Environment Agency (APA), as a national authority, opened a public tender for flood risk mapping in mainland Portugal in 2014. The Portuguese legislative coastal programme (POC), which resulted from this call, divides the coast into six macro homogeneous zones (Figure 1), each covering a strip along the coast with a width of 500 m in the terrestrial area, but going up to 1000 m when justified by the need to protect coastal biophysical systems, and a maritime strip of up to 30 m bathymetric, including areas under port jurisdiction. The six macro zones were selected from a historic classification, and on them hinge both the current assessment and the prevention strategies. This paper assesses this fundamental classification system.
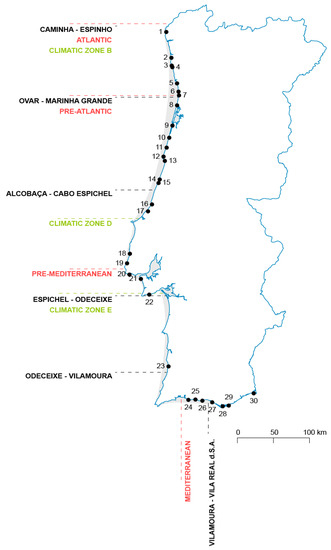
Figure 1.
Location of seashore streets on the Portuguese coast overlaid with Portuguese legislative coastal programme (POC) zones (black), geographical zones defined by Ribeiro [12] (red) and climatic zones defined by Carvalho [13] (green). The key to the numerical IDs is part of Figure 2 and Appendix A Table A1. Source of boundary data: Portuguese Hydrographic Institute (IHPT)/Instituto Hidrográfico (IHPT).
A reference text in the literature that deals with the similar geographical division of Portuguese territory is by the geographer Orlando Ribeiro, “Portugal, o Mediterrâneo e o Atlântico” [12]. Ribeiro identified four geographical regions: North Atlantic, Pre-Atlantic, Pre-Mediterranean and Mediterranean (Figure 1), whose geographical boundaries coincide with orographic reliefs, river basins, soil conformation and different plant cover characteristics. He suggested that in the hierarchy of divisions, the separation between North and South is marked, and that the greatest variety is found on the coast between the Douro River, Porto and the Sado River, Setúbal. On top of that, according to a climatic subdivision, the Portuguese coast is divided into two zones: Atlantic (northern and central part), and Mediterranean (southern part), which can be subdivided into three climate zones (Zones are called B, D and E, following Carvalho [13].): B (northern coast), D (Lisbon + Sétubal) and E (Algarve + southern coast) (Carvalho 2003).
Special regional coastal programmes (POC) have a national scope, taking precedence over inter-municipal and municipal territorial plans. They aim to safeguard resources and natural values, through guiding and management principles and standards. However, POCs exclude the physical structure of the territory (geological and hydrogeological conformation) in relation to the altimetric and bathymetric variations of the ocean and climate, as well as the morphological characteristics of urban settlements. This leads to legislative and technical difficulties in the definition of areas at risk and in the structured intervention of adaptation of towns. Therefore, an alternative classification of coastal settlements is necessary to deliver an efficient coordinated response reflecting the local needs.
2.1. Climate Change Effects, the Portuguese Case
The Portuguese coast extends for 943 km and could be, on the top level, divided into two parts. The western part, in the north-south (NS) direction, is bounded on the north by the Minho River and on the south by Cape San Vicente, which separates it from the eastern part, orientated in the east-west (EW) direction, extending to the Guadiana River. It can be classified, through simplification, in three main types, based on the geomorphology: extensive low and sandy beaches bounded by dunes; wetlands (estuaries, lagoons) and reef islands; hardened and steep coasts [14]. About 70% of the population of Portugal inhabits the coastal zone [15], where most of the larger cities are situated; this rises to 80% in the summer months, esp. in the Algarve region (South of Portugal), whilst the main economic activities along the coast contribute to about 85% of the national Gross Domestic Product (GDP) [16].
The two Portuguese coasts, NS and EW, suffer different storm phenomena, due to different wind directions. On the NS coast, the northwest wind is the most dramatic [17,18], often with dramatic consequences for the coastline [14]. The EW coast is not exposed to the wave components predominant in the NS coast—the most frequent storms come from the southwest (SW) [17].
The phenomena of flooding and erosion, due to SLR, are particularly strong along the NS Portuguese coast compared to the rest of Europe, due to the strength of the ocean currents which Portugal faces, especially when they combine with winds from the SW. Along the 943 km of coastline, it is estimated that the areas affected by extreme tide flooding and SLR will be 903.1 km2 in 2050, affecting 59,530 buildings and 145,550 residents; this will increase to 1146 km2 (river delta areas are included in the estimate), with 82,000 buildings and 224,830 residents in 2100 (in regard to the relative average contemporary sea level on the Portuguese coast, reference is made to the Cascais tide gauge data) [19]. The estimated acceleration of SLR, compared to the 1990 rate, is 47 cm in 2100 [20].
Aware of this increasing coastal vulnerability, predictive models to forecast where erosion hazards will be highest must be developed and reliable [21]; furthermore, planning must now allow for the integration of SLR rise and other aspects of climate change [22]. The European Parliament and the Council of the European Union (EU), through their Floods Directive 2007/60/EC, require each member state to carry out a preliminary assessment to identify the river basins and associated coastal areas with a significant flooding risk due to climate change. In the European Directive, the regulation focuses more on river basins and associated coastal areas, and not specifically on oceanic coastal areas; this leads to planning difficulties. In Portugal, the Directive was transposed into national legislation by Decree-Law No. 115/2010 of 22 October.
2.2. Seashore Streets
Aside from a geological and geographical classification, it is useful to introduce a more precise assessment of coastal settlement types, recognising that their exposed areas will be the most affected by SLRs. The characteristics of the sandy or rocky coast have influenced urbanisation and land use. The sandy coasts allowed for an easier approach to the sea, with mooring on the sand, favouring the mixing of houses and boats; settlements on the rock, on the other hand, responded to the need for protection from the sea and invasions.
On the Portuguese coast, the public space bordering the sea is morphologically different in each coastal town, although some similarities can be identified through the concept of seashore street. Thirty settlements interface the water through the street. The seafront is, therefore, a linear urban space, on the one side limited by buildings and on the other open towards the ocean, where spaces of aggregation such as squares and wide-open spaces develop.
The formation process of seashore streets began through simple landfill and regularisation. In the first phase of occupation, several defensive elements like seawalls and fortresses were built to protect towns from piracy; later, essential articulation systems were included between the towns and water, acting as ramps, stairs, piers or docks. The conformation of the seashore’s proto-urban spaces often stemmed from the functions assumed by the marginal buildings [23].
The construction of seashore streets began in 1930/1940 in the NS coastal towns. Until then, the space between the buildings and the sea, the beach, was a backstage of the city, used as a storage space for boats and fishing. In the stretches of low and sandy coast, the seashore street was built directly on the beach. Where there was an ancient defensive wall, it was transformed into a perimeter wall to support the construction of the seashore street, to which were added ramps and stairs that served the role of articulation with the beach and the sea. These elements were the embryo of the “seashore street” [23] that became, from the 19th century onwards, a representative place in both cartographic iconography and, later, photography.
The geomorphological characteristics of the coastal area combined with a mild climate have transformed the Portuguese coast into one of the best natural resources of Europe, extensively exploited for tourism since the 1960s [10], especially in the Algarve region (EW). Due to new tourism dynamics, coastal settlements began to be expanded, and seashore streets were built.
This research focuses on the element of the seashore street in Portugal as a trial of an approach to coastal settlement classification different from the one offered by the POC. Since the life span of urban infrastructure covers several decades or centuries, sustainable development requires the consideration of potential climate change impacts and sea level rise at an early stage of the planning process in order to avoid future costs [1].
2.3. Quantitative Assessment of Seashore Streets
The Portuguese coastal towns and their seashore streets are characterised by different urban tissues (urban tissue is here defined as “[a] distinct area of a settlement in all three dimensions, characterised by a unique combination of streets, blocks/plot series, plots, buildings, structures and materials and usually the result of a distinct process of formation at a particular time or period.” [24] (p. 89)), varying across the coast. To date, we are not aware of a coherent study of their morphological patterns, and due to the length of the Portuguese coast, such a study, capturing all of them, would be demanding using traditional qualitative methods of urban morphology. Urban Morphometrics (UMM), the quantitative science of urban form, offers a relatively new way of characterising different urban form patterns [25,26]. UMM employs measurable morphometric characters (or urban form characters) [27] to describe the shape and configuration of individual elements of urban form in a way that is automatised [28], hence enabling large-scale and inherently unbiased studies, as measuring algorithms are applied consistently across the whole study area.
In the case of Portuguese seashore streets, UMM allows us to study all selected coastal towns at once and compare their urban tissues in a rigorous and systematic way. Consequently, it might also allow us to combine analytic data of urban morphology and spatial planning instruments in later phases.
Drawing on the previous works [26,29], morphometric characters can be used to describe and distinguish different types of urban form. We assume that the classification resulting from morphometric analysis would partially coincide with the divisions suggested by Ribeiro [12] and implemented in the POC. However, since geographical and environmental perspectives are only two types of influence shaping coastal towns, and since the form of cities is not reflected, we also expect to find a difference between our morphological classification and the two classifications under scrutiny. UMM will likely provide different groups, on which the intervention could then be designed. We argue that the response to the changing climatic conditions and the related increase of severe flooding issues should also include the detection of the urban form of each place, along with environmental conditions, to allow for the most effective and coordinated response.
3. Building a Methodology to Address Climate-Induced Risk Assessment, Using the Portuguese Case
3.1. Data Acquisition
The case study focuses on all seashore streets existing along the Portuguese coast. To analyse their urban form, the area of seashore street is extended to the immediate context of up to two blocks (where there is no other barrier, e.g., railway), thus providing enough urban form in terms of a number of blocks, streets and fronts to characterise each case. Because some of the cases are heterogeneous in terms of historical origin and urban pattern, these are split into sub-cases, and where each is part of different origins, form is assessed individually.
For each case, building footprints and street networks are used to capture their urban form in vector format. Due to the limited availability of existing data capturing building footprints in Portugal, building data are manually digitised and, when available in sufficient level of detail, merged with existing data extracted from OpenStreetMap [30]. Street network data are extracted completely from OpenStreetMap and then cleaned to ensure that the network has a correct topology, using OSMnx [31]. Furthermore, the network is manually checked to match the digitised building layer and thus represent a morphological network of spaces rather than a transportation one of uses (dual carriageways and roundabouts removal). The application of the method in the different context should revisit both the definition of the study area and used data sources to gain the optimal results tailored to the aims of each study.
3.2. Measuring Urban Form
To perform a comprehensive morphometric analysis, three fundamental elements-buildings, streets and plots [32] should be analysed. However, morphological plots are not available for the selected cases and are in general difficult to identify, depending to a degree on human interpretation. Such a situation is common. To overcome this problem, previous research [33] proposed a method of spatial partitioning called morphological tessellation (MT), which was later refined and tested [34,35]. For certain types of morphometric analysis, MT is a viable proxy of morphological plot and can be used as a basic unit of spatial division. Because MT is derived from building footprints, it is an ideal approach for the data used within this study context. In principle, MT delineates influence zones around individual buildings using the Voronoi tessellation algorithm applied to building footprint polygons. Resulting cells then form a contiguous pattern, which in most cases resembles the plot pattern.
The morphometric analysis leading to the classification of individual cases consists of three phases. The first involves the measurement of 32 primary morphometric characters partially extracted from the Table of Urban Form Characters [27] and partially designed for the purpose of the analysis of seashore streets and their configuration with respect to the available data layers. The second phase collates all elements pertaining to each case and uses them to describe each of the cases as a whole, using case-level values representing the statistical distribution of each measured primary character. The final phase analyses and interprets all the numerical relationships between the cases to determine the similarity of urban patterns.
The primary morphometric characters (Table 1) describe each of the individual buildings, streets and tessellation cells through their dimensions, shapes and spatial distribution and intensity. Due to the small spatial extent of seashore streets and their specific location on the edge of the network, connectivity was limited to meshedness (leaving out characters such as centrality, due to the adverse edge effect making potential results unreliable). The selection of character is tailored to the case study of Portuguese seashore streets and is by no means fixed. It is expected that each coastal assessment will work with the set specifically identified for the geographic context and depending on the available data.

Table 1.
Morphometric characters used to characterise selected case studies. The name of each character is composed of its index and element [27].
However, because these characters describe individual elements of urban form, they are then aggregated to represent the selected cases as a whole. For this purpose, we introduced the second level of morphometric characters (Phase 2), called “case-level characters”, which take primary characters as input and measure their tendency across the whole seashore street. Case-level characters are of four types, one capturing the central tendency of the absolute values and three capturing the properties of distribution of measured values within the study area.
The central tendency captures average values as a truncated (interquartile) mean, which combines the robustness of the median (as the top and bottom 25% of values are omitted) with the responsiveness of the mean (50% of the data is still used to measure central tendency). To capture the diversity of values within the study area, we measured the interquartile range capturing the spread of the middle 50% of distribution in absolute units and the Theil index of inequality [43] measured on the interdecile range (top and bottom 10% of values are omitted to limit an effect of outliers). Theil index is a measure of inequality, much like the better-known Gini index, but it can be split into its spatial and aspatial components, making it more suitable for spatial analysis of this type. Each of the seashore streets was represented by 96 case-level characters describing the distribution of each of the primary characters. Case-level values were then analysed using the clustering algorithm.
3.3. Hierarchical Agglomerative Clustering
The current legislative split of Portuguese seashore streets into groups follows only geographical and environmental aspects. The purpose of clustering is, therefore, to identify a split according to the urban form to ascertain whether they overlap or not, and propose an alternative approach to the categorisation of seashore streets to deliver a more responsive interpretation in terms of climate adaptability. Using the case-level characters (Phase 2 of UMA), we implemented a hierarchical agglomerative clustering based on Ward’s algorithm [44] to determine the morphological relationship between our selected case studies (Phase 3). Ward’s minimum variance method attempts to minimise the total within-cluster variance and generate results in the form of a hierarchical tree (dendrogram), which can then be interpreted and used for the classification we seek. Compared to other methods, Ward’s agglomerative clustering tends to be significantly more successful in detecting population clusters [45], which makes it optimal for our purpose. Comparing the dendrogram interpretation with the classification based on the POC allows us to assess the existing methods and potentially propose a change of the classification.
3.4. Sea Level Rise Scenario
Given the uncertainty of projection models, the question of the assessment of coastal hazard and vulnerability is not whether or not such extreme levels will occur, but when they will occur, whether they will be as late as 2100 or 50 years earlier. Due to the continuous rise of MSL, the maximum tidal levels reached with the NOAA extreme hazard projection in 2100, with 4.55 m of height (for 0.1% submersion), and could be reached in a different period, according to the intermediate hazard projection [5]. “What if?” methodologies can also be quoted as a way to separate the testing of future possible scenarios from the need to predict their exact time of occurrence [46].
We, therefore, modelled these extreme conditions and assessed how they would affect seashore streets, in particular, to understand the relation of morphometric classification and the severity of projected flooding, and hence the potential of such classification for climate-adaptation policy change. To do so, we modelled SLR to +5 m of the height based on the digital terrain model of Portuguese coast (provided by Direção-Geral do Território, DGT) and assessed the percentage of the area of each case study which would be affected either by frontal or lateral flooding. It is necessary to underline that in the flooding vulnerability scenarios realised in this article the topographic model of reference is the current one, that is, the geospatial assessment does not account for future coastal erosion [5,46].
The resulting data were then linked to the morphometric clustering to understand the relation between urban form and severity of flooding.
Due to the effect of SW winds on wave height and potential severity of flooding, the deviation of the seashore street orientation from the SW direction was measured. The deviation is expressed as a ratio between 0, where a street is parallel to SW wind and its effect on flooding is minimised, and 1 where a street is perpendicular to the SW direction, and hence directly exposed to the most severe wind-induced waves. Such an assessment can further inform the climate policy, as it allows for an effective prioritisation of affected cases. In any case, the sea level rise scenario is an illustrative example, as the core of this paper lies in the hierarchical clustering and its relation to policy-based geographies.
Reproducible code used for the analysis is available as a supplementary material S1.
4. Results: Application of the Proposed Methodology
4.1. Hierarchical Clustering
The results of hierarchical clustering based on case-level characters are shown in Figure 2. The resulting dendrogram denotes a morphometric relationship between different cases, where the horizontal axis captures the cophenetic distance (the level of dissimilarity) between observations. Based on the cophenetic distance taken as a threshold of dissimilarity, we can interpret the pool of our cases as divided into either three or six clusters. As we can always aggregate clusters together, the analysis and discussion will take into account the division into six clusters of relatively equal size, comprising between 5 to 8 cases per cluster. The exception is cluster D, in grey colour, which includes Carvoeiro, Azenhas do Mar and Esposende and can be interpreted as an outlier in the whole pool due to its morphological incoherency (these three cases can be seen as other in terms of classification).
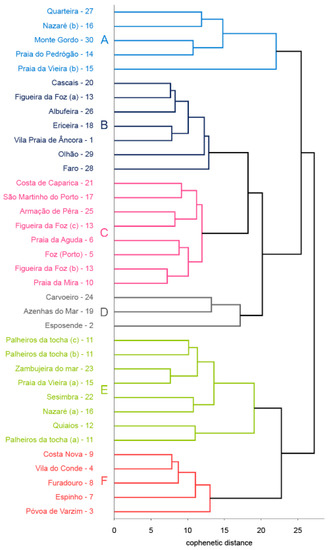
Figure 2.
Dendrogram denoting the cophenetic relationship between selected cases based on their morphometric profiles. Colours represent distinct interpretative types of seashore streets according to their physical form.
The geographical distribution of recognised clusters as plotted in Figure 3 shows that unlike POC zones, morphological clusters are generally not associated with a single geographic area. However, there is one exception: cluster F, noted with red color, which is located in its entirety on the northern coast of Portugal, between Povoa de Varzim and Costa Nova. Even then, this cluster crosses two POC zones. The rest of the groups do not show any significantly predominant geographical location.
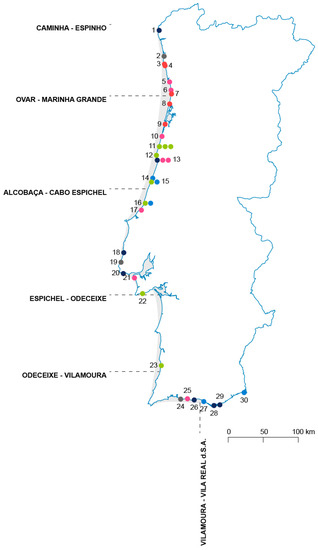
Figure 3.
Geographical distribution of cases according to their types overlaid with POC zones. Notice the minimal overlap of the two divisions. Colour coding and IDs refer to Figure 2.
4.2. SLR Scenario—Flooded Area and Hierarchical Clustering
The proposed method of SLR modelling based on digital terrain model interpolation captures both frontal and lateral flooding as a ratio of the area of a case study which would be flooded in the extreme case scenario. The illustrative Figure 4 shows three cases with modelled flooding prediction. These cases illustrate possible scenarios: from no area flooded at all (but in these cases the erosion risk needs to be taken into account), like in the case of Foz do Porto, through partially flooded areas (Sesimbra) to significantly flooded ones, like São Martinho do Porto. Of course, these simulations cannot have direct application to reality, as the behaviour of both the natural and the urban systems is more complex (e.g., in Sesimbra’s case, not only the red buildings would be affected, as shown in the simulation, but also the seashore street as a whole, for it would be interrupted, and the defensive system would be affected as a whole).
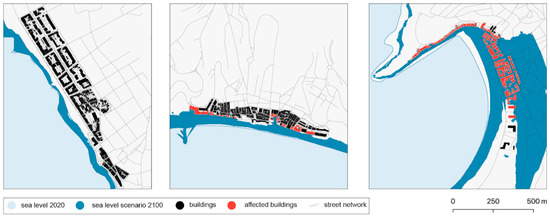
Figure 4.
Illustration of the flooding model based on “what if” scenario in Foz do Porto (left), Sesimbra (centre) and São Martinho do Porto (right). (Sea level data © DGT, street network data © OpenStreetMap contributors).
Figure 5 shows the ratio of affected areas in all cases. 23 out of 36 (64%) analysed cases would be moderately affected (i.e., flooded area is non-zero), whilst 12 cases (33%) would be affected significantly (i.e., more than 20% of the area would be flooded). These are alarming figures, especially taking into account that this risk does not include the erosion effects caused by SLR. Even though there are differences in the results among clusters, there does not seem to be a direct relationship between urban form and flooding risk. However, unlike the POC, this classification still allows for a coordinated response: if two or more towns of the same cluster need to develop adaptation plans, that can be coordinated on the ground of morphological similarity. This kind of targeting is not possible based on a geography-led division.
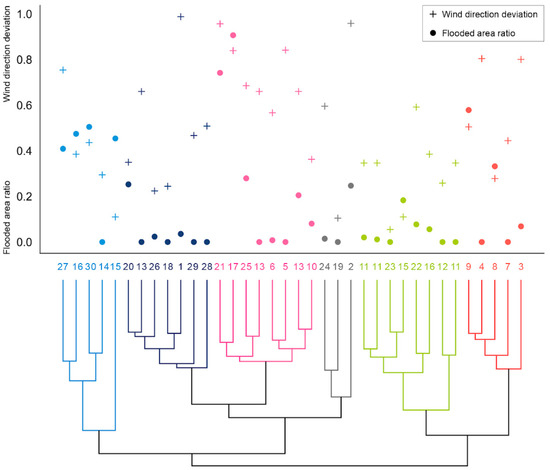
Figure 5.
Combined plot illustrating the relationship between individual cases, and their respective clusters, and flood risk, represented by the flooded area ratio and wind direction deviation. The higher the values are, the higher the projected risk.
The analysis of seashore street orientation in relation to SW wind direction bringing the highest waves shows that there is no tendency on the part of the urban form to either face or block SW wind, with a median deviation of 0.49, a standard deviation of 0.27 and a range covering the whole spectrum from parallel (Zambujeira 0.05) to perpendicular (Vila Praia 0.99).
The wind orientation in relation to flood risk either increases the probability that the frontal flooding will happen and be as severe as predicted (streets perpendicular to wind direction) or limits its effects (parallel streets).
Figure 5 shows both ratios on a combined plot, allowing us to identify cases which tend to be prone to flooding and at the same time open to SW winds. Such cases could be marked as the most vulnerable, and the initial climate response should first target them. The orientation of seashore streets has to be taken into account when prioritising the response, as it may significantly affect the real flooding risk. Based on the data presented in Figure 5, the most vulnerable locations in our pool of cases are São Martinho do Porto, Costa Caparica and, due to the orientation, Armação and part of Figueira da Foz, all belonging to the same morphological cluster (C), and Esposende (cluster D).
Considering only the relation of morphological clusters to the street orientation, there are further differences worth noting (keeping in mind that, due to the small number of cases, the interpretation is not statistically significant). Streets belonging to cluster E tend to be more parallel than perpendicular to the wind direction (median 0.35, st.dev 0.11), whilst the contrary is true for the streets in cluster C otherwise (median 0.67, st.dev 0.19), which makes this cluster more vulnerable. Such an assessment could be a useful indicator for planning policy [8], as it allows for an effective prioritisation of affected cases. Finally, as the elements of vulnerability correspond to different aspects of the concerned vulnerable systems when coastal planners and policymakers rely on the vulnerability assessments to inform their decision-making, they should fully understand and carefully apply the appropriate information [47].
5. Discussion
The most critical finding is that there is only a minimal relation between the morphological classification of seashore streets and the POC (Portuguese legislative coastal programme), which divides the coast into six geographical zones and design interventions for each. Whilst this division is able to reflect environmental differences in the form of geophysical and hydrogeological contexts, it does not take into account the nature of coastal urban settlements; nevertheless, we believe that it is necessary to incorporate in this legal instrument the recognition and characterisation of urban form in relation to oceanography (form and dynamics), to designate new vulnerability and risk plans. The POC should aim to provide a response plan tailored to the specificities of coastal areas; and yet because it follows environmental and geographical factors only, while the most urgent need is in towns, its effectiveness is limited.
The results obtained through morphological clustering show that the cases in the north partially coincide with the initial subdivision implemented by Ribeiro and with the Caminha-Espinho POC. However, the results regarding the other coastal cases are not directly associated with the geographical subdivision implemented by the POC. The geographical consistency in the North can be interpreted from a historical point of view, as the seashore streets in the North Coast were the first to be built as an urban element, and as such share a historical origin.
In regard to the flooding risk, which is represented as the ratio of land of a case study which could be affected under the extreme case scenario—and therefore a helpful proxy capturing the severity of the event—the form of a place becomes extremely important. In fact, even cases with a relatively low ratio (0.2) are significantly under threat, because such a value could, and in many cases does, affect the whole front row of buildings across the overall settlement. Localising the threat of flood based on form is therefore very useful. Scenario testing can bring the complexity of coastal interactions into focus and provide a better knowledge base for the planning process decisions [1].
However, flooding risk is only one of the potential proxies focusing on the most extreme cases. There is a range of less extreme scenarios which could be taken into account and used as an alternative proxy of flood risk assessment. Importantly, SLR can be amplified over time by erosion, which is a progressive phenomenon, and changes in the patterns and frequency of extreme phenomena, aspects that are not within the scope of this work. In the long term, continuous erosion will change the shape of coastal areas and further affect the flood risk. Within this research, it is assumed that the coast in 2100 remains as it is now and that extreme weather events maintain their characteristics. Since this is not the case, these assumptions are a limitation of the present simulation as a flooding prediction scenario.
SW wind works as an amplifier of extreme waves; hence, the orientation of seashore street may significantly affect the impact of extreme flooding. As the data above show, Portuguese coastal towns do not seem to be built to block any of the predominant winds (normally NW, and, in extreme conditions, SW). Apparently, other environmental and geographical aspects were more important during development, especially the orientation towards the coastline, which is mostly matched by the seashore street. However, two of the identified groups show an inclination of the seashore street to make it either parallel or perpendicular to the direction of the SW wind. Whilst the number of cases with this trait are too few to draw conclusions, this might suggest that the orientation towards the wind and the sun had an effect on the character of their urban form.
The discrepancy between the need to understand flood behaviours and the approach to limit their impact should be tackled, and the classification of urban settlements based on their local urban morphology as proposed in this paper is one of the ways to do so: it allows for a response to be place-specific. The study of the effects of SLR is useful on a micro (regional) scale but at the same time needs to be coordinated with adaptation plans (POC). Such coordination could follow the proposed morphometric similarity. Urban adaptation to extreme weather scenarios is likely to be similar in morphologically similar rather than geographically similar cases. It is necessary to note that the current study is of primarily explorative nature, trying to understand if the proposed method is a possible solution of the outlined issue. For that reason, four places are subdivided based on the historical origin. In reality, each town would likely be considered as a singular unit.
The effectiveness of the POC depends on a number of factors, including the ability to distinguish and calibrate approaches to different contextual conditions, among which coastal settlements must be included in their physical component. It is not our goal to propose how such a response should be structured. However, we argue that under the existing climate emergency, an effective response should be designed in an effective and coordinated way, which is both applicable at large scales and responsive to local peculiarities. By testing a posteriori the reliability of the geographical areas developed by the POCs, it is possible to review the operating conditions and thus update information on the state of the built environment affected by sea level rise.
Ultimately, we believe that there is a need for a synthesis process in the design of strategic and legislative intervention programmes that are effective in mapping the risk and vulnerability of coastal cities, aware that in law and legislation, the notion of city is known through interdisciplinary urban-architectural analysis. At the coast, the disconnect between adaptation and everyday decision-making is amplified because of the traditionally sectoral nature of coastal planning and its disconnect with marine and land-based policies [48].
In law, the concept of the physical “city” is not described, since it is an entity with a variable form, which cannot be legally categorised. Legally, therefore, it is non-existent. Researching the fundamentals of a system related to cities, we propose with this study a useful methodology to categorise the urban form and its flooding vulnerability, recognising the regulatory and administrative complexity that is confronted within the legislative system of adaptation to climate change. Through the methodology outlined in this article, and based on the results of the Portuguese case study, we believe that today’s legislation relating to water management and flood risk areas can be networked, making the existing complex and disjointed discipline organic.
The morphometric description of selected cases and subsequent agglomerative clustering is one of the potential analyses allowed by urban morphology: it finds similarity and suggests a meaningful classification of urban form. The result of this quantitative approach has to be interpreted based on its numerical nature—the final classification reflects measurable configurations only. As the set of morphometric characters is relatively rich, this classification should be combined with other types of classifications based on qualitative methodology, as shown in Dibble et al. [26], to include other aspects of urban form, e.g., formation and transformation process analysis [49] or the role of public space design in adaptation [50]; this might eventually lead to different results. This tool can be used to shape urban planning policies in the future (Figure 6), to transform urban morphology to urban policy in Portugal, Europe and beyond at a time when targeted policies are crucial to capture local variations which maximise the benefits of an intervention. Results can then be used by a broader spectrum of local policymakers to critically reflect on their plans and approach, as they indicate potential gaps in the way their plans cover resilience and mismatches with intended goals [51]. Identifying windows of opportunity and understanding how they operate in this way can support sustainability and adaptation mainstreaming and dynamic adaptation pathway approaches to help deliver the transformational change necessary for a sustainable adaptation to climate change in coastlines worldwide [48]. The international perspective of urban agendas (for example, the 2015 United Nations Plan on Sustainable Development Goals, with its seventeen objectives, including that of sustainable cities, aimed at forming a city agenda) allows for the analysis of the direct involvement of cities and their physical form, in the field of environmental adaptation.
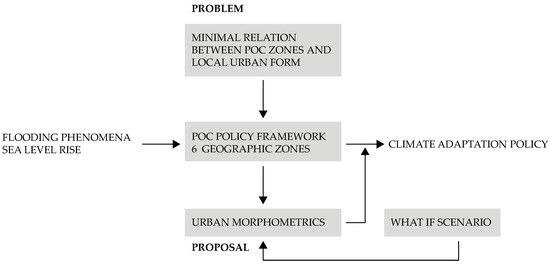
Figure 6.
Conceptual diagram of the research outlining the current process of preparation of climate adaptation policy and the inclusion of proposed steps reflecting local character within macro POC zones.
6. Conclusions
Climate change’s impact on coastal cities is expected to represent a major challenge this century [52,53]. The effects of sea level rise on the coastal landscape must be assessed and limited through legislative and implementation plans developed with objective and replicable criteria, such as the use of morphometric analysis as methodologically illustrated in this article. We believe that some of the problems in the interpretation of Directive 2007/60/EC and the coordination in the delineation of risk and vulnerability mapping of coastal cities in national implementation plans by the member states can be solved through the quantitative and qualitative definition of sea level rise impacts on the urban form. The novelty of the proposed approach lies in the characterisation of coastal areas subject to flooding through an interdisciplinary method aiming to contribute to a uniform legislative definition.
It is considered that the theoretical contribution that can provide the tracking of data related to the urban form of coastal cities and the impacts of sea level rise on them is necessary to increase territorial urban policies. The implications that the progressive phenomena caused by sea level rise have on cities, such as flooding and erosion, take on a transient and non-static meaning that legislation and planning must be able to make explicit and coordinate. Moreover, integrating governance with urban planning and port planning can help manage urban development near ports to appropriate levels [54]. Understanding the prioritisation of vulnerability and adaptation issues at the community level can provide valuable base-level information [55].
The subsequent analyses carried out measure the vulnerability of each case to a “what if?” extreme flooding scenario for 2100 and indicate the potential of morphometric classification in coordinating climate adaptation to urban areas. An interdisciplinary study of urban form including morphometrics, landscape metrics, socio-economic factors and governance structures combined with a historical analysis [56] would improve the adaptation of coastal cities to flooding. We suggest that a synthesis between urban and territorial morphology, between quantitative problems and their qualitative relationships, is a necessary exercise for the assessment of risk due to SLR and to use this multidisciplinary approach to target the climate response in an efficient, coordinated manner.
Supplementary Materials
The following are available online at https://www.mdpi.com/2071-1050/12/20/8559/s1, Jupyter notebooks S1: Python code used within the research.
Author Contributions
Conceptualisation, F.D.C., M.F., O.R. and J.P.C.; methodology, F.D.C., M.F., O.R. and J.P.C.; software, M.F.; formal analysis, F.D.C. and M.F.; data curation, F.D.C. and M.F.; writing—original draft preparation, F.D.C., M.F., O.R. and J.C.; writing—review and editing, F.D.C., M.F., O.R. and J.C.; visualisation, M.F.; supervision, O.R. and J.C. All authors have read and agreed to the published version of the manuscript.
Funding
This research received no external funding.
Conflicts of Interest
The authors declare no conflict of interest.
Data Statement
The data and the Python code underpinning this publication are openly available from https://doi.org/10.15129/1b52083a-7e9b-4cca-8d2b-44823a241c53, with the exception of the digital terrain model, which could be retrieved from Direção-Geral do Território (DGT) upon request.
Appendix A
Table A1.
Data displayed in Figure 5, capturing the projected flood risk for each case as flooded area ratio and deviation of street orientation from the SW wind direction, causing the most severe flooding.
Table A1.
Data displayed in Figure 5, capturing the projected flood risk for each case as flooded area ratio and deviation of street orientation from the SW wind direction, causing the most severe flooding.
| Name | Id | Cluster | Flooded Area Ratio | Wind Direction Deviation |
|---|---|---|---|---|
| Vila Praia de Âncora | 1 | B | 0.036 | 0.988 |
| Esposende | 2 | D | 0.247 | 0.959 |
| Póvoa de Varzim | 3 | F | 0.069 | 0.801 |
| Vila do Conde | 4 | F | 0.0 | 0.804 |
| Foz (Porto) | 5 | C | 0.008 | 0.567 |
| Aguda | 6 | C | 0.0 | 0.841 |
| Espinho | 7 | F | 0.0 | 0.444 |
| Furadouro | 8 | F | 0.332 | 0.279 |
| Costa Nova | 9 | F | 0.579 | 0.505 |
| Praia de Mira | 10 | C | 0.081 | 0.363 |
| Palheiros da tocha (a) | 11 | E | 0.0 | 0.346 |
| Palheiros da tocha (b) | 11 | E | 0.011 | 0.346 |
| Palheiros da tocha (c) | 11 | E | 0.02 | 0.346 |
| Quiaios | 12 | E | 0.0 | 0.259 |
| Figueira da Foz (a) | 13 | B | 0.0 | 0.66 |
| Figueira da Foz (b) | 13 | C | 0.205 | 0.66 |
| Figueira da Foz (c) | 13 | C | 0.0 | 0.66 |
| Pedrógão | 14 | A | 0.0 | 0.295 |
| Vieira (a) | 15 | E | 0.183 | 0.11 |
| Vieira (b) | 15 | A | 0.454 | 0.11 |
| Nazaré (a) | 16 | E | 0.056 | 0.385 |
| Nazaré (b) | 16 | A | 0.474 | 0.385 |
| São Martinho do Porto | 17 | C | 0.907 | 0.839 |
| Ericeira | 18 | B | 0.0 | 0.244 |
| Azenhas do Mar | 19 | D | 0.0 | 0.105 |
| Cascais | 20 | B | 0.253 | 0.35 |
| Costa da Caparica | 21 | C | 0.742 | 0.957 |
| Sesimbra | 22 | E | 0.077 | 0.592 |
| Zambujeira do Mar | 23 | E | 0.0 | 0.055 |
| Praia de Carvoeiro | 24 | D | 0.014 | 0.596 |
| Armação de Pêra | 25 | C | 0.279 | 0.686 |
| Albufeira | 26 | B | 0.023 | 0.224 |
| Quarteira | 27 | A | 0.409 | 0.754 |
| Faro | 28 | B | 0.0 | 0.508 |
| Olhão | 29 | B | 0.0 | 0.467 |
| Monte Gordo | 30 | A | 0.505 | 0.436 |
References
- Hansen, H.S. Modelling the future coastal zone urban development as implied by the IPCC SRES and assessing the impact from sea level rise. Landsc. Urban Plan. 2010, 98, 141–149. [Google Scholar] [CrossRef]
- Church, J.A.; Gregory, J.M. IPCC 2001: 11 Changes in sea level. In International Plant Protection Convention; Cambridge University Press: Cambridge, UK, 2001; pp. 639–694. Available online: http://epic.awi.de/4506/1/Chu2001a.pdf (accessed on 15 July 2020).
- IPCC (2018) Summary for Policymakers. An IPCC Special Report on the impacts of global warming of 1.5 °C above pre-industrial levels and related global greenhouse gas emission pathways, in the context of strengthening the global response to the threat of climate change, sustainable development, and efforts to eradicate poverty. In Global Warming of 1.5 °C; Masson-Delmotte, V., Zhai, P., Pörtner, H.-O., Roberts, D., Skea, J., Shukla, P.R., Pirani, A., Moufouma Okia, W., Péan, C., Pidcock, R., et al., Eds.; World Meteorological Organization: Geneva, Switzerland, 2018; p. 32. [Google Scholar]
- Neumann, B.; Vafeidis, A.T.; Zimmermann, J.; Nicholls, R.J. Future coastal population growth and exposure to sea-level rise and coastal flooding—A global assessment. PLoS ONE 2015, 10, e0118571. [Google Scholar] [CrossRef] [PubMed]
- Antunes, C. Assessment of Sea Level Rise of West Coast of Portugal Mainland and its Projection for the 21st Century. J. Mar. Sci. Eng. Int. 2019, 7, 61. [Google Scholar] [CrossRef]
- Koroglu, A.; Ranasinghe, R.; Jiménez, J.A.; Dastgheib, A. Comparison of Coastal Vulnerability Index applications for Barcelona Province. Ocean Coast. Manag. 2019, 178, 104799. [Google Scholar] [CrossRef]
- Council of the European Communities. In Proceedings of the Name of the Directive 2007/60/EC of the European Parliament and of the Council of 23 October 2007 on the Assessment and Management of Flood Risks, Strasbourg, France, 23 October 2007.
- European Court of Auditors. Floods Directive: Progress in Assessing Risks, While Planning and Implementation Need to Improve. 2018. Available online: https://www.wfcatprogrammes.com/documents/20142/34131/SR_FLOODS_EN.pdf/c296b847-db8b-6ed3-f0e3-f0c1aaab6a7c (accessed on 15 July 2020).
- Ahmadian, E.; Sodagar, B.; Mills, G.; Byrd, H.; Bingham, C.; Zolotas, A. Sustainable cities: The relationships between urban built forms and density indicators. Cities 2019, 95, 102382. [Google Scholar] [CrossRef]
- Dorrell, R.; Wentworth, J. Sea Level Rise; Parliamentary Office of Science & Technology: London, UK, 2010; p. 363. Available online: http://www.parliament.uk/documents/post/postpn363-sea-level-rise.pdf (accessed on 15 July 2020).
- Purvis, M.J.; Bates, P.D.; Hayes, C.M. A probabilistic methodology to estimate future coastal flood risk due to sea level rise. Coast. Eng. 2008, 55, 1062–1073. [Google Scholar] [CrossRef]
- Ribeiro, O. Portugal, o Mediterrâneo e o Atlântico; Coimbra Editora: Antanhol, Portugal, 1945. [Google Scholar]
- De Carvalho, L.A.N. Potential of Borehole Systems in Portugal; Lulea Tekniska Universitet: Luleå, Sweden, 2003; 2004:052 CIV; Available online: http://epubl.luth.se/1402-1617/2004/052/index-en.html (accessed on 15 July 2020).
- Ferreira, Ó.; Dias, J.A.; Taborda, R. Implications of Sea-Level Rise for Continental Portugal. J. Coast. Res. 2008, 242, 317–324. [Google Scholar] [CrossRef]
- Bigotte, J.F.; Antunes, A.P.; Krass, D.; Berman, O. The Relationship between Population Dynamics and Urban Hierarchy: Evidence from Portugal. Int. Reg. Sci. Rev. 2014, 37, 149–171. [Google Scholar] [CrossRef]
- Andrade, C.; Freitas, M.C.; Cachado, C.; Cardoso, A.C.; Monteiro, J.H.; Brito, P.; Rebelo, L. Coastal Zones. In Climate Change in Portugal—Scenarios, Impacts and Adaptation Measures—SIAM Project; Santos, F.D., Forbes, K., Moita, R., Eds.; Gradiva: Lisboa, Portugal, 2002; pp. 175–219. [Google Scholar]
- Costa, C.L. Final Report of Sub-Project a Wind Wave Climatology of the Portuguese Coast; Report 6/94-A; Instituto Hidrográfico/LNEC: Lisbon, Portugal, 1994; p. 80. [Google Scholar]
- Relvas, P.; Barton, E.D.; Dubert, J.; Oliveira, P.B.; Peliz, Á.; da Silva, J.C.B.; Santos, A.M.P. Physical oceanography of the western Iberia ecosystem: Latest views and challenges. Prog. Oceanogr. 2007, 74, 149–173. [Google Scholar] [CrossRef]
- Antunes, C.; Rocha, C.; Catita, C. Coastal flood assessment due to sea level rise and extreme storm events: A case study of the atlantic coast of Portugal’s mainland. Geosciences 2019, 9, 239. [Google Scholar] [CrossRef]
- Antunes, C.; Taborda, R. Sea Level at Cascais Tide Gauge: Data, Analysis and Results. J. Coast. Res. 2009, 56, 218–222. [Google Scholar]
- Williams, S.J. Sea-Level Rise Implications for Coastal Regions. J. Coast. Res. 2013, 63, 184–196. [Google Scholar] [CrossRef]
- Jolicoeur, S.; Carroll, O. Sandy barriers, climate change and long-term planning of strategic coastal infrastructures, Îles-de-la-Madeleine, Gulf of St. Lawrence (Québec, Canada). Landsc. Urban Plan. 2007, 81, 287–298. [Google Scholar] [CrossRef]
- Proença, S.B. Reading and interpreting Portuguese Atlantic seashore streets in sea level rise context. In Proceedings of the City Street3: Transitional Streets, Narrating Stories of Convivial Streets, Beirut, Lebanon, 31 October–3 November 2018; pp. 1–8. [Google Scholar]
- Kropf, K. The Handbook of Urban Morphology; John Wiley & Sons: Chichester, UK, 2017. [Google Scholar]
- Carneiro, C.; Morello, E.; Voegtle, T.; Golay, F. Digital Urban Morphometrics: Automatic Extraction and Assessment of Morphological Properties of Buildings. Trans. GIS 2010, 14, 497–531. [Google Scholar] [CrossRef]
- Dibble, J.; Prelorendjos, A.; Romice, O.; Zanella, M.; Strano, E.; Pagel, M.; Porta, S. On the origin of spaces: Morphometric foundations of urban form evolution. Environ. Plan. B Urban Anal. City Sci. 2019, 46, 707–730. [Google Scholar] [CrossRef]
- Fleischmann, M.; Romice, O.; Porta, S. Measuring urban form: Overcoming terminological inconsistencies for a quantitative and comprehensive morphologic analysis of cities. Environ. Plan. B Urban Anal. City Sci. 2020, 239980832091044. [Google Scholar] [CrossRef]
- Fleischmann, M. Momepy: Urban Morphology Measuring Toolkit. J. Open Source Softw. 2019, 4, 1807. [Google Scholar] [CrossRef]
- Araldi, A.; Fusco, G. From the street to the metropolitan region: Pedestrian perspective in urban fabric analysis. Environ. Plan. B Urban Anal. City Sci. 2019, 46, 1243–1263. [Google Scholar] [CrossRef]
- OpenStreetMap Contributors. 2019. Available online: https://planet.osm.org (accessed on 15 July 2020).
- Boeing, G. OSMnx: New methods for acquiring, constructing, analyzing, and visualizing complex street networks. Comput. Environ. Urban Syst. 2017, 65, 126–139. [Google Scholar] [CrossRef]
- Moudon, A.V. Urban morphology as an emerging interdisciplinary field. Urban Morphol. 1997, 1, 3–10. [Google Scholar]
- Hamaina, R.; Leduc, T.; Moreau, G. Towards Urban Fabrics Characterization Based on Buildings Footprints. In Bridging the Geographic Information Sciences; Springer: Berlin/Heidelberg, Germany, 2012; pp. 327–346. [Google Scholar] [CrossRef]
- Fleischmann, M.; Feliciotti, A.; Romice, O.; Porta, S. Morphological tessellation as a way of partitioning space: Improving consistency in urban morphology at the plot scale. Comput. Environ. Urban Syst. 2020, 80, 101441. [Google Scholar] [CrossRef]
- Usui, H.; Asami, Y. Size Distribution of Building Lots and Density of Buildings and Road Networks: Theoretical Derivation Based on Gibrat’s Law and Empirical Study of Downtown Districts in Tokyo. Int. Reg. Sci. Rev. 2019, 10, 016001761982627–25. [Google Scholar] [CrossRef]
- Colaninno, N.; Roca, J.; Pfeffer, K. An automatic classification of urban texture: Form and compactness of morphological homogeneous structures in Barcelona. In Proceedings of the 51st Congress of the European Regional Science Association, Louvain-la-Neuve: European Regional Science Association (ERSA), Barcelona, Spain, 30 August–2 September 2011. [Google Scholar]
- Steiniger, S.; Lange, T.; Burghardt, D.; Weibel, R. An Approach for the Classification of Urban Building Structures Based on Discriminant Analysis Techniques. Trans. GIS 2008, 12, 31–59. [Google Scholar] [CrossRef]
- Basaraner, M.; Cetinkaya, S. Performance of shape indices and classification schemes for characterising perceptual shape complexity of building footprints in GIS. Int. J. Geogr. Inf. Sci. 2017, 31, 1952–1977. [Google Scholar] [CrossRef]
- Schirmer, P.M.; Axhausen, K.W. A multiscale classification of urban morphology. J. Transp. Land Use 2015, 9, 101–130. [Google Scholar] [CrossRef]
- Hijazi, I.; Li, X.; Koenig, R.; Schmit, G.; El Meouche, R.; Lv, Z.; Abu Nemeh, M. Measuring the homogeneity of urban fabric using 2D geometry data. Environ. Plan B Plan. Des. 2016, 1–25. [Google Scholar] [CrossRef]
- Vanderhaegen, S.; Canters, F. Mapping urban form and function at city block level using spatial metrics. Landsc. Urban Plan. 2017, 167, 399–409. [Google Scholar] [CrossRef]
- Feliciotti, A. Resilience and Urban Design: A Systems Approach to the Study of Resilience in Urban form; University of Strathclyde: Glasgow, UK, 2018. [Google Scholar]
- Theil, H. Economics and Information Theory; North-Holland Publishing Company: Amsterdam, The Netherlands, 1967. [Google Scholar]
- Ward, J.H. Hierarchical Grouping to Optimize an Objective Function. J. Am. Stat. Assoc. 1963, 58, 236–244. [Google Scholar] [CrossRef]
- Blashfield, R.K. Mixture model tests of cluster analysis: Accuracy of four agglomerative hierarchical methods. Psychol. Bull. 1976, 83, 377–388. [Google Scholar] [CrossRef]
- Costa, J.P. Urbanismo e Adaptação às Alterações Climáticas, as Frentes de Água; Livros Horizonte, CIAUD—FA|ULisboa: Lisbon, Portugal, 2013; p. 183. [Google Scholar]
- Fu, X.; Peng, Z. Assessing the sea-level rise vulnerability in coastal communities: A case study in the Tampa Bay Region, US. Cities 2019, 88, 144–154. [Google Scholar] [CrossRef]
- Brown, K.; Naylor, A.L.; Quinn, T. Making Space for Proactive Adaptation of Rapidly Changing Coasts: A Windows of Opportunity Approach. Sustainability 2017, 9, 1408. [Google Scholar] [CrossRef]
- Costa, J.P. La Ribera entre Proyectos. Formación y Transformación del Territorio Portuario, a Partir del caso de Lisboa. Ph.D. Thesis, Escuela Técnica Superior de Arquitectura de Barcelona, Universidad Politécnica de Catalunya, Barcelona, Spain, 2007; p. 591. Available online: http://www.tesisenxarxa.net/TDX-0322107-120012/ (accessed on 15 July 2020).
- Matos Silva, M.; Costa, J.P. Urban Floods and Climate Change Adaptation: The Potential of Public Space Design When Accommodating Natural Processes. Water 2018, 10, 180. [Google Scholar] [CrossRef]
- Wilk, B.; Brown, V.; Uittenbroek, C.; Mees, H.; Driessen, P.; Wassen, M.; Runhaar, H. A diagnostic tool for supporting policymaking on urban resilience. Cities 2020, 101, 102691. [Google Scholar] [CrossRef]
- Hallegatte, S.; Ranger, N.; Mestre, O.; Dumas, P.; Corfee-Morlot, J.; Herweijer, C.; Wood, R.M. Assessing climate change impacts, sea level rise and storm surge risk in port cities: A case study on Copenhagen. Clim. Chang. 2011, 104, 113–137. [Google Scholar] [CrossRef]
- Hanson, S.; Nicholls, R.; Ranger, N.; Hallegatte, S.; Corfee-Morlot, J.; Herweijer, C.; Chateau, J. A global ranking of port cities with high exposure to climate extremes. Clim. Chang. 2011. [Google Scholar] [CrossRef]
- Park, H.; Paterson, R.; Zigmund, S.; Shin, H.; Jang, Y.; Jung, J. The Effect of Coastal City Development on Flood Damage in South Korea. Sustainability 2020, 12, 1854. [Google Scholar] [CrossRef]
- Younus, M.A.F. An assessment of vulnerability and adaptation to cyclones through impact assessment guidelines: A bottom-up case study from Bangladesh coast. Nat. Hazards 2017, 89, 1437–1459. [Google Scholar] [CrossRef]
- Schwarz, N. Urban form revisited—Selecting indicators for characterising European cities. Landsc. Urban Plan. 2010, 96, 29–47. [Google Scholar] [CrossRef]
Publisher’s Note: MDPI stays neutral with regard to jurisdictional claims in published maps and institutional affiliations. |
© 2020 by the authors. Licensee MDPI, Basel, Switzerland. This article is an open access article distributed under the terms and conditions of the Creative Commons Attribution (CC BY) license (http://creativecommons.org/licenses/by/4.0/).