Article

A Prolongation of the Service Life of Cement-Based Composites by Controlling the Development of Their Strength and Volume Changes

Department of Building Technology, Faculty of Civil Engineering, Slovak University of Technology in Bratislava, Radlinského Street 11, 810 05 Bratislava, Slovakia
*
Author to whom correspondence should be addressed.
Sustainability 2020, 12(20), 8479; https://doi.org/10.3390/su12208479
Submission received: 4 September 2020 / Revised: 29 September 2020 / Accepted: 9 October 2020 / Published: 14 October 2020
(This article belongs to the Special Issue Sustainable Building Materials and Life Cycle Assessment (LCA))

Abstract

:
As several studies and authors have already proved, the curing of fresh concrete affects the development of its strength and volume changes, which goes hand in hand with the durability and service life of concrete structure. Several studies concerning internal curing (IC) have also been published. They were dedicated to identifying the action of IC by Differential Thermal Analysis (DTA), especially for mixes with low w/c ratios. Some studies have presented various approaches for the design of mixes with IC. Some discrepancies between conventional designs and reality have been identified. A significant one is the calculation of water losses. The initial (conventional) approach defined water losses based on Menzel’s equation. However, in reality, it is valid for only the first few hours. As water losses are essential to an appropriate design of IC, we will demonstrate in this paper the effect of IC on the development of changes in the volume and strength of cement-based composites. Both parameters come into mutual interaction during actual construction and affect the internal stresses of the structure/matrix, which may lead to the formation and development of cracks. The general goal is to mitigate cracks and, thus, prolong the concrete’s service life, which may be achieved by controlling the development of changes in volume along with the development of strength, e.g., by IC.

1. Introduction

The goal of the tests, which were performed on prisms, was to verify the efficiency of internal curing (IC) in conditions of almost ideal curing (20 °C; relative humidity 98%), as already defined in [1]. Under these conditions, almost no losses of moisture from the samples to the environment occur. Therefore, the samples just undergo self-desiccation (Figure 1), which finally affects changes in volume and, depending on the water-to-cement ratio (w/c), mechanical performances as well. The tests of the prisms, which enable assessment of the efficiency of the designed IC with the varying w/c, play a significant role not only in the verification of the correctness of the model of the formulation of the concrete composition (with IC), but also in the collection of the first/reference performances of samples cured under ideal conditions.

2. Materials and Methods

Portland CEM I 42.5 N was used for the tests. It has a specific gravity of 3077 k/m3, chemical shrinkage of 7%, and Blaine fineness of 344.77 m2/kg. The initial setting time was determined (in accordance with [2]) to be 185.3 min, whereas the final setting time was determined to be 254.6 min. As a water-reducing admixture (WRA), the superplasticizer (polycarboxylate) Berament HT2 was used. The aggregate used was natural river sand with a 0/4 fraction (see Table 1) and, as a result of previous research, a lightweight aggregate (LWA) was used in the 0/4M fractions and 0/1D of the expanded Liapor shale (see Table 1).

3. Recipes and Formulas

For verification of the designed IC on mortar prisms, we chose several recipes with one variable, i.e., water-to-cement ratio (w/c). It was proposed in three variants at relatively low values (0.3, 0.36, and 0.42) to ensure the degree of hydration α (0.83, 1, and 1). In each w/c variant, the effectiveness of IC was verified at different dosages of LWA (0% = reference sample; 7% and 13.2%). The upper limit dosage of 13.2% was chosen based on the internal curing design [3] as a quantity to ensure an ideal IC of a (so-called) sealed system at w/c = 0.36, which only undergoes self-desiccation. The exact recipes for each batch are listed in Table 2.

4. The Manufacturing and Conditioning of the Samples

Just before the manufacturing of the samples themselves, all the auxiliary and preparatory processes were accomplished. A normal preparation of the aggregate (by drying it out at 110 ± 5 °C for 24 ± 2 h, according to [4]) was carried out. The dry aggregate was put in plastic buckets equipped with lids in order to prevent adsorption of moist air. In the case of the manufacturing of the IC samples, the LWA with all the mixing and curing water was put into the plastic buckets 24 ± 2 h before mixing.
The mixing was carried out in a computer-controlled (so-called mortar) mixer in accordance with [5]. Before mixing, the sequence of the batching was always maintained. Firstly, the natural aggregate was put into a bowl. Subsequently, the cement was poured. Then, the dry mix was mixed manually. As a last ingredient, the saturated LWA (i.e., SLWA) with decanted water was added. A few seconds before pouring the water into the bowl, the water-reducing admixture (WRA) was added to the water. The mixture was slowly manually mixed again, which was considered a measure to prevent losing some material, as the mixture was dry and the stirrer was rotating too rapidly.
When the mixture was pre-homogenized as described above, we continued with an automatic mixing mode, i.e., 60 s at the lowest speed. After that, the forms were filled with the mixture (in accordance with Annex A of [6]). Depending on the consistency (resulting from the proportion of aggregate and cement paste), the samples were compacted. The reference samples were compacted on a vibrating plate for 60 s at a magnitude of 0.6 mm. The IC samples were compacted in three layers by the tamping of a steel tamper (40 mm in diameter). After the compaction, the upper side was scraped and troweled. The samples were put in an environment with a temperature of 20 ± 2 °C and relative humidity (RH) of 95 ± 5% for 24 h. An equivalent average RH was achieved at 98%.
After the demolding, the testing specimens were shaped as prisms (so-called “mortar prisms”) with dimensions of 40 × 40 × 160 mm. They were exposed to an environment with a temperature of 20 ± 2 °C and RH 98 ± 1%, where they were kept for the next 27 days. The downsizing of the specimens to “mortar prisms” was adopted as a compromise due to the capacity issues of the laboratory. However, the ratio of the minimum size of the specimen’s edge to Dmax was 10, which was still far more than the good practice “testing” recommendation of a multiple of 3 or 5 (by several authors [7,8]).

5. Experimental Part

In the experimental part, the action of IC (at different dosages) was verified in terms of its impact on the mechanical performances and changes in volume of the mortar. After demolding (at the age of 1 day), the dimensions and weight were recorded. Based on those figures, the average bulk densities of the samples/recipes were determined. Then, “zero” readings of changes in the lengths of the prisms (equipped with dilatometric pins) were taken. The prisms without dilatometric pins were kept for determining the development of the mechanical performances, i.e., the flexural tensile strength (ft,fl) and compressive strength (fc) The mechanical performances determined were expressed (respecting the various recipes) as strengths relative to the bulk densities. During the tests, a total of 128 prisms were manufactured and tested.
The changes in volume were tested by the dilatometric method (according to [9]—the principle demonstrated in Figure 2). Each sample consisted of five prisms, readings of which were taken at 1–3, 5, 7, 14, and 28 days. The first reading was taken almost immediately after the demolding of the samples and was considered the “zero” or “reference” reading. Note: The dilatometric method does not permit capturing the changes in volume that take place at ages 0 and 24 h.
The flexural tensile strength and compressive strength were tested according to [6] (Figure 3 and Figure 4). The flexural tensile strength was always determined with three specimens at ages 7, 14, and 28 days. The primary purpose of this test was to test the compressive strength of the fragments. The flexural tensile strengths were used as the control results for the compressive strength tests, with an empirically defined ratio ft,fl(t):fc(t) = 1:7.

6. Discussion

6.1. Apparent/Bulk Density

The substitution of some part of a natural aggregate by LWA necessarily leads to a change in the apparent density. This is caused, firstly, by the lower specific gravity and bulk density of the LWA in comparison with a natural aggregate (Table 1) and, secondly, by a change in the ratio of the volume of the cement paste to the volume of the aggregate. These two aspects, on a practical basis, affect the consistency (workability) of fresh concrete (or mortar) and its related compactability. Under specific circumstances, the apparent density can be an indicator of the compactability of the fresh mixture and strength of premature and/or hardened concrete. For the purposes of this study, this was determined in order to verify the reliability and technological suitability of the recipes designed.
Some qualitative conclusions resulted from the actual measured bulk (apparent) density ρV (kg/m
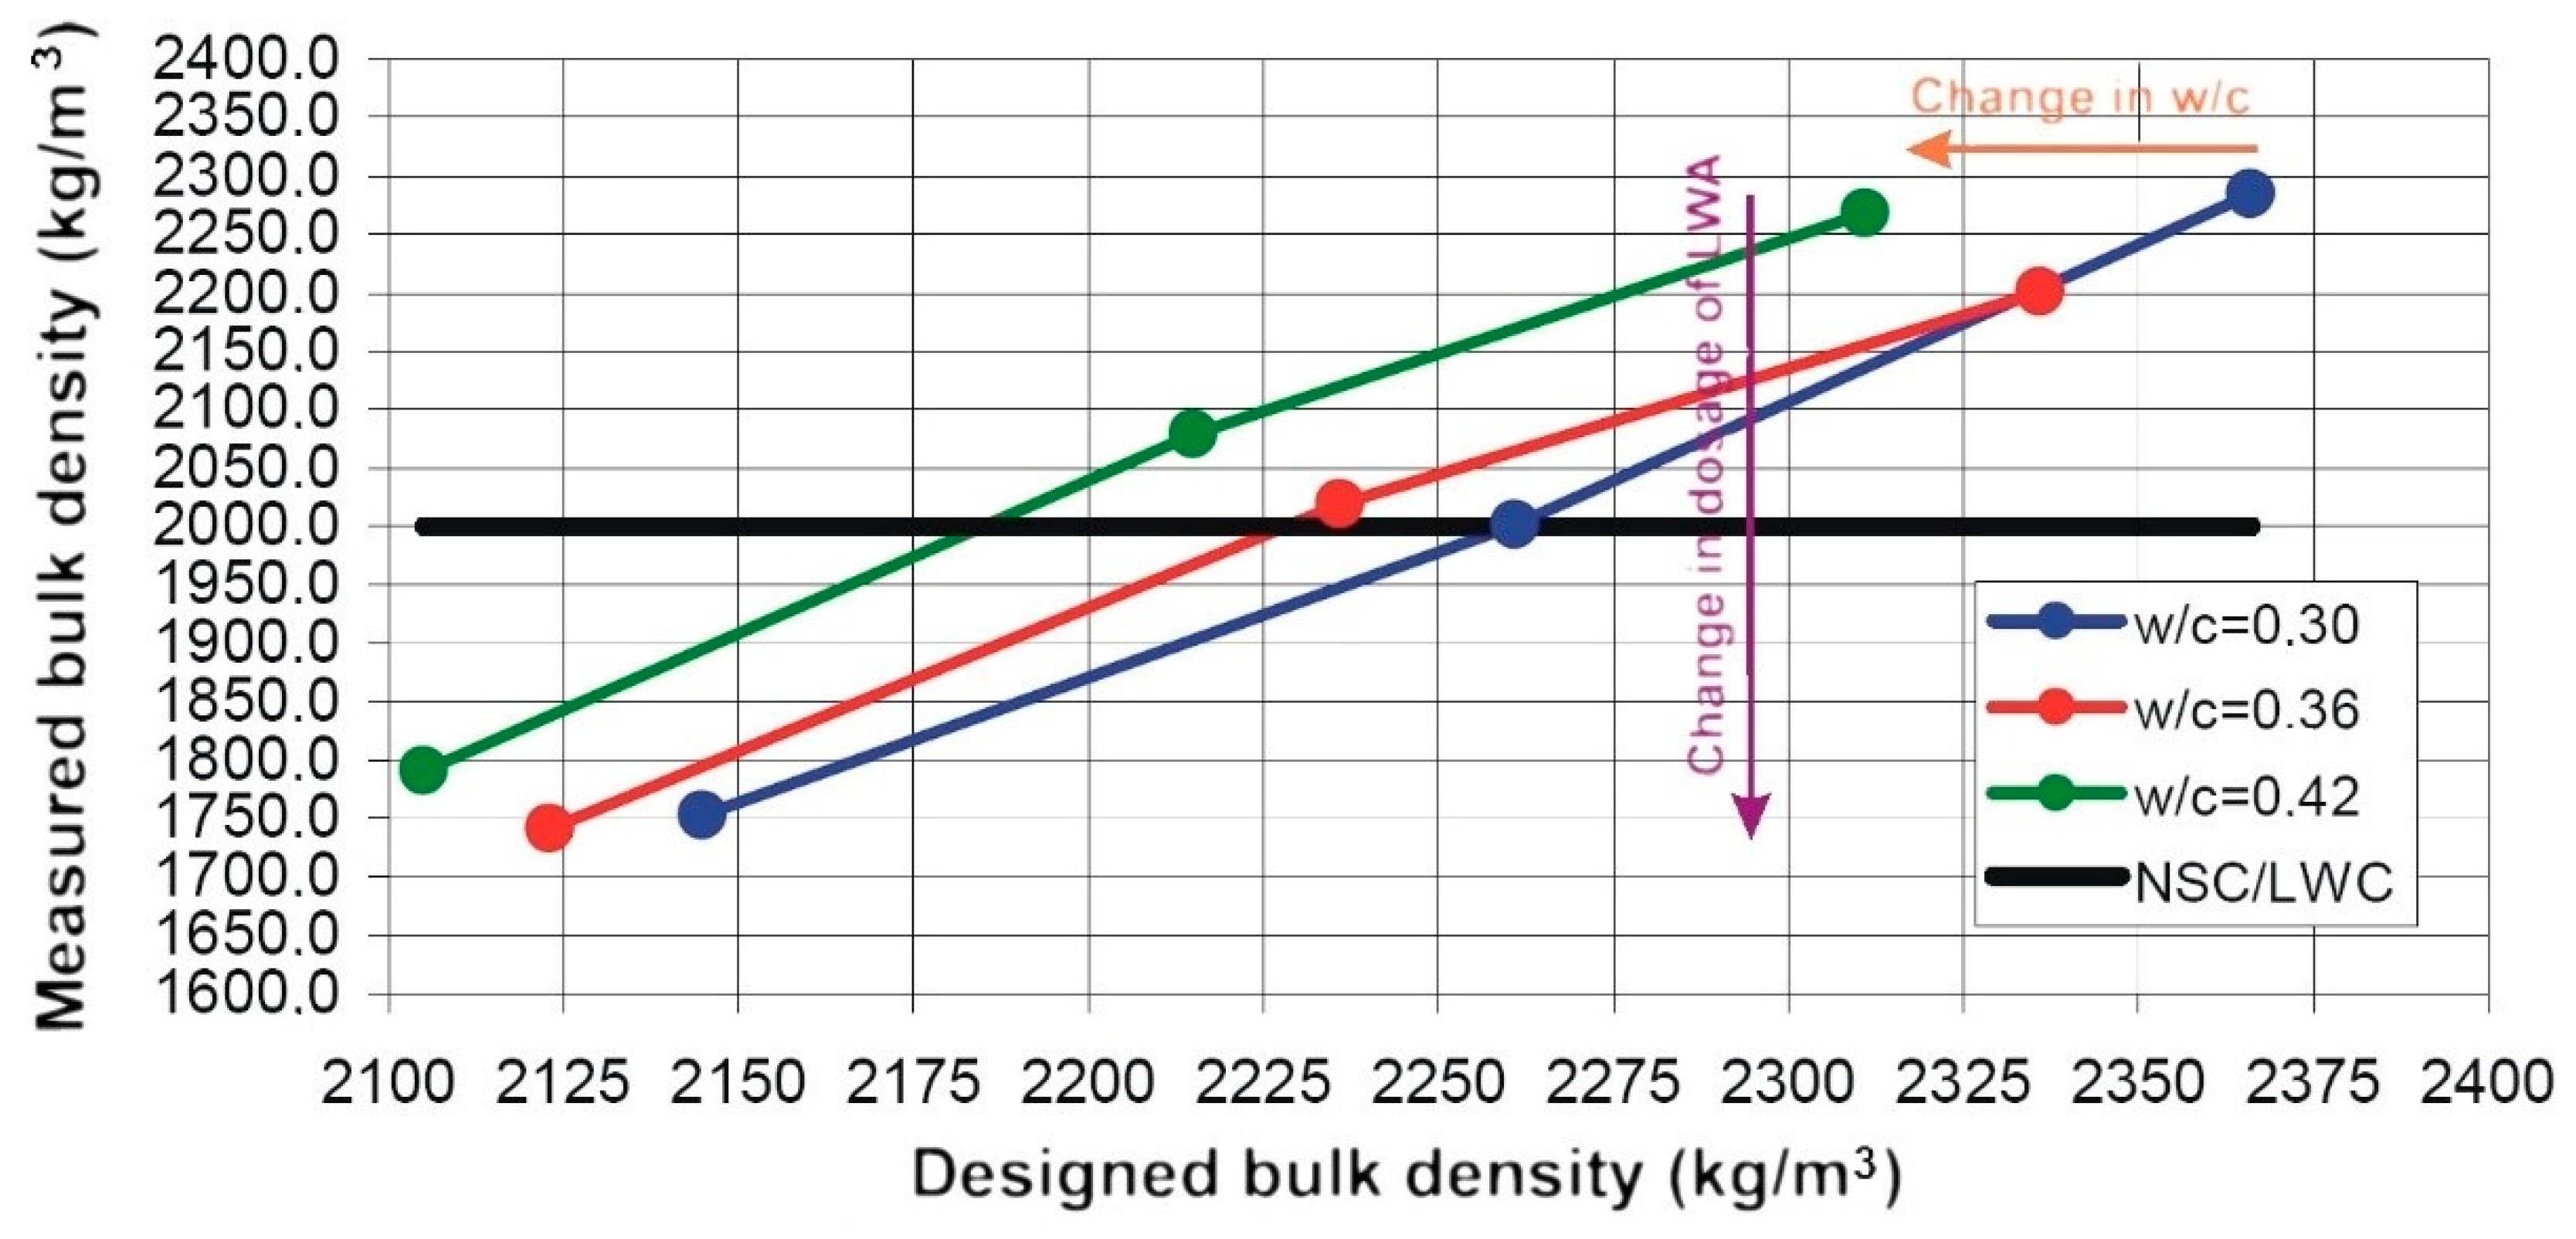
3). LWA, at a dosage of 13.2% (by mass) and by the selected fractions 0/4 and 0/1 mixed in a mutual ratio of 75:25, in order to fully recover losses of moisture from the hydration of the sealed system, causes an approximately 15% decrease in bulk density. The significant drop in bulk density prevented us from classifying the mixture as “normal-weight” structural concrete (NSC) according to [10], as the bulk density dropped down below 2000 kg/m3. Similar behavior was also observed for samples with a dosage of LWA 7.0% (by mass). In proportion to the lower dosage of LWA (7.0%), a drop in bulk density was found. The relative decrease in bulk density can be expressed as 6%. The drop in bulk density was mainly caused due to the missing cement paste and improper compactability in the laboratory conditions. Tamping was used. It is recommended to compact these stiff consistencies with a vibration press, which does not exclude the use of these mixes in actual applications. The less favorable compactability of mixes containing some LWA can be attributed to the complex characteristics of LWA (e.g., its granulometry, fineness and related specific surface area, and, especially, its almost immeasurable capacity to accomplish physical binding of water on its surface), which were either partly or not at all considered in the design of the mix [3]. A minor effect on its compactability can be attributed to the relatively low w/c. The design of the recipes was driven by low w/c (generally needed for some exposure classes), the achievement of higher strengths, and the construction of durable structures. Similarly, greater importance in the design of LWA was attributed to the homogeneity of the distribution of the LWA particles (water reservoirs) in the cement paste. In that way, the distance between the singular particles (the so-called “spacing factor”) would be minimized. 
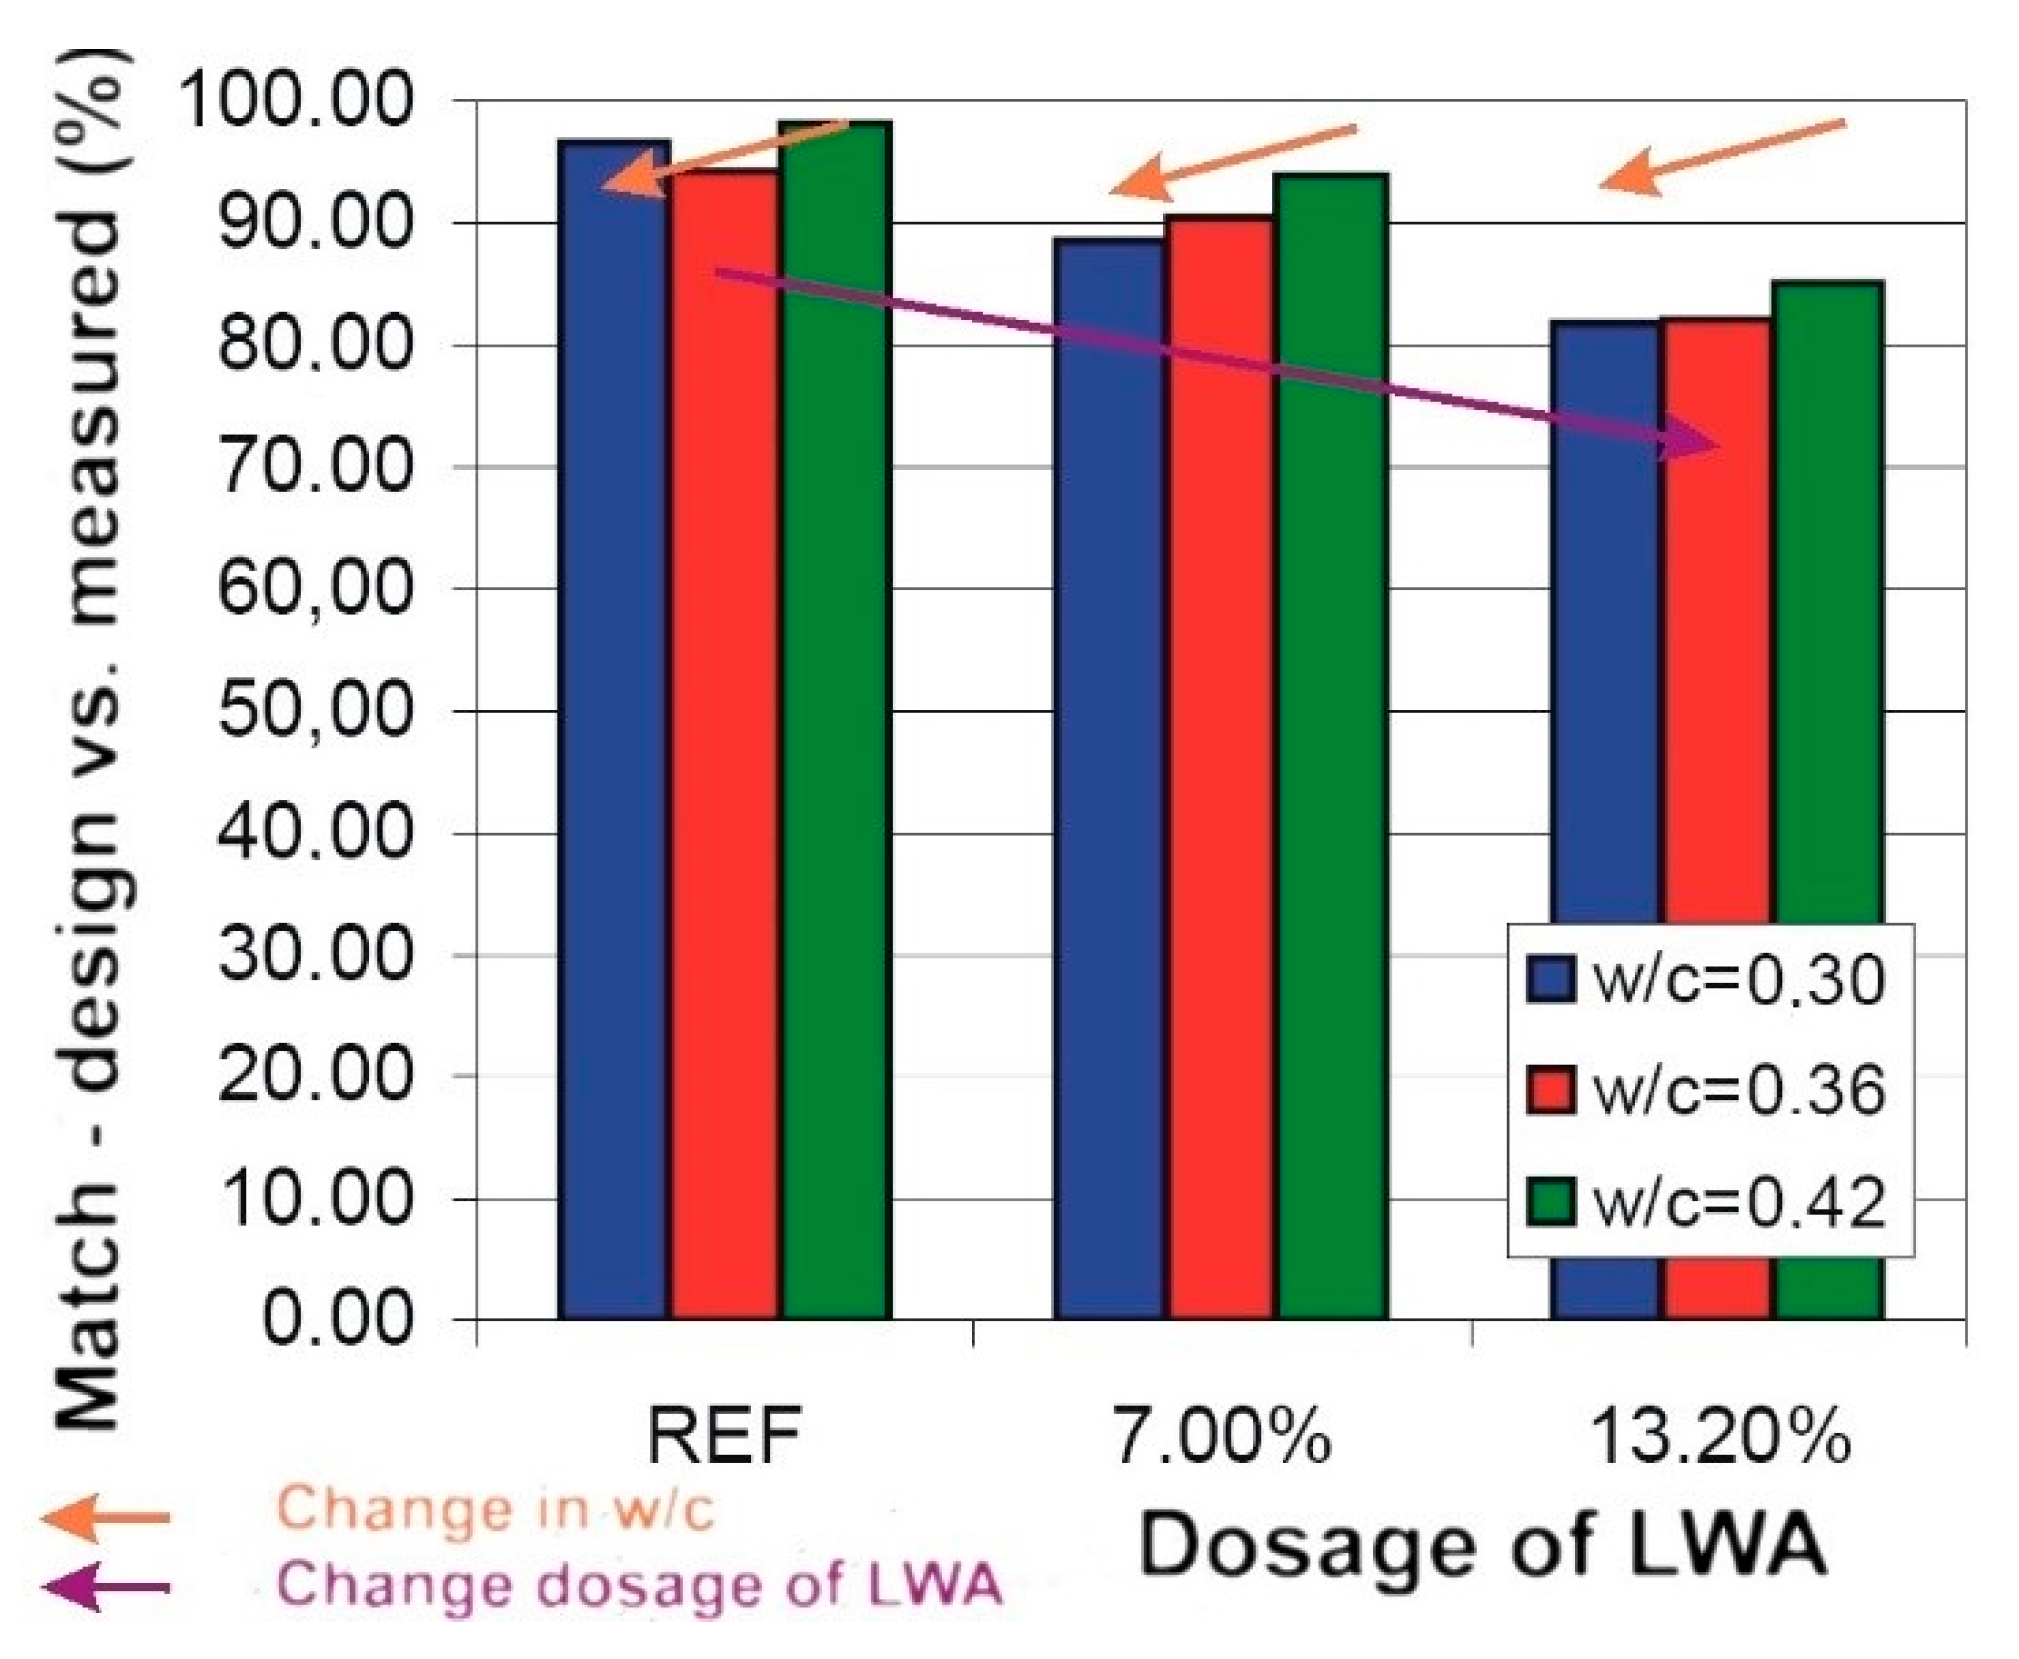
Figure 5 demonstrates the relation of the measured and expected bulk densities using three different w/c ratios and vectors with the contribution of the dosage of LWA and change in w/c. Figure 6 more clearly demonstrates the relative deviations of the measured bulk densities from the expected ones or the matching of the expectations to the actual measured data. Through a simple visual comparison, the effect of w/c, but mainly the decisive impact of the dosage of LWA, can be observed. Figure 6 (in the reference concrete column) achieves a compliance of 94–98%, which indicates that the design method can be used as such. Moreover, the bulk density was measured after conditioning that lasted 24 h at 20 °C and RH 98%. In reality, this allows some moisture losses from the samples into the ambient environment.
Modifications or corrections can be desired for a mixture design model for IC using LWA. They can principally be done in several ways, i.e., modification of the coefficient of saturation, an increase in the expected quantity of the water physically bound to the surface of LWA, modification of the mixing ration of the LWA fractions, or the substitution of fine particles of LWA with coarser ones. It must be noted that any variability in the properties of LWA affects the overall characteristics much more than would be the case with actual concrete with greater Dmax. From the point of view of bulk density, the dosage of 13.2% of LWA was excluded from further testing of the mortars [11,12].

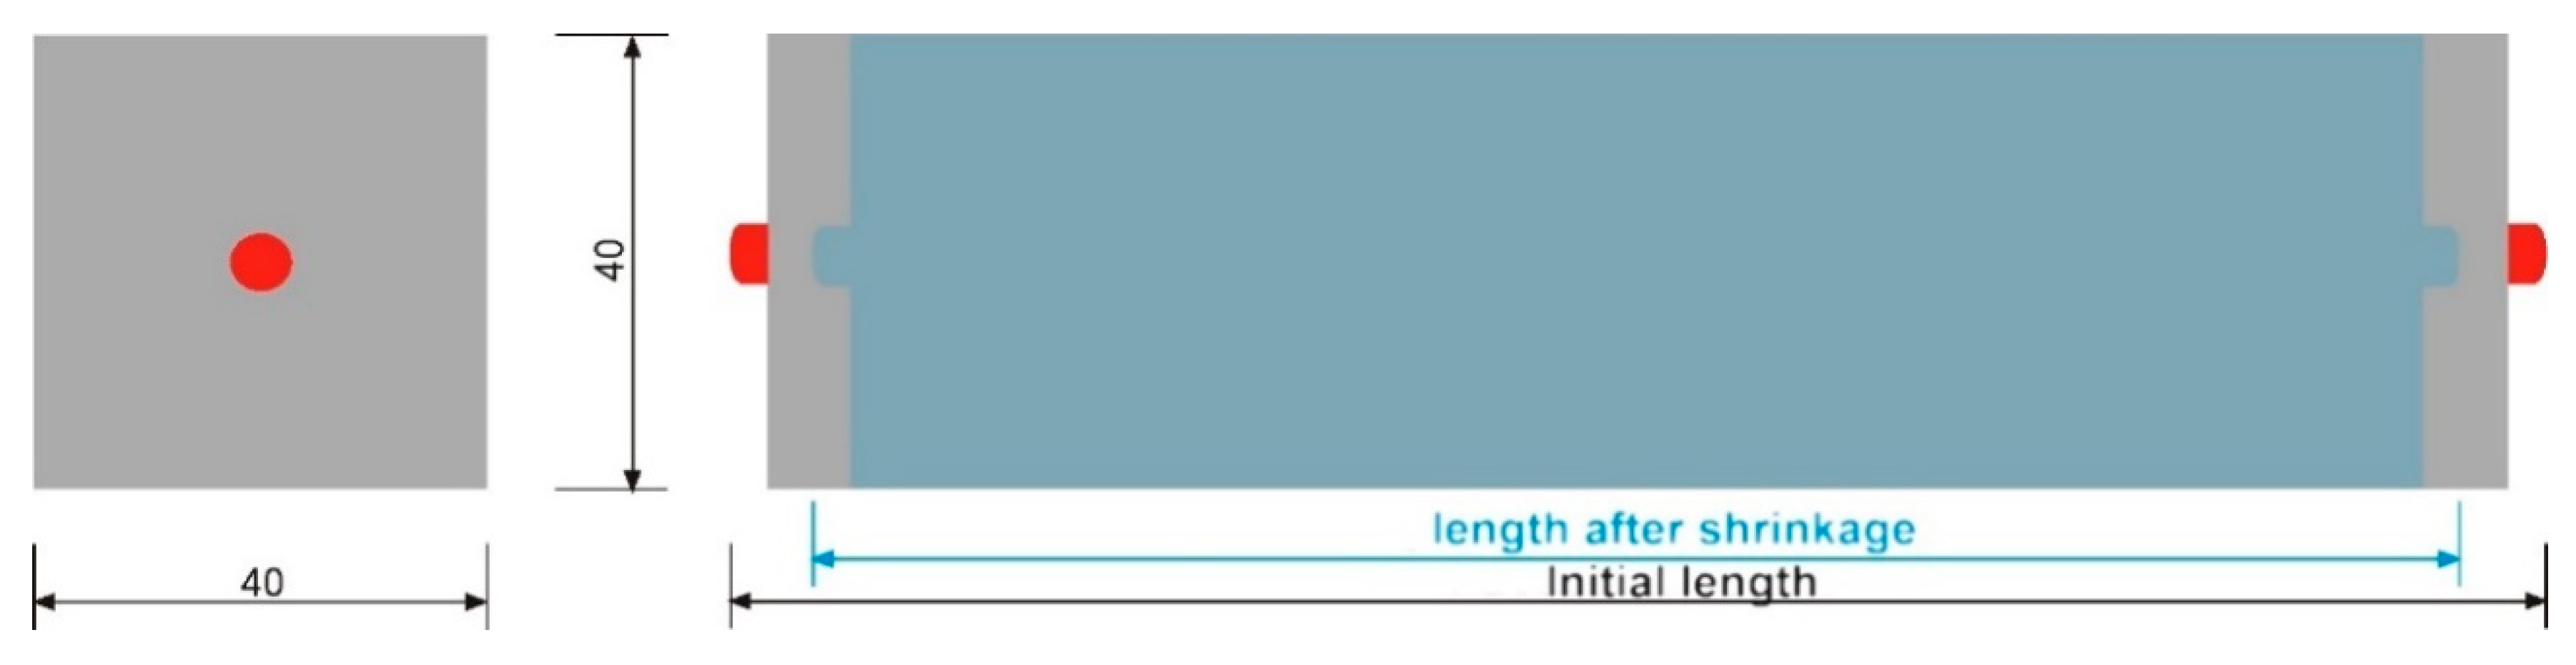
6.2. Changes in Volume

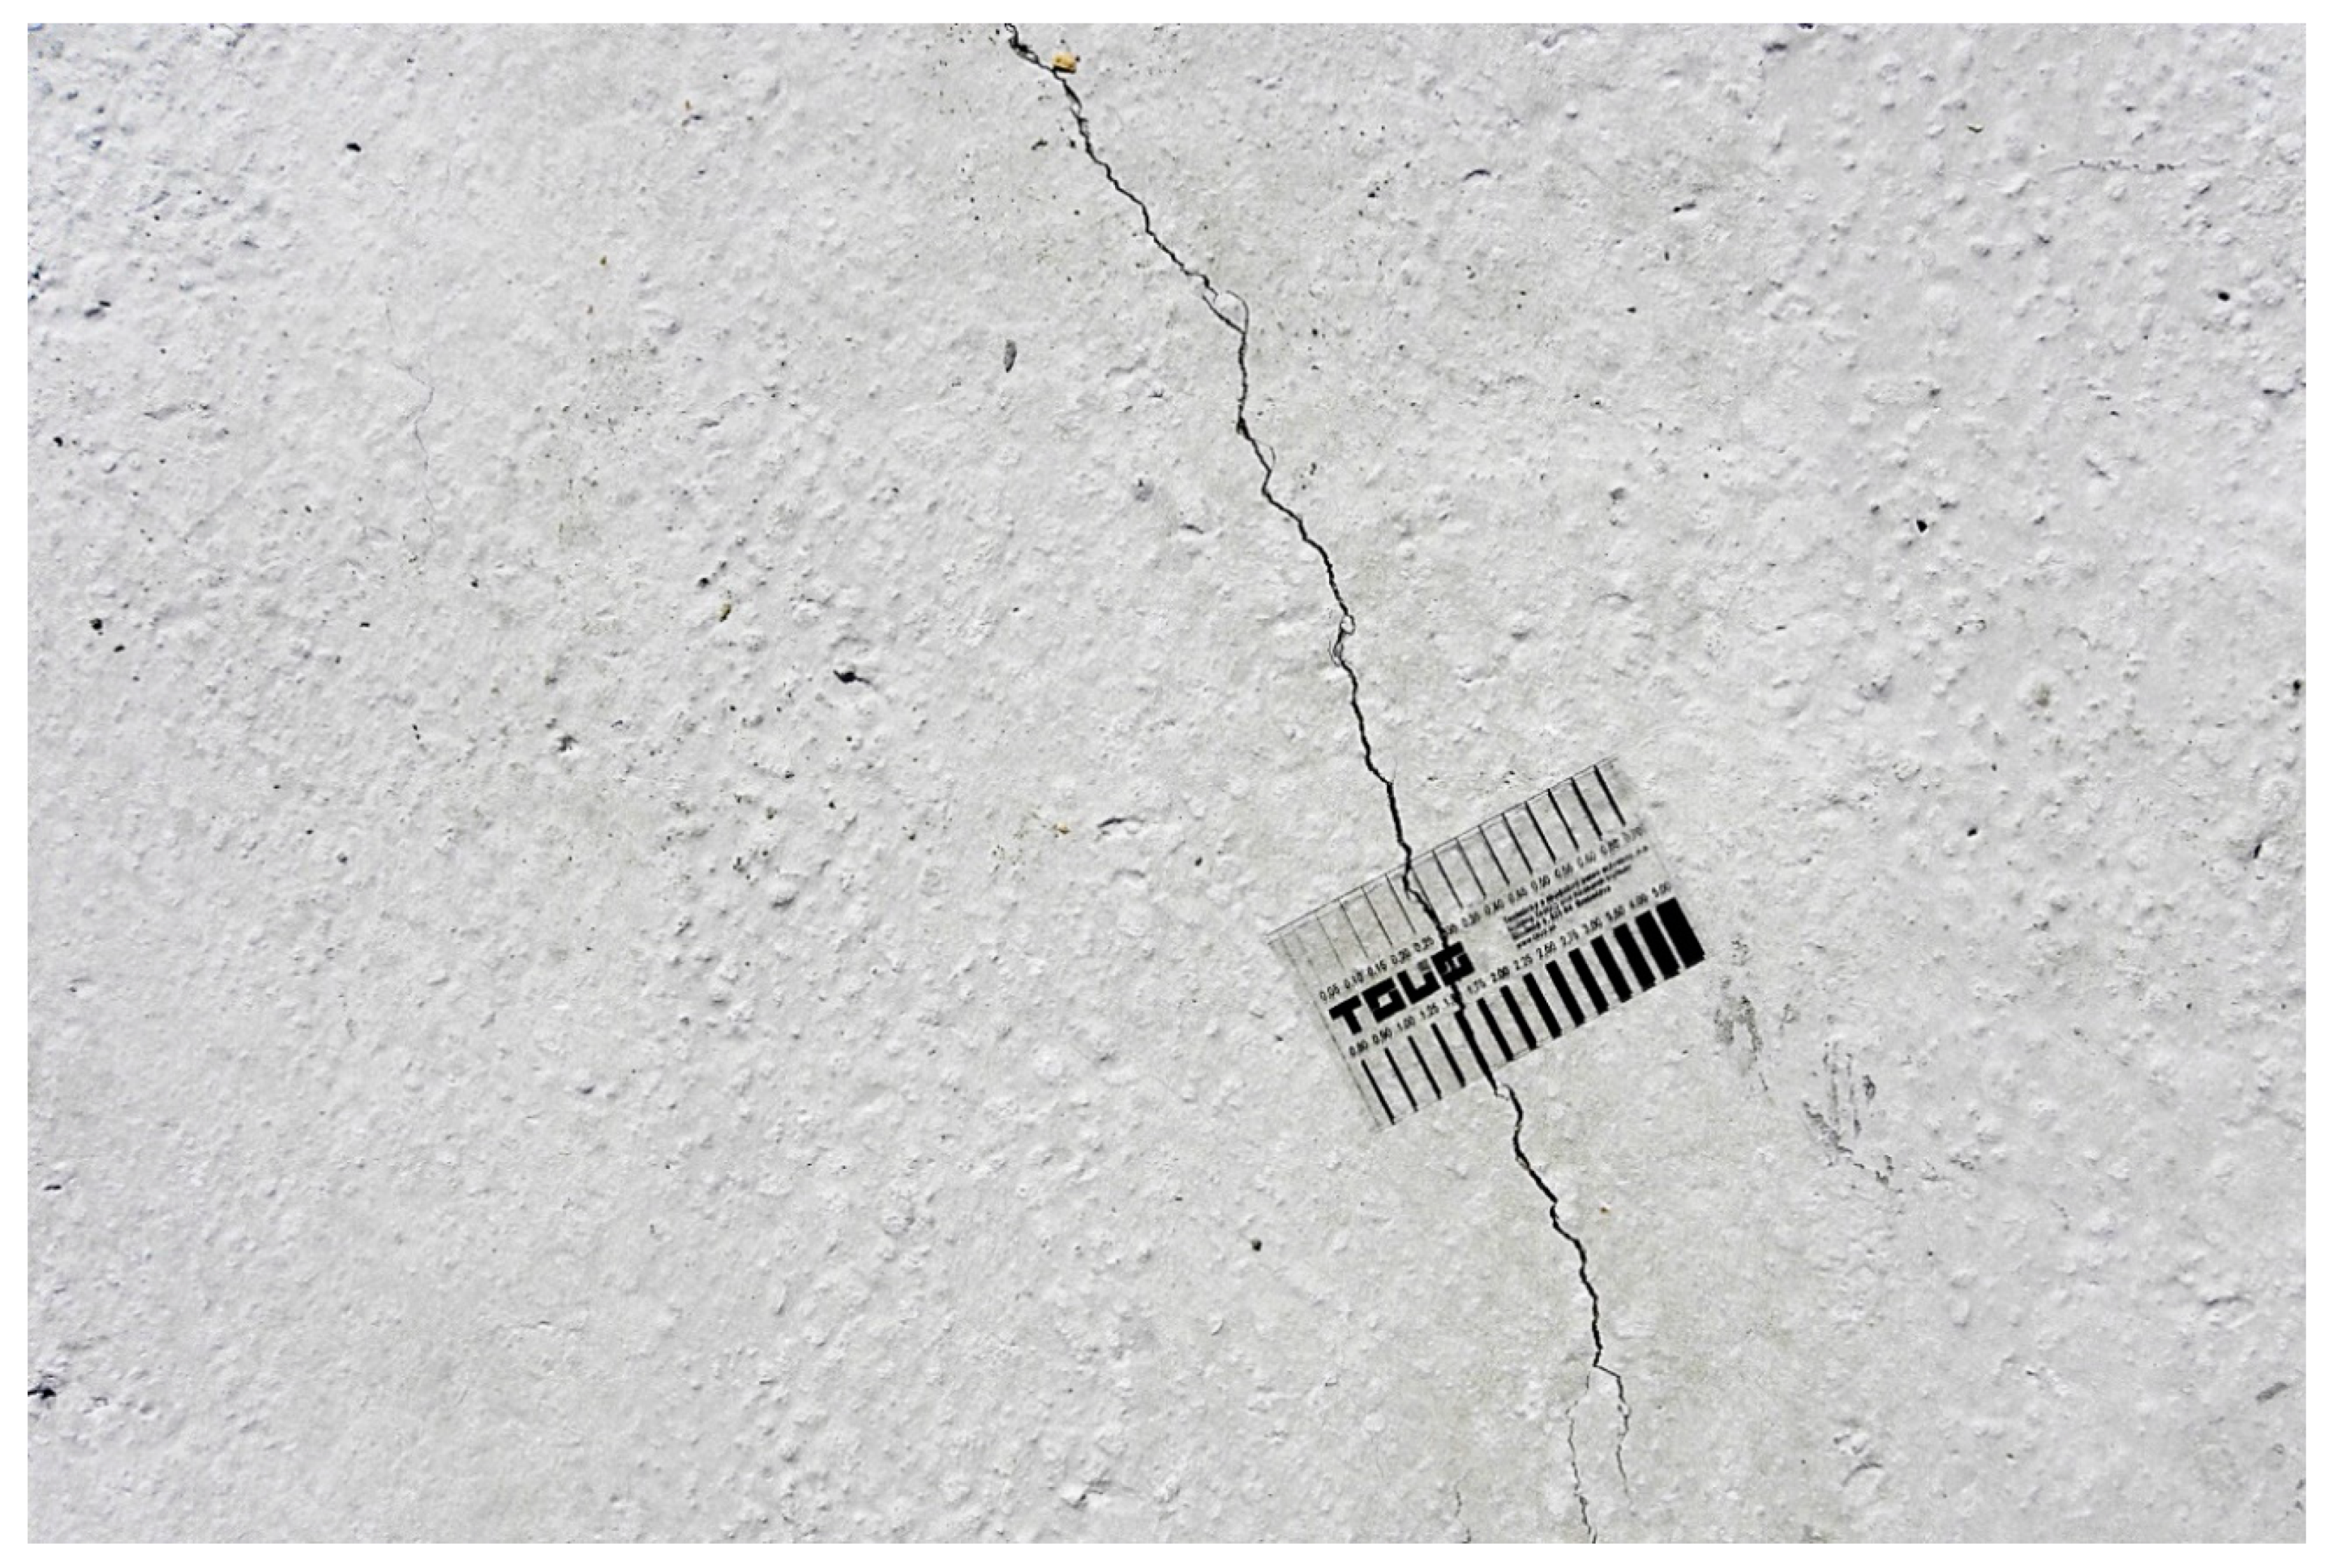
The results of the changes in volume tests (in accordance with [9]) show changes in volume only taking place after the demolding of the testing samples (at the age of 24 h). Technically, the period characterized by the major changes in volume related to hydration is excluded from the analysis. In accordance with the findings of many authors (e.g., [13]), it can be stated that within the first few hours after mixing, the majority of any changes in volume appear. Their nominal value can even represent four times the changes in volume measured by this conventional method on the seventh day. Therefore, the results of these tests must be interpreted as changes in volume taking place between the first and 28th days, despite the results of tests conducted by a similar approach (by [14]) after 90 days, which have been interpreted as ultimate changes in volume (or shrinkage, if you wish). It must be noted that none of the standardized methods catch the changes in volume before the demolding of the samples. We measured the changes in volume (after demolding) upon exposure to the ambient temperature of 20 ± 2 °C and RH 95 ± 5% (an achieved level of 98%).
The development of changes in volume was carried out separately for the variants of the w/c (0.30, 0.36, and 0.42) with corresponding maximum degrees of hydration αmax (0.83, 1.00, and 1.00), respectively. For each w/c variant, we verified the impact of IC on the changes in volume. The main hypothesis behind the IC was that along with the increasing dosage of LWA (7% or 13.2%) and the quantity of the inbuilt water, the changes in volume decrease. The results demonstrated the partial correctness of this assumption. The changes in volume of an ideally sealed system (20 °C and RH 98%) can be understood as a shrinkage of an actual structure with curing ideally mitigating any water losses to the environment.
Figure 7a,b, Figure 8a,b, and Figure 9a,b show the measured (long term of 28 days and short term of five days) changes in volume of the samples with variable dosages of LWA (0, 7, and 13.2%) at different w/c (0.30, 0.36, and 0.42). As previously mentioned, the w/c ratio affects the maximum degree of hydration αmax (0.83, 1.00, and 1.00), which must be considered in the interpretation of the reference sample (0% LWA).
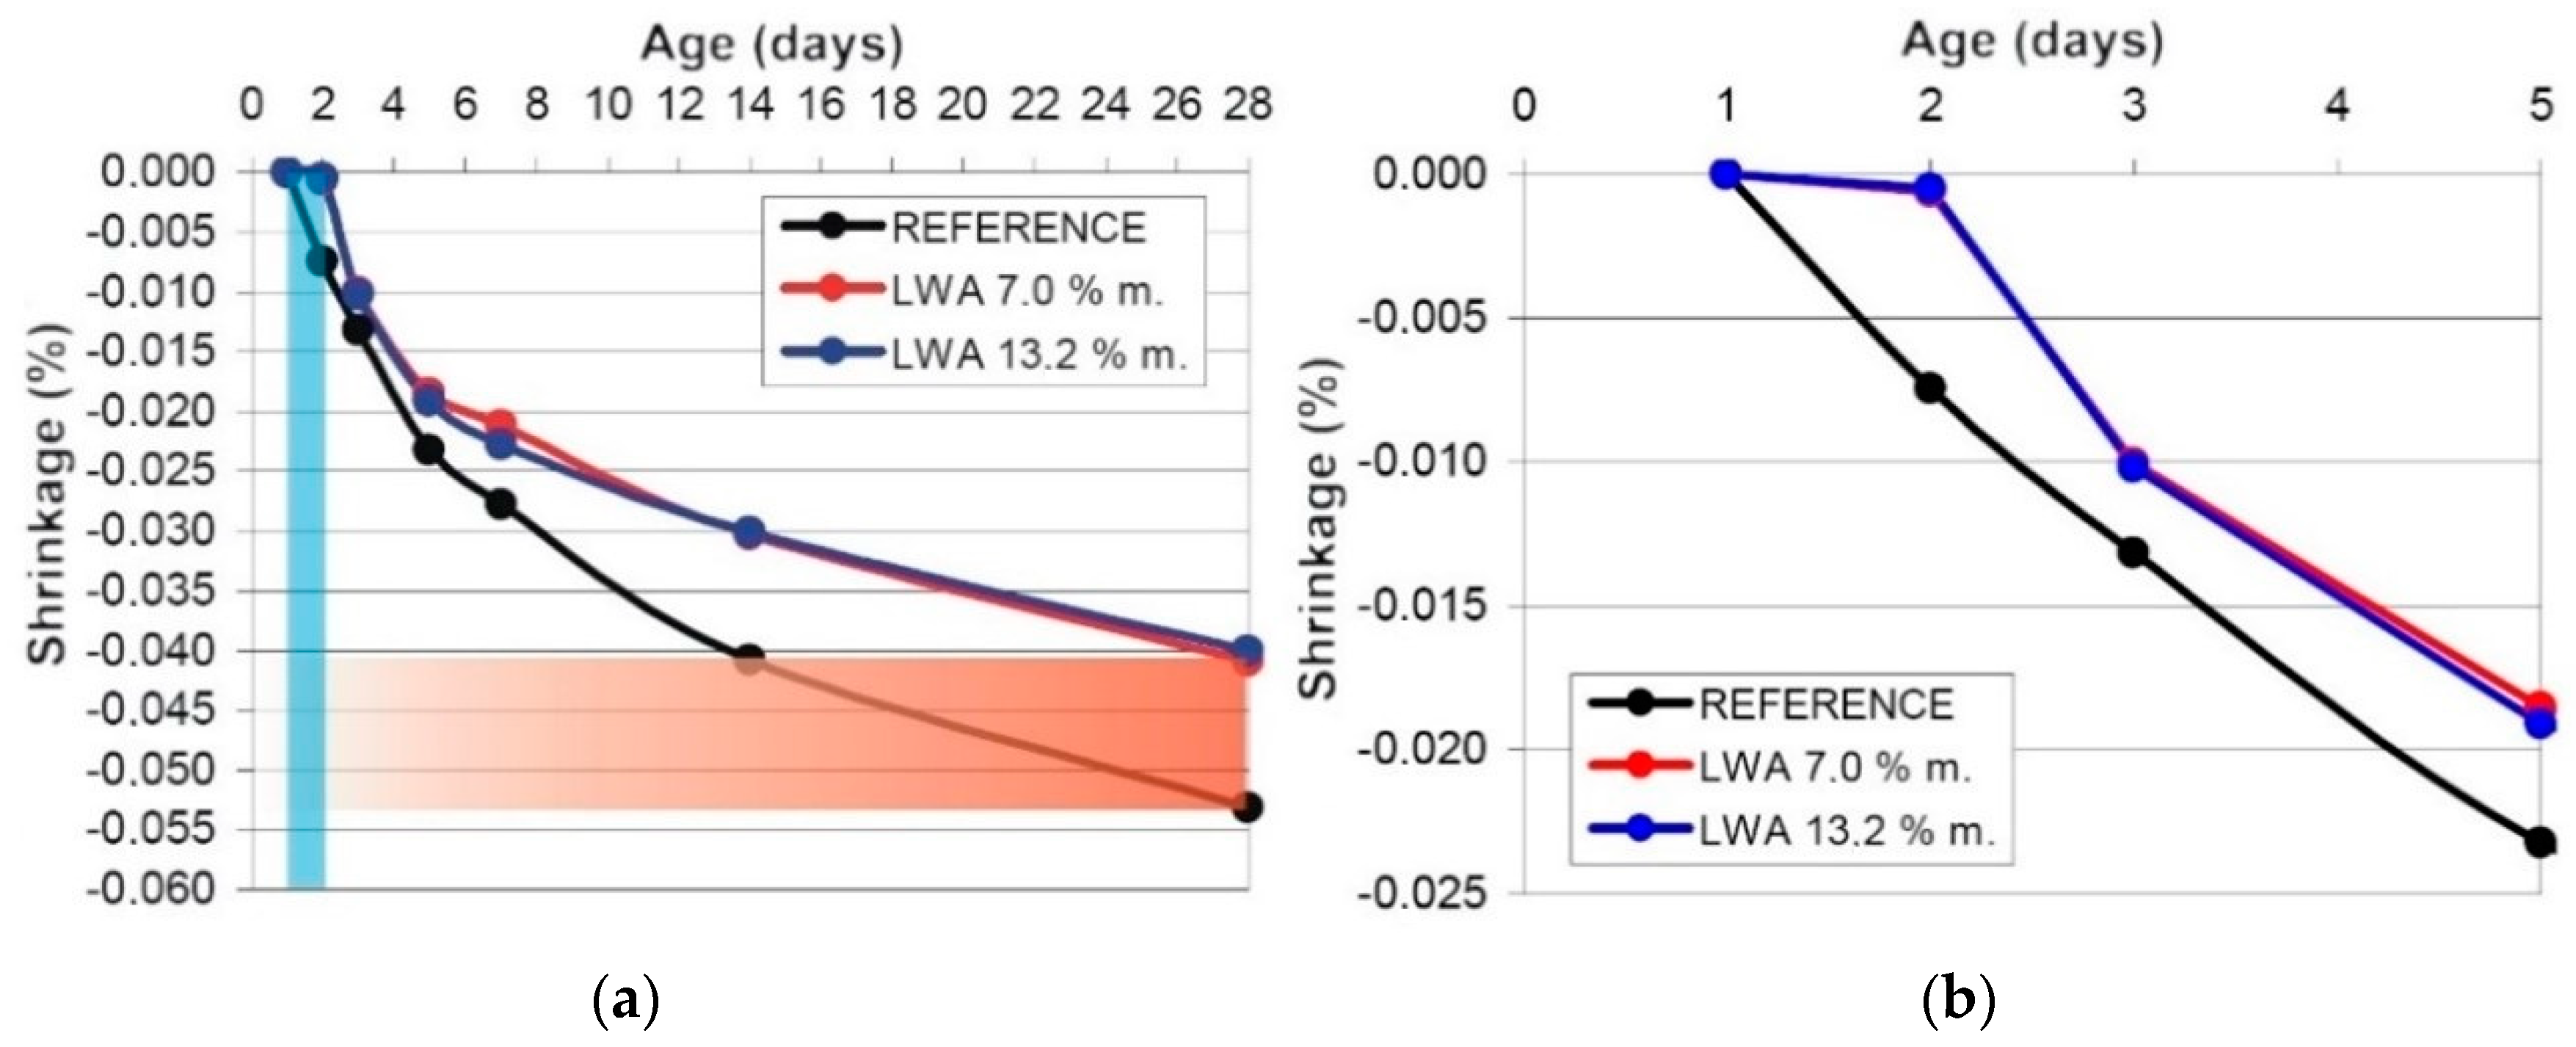
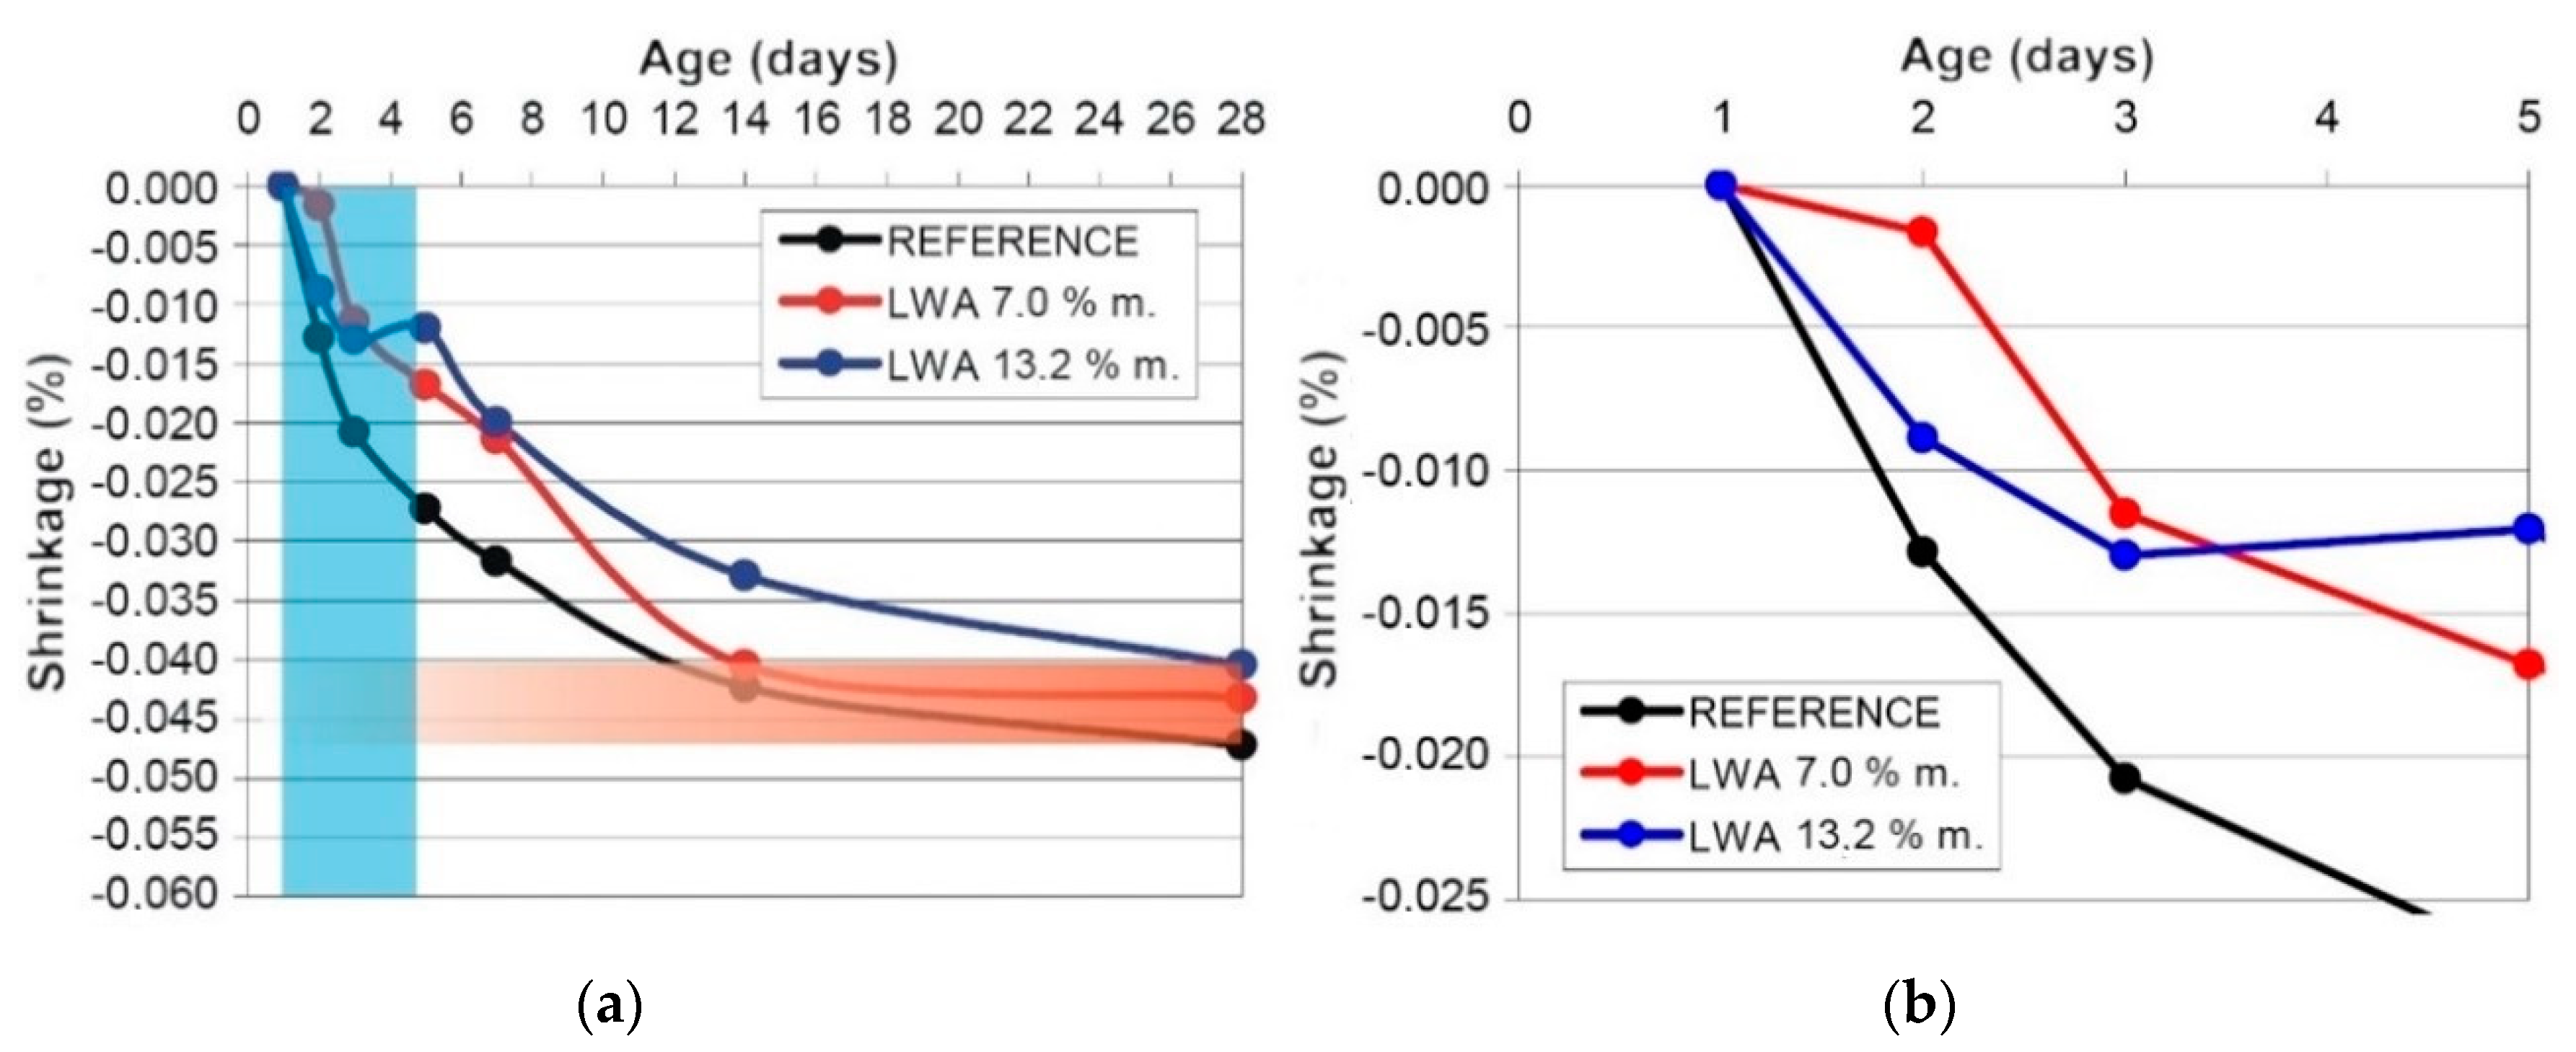
Figure 7a,b shows the evolution over time of the changes in volume of the samples with a very low w/c ratio of 0.30 (αmax = 0.83). From the maximum degree of hydration, it is obvious that the reference sample (without IC) must necessarily undergo self-desiccation and, therefore, significant changes in volume [15]. Through our qualitative analysis of the results, we drew the partial conclusion that IC using 7% and 13.2% of LWA caused a reduction in the changes in volume (in line with previous observations [16]). The reduction on the 28th day can be expressed as 0.015%. Under the assumption that an ideal IC is considered a state when any changes in volume are eliminated, then it can be concluded that under these conditions, the efficiency (difference in shrinkage on the 28th day) of the IC was achieved at approximately 25% (regardless of the dosage of LWA). The contribution of individual dosages of LWA was not reliably determined. The blue area (Figure 7a) highlights the other significant finding. IC postpones the initial changes in volume (in line with [16]), which is favorable due to the higher strengths (as unrestricted changes in volume practically do not exist). The changes in volume at an early age are captured in detail in Figure 7b. It is clear that a change in volume (shrinkage) while IC is used appears for the first time on the second day. This means that until this time, the IC is 100% effective. As seen in Figure 7b (later also Figure 8b), the most likely behavior of the samples with IC during the period that was captured by the measurements should be explained. The samples with IC contained some quantities of curing water, which resulted in a slight swelling, which was also observed in [16,17,18,19]. Then, the shrinkage starts from an “elongation”, and the rate of changes in volume between the first and second day is proportional to the quantity of water released during the swelling of the concrete.
Figure 8a,b shows the evolution over time of changes in volume of the samples with a low w/c ratio of 0.36 (αmax = 1.00). The reference sample (without IC) undergoes self-desiccation, but compared to w/c 0.30 (Figure 7a), the changes in volume are lower, which is a consequence of the higher w/c ratio. The IC using LWA at dosages of 7% and 13.2% caused a reduction of the changes in volume on the 28th day by 0.004–0.007%. The reduction on the 28th day can be expressed as 7–14% (for dosages of 7% and 13.2%, respectively). The blue area (Figure 8a) highlights the postponing of the initial changes in volume at a dosage of 13.2%. This is observable for both dosages, but at a different value. The dosage of 7% behaves in a standard fashion on the second day; it works with an efficiency of 85% (less than in the case of w/c 0.30). The slight drop in efficiency is caused by the relative sufficiency of the water for the hydration of the cement and the related faster (not delayed) development of the changes in volume of the reference sample. From the changes in volume during the development of the sample with 13.2% LWA (Figure 8a), we can observe a swelling on the fifth day. This non-standard behavior (not repeated in any other sample) is attributed to the heterogeneity of the distribution of large pores in LWA [20]. The changes in volume indicate a lack of large pores (ca 50–100 nm) and an excess of small pores (10–30 nm) in the LWA, whereas on the third day, the cement paste achieves an RH limit to release the physically bound water from the tiny pores of LWA. A detailed overview of the changes in volume due to the premature age of the concrete is shown in Figure 8b.
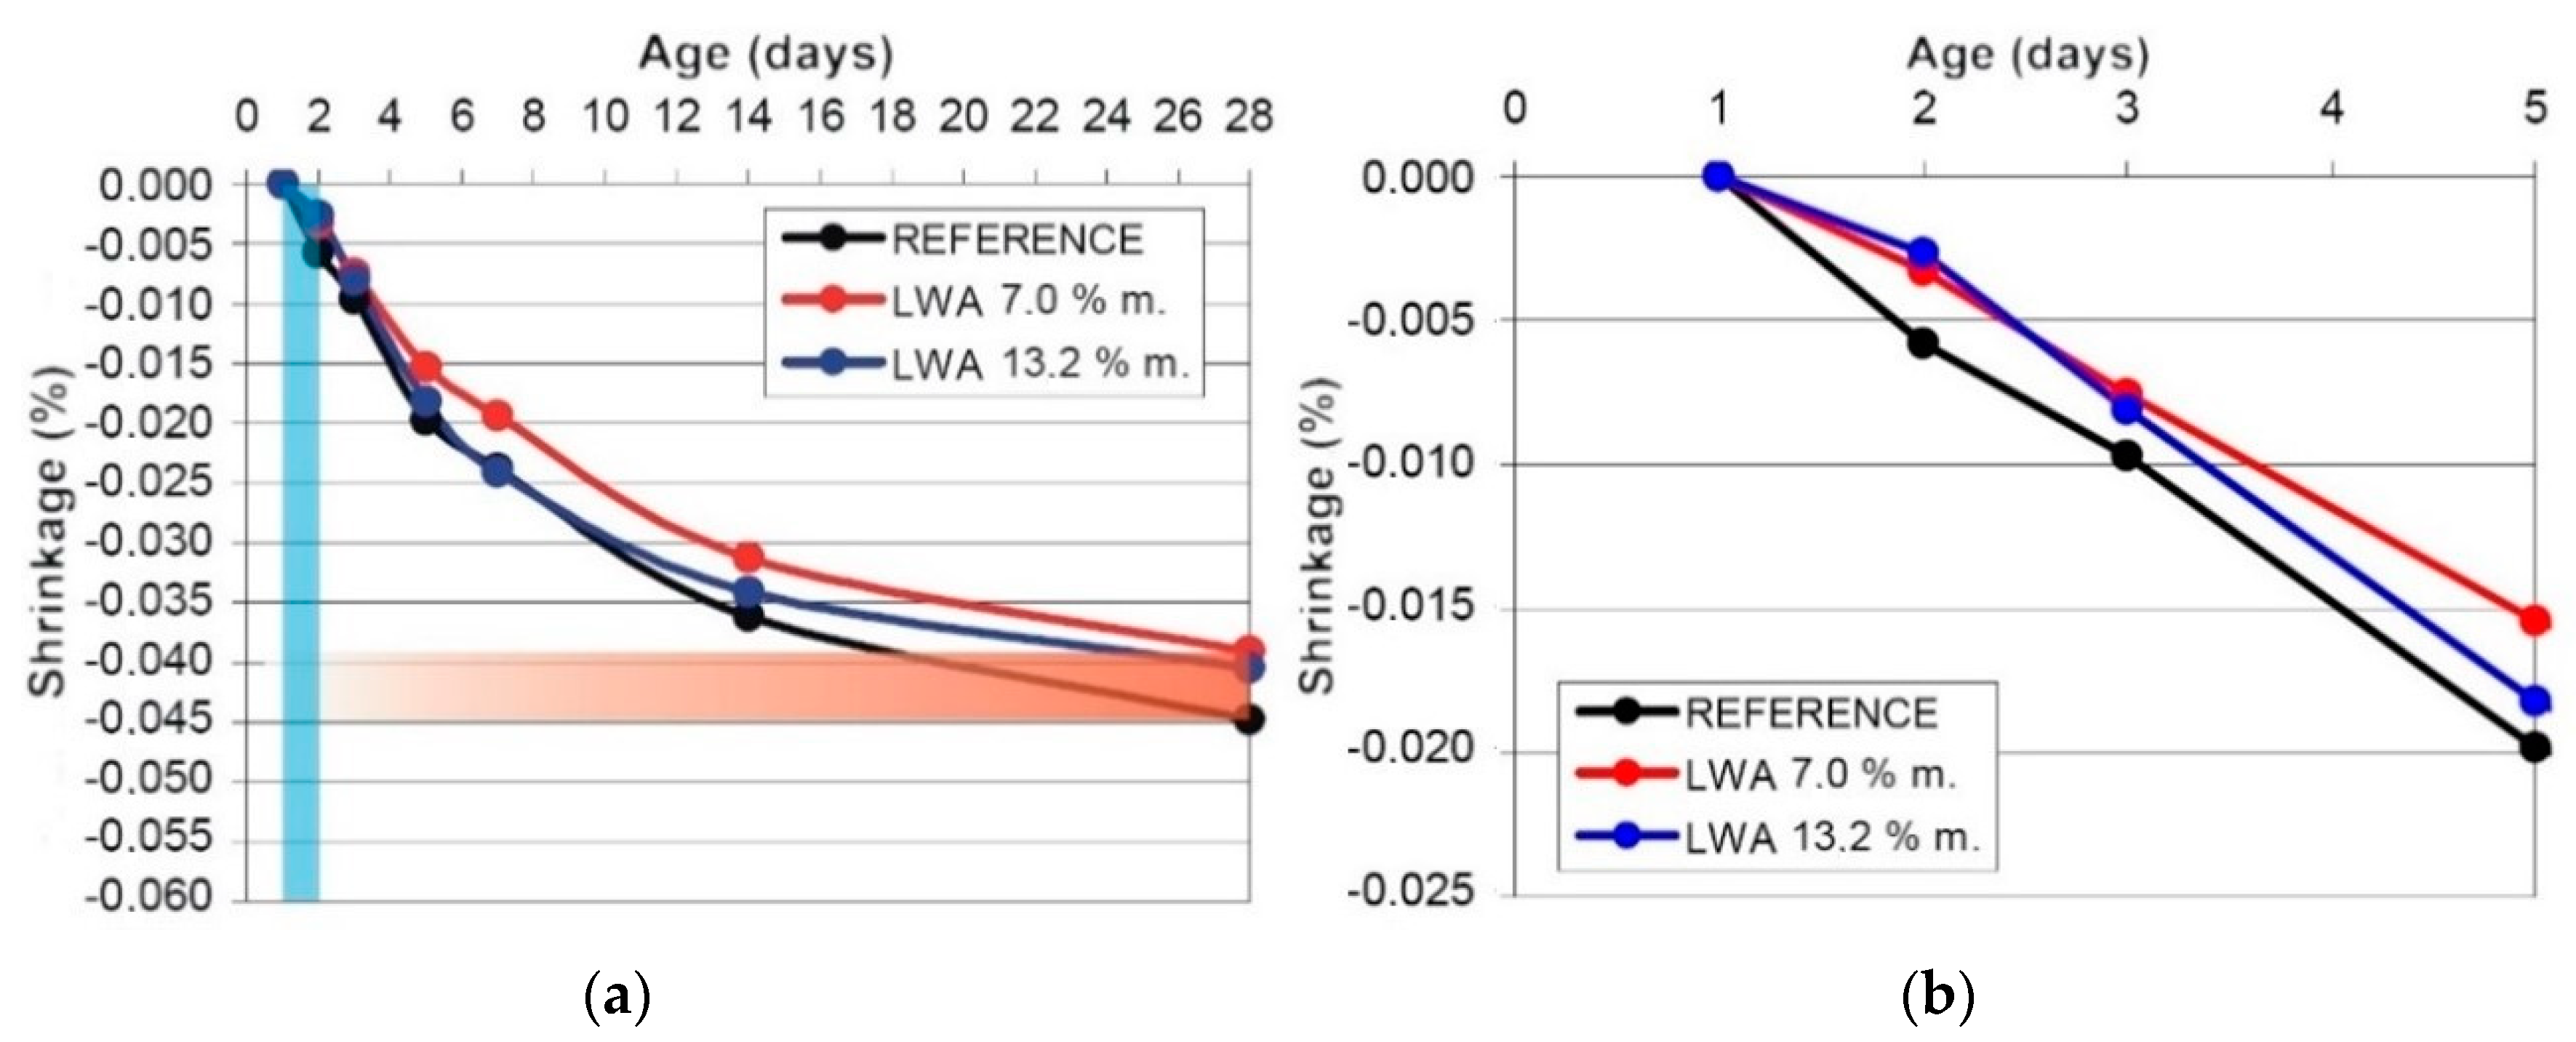
Figure 9a,b shows the evolution over time of the changes in volume of the samples (of NSC) with the quite regular w/c ratio of 0.42 (αmax = 1.00). The reference sample (without IC) did not undergo self-desiccation. The w/c ratio is sufficient for covering the need of water to achieve αmax = 1.00 without any supplementary curing water. Compared to w/c 0.30 (Figure 7a), the changes in volume, in line with the expectations according to αmax on the age 28 day, are the same as in the case of w/c 0.36 (Figure 8a). The IC using LWA (in dosages of 7% and 13.2%) caused an insignificant reduction in changes in volume. This reduction was determined on the 28th day with a value of 0.005%. The efficiency of IC under these conditions (on the 28th day) achieved an approximate efficiency of 10% (for both dosages of LWA). The reason for the quite low degree of efficiency can be found in the sufficient moisture for the hydration and low usage (if ever) of water from the saturated pores of LWA. From Figure 9b, some slow changes in the development of the volume can be seen, whereas on the second day, the IC using 7% of LWA ensured an approximate efficiency of IC of 45%, while a dosage of 13.2% ensured an approximate efficiency of 53%. It is obvious that the efficiency of IC decreases with the increasing w/c (in line with [15]). The LWA carries some potential capacity of the curing water, which can be released at a certain time; therefore, its action is limited. The time of action of the LWA tested depends on the boundary conditions of the exposure of the samples, i.e., inducing specific water losses and a drop in the RH of the cement paste. The IC of the quasi-sealed samples (RH 98%) on the second day exhibits an approximate efficiency of 92, 85, and 52% for the pastes of w/c 0.30, 0.36, and 0.42, respectively.
The reduction of the changes in volume on the seventh day, as shown by Henkensiefken and Bents [17], cannot be achieved using LWA. The reason can be found in the pore structure of LWA, which is different. The distribution curve of the pore size was too flat and shifted to a zone of small and medium-sized pores (50 nm) [20].
Any dramatic reduction in the absolute changes in volume by IC cannot be expected. The IC starts its action when the cement paste starts to dry out and when pores of the same size as the larger pores in LWA start to empty. This means that the largest pores in the cement paste (with the largest cumulative volume) have already formed, which is a consequence of autogenous and chemical shrinkage. The main benefit of this method is a delay in the initial changes in volume when the LWA starts to act. This time can be adjusted by a combination of curing methods.

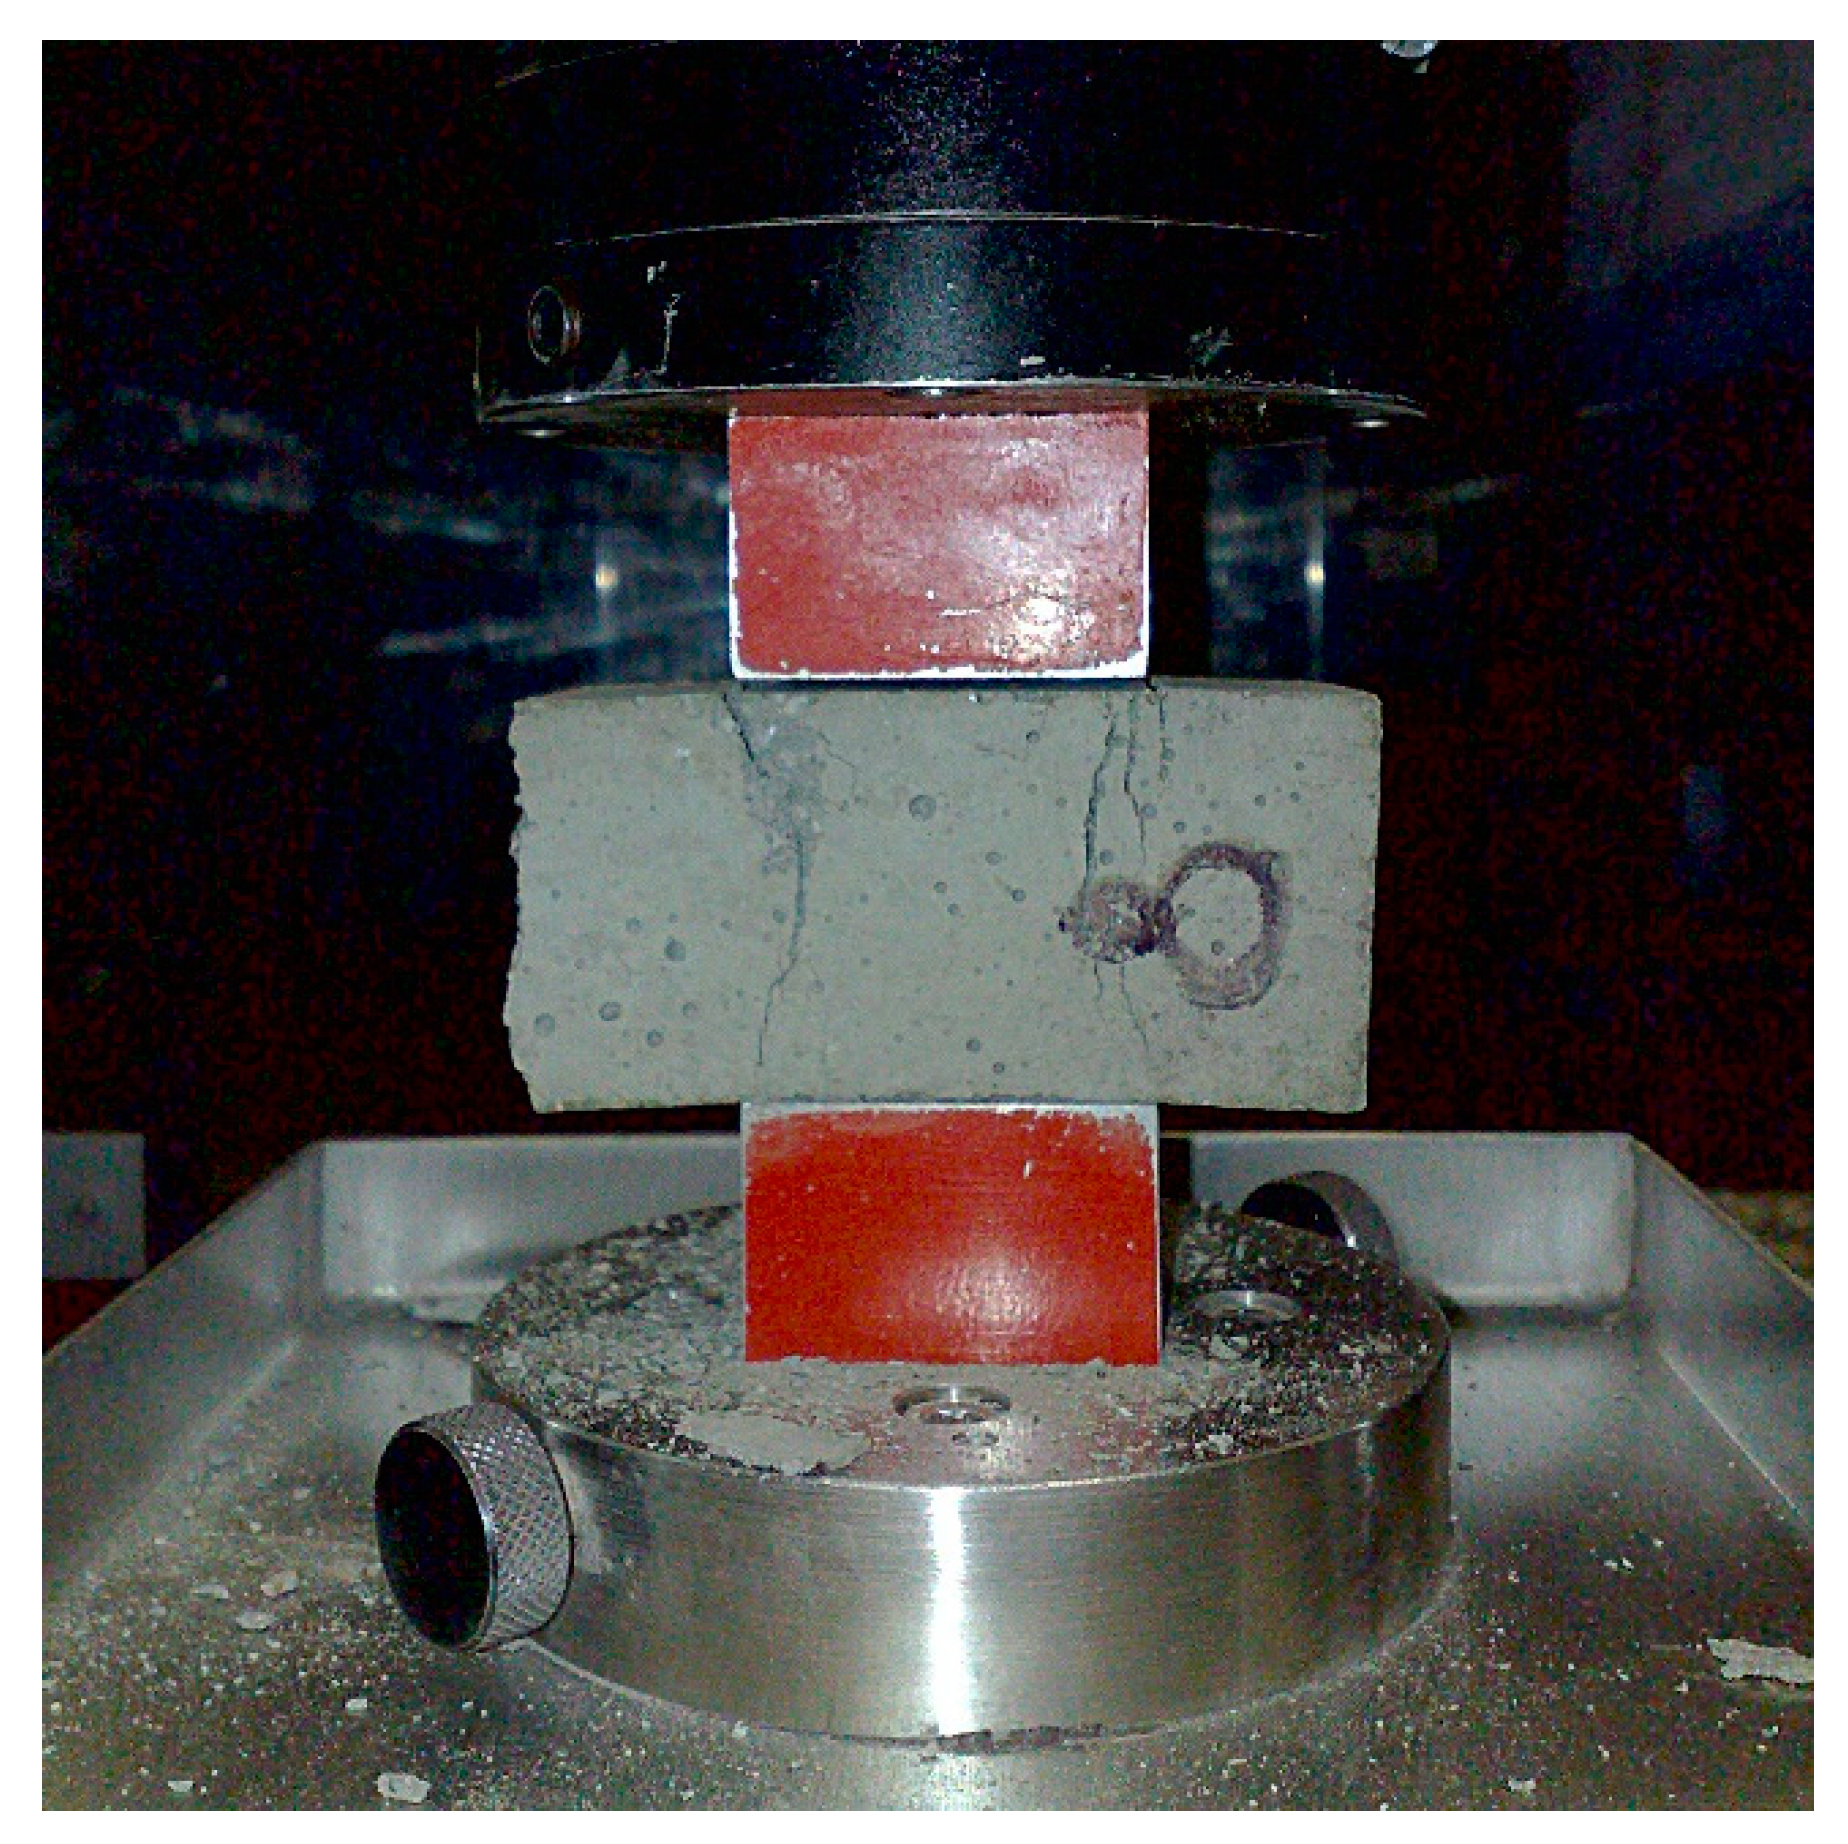
6.3. Compressive Strength

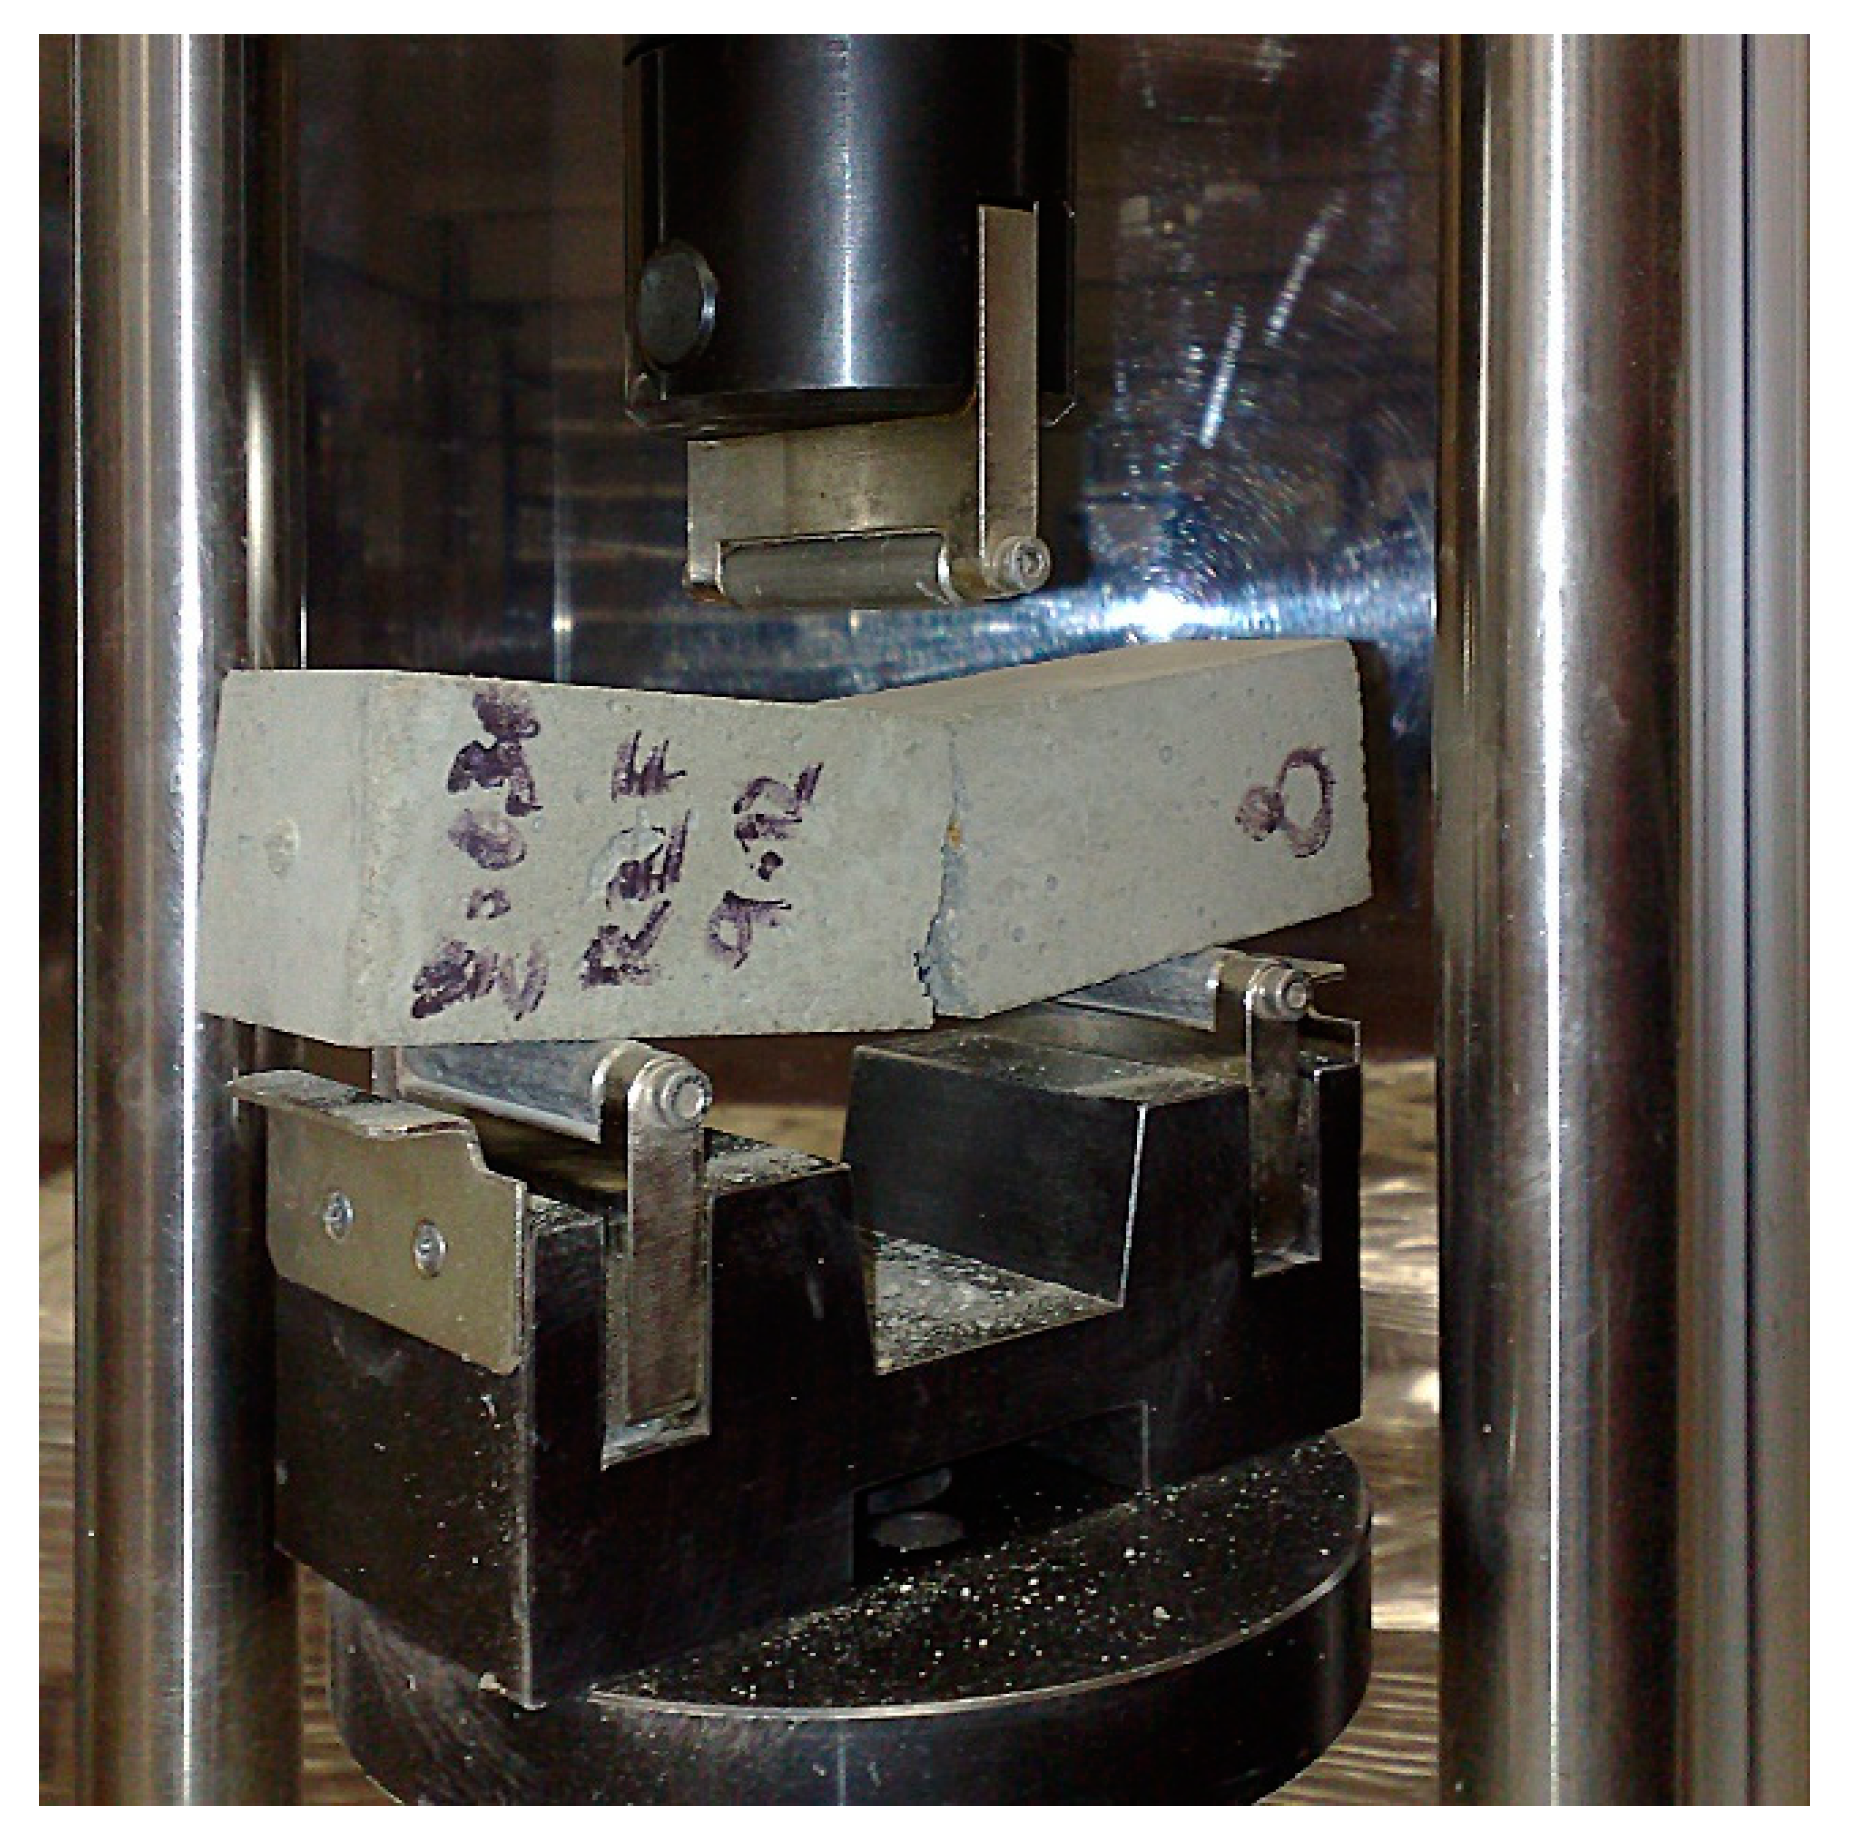
The compressive strength was determined (following [6]) on fragments of the “mortar” prisms, which is interpreted as the mean cube strength at a certain age (7, 14, and 28 days). With these tests, we verified the effect of the LWA dosage on the mechanical performances at various w/c ratios (w/c = 0.30, 0.36, and 0.42) during exposure to the ambient temperature of 20 ± 2 °C and RH 95 ± 5% (achieved RH = 98%), see Table 3. The mean compressive strengths fcm(t) at age t (MPa) were supplemented by the expected evolution of the compressive strength (following the model in [21]), where the coefficient respecting the age of the concrete and medium compressive strength on the 28th day (MPa) occurs. The formula represents the exponential character of the evolution of the compressive strength over time t (d).
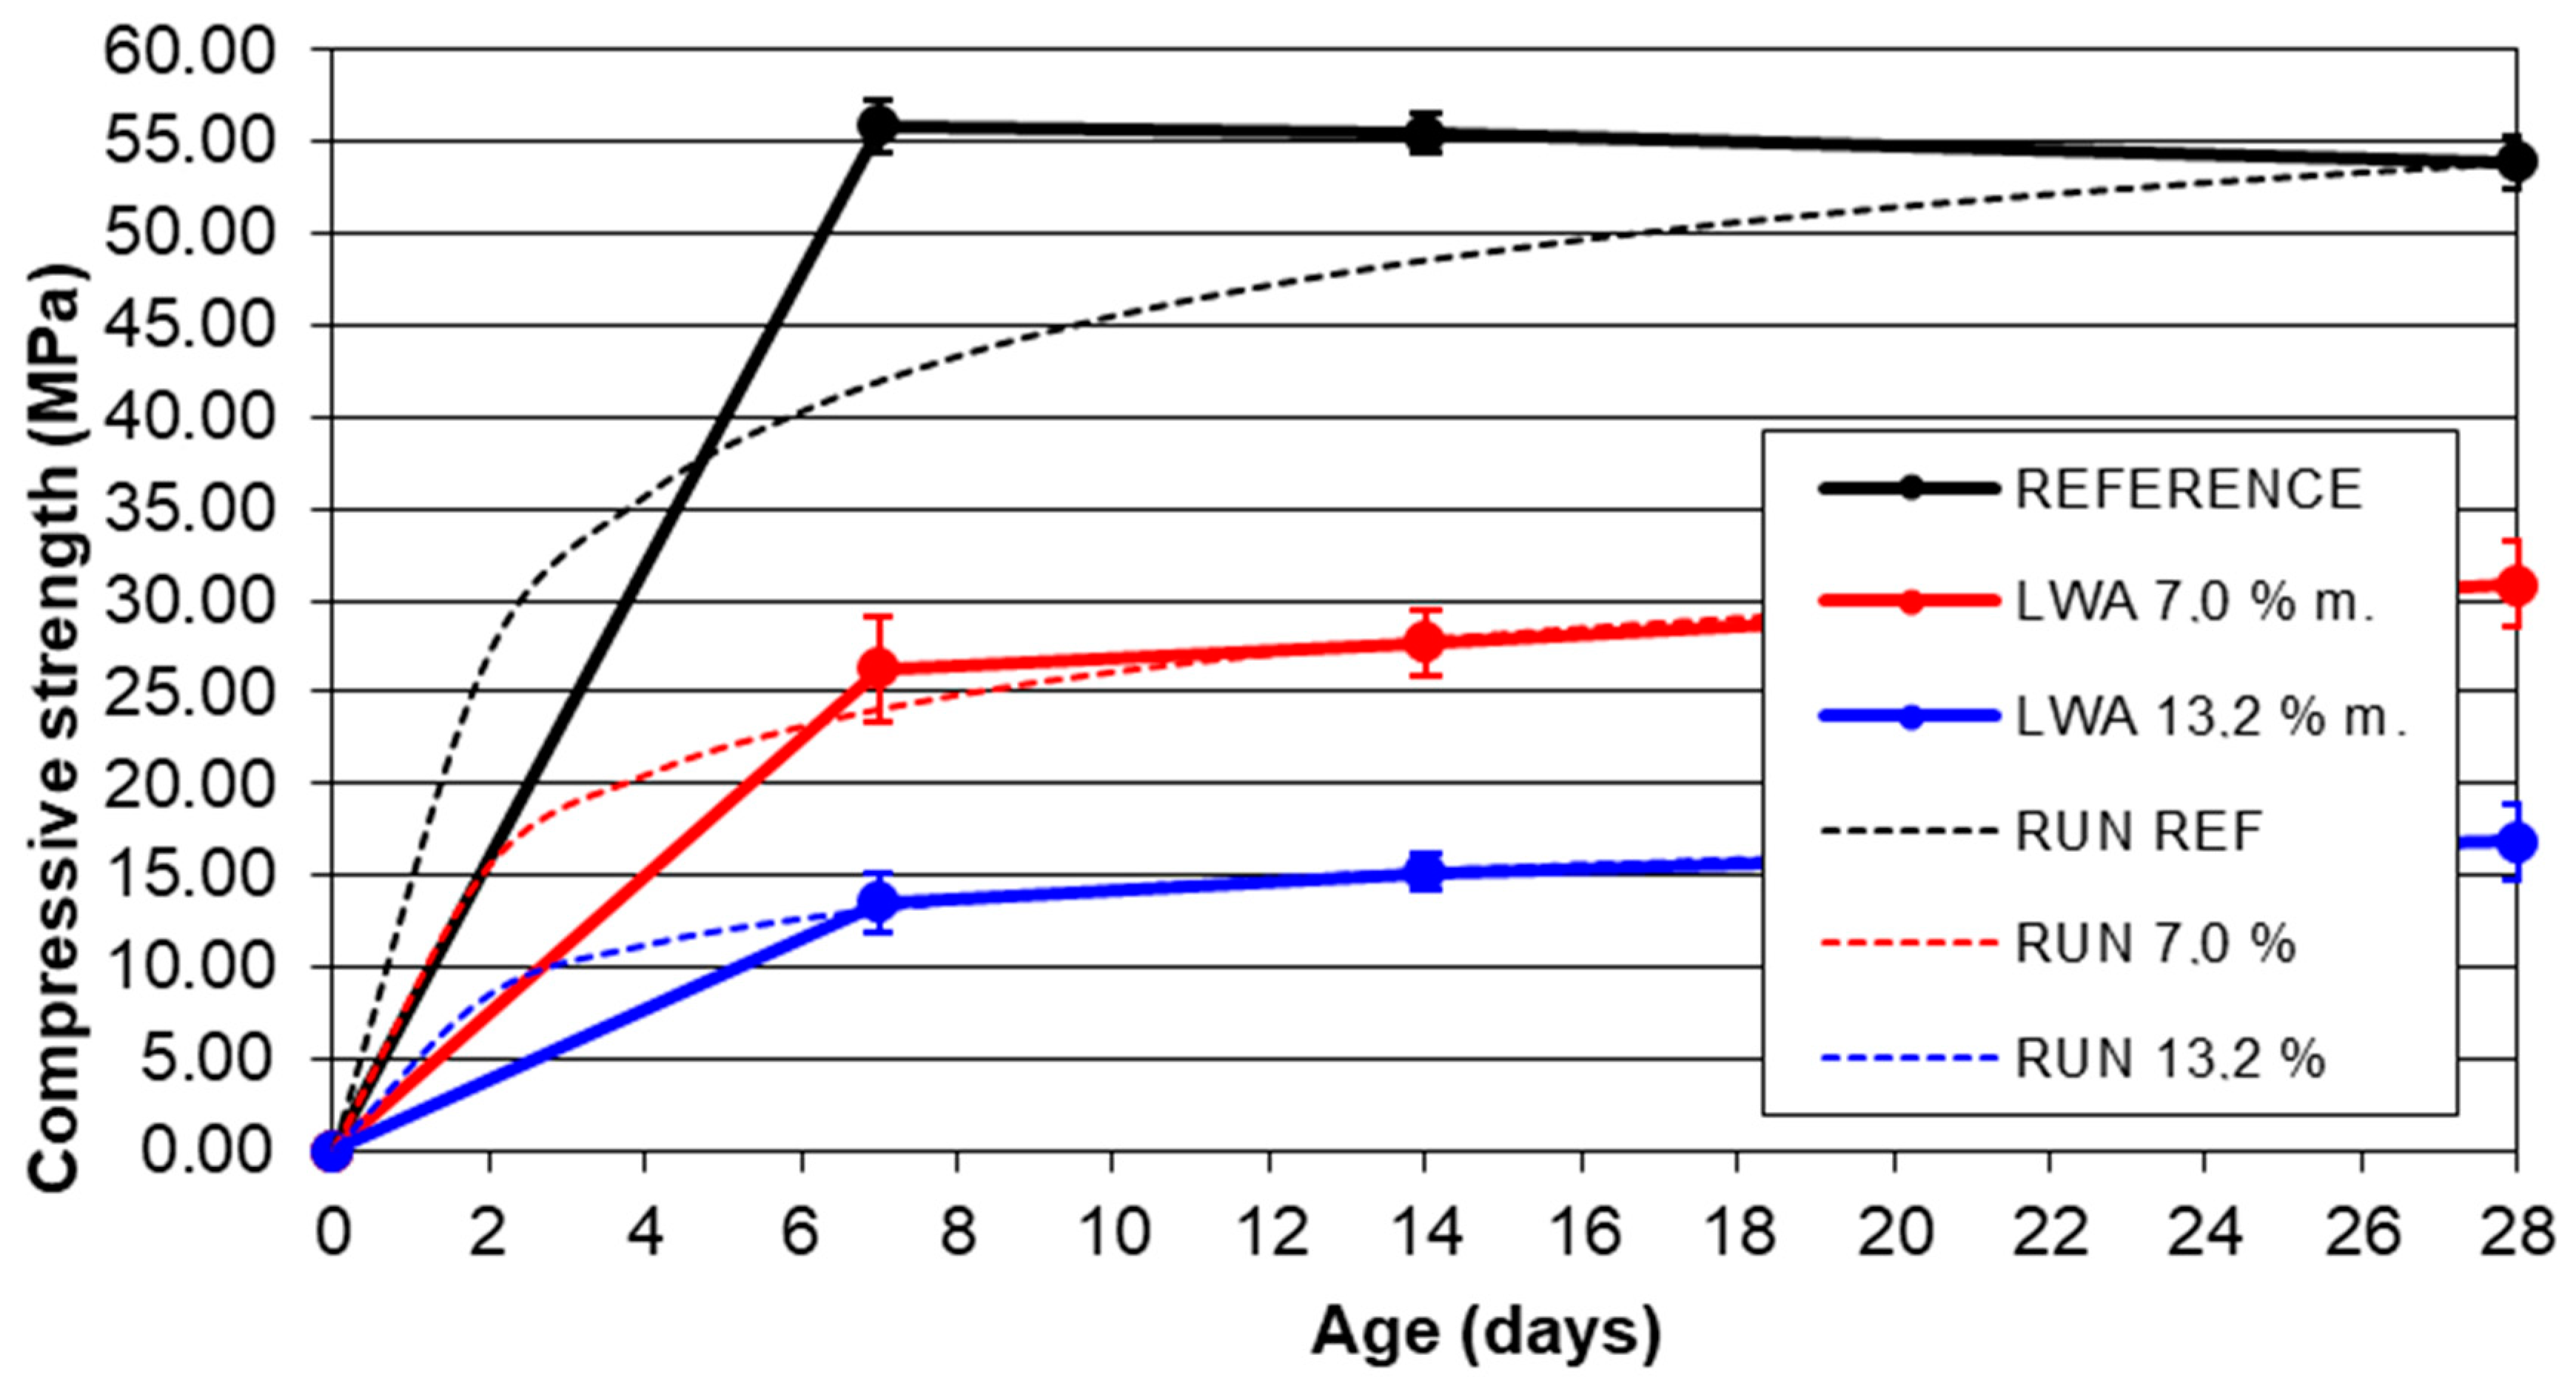
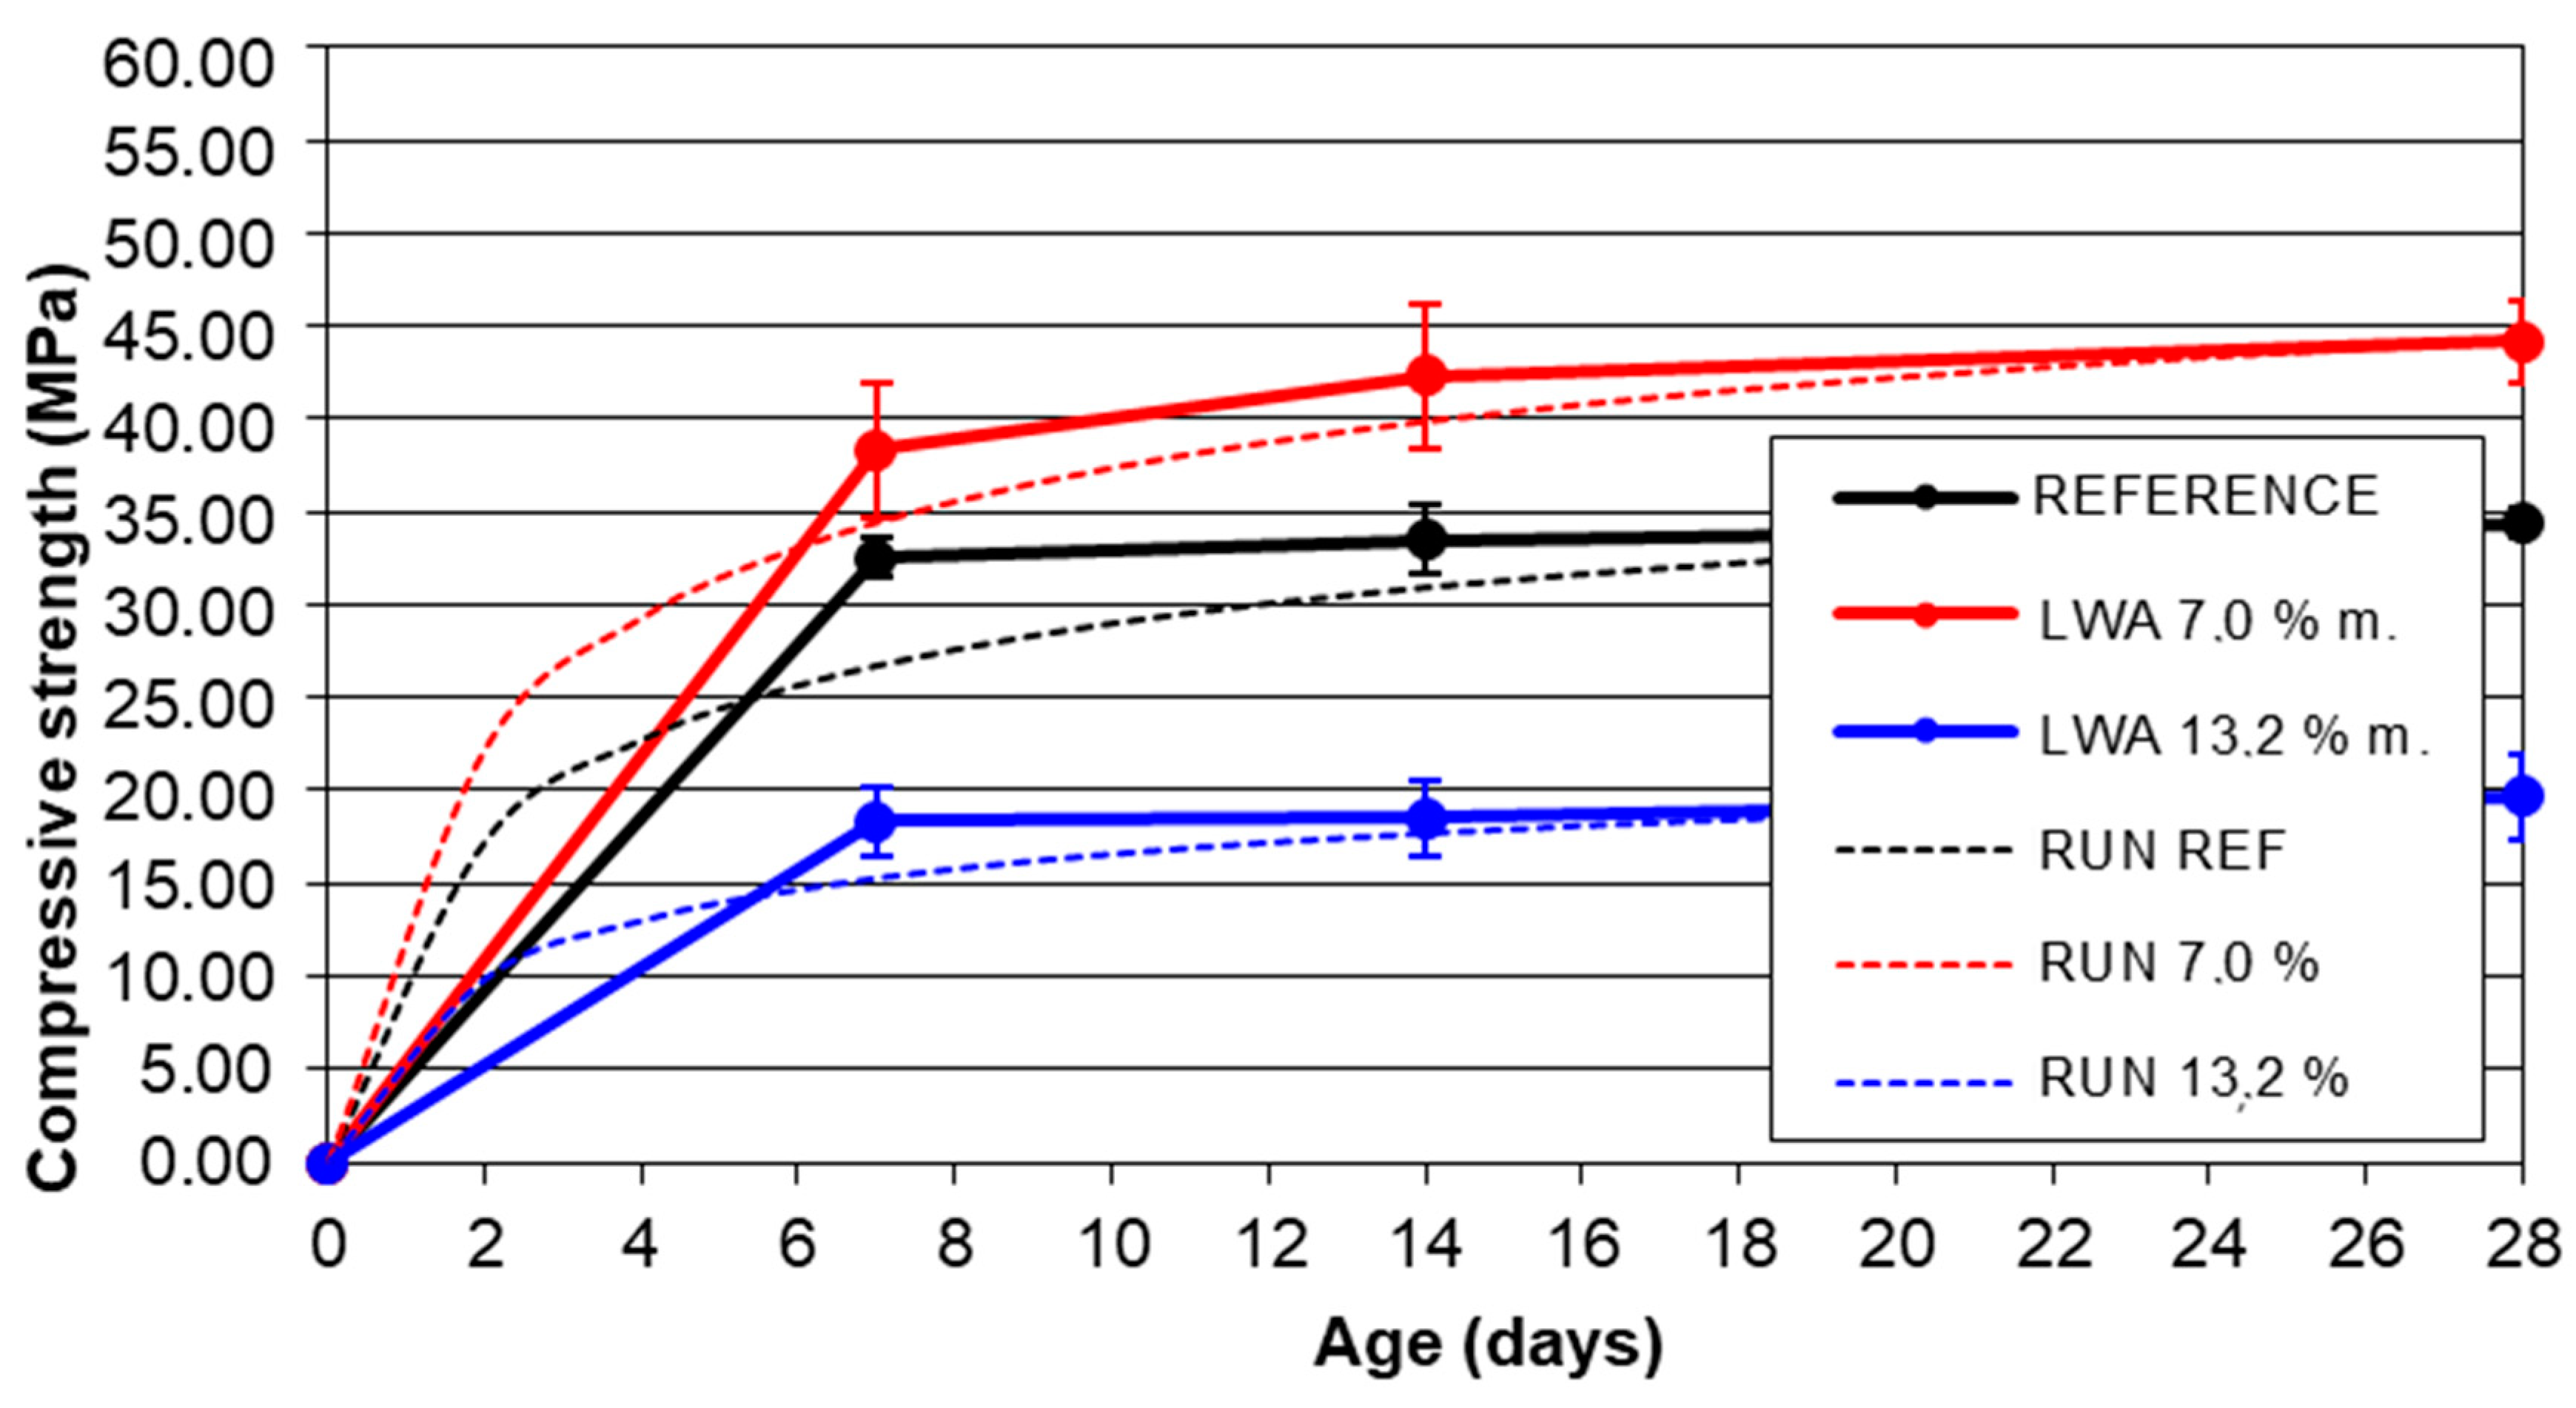
Figure 10 shows the samples (sealed system) of the low w/c ratio 0.30 (αmax = 0.83). The time-dependent evolution of the mean compressive strengths is absolutely normal. We can observe a termination of the hydration on the seventh day in the case of the reference sample, which can be attributed to the consumption of all the water by the hydration. On the other hand, the samples with a certain dosage of LWA demonstrate gradual increases in the compressive strength, which happens due to the release of the curing water from the pore structure of LWA. It can be observed that the absolute values of the final strengths of the samples with LWA are lower than the reference sample. This has a lot to do with the dosage of LWA and its impact on the significant drop in workability (see the bulk density) when replacing some portion of the natural aggregate with LWA. The altered bulk density stands behind the reduction in the final compressive strength due to the lower bulk density of LWA and the decreased workability of the mixture. A similar situation is repeated for all the w/c ratios. The difference is that with the increasing w/c ratio, the reduction in the compressive strength lowers. Assuming the use of regular concretes where we use Dmax much higher than 4 mm, we do not expect any remarkable worsening of the workability.
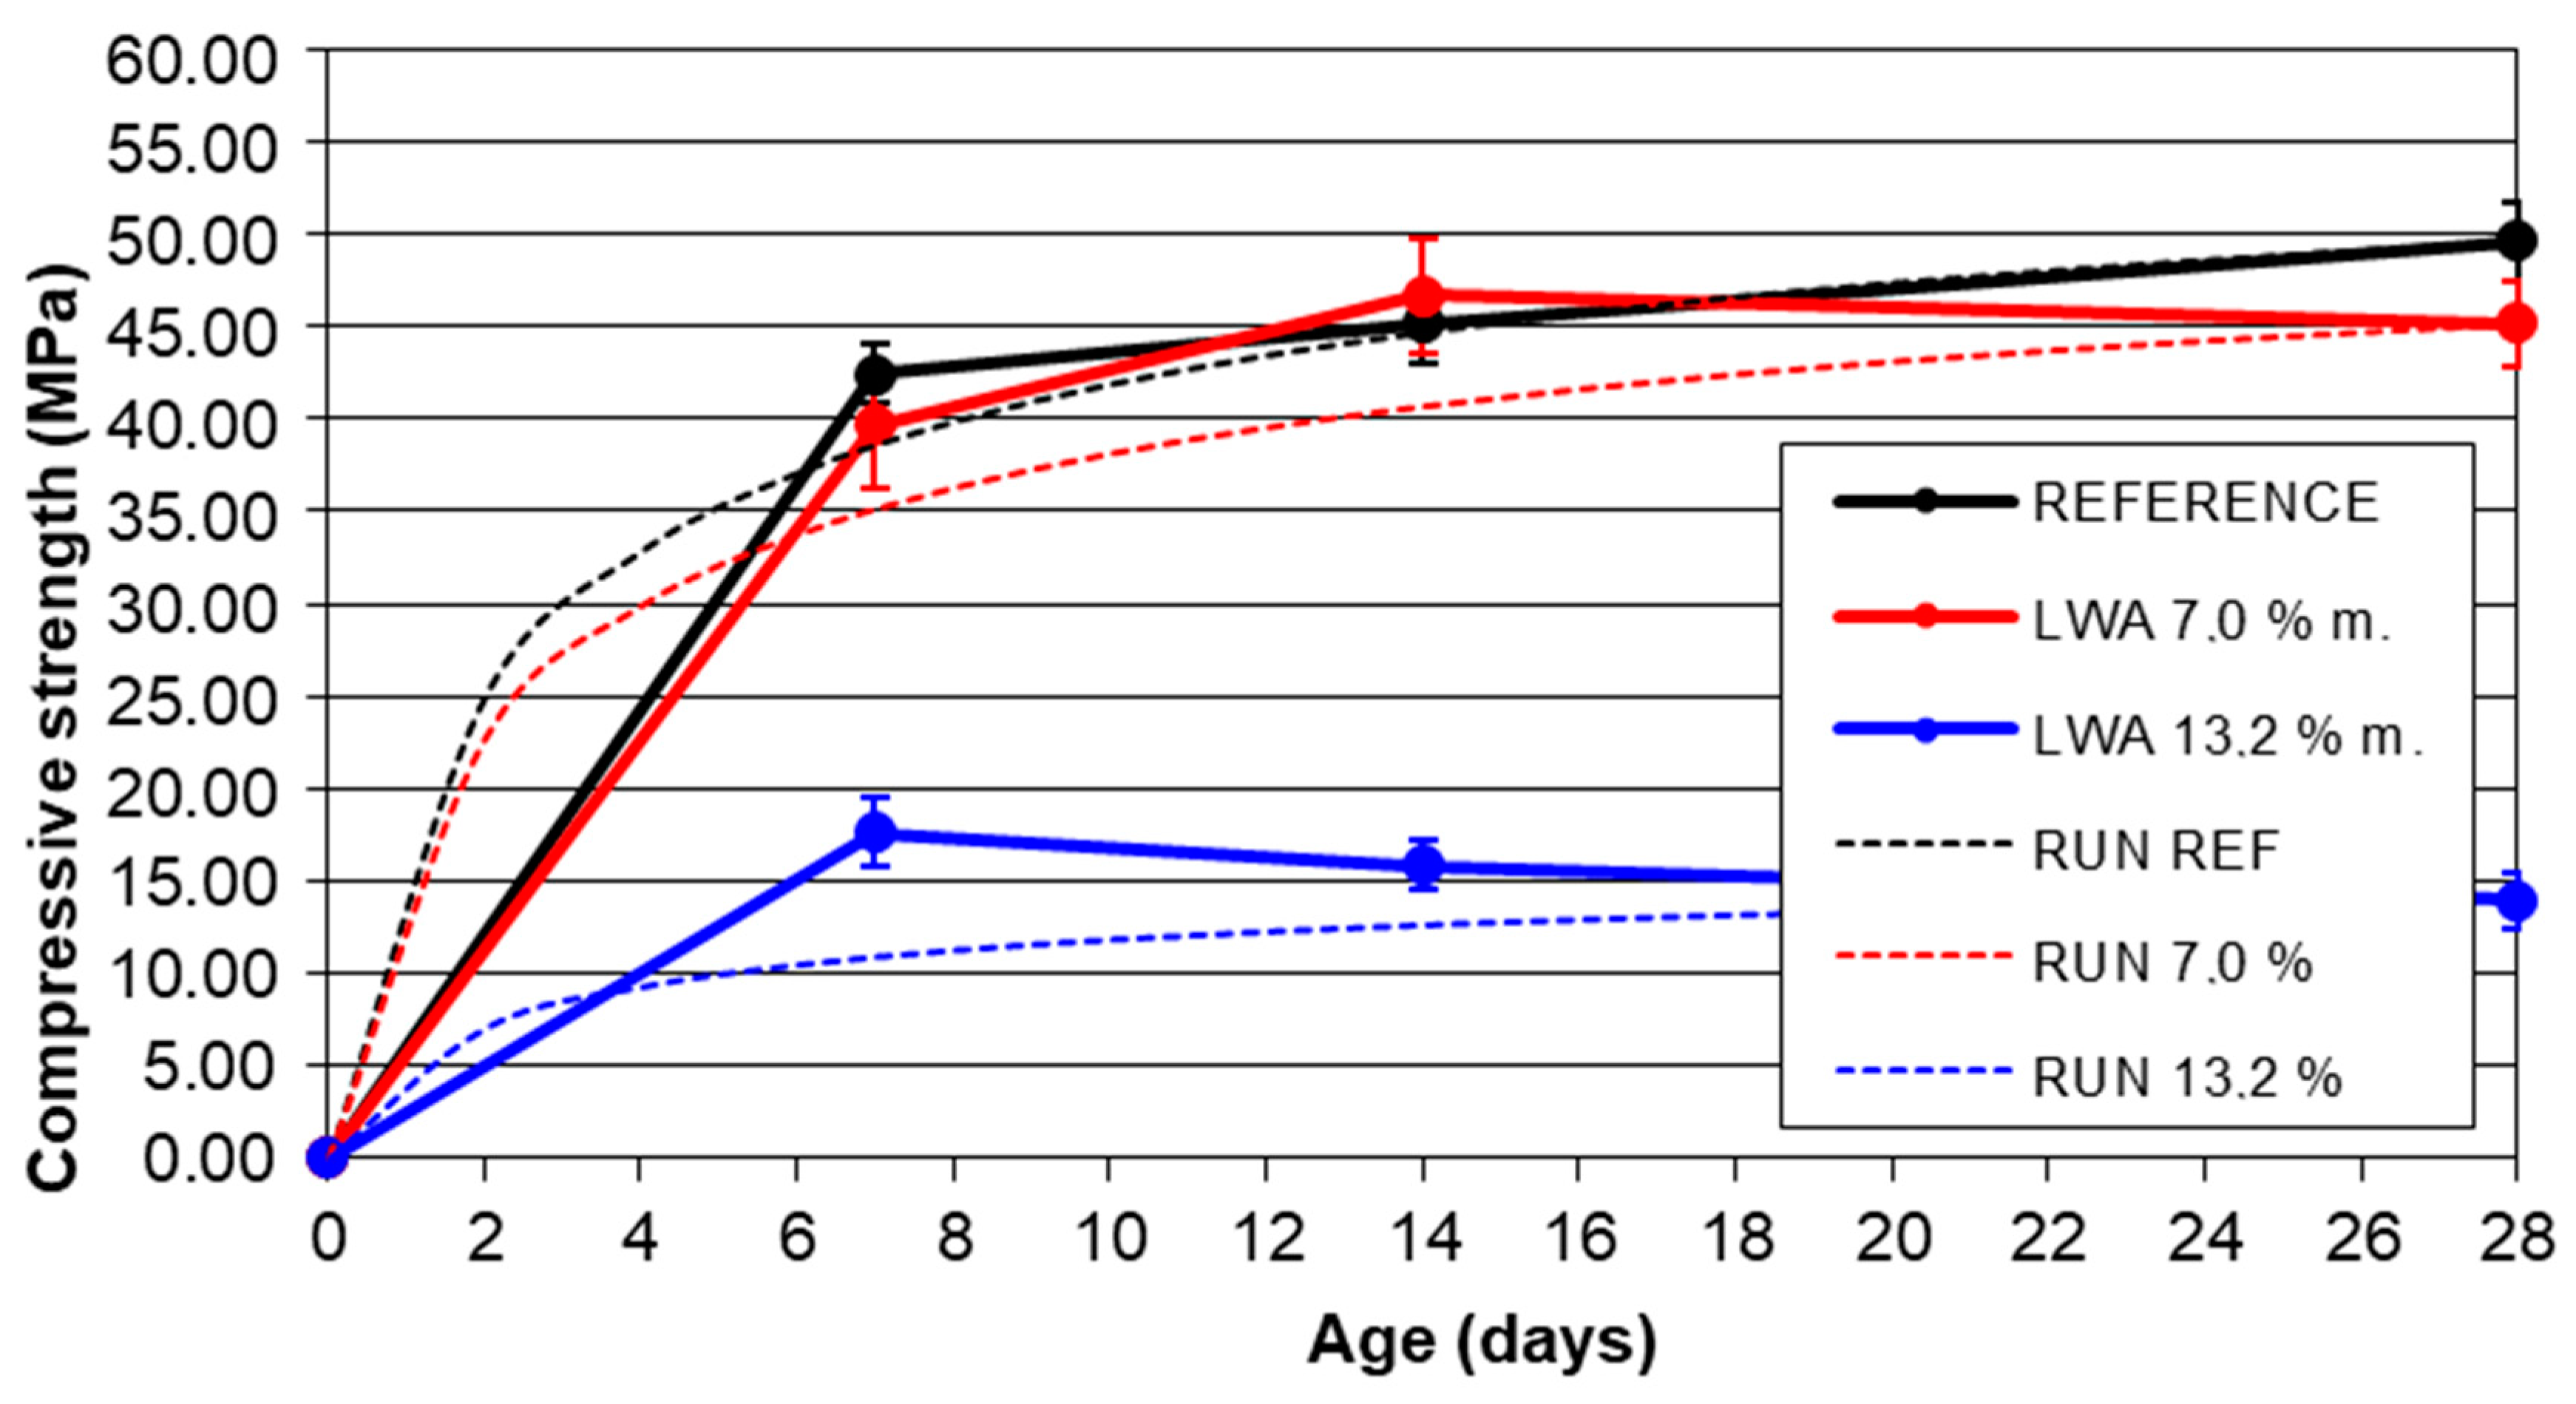
Figure 11 shows that the curing of the sealed system by a 7% dosage of LWA increased the compressive strength on the 28th day up to the values of the reference sample, despite the worsened workability and higher void content (lower bulk density). We have assumed that this relates to the relatively low w/c ratio and positive impact of IC, as already described in [22]. The sample with a 13.2% dosage of LWA, however, has such a void content that an even higher water content that was ready to supply hydration was not enough to cover the losses of strength due to the presence of LWA and related negative phenomena. In Figure 11 (and the others), the apparent loss of compressive strength between the seventh and 28th day can appear confusing. In reality, the compressive strength at various ages was measured on the various samples/specimens. Therefore, the apparent drop in compressive strength could also be seen as negligible, in that concerning the nature of the hydration itself, the drop is unrealistic.
Figure 12 demonstrates the evolution of the strength of the sealed system of w/c = 0.42. In this case, the compressive strength (at a dosage of LWA 7%) overcame the compressive strength of the reference sample. The samples with a dosage of LWA 13.2% still suffered from the lower strengths. However, the drop in compressive strength compared to the reference sample was eased due to the higher proportion of cement paste.

7. Conclusions

The substitution of part of the natural aggregate by LWA caused some changes in bulk density. It has been found that a dosage of 13.2% in the chosen fractions 0/4 and 0/1 (mixed together in a ratio of 75:25) induces a fall in bulk density by approximately 15%, which prevents classification of the material as normal structural concrete (according to [10]), since the measured bulk density was significantly lower than 2000 kg/m3. The degree of compliance between the expected and measured reference sample was 94–98%, which indicates that the design model can be used as such.
The sealed systems with a partial substitution of the natural aggregate by LWA (7% or 13.2%) exhibited significant efficiency, especially in the early stage of the concrete. Logically, the efficiency decreases with the increasing w/c ratio, i.e., with the increase of the quantity of water available for hydration. The efficiency in the early stage can be interpreted as a delay in the changes in volume, which seems to be the main advantage. With the selected dosages of LWA, no significant reduction in the absolute (long-term) changes in volume was noticed, which we attribute to the less-than-ideal pore size distribution of LWA.
The major part of the changes in volume in the cement paste takes place at a very early age, i.e., even before the IC (through LWA) starts its action. Taking that into account, it is recommended to design this LWA (with the same pore structure) mainly for IC dedicated to a later age (e.g., after the 5th–7th day, or after overcoming the permeability of the surface that makes watering inefficient. It can be used in high-strength concretes (HSC) or ultra-high-strength concretes (UHSC) due to the potential lower w/c ratio, ensured αmax = 1.00, and autogenous shrinkage postponed (depending on the recipe and curing methods) to a period characterized by higher strengths.
The IC using LWA is suitable to be combined with other means of curing. In order to achieve the self-curing of concrete at a critical age, it is essential to use LWA with a more appropriate pore size distribution (more and larger pores).
From the point of view of compressive strength, we drew conclusions (with a relatively high variability) concerning the impact of LWA at dosages of 7% and 13.2%. The overall mean 28th day strengths are significantly influenced by the strength of the weakest constituent, i.e., LWA [23]. It was revealed that compression causes a failure of the LWA grains on the level of their ultimate strength, which is driven by two aspects, i.e., the porosity of LWA and the mechanical performances of material creating the walls of the pores [24]. Similarly, the fact that a higher moisture content of the concrete decreases the apparent strength was taken into account, which results in the apparent lower strengths of LWA [25]. A moderate fall in the strengths (especially at higher dosages of LWA) was also observed in several case studies [1]; however, some reduction in the formation of the crack was observed. The effect of the environment (conditioning) on the 28th day strengths falls with the increasing w/c ratio after overcoming 0.36, which perfectly matches the conclusions of several authors [26,27,28]. That is driven by the allocation of “mixing” water in the concrete in terms of binding [3]. The recipes characterized by a lower w/c (less than 0.36) have no chance of achieving a maximum degree of hydration, i.e., αmax = 1.00. Therefore, with a decreasing w/c ratio at a constant dosage of LWA, we logically get a higher relative efficiency of IC with respect to the compressive strength.
On the other hand, the recipes with w/c (0.36 and 0.42) as a sealed system can achieve αmax = 1.00. As they already have some potential to achieve αmax = 1.00, i.e., the ultimate limit, then it is obvious that the relative impact of IC must fall.
In the case of w/c higher than 0.42 [26,27], the sealed system contains enough water to achieve the ultimate hydration, and the effect of IC (from the point of view of higher strengths) vanishes. These principles are valid under the assumption that the mix design also takes into account some desired consistency and a constant volume of the aggregate and cement paste.
The results relating to the compressive strengths have demonstrated the potential of LWA to act as IC, especially in sealed systems. It must be noted that the design of LWA (mainly crushed or ground fractions) must necessarily respect a significant increase in the specific surface area, a decrease in bulk density, and the elimination of the relative quantity of cement paste caused by the increased portion of the volume of the aggregate (+ LWA). The results presented cannot be interpreted as general conclusions, as they were achieved on samples for which some simplifying assumptions and narrowing of boundary conditions were adopted. Of course, it must be noted that the experimental tests were affected by uncertainties, as presented in [29,30].

Author Contributions

P.B. and P.M. set up the methodology. P.B. carried out the tests. J.G. and P.B. analyzed the data. P.B. wrote the first draft of the article. P.M. and J.G. reviewed it. All authors have read and agreed to the published version of the manuscript.

Funding

This research was funded by VEGA Project, No. 1/0511/19.

Acknowledgments

We would like to thank TSÚS and the Slovak University of Technology in Bratislava for providing the opportunities and resources that have helped us to create this article.

Conflicts of Interest

The authors declare no conflict of interest.

References

  1. Briatka, P.; Makýš, P. Ošetrovanie Čerstvého Betónu—1. Strata Vody z Betónu; Beton TKS: Praha, Czech, 2010; Volume 10. [Google Scholar]
  2. STN EN 1015-9—Metódy skúšania mált na murovanie. Časť 9: Stanovenie času Sspracovateľnosti čErstvej Malty a Jeho Spresnenie; Slovenský ústav technickej normalizácie: Bratislava, Slovakia, 2001. [Google Scholar]
  3. Briatka, P.; Makýš, P. Ošetrovanie Čerstvého Betónu—4. Konvenčný Návrh Ošetrovania Pomocou Ľahkého Kameniva; Beton TKS: Praha, Czech, 2010; Volume 10, pp. 40–43. [Google Scholar]
  4. STN EN 1097-6—Skúšky na stanovenie mechanických a fyzikálnych vlastností kameniva. Časť 6: Stanovenie Objemovej Hhmotnosti zŕn a Nnasiakavosti; Slovenský ústav technickej normalizácie: Bratislava, Slovakia, 2014. [Google Scholar]
  5. STN EN 196-1—Metódy skúšania cementu. Časť 1: Stanovenie Pevnosti; Slovenský ústav technickej normalizácie: Bratislava, Slovakia, 2019. [Google Scholar]
  6. STN EN 1015-11—Metódy skúšania mált na murovanie. Časť 11: Stanovenie Pevnosti Zatvrdnutej Malty v ťahu pri Ohybe a v Tlaku; Slovenský ústav technickej normalizácie: Bratislava, Slovakia, 2020. [Google Scholar]
  7. STN EN 12390-7—Skúšanie Zatvrdnutého Betónu. Časť 7: Objemová Hmotnosť Zatvrdnutého Betónu; Slovenský ústav technickej normalizácie: Bratislava, Slovakia, 2011. [Google Scholar]
  8. Ministerstvo dopravy výstavby a regionálneho rozvoja SR. Technicko-Kvalitatívne Podmienky MDPT SR, Časť 8: Cementobetónový Kryt Vozoviek; Ministerstvo dopravy výstavby a regionálneho rozvoja SR: Bratislava, Slovakia, 2008. [Google Scholar]
  9. STN 72 2453—Skúška Objemovej Stálosti Malty; Slovenský ústav technickej normalizácie: Bratislava, Slovakia, 1968.
  10. STN EN 206+A1—Betón. Špecifikácia, Vlastnosti, Výroba a Zhoda; Slovenský ústav technickej normalizácie: Bratislava, Slovakia, 2017. [Google Scholar]
  11. Briatka, P.; Makýš, P. Ošetrovanie Čerstvého Betónu—6. Odparovanie Vody, Konvencia a Skutočnosť; Beton TKS: Praha, Czech, 2012; Volume 12. [Google Scholar]
  12. Briatka, P.; Janotka, I.; Makýš, P. Ošetrovanie Čerstvého Betónu—7. DTA, TG a DSC Overenie Pôsobenia Vnútorného Ošetrovania; Beton TKS: Praha, Czech, 2013; Volume 13. [Google Scholar]
  13. Sant, G.; Lura, P.; Weiss, J. Measurement of Volume Change In Cementitious Materials at Early Ages. J. Transp. Res. Board 2006, 1979, 21–29. [Google Scholar] [CrossRef]
  14. STN 73 1320—Stanovenie Objemových Zmien Betónu; Slovenský ústav technickej normalizácie: Bratislava, Slovakia, 1987.
  15. Langton, C.; Kosson, D. Review of Mechanistic Understanding And Modeling And Uncertainity Analysis Methods for Predicting Cementitious Barrier Performance; CBP-TR-2009-002, Rev.0; US Department of Energy Office of Environmental Management: Washington, DC, USA, 2009; Available online: http://cementbarriers.org/ (accessed on 23 July 2008).
  16. Hammer, T.; Bjøntegaard, Ø.; Sellevold, E. Internal Curing—Role of Absorbed Water in Aggregates; ACI; Special Publication: Farmington Hills, MI, USA, 2004; Volume 218, pp. 131–142. [Google Scholar]
  17. Henkensiefken, R. Internal Curing in Cementitious Systems Made Using Saturated Lightweight Aggregate. Master’s Thesis, Purdue University, West Lafayette, IN, USA, 2008. [Google Scholar]
  18. Jensen, O.; Hansen, P. Autogenous Deformation and RH-Change in Perspective. Cem. Concr. Res. 2001, 31, 1859–1865. [Google Scholar] [CrossRef]
  19. Lura, P.; Bischop, J. On the Origin of Eigenstresses in Lightweight Aggregate Concrete. Cem. Concr. Compos. 2011, 26, 445. [Google Scholar] [CrossRef]
  20. Briatka, P.; Makýš, P. Možno Účinne Použiť Pórovité Kamenivo na Vnútorné Ošetrovanie Betónu? Beton TKS: Praha, Czech, 2011; Volume 11.
  21. STN EN 1992-1-1—Eurokód 2. Navrhovanie Betónových Konštrukcií. Časť 1-1: Všeobecné Pravidlá a Pravidlá pre Budovy; Slovenský ústav technickej normalizácie: Bratislava, Slovakia, 2015.
  22. Weber, S.; Reinhardt, H. A New Generation of High Performance Concrete: Concrete with Autogenous Curing. Adv. Cem. Based Mater. 1997, 6, 59–68. [Google Scholar] [CrossRef]
  23. Nilsen, A.; Monteiro, P.; Gjørv, O. Estimation of the Elastic Moduli of Lightweight Aggregate. Cem. Concr. Res. 1995, 25, 276–280. [Google Scholar] [CrossRef]
  24. Holm, T. Lightweight Concrete and Aggregates; ASTM Standard Technical Publisher: West Conshohocken, PA, USA, 2001; pp. 522–532. [Google Scholar]
  25. Lura, P. Autogenous Deformation and Internal Curing of Concrete. Ph.D. Thesis, TU Delft, Delft, The Netherlands, 2003. [Google Scholar]
  26. Powers, T.C. Physical Properties of Cement Paste. In Proceedings of the Fourth International Symposium on Chemistry of Cement, Washington, DC, USA, 2–7 October 1960; pp. 577–609. [Google Scholar]
  27. Bentz, D.; Lura, P.; Roberts, J. Mixture Proportioning for Internal Curing; Concrete International: Farmington Hills, MI, USA, 2005; Volume 27. [Google Scholar]
  28. ACI Committee. 308 and 213 Report on Internally-Cured Concrete Using Preconditioned Absorptive Lightweight Aggregate; ACI: Farmington Hills, MI, USA, 2011; p. 36. [Google Scholar]
  29. Schlune, H.; Plos, M.; Gylltoft, K. Safety formats for non-linear analysis of concrete structures. Mag. Concr. Res. 2012, 64, 563–574. [Google Scholar] [CrossRef]
  30. Castaldo, P.; Gino, D.; Mancini, G. Safety formats for non-linear finite element analysis of reinforced concrete structures: Discussion, comparison and proposals. Eng. Struct. 2019, 193, 136–153. [Google Scholar] [CrossRef]
Figure 1. Illustrative figure.
Sustainability 12 08479 g001
Figure 2. Principle of the dilatometric method of determining changes in volume.
Sustainability 12 08479 g002
Figure 3. Test of flexural tensile strength.
Sustainability 12 08479 g003
Figure 4. Test of compressive strength.
Sustainability 12 08479 g004
Figure 5. Comparison of the designed and measured apparent densities.
Sustainability 12 08479 g005
Figure 6. Match of the designed (expected) and apparent density achieved.
Sustainability 12 08479 g006
Figure 7. Changes in volume w/c = 0.30 at 20 °C and relative humidity (RH) 98%; (a) 1st–28nd days on the left; (b) 1st–5th days on the right.
Sustainability 12 08479 g007
Figure 8. Changes in volume w/c = 0.36 at 20 °C and RH 98%; (a) 1st–28nd days on the left; (b) 1st–5th days on the right.
Sustainability 12 08479 g008
Figure 9. Changes in volume w/c = 0.42 at 20 °C and RH 98%; (a) 1st–28nd days on the left; (b) 1st–5th days on the right.
Sustainability 12 08479 g009
Figure 10. Measured vs. expected evolution of compressive strength of samples of w/c = 0.30 at 20 °C and RH 98%.
Sustainability 12 08479 g010
Figure 11. Measured vs. expected evolution of compressive strength of samples of w/c = 0.36 at 20 °C and RH 98%.
Sustainability 12 08479 g011
Figure 12. Measured vs. expected evolution of compressive strength of samples of w/c = 0.42 at 20 °C and RH 98%.
Sustainability 12 08479 g012
Table 1. Characteristics of natural and lightweight aggregates used.
CharacteristicNatural AggregateLightweight Aggregate
0/40/4 M0/1 D
Apparent density (kg/m3)251010701700
Bulk density (kg/m3)1630410610
Water absorption (%)1.807.734.80
Void content (%)35.0661.6864.12
Table 2. Recipes used.
w/cConstituentRecipes Used (kg/m3)
Reference7.0% LWA13.2% LWA
0.30Cement492.782422.404360.369
Water184.191153.454132.276
Aggregate 0/41705.7921562.7501406.857
WRA1.8911.6251.389
LWA 0/4 (M)0.00083.464166.293
LWA 0/1 (D)0.00044.20288.068
0.36Cement449.014384.872328.337
Water198.643165.394142.461
Aggregate 0/41706.8501563.5881407.505
WRA1.7251.4831.268
LWA 0/4 (M)0.00083.509166.370
LWA 0/1 (D)0.00044.22688.108
0.42Cement412.459353.528301.589
Water210.770175.411151.005
Aggregate 0/41707.6371564.2111407.988
WRA1.5861.3631.166
LWA 0/4 (M)0.00083.542166.427
LWA 0/1 (D)0.00044.24388.139
Table 3. Mean compressive strength.
Boundary ConditionsDosage of LWAMean Compressive Strength (MPa)
w/c = 0.30w/c = 0.36w/c = 0.42
20 °C; RH 98%Reference (0.0%)53.9349.5934.36
7.0%30.8445.1744.17
13.2%16.8413.9419.67
Publisher’s Note: MDPI stays neutral with regard to jurisdictional claims in published maps and institutional affiliations.

