1. Introduction
China’s foreign direct investment (FDI) has grown rapidly since the turn of the 20th century. In 2018, China’s total FDI inflows had grown to USD 255 billion from only a quarter of that amount in 2000, surpassing the United States’ USD 252 billion and becoming the most important FDI destination in the world [
1]. Therefore, there is significant research interest in examining a series of issues related to FDI flowing into emerging markets such as China [
2,
3]. Studies have examined the impact of FDI on economic growth [
4,
5,
6], employment [
7,
8,
9], technology spillover [
10,
11,
12], and the environment [
13,
14]. However, other scholars have been more concerned about the motivations and driving forces of FDI from institutional perspectives [
15,
16,
17], network [
18], dynamic capabilities of firms [
19,
20], and resources [
21,
22,
23,
24].
Specifically, the literature suggests several motivations for firms to engage in FDI. Researchers have found that firms invest abroad to seek natural resources, labour, or market resources in the host countries [
25,
26,
27]. In addition to seeking resources, the role of institutions was mentioned in previous literature. On the one hand, as an important institutional force for policy-making, the home country’s government support can encourage FDI by introducing special treatments such as subsidies and tax benefits and providing resources such as raw materials [
28,
29]. On the other hand, scholars find that FDI is a strategy used by firms to locate better institutions and escape the institutional constraints of their home countries [
28,
30]. The role of institutional distance has also been examined [
31,
32]. Researchers have found that a similar institutional profile facilitates FDI, since firms can better manage within similar environments.
In traditional institutional theories, researchers believe that enterprises engage in FDI to escape restrictive legislation or imperfect policies from their home government [
33]. Under this circumstance, explaining why FDI peaked in emerging economies with weaker institutional quality such as China compared to developed countries through traditional institutional theories is a major challenge. However, the focus of our study is that institutional quality varies in different regions within emerging economies, while institutions remain generally poor. For instance, as the frontier of the reform and opening, the institutional quality within special economic zones (SEZs) is much better than in non-SEZs. It thus provides a favourable institution quality area for foreign firms.
More precisely, SEZs provide more attractive special treatment policies and high-quality institutions for foreign invested enterprises (FIEs) than other areas in China. On one hand, being higher on the hierarchy than the general local government, SEZs have relative autonomy in terms of determining their preferential policies and can thus formulate more suitable laws and regulations for FIEs. The most important preferential policies usually include preferential tax treatment, land price, financing, and investment. On the other hand, SEZs cultivate high-quality institutions. SEZs are committed to maintaining market order, protecting property rights, and simplifying affairs efficiently to improve the business environment. Moreover, SEZs are also committed to promoting continuous improvement of infrastructures such as utilities, communications, warehousing, and transportation. To summarise, institutional quality, special treatment policy, and SEZ infrastructure are superior as compared to other areas.
In previous studies, we find that it is difficult to define institutions and examine the impact of institutions due to, for instance, the problems related to the measurement of institutions, to their space and time variability [
34,
35]. However, SEZ is a typical case of institutional environment improvement and provides an excellent chance to examine the impact of the institutions. Hence, our study focuses on embedding place-based policies into institutional theory and viewing institution quality variations across different regions. Using data from China’s Annual Survey of Industrial Firms and combining official lists of Chinese special economic zones (SEZs), we obtained a dataset of 2660 SEZs from 1998 to 2018, and a sample of 37,251 from 1998 to 2013. We discussed the policy effect of institutional quality advancement in partial areas and examined the effect of SEZ on foreign entry by using difference-in-difference (DID) specification. In particular, we examined the mechanism of SEZs impacting on the FDI from the perspective of institutional quality improvement. The remainder of the paper is organised as follows:
Section 2 contains a literature review on previous studies.
Section 3 describes the data and introduces the empirical methodology.
Section 4 reports the empirical results of baseline regression and presents validity and robustness checks.
Section 5 concludes the study.
2. Literature Review
The determinants of FDI location have been key issues in academic research. Prior studies found several factors influencing location choice. In traditional theories, abundant natural resources, advanced technology, and attractive markets motivate FIEs to fulfil their resource-seeking purpose abroad. In terms of natural resources, the literature indicates that although better natural resource endowments promote FDI [
36,
37], the effect varies with different types of resources [
37]. To upgrade the lagging technology, FIEs may choose destinations to acquire technology at the frontier [
38]. As for potential marketing, research has highlighted that market size [
39] as well as degree of marketisation [
40] impacts the entry of FIEs.
Based on new economic geography theory, another strand of literature has examined the role of industry agglomeration [
41,
42]. For new entrants of host countries, firms are more likely to choose areas with many existing firms from the same industry or country of origin due to the lack of information on the new environment. As agglomeration would produce benefits from technology spillover, shared transportation, and valuable information, it not only reduces cost and improves efficiency, but also helps these new entrants become acquainted with local institutions and overcome liabilities in the host country [
43].
In addition to the agglomeration effect and the motivation of seeking resources, a significant portion of the literature has focused on the role played by institutions in FDI location choice. Institutions socially construct a system of norms, values, and beliefs, shaping the political, economic, and social interaction of society [
44]. As the host country always has its own unique institution characteristics, Hillman and Wan [
45] argue that foreign new entries must face those unfamiliar institutional environments to operate business, which leads to undertaking certain costs that local firms do not. Hence, Shukla and Cantwell [
46] point out that institutional affinity could attract more foreign firms. Undoubtedly, better institutional quality of the host country encourages more new foreign entries, while deterioration of institutional quality tends to decrease the foreign entries [
47]. Specifically, several studies focused on the policy effects of a specific institutional factor such as FDI grants [
48] and tax reforms [
49]. Moreover, a large number of studies viewed institutions as a whole and comprehensively analysed the effect of regional institutional quality on FDI inflows. However, few studies could explain why an emerging market like China with relatively poor institution quality would attract such a high volume of foreign entries. In fact, we observe that despite its overall poor institution quality, China could provide a place-based policy such as an SEZ to improve the institution quality of a specific geographic area.
Our study is related to literature about the effect of SEZs in emerging markets. Previous research interest on SEZs and place-based policy mainly focused on the impact and mechanism as follows. First, a strand of literature discussed the impact of the gradual establishment of SEZs on firms, industry, and the local economy. The primary benefit of SEZs for firms is that firms within the zone enjoy preferential policies. Schminke and Van Biesebroeck [
50] reported that firms that located within SEZs would export more, have higher output, capital, and productivity. Furthermore, due to the technology transfer along the supply chain inside and outside the zones, SEZs promote industrial development [
51,
52]. Finally, several scholars point out that there are substantial externalities and spillover effects of the impact of SEZs on local economies, including the increase in foreign investment, gross domestic product (GDP) growth, wage, and employment due to the agglomeration economies of SEZs [
53,
54,
55]. For instance, SEZs contribute to half of the exports and 5.2% of the total employment in China. [
56]
Second, another strand of literature is mainly concerned about the mechanism induced by SEZs. On the one hand, studies believe that firms have the incentive to operate in SEZs because of the policy effects from SEZs. SEZs provide a series of special policies involving tax incentives, government subsidies, credit facilities, preferential land prices, convenient administrative approval, and many others [
54,
57]. Specifically, Du et al. [
58,
59] stated that SEZs providing property rights protection and contract enforcement efficiency would lead to attracting more foreign investment and influence the location selection of FDI. On the other hand, industrial agglomeration is another important mechanism for many firms to benefit from SEZs. Industrial agglomeration refers to the geographical aggregation of production suppliers, service suppliers, and related institutions within an industry [
60]. Firms tend to aggregate within the zone, and they may obtain knowledge and technology spillover, labour market sharing, and intermediate product input sharing. Moreover, firms within the zone reduce the cost of professional labour recruitment, information diffusion, and supply market docking [
61]. An important distinction of our study is that we examine the mechanism of SEZs on the FDI from the perspective of institution quality, which still lacks empirical evidence.
In sum, compared to traditional institution theory, we examine how institution quality varies with different regions instead of viewing the institution of host country as a whole. Specifically, we propose that emerging markets still could provide a favourable institution environment in a specific area, even though the rest of the area is poor in institutions. Hence, our study examines the effect and mechanism of SEZs and their impacting on FDI from the perspective of institutional quality improvement, which mainly constitutes our contribution.
3. Materials and Methods
We used data from China’s Annual Survey of Industrial Firms (ASIFs), which includes information about the production of firms. This was combined with publicly available SEZ information, and we then identified the SEZ impact on FDI and conducted a series of robustness checks.
3.1. Data and Sample
To estimate the effect of SEZs on the foreign entries, it was important to collect relevant data to capture FDI and SEZ. Instead of using aggregated FDI in counties, we measured the FDI from firm-level data. Moreover, SEZs information was extracted from official documents.
FDI firm-level data: The firm-level datasets were drawn from China’s ASIFs published by the National Bureau of Statistics (NBS), across 343 prefecture-level cities over the period 1999–2013. These covered all state-owned enterprises (SOEs) and non-SOEs with annual sales of more than CNY 5 million, constituting approximately 95% of total Chinese industrial output. Specifically, these datasets contain full basic information and detailed firm operation information, including name, location code, ownership, output, employment. Moreover, these datasets contain information on the registration type of firm through which the government divides firms into different types of ownership. Following the official definition of the NBS, we used registration type to identify whether firms are FIEs and included Hong Kong, Macao, and Taiwan investment enterprises (codes: 210, 220, 230, 240, 290) and foreign investment enterprises (codes: 310, 320, 330, 340, 390). In accordance with Brandt et al. [
62], we employed several steps to obtain panel data. To achieve consistency in the regional administrative codes over the sample period, we adjusted the zip code in accordance with Lu and Tao [
63]. Furthermore, some observations were eliminated to guarantee sample reliability, including value added, employment and output with negative value, and those with fewer than eight employees as they fall under a different legal regime. SEZ status data: The State Council published lists of Chinese SEZs in two editions: 2006 and 2018. With two difference editions of SEZs, there are SEZs being cancelled, merged, or upgraded from 2006 to 2018; thus, we decided to merge the two editions and supplement the missing information. Finally, we obtained a dataset of 2660 SEZs from 1998–2018, with 2657 SEZs still existing in 2018, containing all provincial and national-level SEZs in China. The dataset includes the name, type, approved year, approval authority, area, and industry of every SEZ. In 2018, there were 585 national-level SEZs and 2070 provincial-level SEZs, including different types of SEZs (e.g., economic and technological development zones, high-tech industrial development zones, free trade zones, export processing zones). Furthermore, we utilised official websites and maps to verify the boundaries of the SEZs, so that we could further confirm the counties where each SEZ was located.
3.2. Comparing SEZs and Non-SEZs
SEZ is a type of place-based policy aimed at offering standard preferential economic policies such as tariff reduction or exemptions for firms, fostering a favourable business environment in a specific geographic area to encourage foreign and domestic investment, and promote industrial agglomeration. SEZ policy has been widely used globally in recent years, especially in emerging markets. China’s first national SEZ policy was established in 1984 as an important continuation of the small-scaled SEZs policy in late 1970s. SEZs were gradually expanded throughout the country in the last 30 years. The first glimpse of setting up SEZs was in 1992, with 70 national development zones and 144 provincial development zones approved. The second peak occurred in 2006 with a blowout growth of 661 provincial development zones, accounting for more than 95% of the SEZs which were set up from 1984 to 2005. SEZs have become an important institutional actor in China’s regional economic development in reform and opening up. Meanwhile, the practice and experience of China’s SEZs play a vital role in emerging economies.
The policy effect of SEZs can be partly attributed to special treatment. SEZs, as engines of economic growth, are considered vital to attract foreign investment. To fulfil the goal, a bundle of preferential policies has been implemented within SEZs. Such policies include:
Firms in SEZs enjoy preferential tax treatment, especially foreign-funded firms. For production-oriented FIEs, the enterprise income tax is exempted or reduced by 7% to 15% compared to the 30% rate for the same period outside SEZs (2002). In addition, export duties are exempted for non-restricted export products.
Firms in SEZs enjoy preferential treatment on land price. When transferring land properties, SEZs set lower transferring fees compared to non-SEZ areas. The land price per acre fluctuates between CNY 10,000 and 60,000.
Firms in SEZs experience preferential financing and investment: when applying for loans, firms within SEZs are allowed to apply for a mortgage with cash or fixed assets and are also prioritised. For foreign enterprises, the profit gained through investment can be used to reinvest, and 40% or more income tax can be refunded if reinvested firms survive for more than 5 years. The bundle of preferential policies has played a positive role in enterprises within SEZs and advanced the business environment.
In addition to special treatment, the policy effect of SEZs can also be attributed to institutional quality. In the early period, China was always typified with weak institutions and poor infrastructure, which hindered the rise of innovation entrepreneurship. As the frontier of reform and opening up, many trials on improving institutional quality were made with the development of SEZs in China. Within the zones, such trials include:
The establishment of laws and regulations. By benchmarking developed countries, SEZ officials set laws and regulations that are more suitable for firm growth, such as law of private property rights protection.
Efficient government service. With the establishment of a Management Committee and Investment Service Centre, approval procedures have been efficiently simplified.
Independent administrative status: in the administrative management system of China, SEZs have a higher administrative level than general districts, which helps avoid unnecessary interruptions.
We also found advantages of institutional profile in regions with SEZs when further analysing China’s institutional quality. In this study, we used a report titled
Chinese Government Management, Investment Environment and Harmonious Society: Improvement of competence in 120 cities published by the World Bank. The report contains basic information about the business climate in 120 Chinese cities in 2005. To make a comprehensive assessment of institutional quality in these cities, three variables from the report were introduced to measure institutional profile in our analyses: investment environment, government efficiency, and degree of social harmony.
Table 1 provides the result of our analyses. First, we divided the cities into two groups by number of SEZs. The mean values indicating institutional profile among cities with more than five SEZs are higher than those in cities with less than five SEZs; through
t-tests, the differences of the variables were found to be significant at 5%. Second, we only compared cities with national-level SEZs and those with provincial-level SEZs. The indicators of the institutional profile among cities with national-level SEZs are higher than those in cities with provincial-level SEZs only. We found through
t-tests that differences of the variables are all significant at 10%. Finally, we divided cities with SEZs geographically into eastern, central, and western cities. The indicators are the highest in eastern cities with SEZs and lowest in western cities. We found that institutional quality is better within cities with a greater number of and higher-level SEZs. When including geographic factors and institutional quality, eastern cities with SEZs were found to be better than central and western cities with SEZs.
3.3. Identification Strategy
Baseline Specification
A DID specification was used to assess the impact of SEZs on the foreign entry in our study. The strategy compares the foreign entry before and after the setup of SEZ with changes in the non-SEZ counterparts in the same period. The regression is set up as follows:
where
is the FDI in county c in year t. SEZ is a dummy variable with one if county c had an SEZ and zero if otherwise. Specifically, we regard counties that have never set up an SEZ as control group, and those counties that have had an SEZ as treatment group.
is a dummy variable indicating the post-SEZ period in county c.
= 1 denotes that the year after county c set up the first SEZ.
is a vector of time-varying city-level control variables to control for time-variant city characteristics. The model still controls for fixed effects terms at the year
, and county-level
capturing time-invariant county characteristics such as geographic location. Finally,
is the error term and estimate regression with robust standard errors.
The study focuses on the estimation coefficient of the DID regressor , which indicates the exact impact of SEZ on foreign entry. A significant and positive suggests that SEZs have a positive effect on the degree of foreign entry.
3.4. Measurement
To investigate the impact of SEZ on the FDI, we introduce the measures of the two key variables: FDI and SEZ status.
Dependent variable: FDI. To precisely measure the FDI in every county, we used firm-level data ASIF to identify whether a firm should be classified as foreign. With the help of ASIF, the dataset provides specific registered firm information. In this case, firms could be classified into three groups by registered code: SOEs, FIEs, and private enterprises. Specifically, FIEs including foreign-invested joint-stock enterprises, foreign-invested joint venture enterprises, wholly FIEs, and foreign invested limited corporations (code: 310,320,330,340,210,220,230,240). Hence, we could calculate the number of FIEs of counties every year, which served as a good proxy for FDI of counties. Finally, we obtained a sample of 37,251 from 1998 to 2013.
In addition, we identified FIEs according to the foreign share in the firm’s equity as robustness checks.
Independent variable: SEZ status. To determine the policy effect of SEZs, we needed to identify whether a county has SEZs or not. We used the most common approach used in similar studies. Through comparing the boundaries of SEZs and counties, we could confirm the counties to which each SEZ belonged. As SEZs are the most disaggregated geographic unit in the data, an SEZ may be inside a county or on the intersection of several counties. Hence, if a county has at least one SEZ, the county will be identified as a county with SEZs and regarded as treatment group. In contrast, a county without an SEZ during the sample period, we regard them as control group. Eventually, we confirmed that, in 2018, a total of 1521 counties had SEZs while and 1088 counties did not. In addition, there may be a selection issue in the treatment and control groups, as counties with more SEZs usually attract more foreign entry. To deal with the selection issue, we further adopted the propensity score matching method to obtain a matched sample. The specific results are presented in the following robustness checks.
Table 2 reports the profile of the treatment and control groups for the number and share of FIEs in and out of SEZs. Based on a county-year level dataset, we acquired the total number of FIEs and identified FIEs according to registered type of firm. The overall trend shows the number of FIEs rose from 1998 to 2008, fell after 2008, and rose again in 2012. The total number of FIEs in SEZs peaked in 2008 and 2010, and the number of FIEs in SEZs peaked simultaneously. Moreover, the share of other enterprises is increasing, and the growth rate is much higher than FIEs. However, the most significant fact is that the number of FIEs in non-SEZs significantly declined from 2004 to 2006, which reflects the trend that more FIEs chose to enter SEZs. Meanwhile, the number of FIEs in non-SEZs in 1998 and 2013 was almost equal, which further supports the trend.
The number of SEZs in China in 2018 has quadrupled as compared to 1998. Among all the SEZs, provincial SEZs always comprised the largest proportion of more than 70%. Particularly, around 700 SEZs were built in 2006 because of recheck, integration, and normalisation of SEZs below the provincial level, which almost equals the sum of previously set provincial SEZs. As for national SEZs, the government has always been strict in granting their approval. The number of national SEZs was slowly increasing before 2010. However, under high-speed establishment of provincial SEZs, the proportion of national SEZs declined. After 2010, during the trend of upgrading SEZs from provincial to national level, the number of national SEZs significantly increased from 272 in 2010 to 578 in 2018 as the proportion of national SEZs slowly rose.
3.5. Control Variables Measurement
In our study, we controlled for several variables related to labour cost, capital, market, education, and infrastructure. All data of control variables were sourced from the China City Statistical Yearbook published by the NBS of China.
Wage indicates the labour cost of each city, which is an important factor for foreign firms to consider, especially for labour intensive manufacturing industries aimed at seeking cheap overseas labour. Thus, we measured wage by using the average wage of the city. The location of foreign entries is also influenced by the capital abundance of the host country. Capital per capita reflects the economic development level and social investment maturity. The better the investment environment, the easier it would be for a firm to acquire finance. Hence, we measured Capital per capita using the ratio total fixed assets of society divided by population.
To control for the potential regional competition, we include No.firm indicating the aggregation and competition of firms, which stimulates firms to self-improvement. It is measured by the number of firms above the designated size in a city. Moreover, market potential also motivates a foreign investor to make long commitments. We controlled for Density, which was defined by the ratio of the population and the land area.
Foreign firms are more likely to relocate if they can easily employ professional and technical talent. Abundant high-quality talent relates to strong innovation capability. Thus, we included
Education, which is defined as the number of students at college-level in each city to the present human resource quality [
64]. Furthermore, better infrastructure means lower transportation and logistics costs and is more efficient for a firm’s business. We controlled for
Road defined by the average road area of each city, which reflects the infrastructural condition of the city. To normalise the control variables, we applied natural logarithm transformations for them.
Table 3 presents descriptive statistics for the control variables and dependent variable used in the analysis.
4. Empirical Results
In this subsection, we report the baseline result, two validity checks on the DID identifying assumption, and a bundle of robustness checks.
4.1. Baseline Result
Table 4 provides the results of the DID estimation using county-level data in the regressions. All the models controlled the year-fixed effect and county-fixed effect for eliminating unobservable factors of time trend and county-level. To acquire robust results, we added control variables step by step. Model 1 includes county-fixed and year-fixed effects only. The coefficient of the DID regressor is positive and statistically significant at 1%, which is in accordance with our hypothesis, proving that the establishment of SEZs promotes the entry of foreign enterprises. In Model 2, we include the factors that impact the entry of FIEs, such as capital scale and cost of labour at the city level. Proxy variables wage per capita and assets per capita are included in our regression, and the result remains stable. Furthermore, considering economic scale and market potential of the city, we added GDP per capita, number of firms above designated size, and population density in Model 3. The result was still robust. Finally, to control for the quality of talent and infrastructure construction at the city level, which influence the location choice for FIEs to invest, we included the education rate of people at college level and average road area per person in Model 4. The result remained positive and statistically robust. Most estimations of our control variables were also consistent with our expectations. Consequently, the DID estimates indicated a significant and positive causal effect of SEZs on the treatment group.
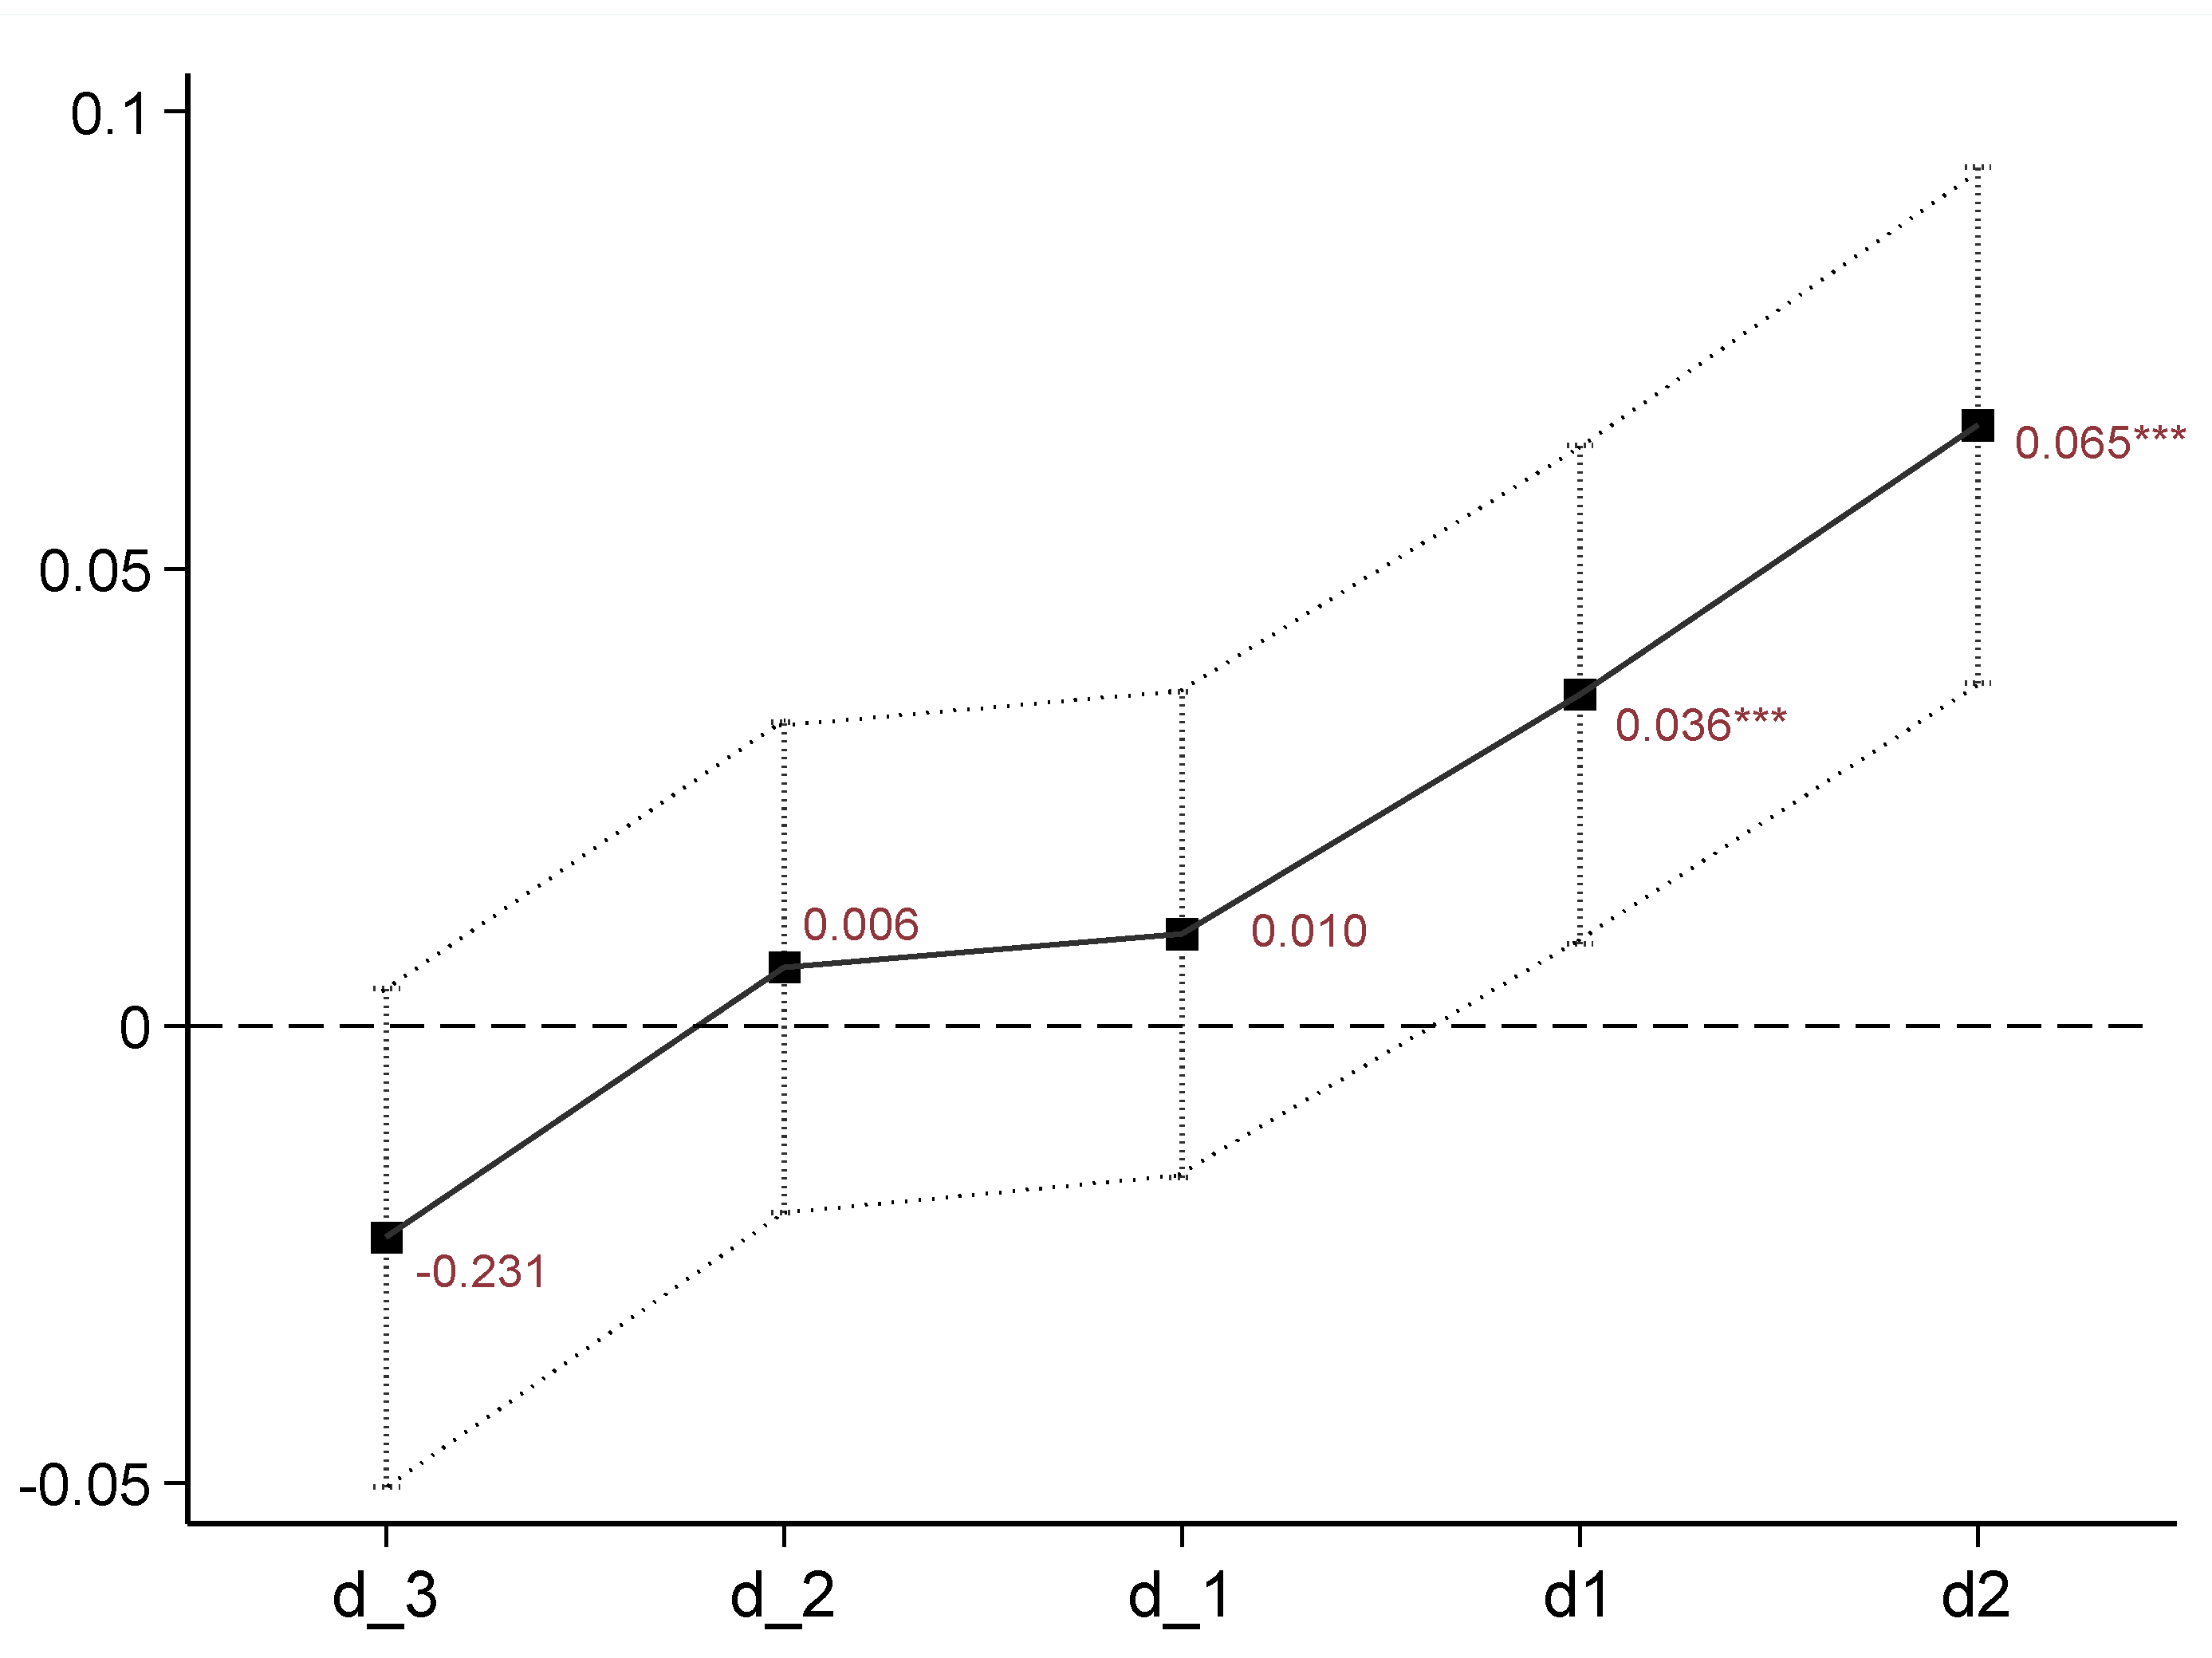
4.2. Validity Checks: Pre-Trend Check
Our identifying assumption was that the control group would have a similar trend as the treatment group if there were no SEZs. If there was an expectation on the establishment of the SEZs, it may lead to the treatment and control group ex ante non-comparable and bias estimates. To check whether a common trend exists between treatment and counterparts, we conducted a pre-trend check following Topalova [
65]. In particular, we checked whether the control and treatment groups had the same trend in the pre-treatment period. In practice, we extended the DID specification to an event-time specification [
66]. Specifically, we should add to the regression a series of year-wise dummies for additional control, assigning a pre-SEZs period as the time of treatment. We considered a 5 year window, spanning from 3 years before SEZs establishment until 2 years after as the following specification:
Here, the ‘Ls’ are a series of ‘event time’ dummies, the pre- and post-SEZ year dummy variables. They are equal to zero, except as follows:
is 1 for counties in the j
th year before establishment of SEZ, while
equals 1 for counties in the j
th year after establishment of SEZ. The vector
denotes time-varying city-level control variables. The estimated
reflects the effects before and after the establishment of the SEZ. The coefficients of
are found to be statistically insignificant, suggesting little expectation effect, as seen in
Figure 1.
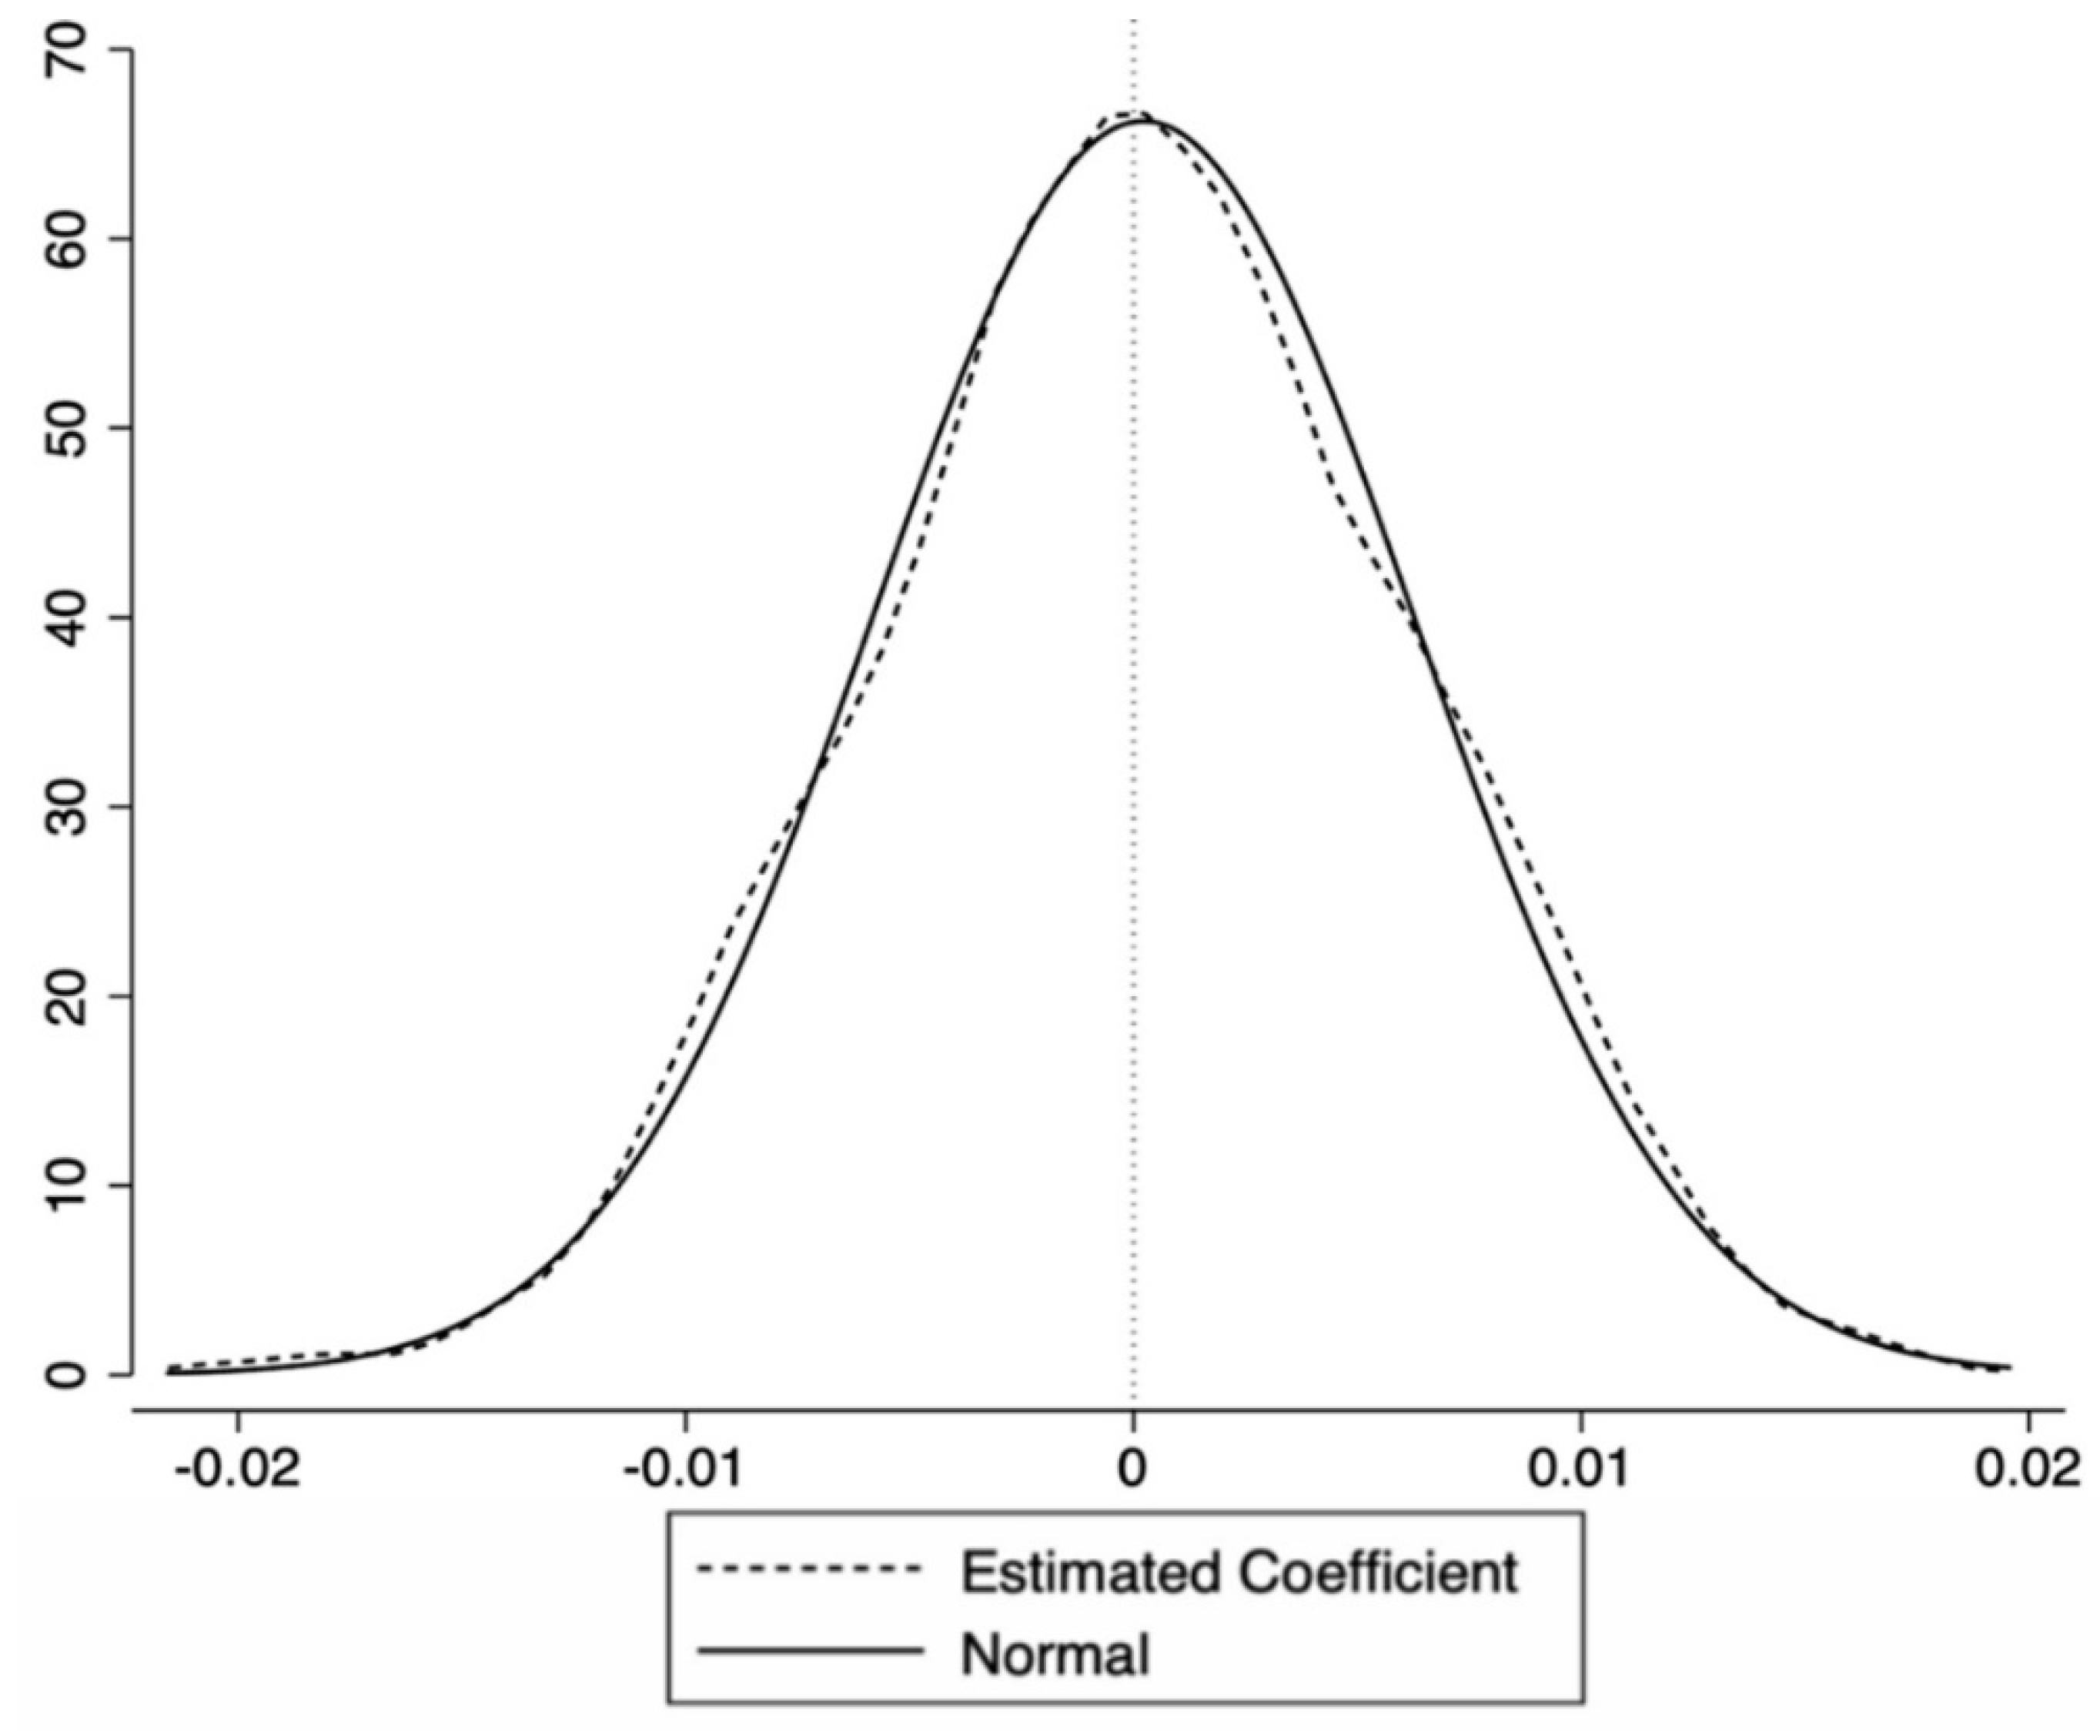
4.3. Validity Checks: Placebo Test with Random Assignment of Treatment
When SEZs expanded rapidly, China’s economy also developed rapidly, which indicates that the number of FIEs may increase even without SEZs policy. We must determine whether unobservable factors are simultaneously influencing FDIs. To alleviate this identification concern, we used the method by Lu et al. [
67] to conduct a placebo test by randomly selecting a fake treatment group and a fake post time. Subsequently, we constructed a counterfactual DID term,
SEZfalsec × POSTfalsect, from two stochastic indicators. The randomness of the
POST and
SEZ variables ensures that the fake DID estimator should have no impact on the FDI, which means the estimated coefficient should be around zero. Otherwise, it indicates the existence of the omitted variables. To enhance the credibility of the placebo test, we conducted random simulations 1000 times and plotted the estimated coefficient distribution curve. The distribution results are shown in
Figure 2 which is concentrated around zero. The placebo test shows that regression is barely affected by unobserved variables.
4.4. Robustness Test
To further check the robustness of the baseline results, we conducted a significant number of robustness tests in several ways: First, several ways are used to re-measure the FDI and re-estimate the results, including different type of FIEs, the scale of foreign capital and newly established FIEs. Second, we changed the way of defining SEZs. In the baseline regression, a dummy variable is used to define the SEZ status, and we further examine the alternative measurement such as number of SEZs, different types of SEZs impacting on the foreign entries. Finally, in addition to changing the way of defining key variables, we changed the specification to check whether the results were robust. A standard DID specification, Tobit model, and propensity score matching method are used to re-estimate the results. In short, we found that all the estimations remain stable and all the detailing tables and analysis are displayed in
Appendix A.
5. Effects of Institutional Quality Improvement of SEZs
As a place-based policy, SEZs efficiently improved local institutional quality. To examine the effect of SEZs from the perspective of institutional quality improvement, we studied the following aspects: different levels of SEZs, marketisation of different regions, and contract intensity of different industries.
5.1. National SEZ and Provincial SEZs
At first, since national-level SEZs and provincial-level SEZs are authorised by the State Council and Provincial Government, respectively, they would provide different preferential policies, government efficiency, and business environment. Generally, institutional quality is evidently better in national-level SEZs. Hence, we estimated the policy effect of national-level SEZs and provincial-level SEZs, respectively. Furthermore, from 2006 to 2018, a total of 243 SEZs were upgraded from the provincial to the national level, which provides an ideal opportunity to examine the impact of the improvement of institutional quality. Therefore, we excluded regions without SEZs and treated regions with provincial-level SEZs only as a control group to evaluate the policy effect of upgrading SEZs.
The results are reported in
Table 5. Models 1 and 2 show the policy effect of national-level and provincial-level SEZs, respectively. Both coefficients are positive and significant at the 1% level, with the coefficient in Model 1 larger than that in Model 2. The result shows that the better the institutional quality is, the more foreign entry is attracted. Model 3 shows the policy effect of upgrading SEZs. The DID estimator is still significant, reflecting the promotion of institutional quality with the upgrade of SEZs also advancing foreign entry.
5.2. Marketisation Degree of Region
Second, our study intends to examine how the institutional improvement effect of SEZs varies with different regions. As SEZs can provide standard high-quality institutions, the wider the institution gap between regions and SEZs, the more FIEs would choose to transfer into SEZ. The marketisation degree reflects the government involvement, development of non-SOEs, market, and legal system environment of a certain region, which proves to be a rational measurement to quantify regional institutional quality. Data of marketisation are drawn from
NERI INDEX of Marketisation of China’s Provinces 2011 Report published by the National Economic Research Institute of the China Reform Foundation [
68]. The report comprehensively measured the marketisation degree at the provincial level every year since 1997. As the establishment of SEZs may impact regional marketisation, we used the marketisation degree in 1998—the first year in our panel data. Based on the marketisation index of each province, we categorised the observations into two groups by median and estimated the effect of SEZs on foreign entry, respectively. The two groups include: provinces with low-level marketization (Shanxi, Inner Mongolia, Jilin, Heilongjiang, Guizhou, Yunnan, Shanxi, Gansu, Qinghai, Ningxia, Xinjiang, Liaoning, Anhui, Jiangxi, Hubei, and Guangxi) and provinces with high-level marketisation (Chongqing, Sichuan, Hebei, Shanghai, Jiangsu, Zhejiang, Fujian, Shandong, Henan, Hainan, Hunan, Beijing, Tianjin, and Guangdong). Observations of Tibet are not included because data for 1998 are missing.
The results are reported in
Table 5 specifically for Models 4 and 5. The variables of the coefficients of interest are both positive and significant at the 1% level. In addition, the coefficient is larger in Model 4 than in Model 5. The result indicates that with the establishment of SEZs, regions with low-level marketisation would attract more foreign entries than those with high-level marketisation. The possible reason is that areas with higher marketisation degrees have already fostered a favourable business environment. Consequently, they do not benefit significantly from the establishment of SEZs, which improve institutional quality.
5.3. Contract Intensity of Industry
Finally, the effect of institutional quality improvement of SEZs could be examined from the perspective of the contract intensity of industries. Generally, each industry has its own future, and some industries rely heavily on contracts, especially industries with a large proportion of intermediate products. A better contractual institution brings comparative advantages in relationship-specific and input-intensive industries [
69]. In contrast, in the imperfect contract institution, relationship-specific sellers are at great ex-post fraud risk and rely heavily on contracts. Therefore, we measured the industry contract intensity of each industry and estimated the institutional quality improvement of SEZs impact on industries with various contract intensities.
The industry contract intensity is the sensitivity of different industries to the contract enforcement efficiency. The greater the contract intensity, the greater the sensitivity to it. According to Nunn [
70], there are two key factors constituting the index—the proportion of intermediate products of industry and the proportion of relationship-specific products of industry.Specifically, a large proportion of intermediate products or relationship-specific products requires a large number of contracts, and this chiefly relies on contract enforcement efficiency. In addition, the relationship-specific products can be defined in two ways, referring to Nunn [
70], leading to the formation of two measures of contract intensity. We then divided contract intensity into two groups by median and measured the foreign entry from high and low contract intensity groups, respectively. Finally, we found that the policy effect of SEZs varied by industry in different contract intensity.
Table 6 reports that the estimations and the estimated coefficient of SEZ×Post are all positive and statistically significant with two types of measurement of contract intensity. However, compared to results in different contract intensity groups, it is clear that industries with high contract intensity, which are more sensitive to institution quality, benefit more significantly from the establishment of SEZs.
6. Conclusions
As a place-based policy, SEZs efficiently improved partial institutional quality. In this study, we examined the impact and mechanism of SEZs on foreign entry. By regarding SEZs as a special institution leading to institutional quality that varies with different regions, we provide an explanation as to why emerging economies may attract a large number of FDIs under institutions of comparative disadvantage. Moreover, we view partial institutional quality improvement as a new mechanism of the impact of SEZs on foreign entry.
Specifically, we sourced data from ASIFs and lists of Chinese special economic zones to construct dependent variable Foreign Direct Investment and independent variable SEZ status. Using DID specification to assess the impact of SEZ, we found that the establishment of SEZs significantly advances foreign entry. Furthermore, we examined the validity of DID specification with a pre-trend check and placebo test. To examine the robustness of our baseline result, we conducted a series of robustness checks for the following aspects. First, we altered the definition of FIEs and SEZs and re-measured the key variables. Second, we switched our specifications in several ways and adopted a propensity score matching method to obtain matched samples. All the aforementioned results were confirmed to be robust via the robustness check. Finally, we focused on examining the mechanism of SEZs impacting on FDI from the perspective of institutional quality improvement by examining the impact of different levels of SEZs, marketisation of different regions, and contract intensity of different industries. Through our empirical analysis, we concluded that SEZs improve partial institutional quality and attract additional FIEs, which proves to be an efficient place-based policy.
The main contribution of the study is that we theoretically and empirically extended traditional institutional theories by importing SEZs as a partial institutional quality improvement. Although compared to developed countries, emerging economies always have a worse institutional profile, they could still attract numerous FDIs, which seems contradictory according to traditional institutional theories. However, by introducing SEZs—a type of place-based policy for institutional quality improvement—the phenomena could be explained. For traditional institutional theories, institutions in a certain country were viewed as a whole. However, in this study, we found that partial institutional quality could be efficiently improved through the establishment and implementation of place-based policies, advancing local economy. Thus, institutional quality plays a significant role in attracting FDI for the host country. The government can try to improve partial institutional quality by imposing place-based policies to improve the business environment, which helps attract FDI.
However, several limitations exist, and these provide opportunities for future research. First, our study only focused on the county level to explore the policy effect of SEZs on foreign entry. In future investigations, we can further discuss the effect of SEZs on firm innovation, performance, or other factors on the firm level. Second, we have only found that additional FIEs would be more likely to enter a certain region with the establishment of SEZs. However, the impact on neighbouring regions is not examined in previous studies, and the following two situations may occur for the neighbouring regions. On the one hand, the FIEs may transfer from non-SEZs to SEZs [
53], thus causing a crowding-out effect, and then leading to resource misallocation and chaotic competitions among regions. In this way, the establishment of SEZs harms neighbouring areas and may be a costly way to serve multinationals. On the other hand, the surrounding areas may benefit from the establishment of SEZs due to the spillover effect. For instance, when firms agglomerate within SEZs, strong local industrial chains would form within SEZs. It is more likely to develop an extended upstream and downstream supply chain in neighbouring regions, which can attract more FDI to the non-SEZs. This is an interesting topic for future research.
Third, future research can further investigate the competitive policy effect among countries. Once a country finds that setting up SEZs can help attract FDI, followers may catch up, thus resulting in a “race to the bottom” for emerging economies. FIEs may also seek to invest in or transfer to SEZs out of speculation. The fierce competition will do much harm to emerging economies.
According to Acemoglu [
71], cross-country differences in institutions matter a lot in the growth of an economy. Nevertheless, since we do not have deep comprehension of the determinants constructing a set of good institutions, finding the way to improve the institutional environment is quite difficult. As a result, poverty pitfalls exist in emerging economies. In this article, we revealed that the establishment of SEZs could help improve the institutional environment, which contributes to local FDI growth and economic development. In this way, SEZs may provide a feasible direction to escape from the poverty trap within emerging economies. Therefore, we encourage governments to establish high-quality SEZs, so as to facilitate the development of local institutional environment.
Specifically, we first suggest that governments should avoid the disordered and vicious competition caused by setting up too many similar SEZs. Government should meet local area comparative advantages to form distinctive SEZs. For instance, inland SEZs are more suitable for aiming at developing high-tech industry, while coastal SEZs for trade.
Moreover, government should continuously improve the institutional quality from the following three aspects: Firstly, eliminate explicit and implicit barriers in market competition and create a fair, well-organized market environment. For example, eliminate discriminatory barriers against private enterprises. Second, establish norms and legal regulations benchmarking the international standards, such as strengthening intellectual property protection. Third, promote the mobility of factors in SEZs such as labour, technology, and capital factors. For instance, promote the financial system reform in SEZ.


