Using RS Data-Based CA–Markov Model for Dynamic Simulation of Historical and Future LUCC in Vientiane, Laos

 ,
, 


 and
and
Abstract
1. Introduction
2. Methodology
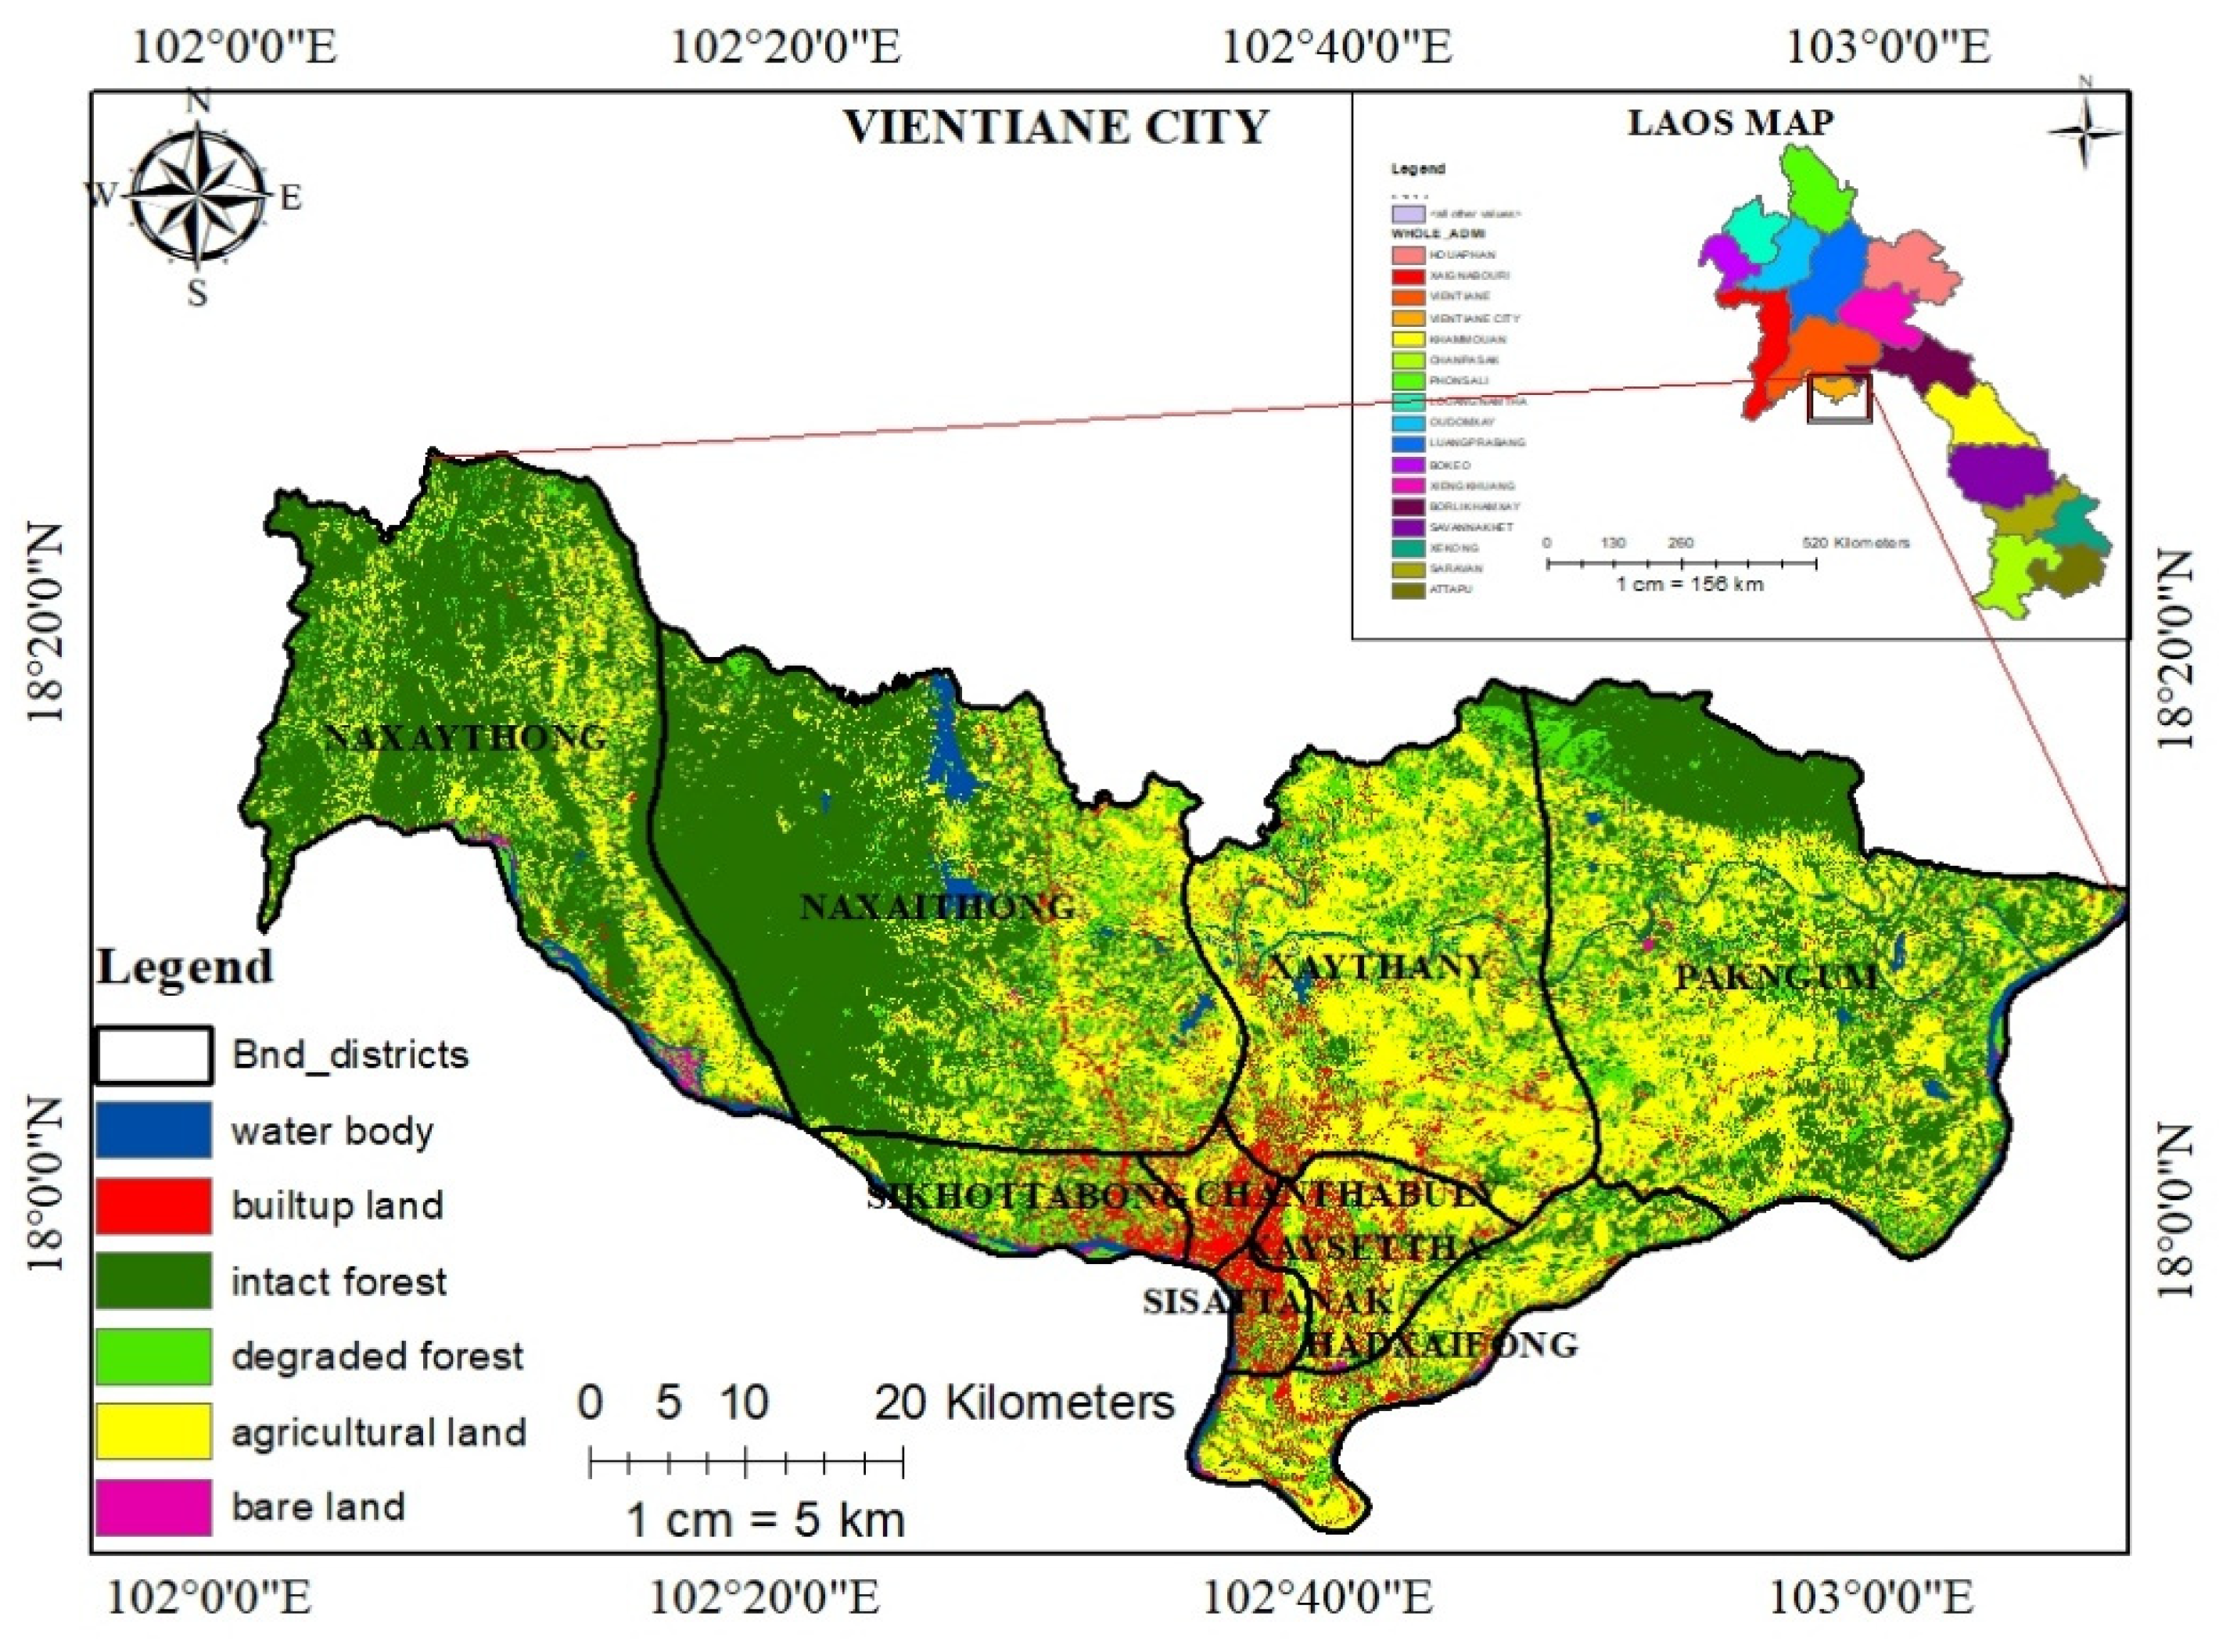
2.1. Study Location
2.2. Data Sources
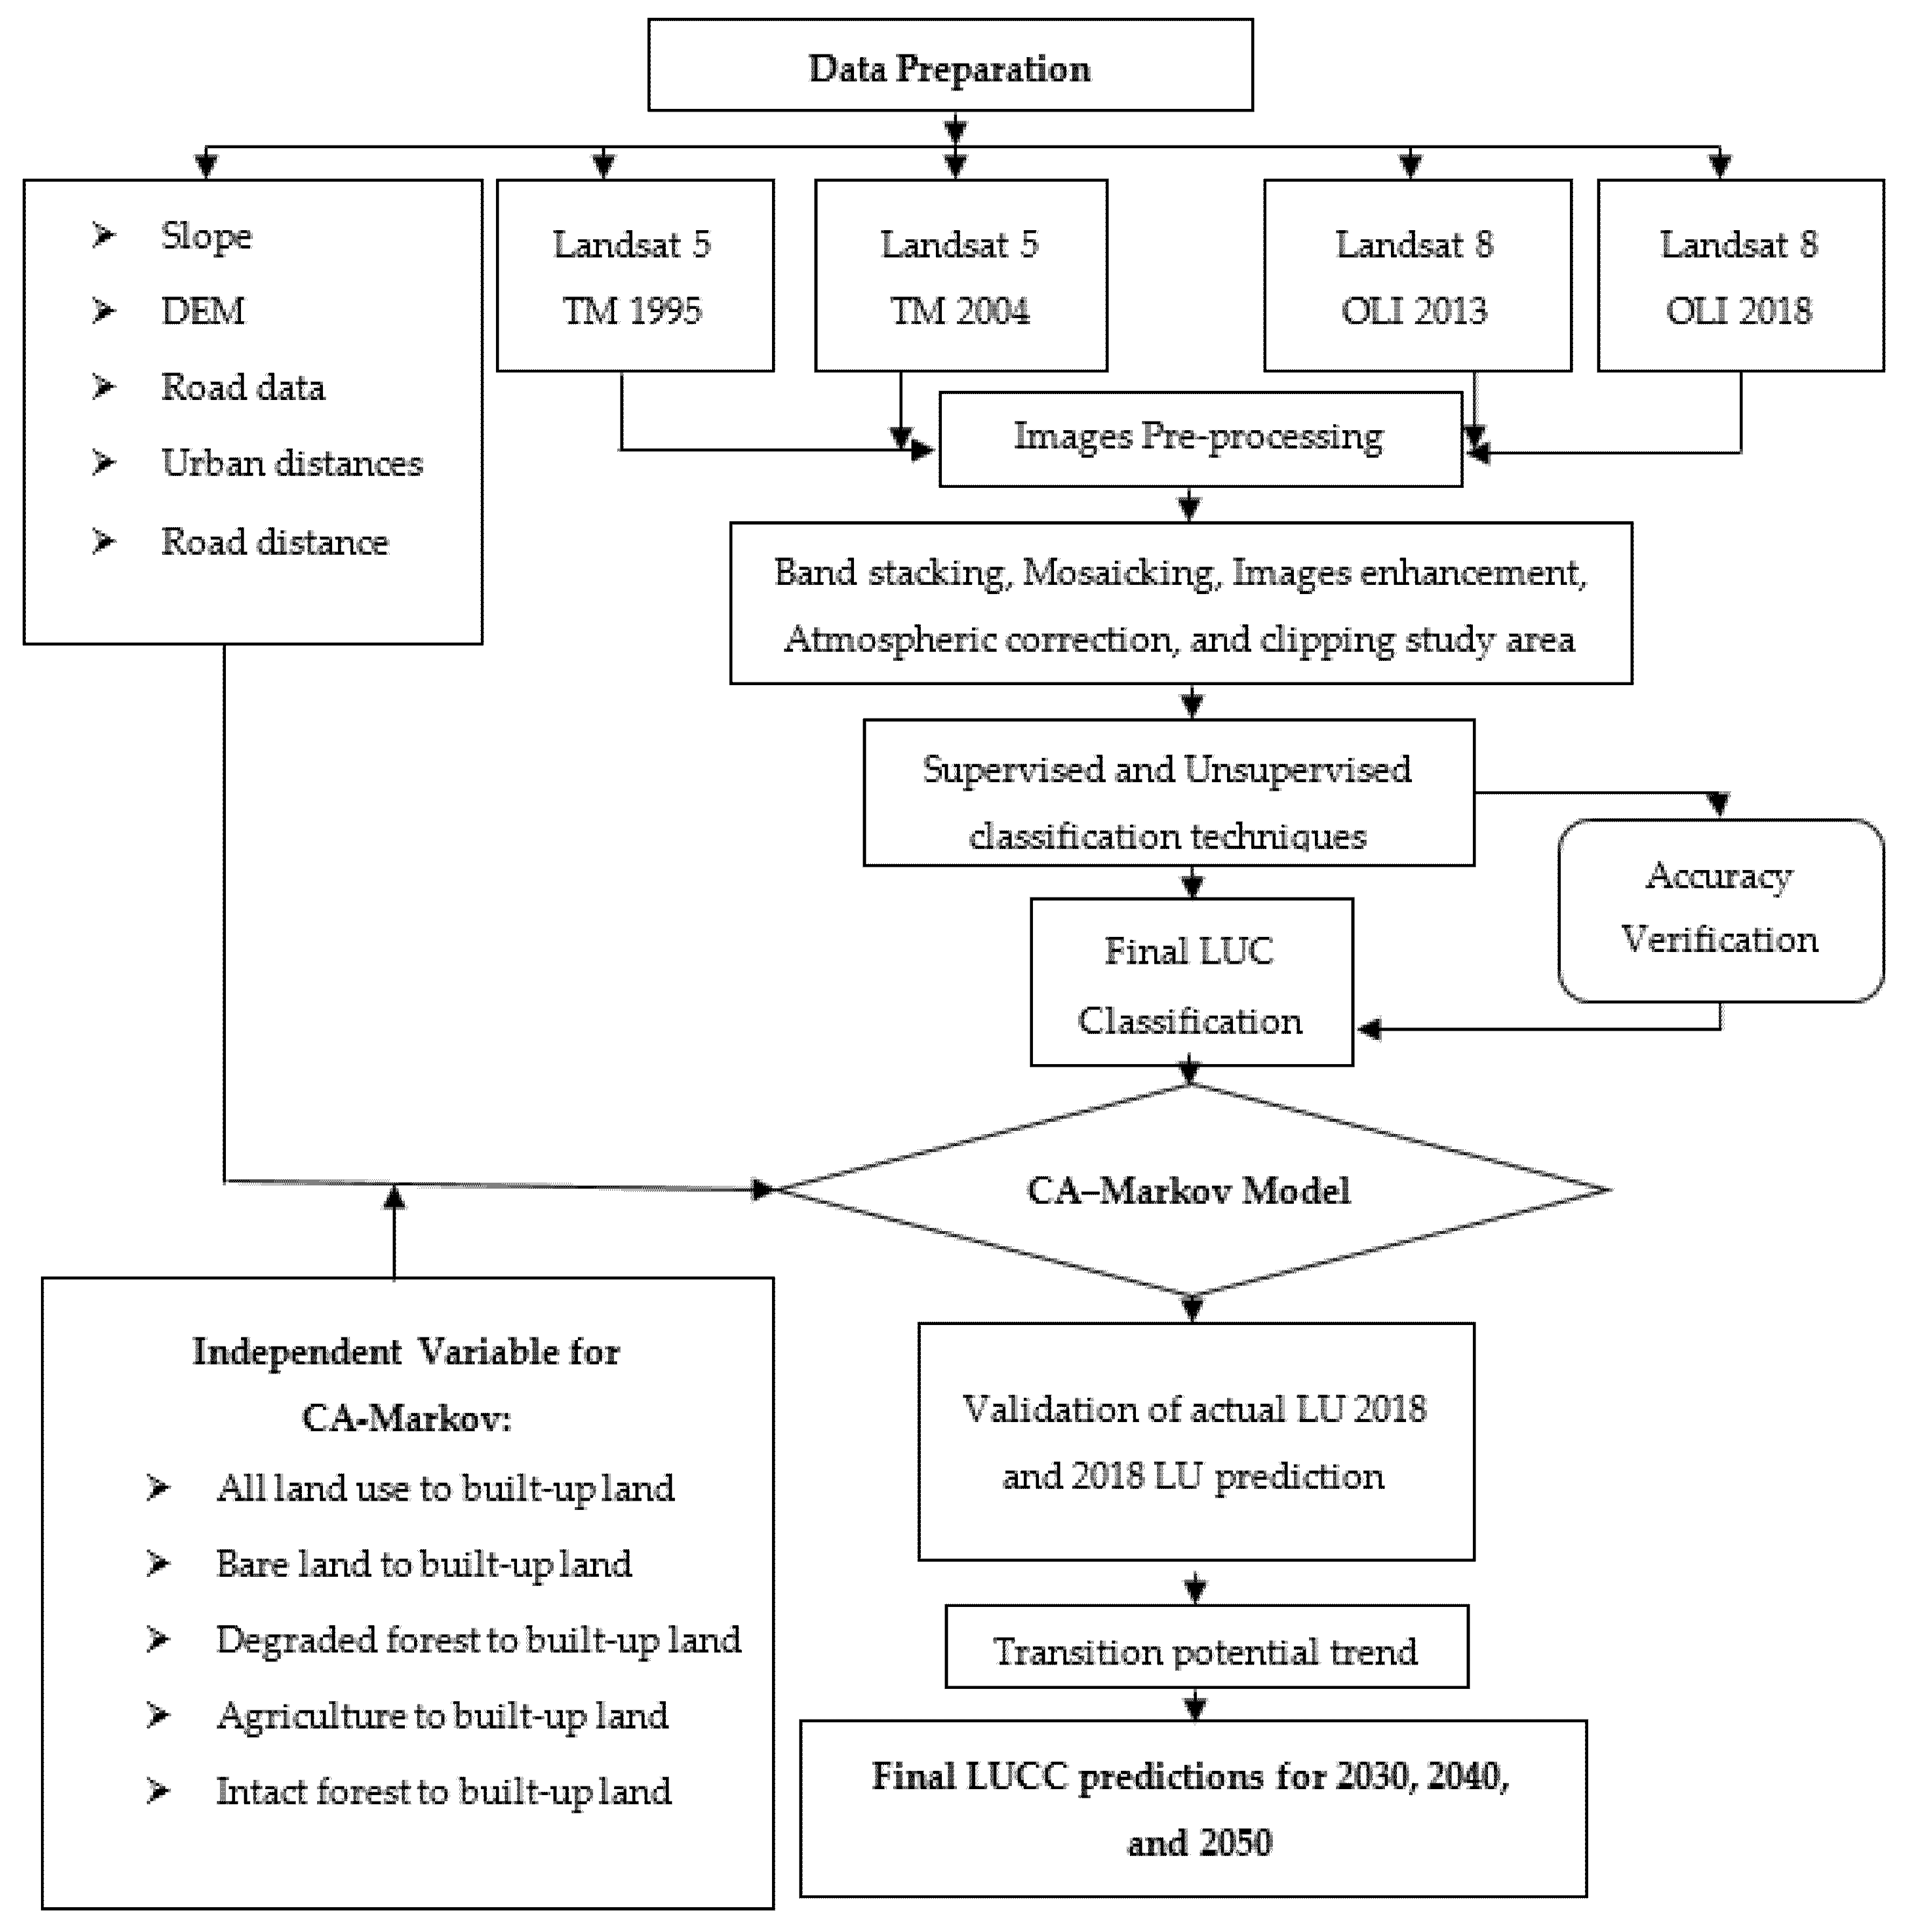
2.3. Image Processing and Data Analysis
2.4. Future Prediction of LUCC Dynamic
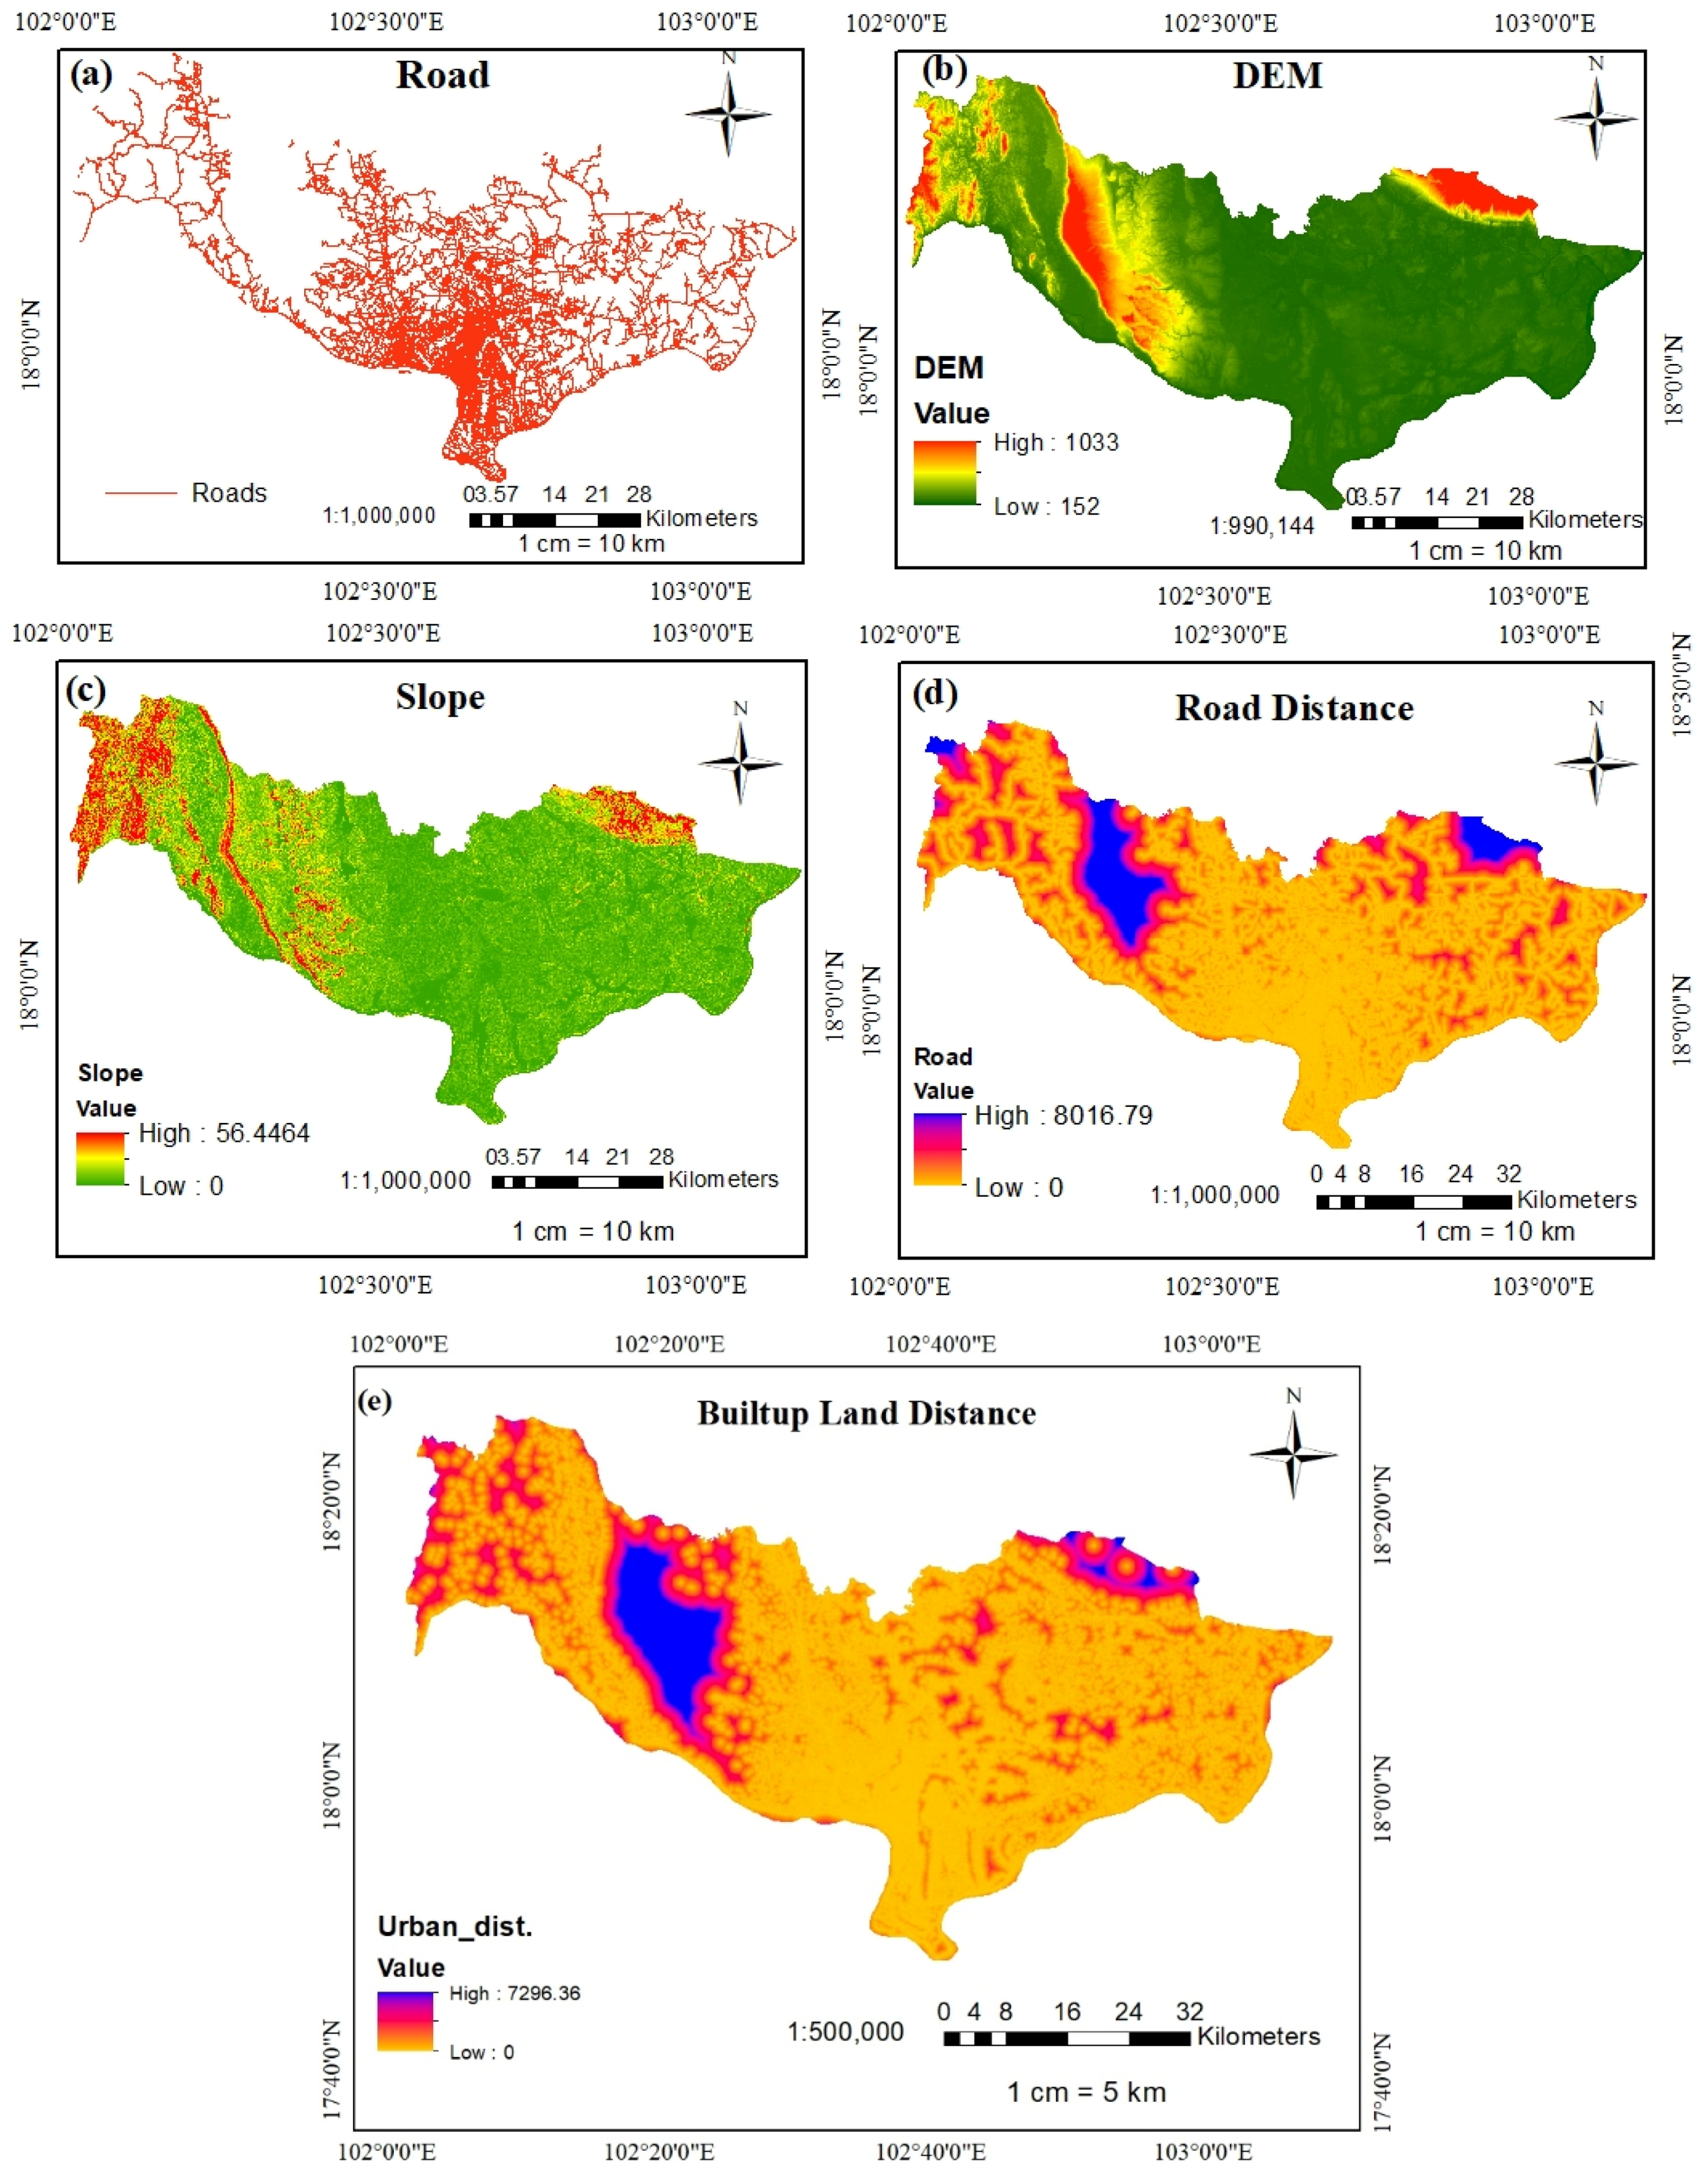
2.5. Determined Driver Factors for LUCC Prediction in the CA–Markov Model
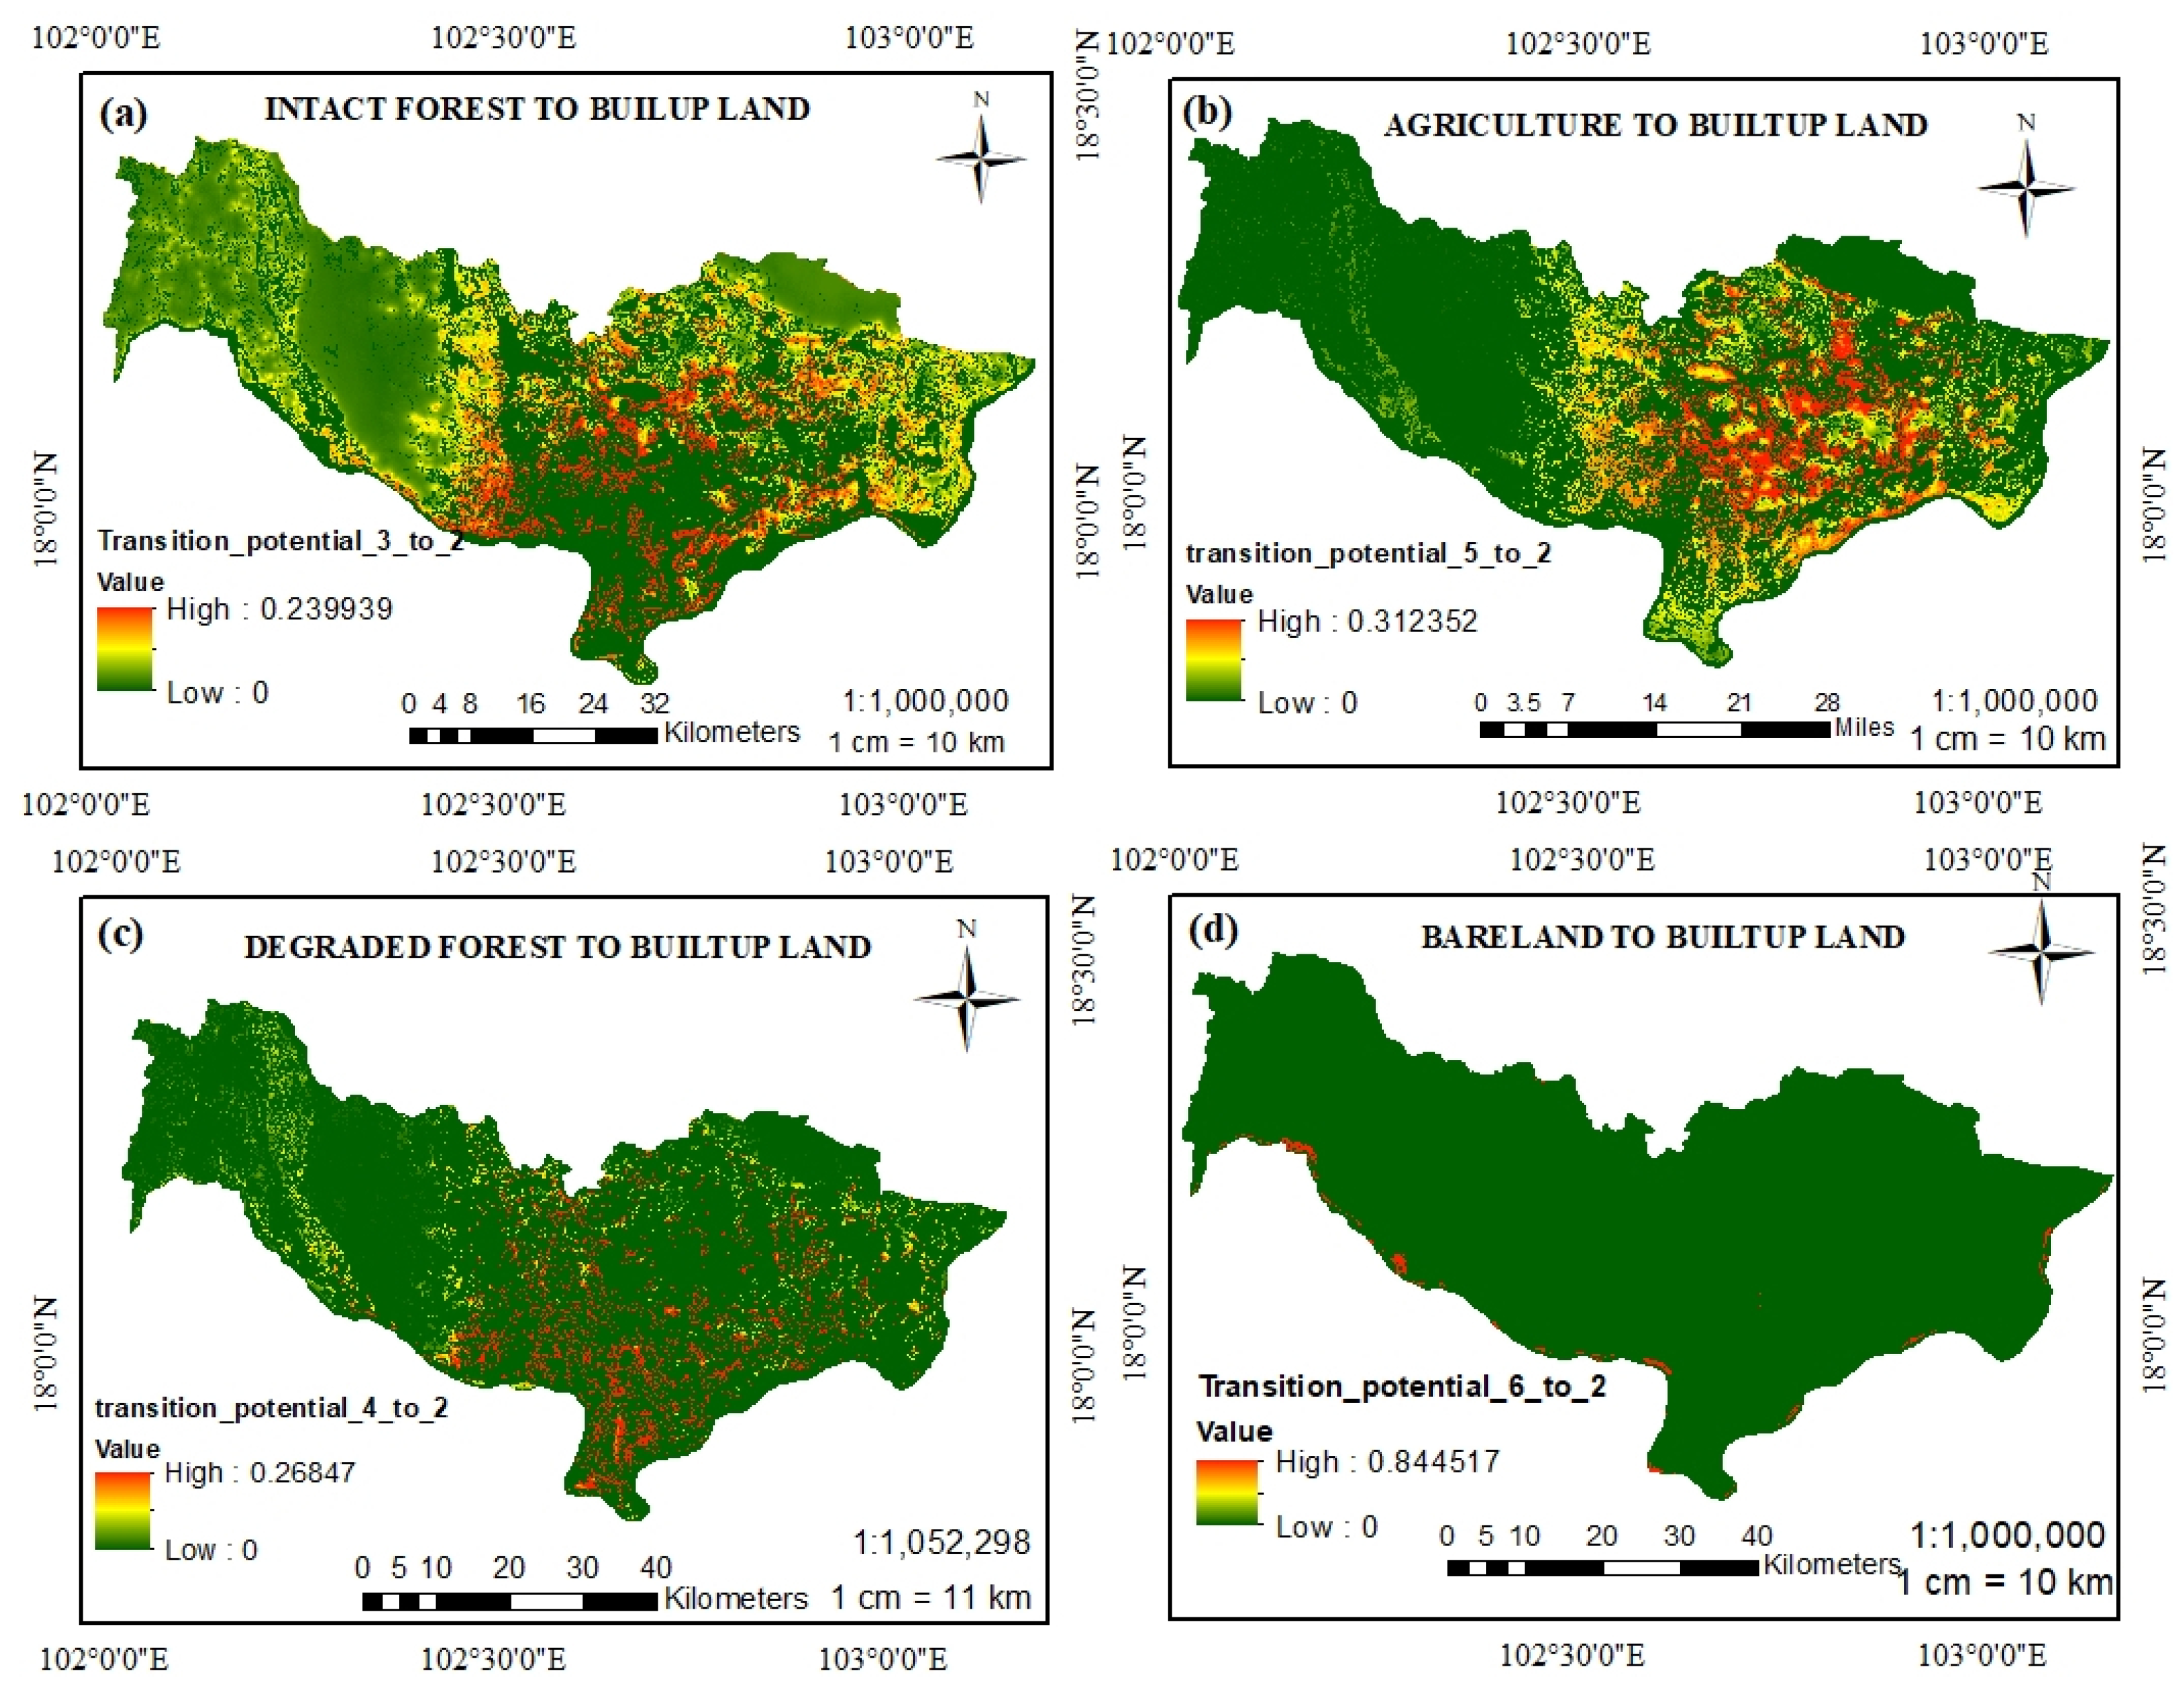
2.6. Predicted LUCC Class Direction of Transition Potential
2.7. Land Use/Cover Change Prediction and Validation
3. Results and Discussion
3.1. Classification Accuracy Verification
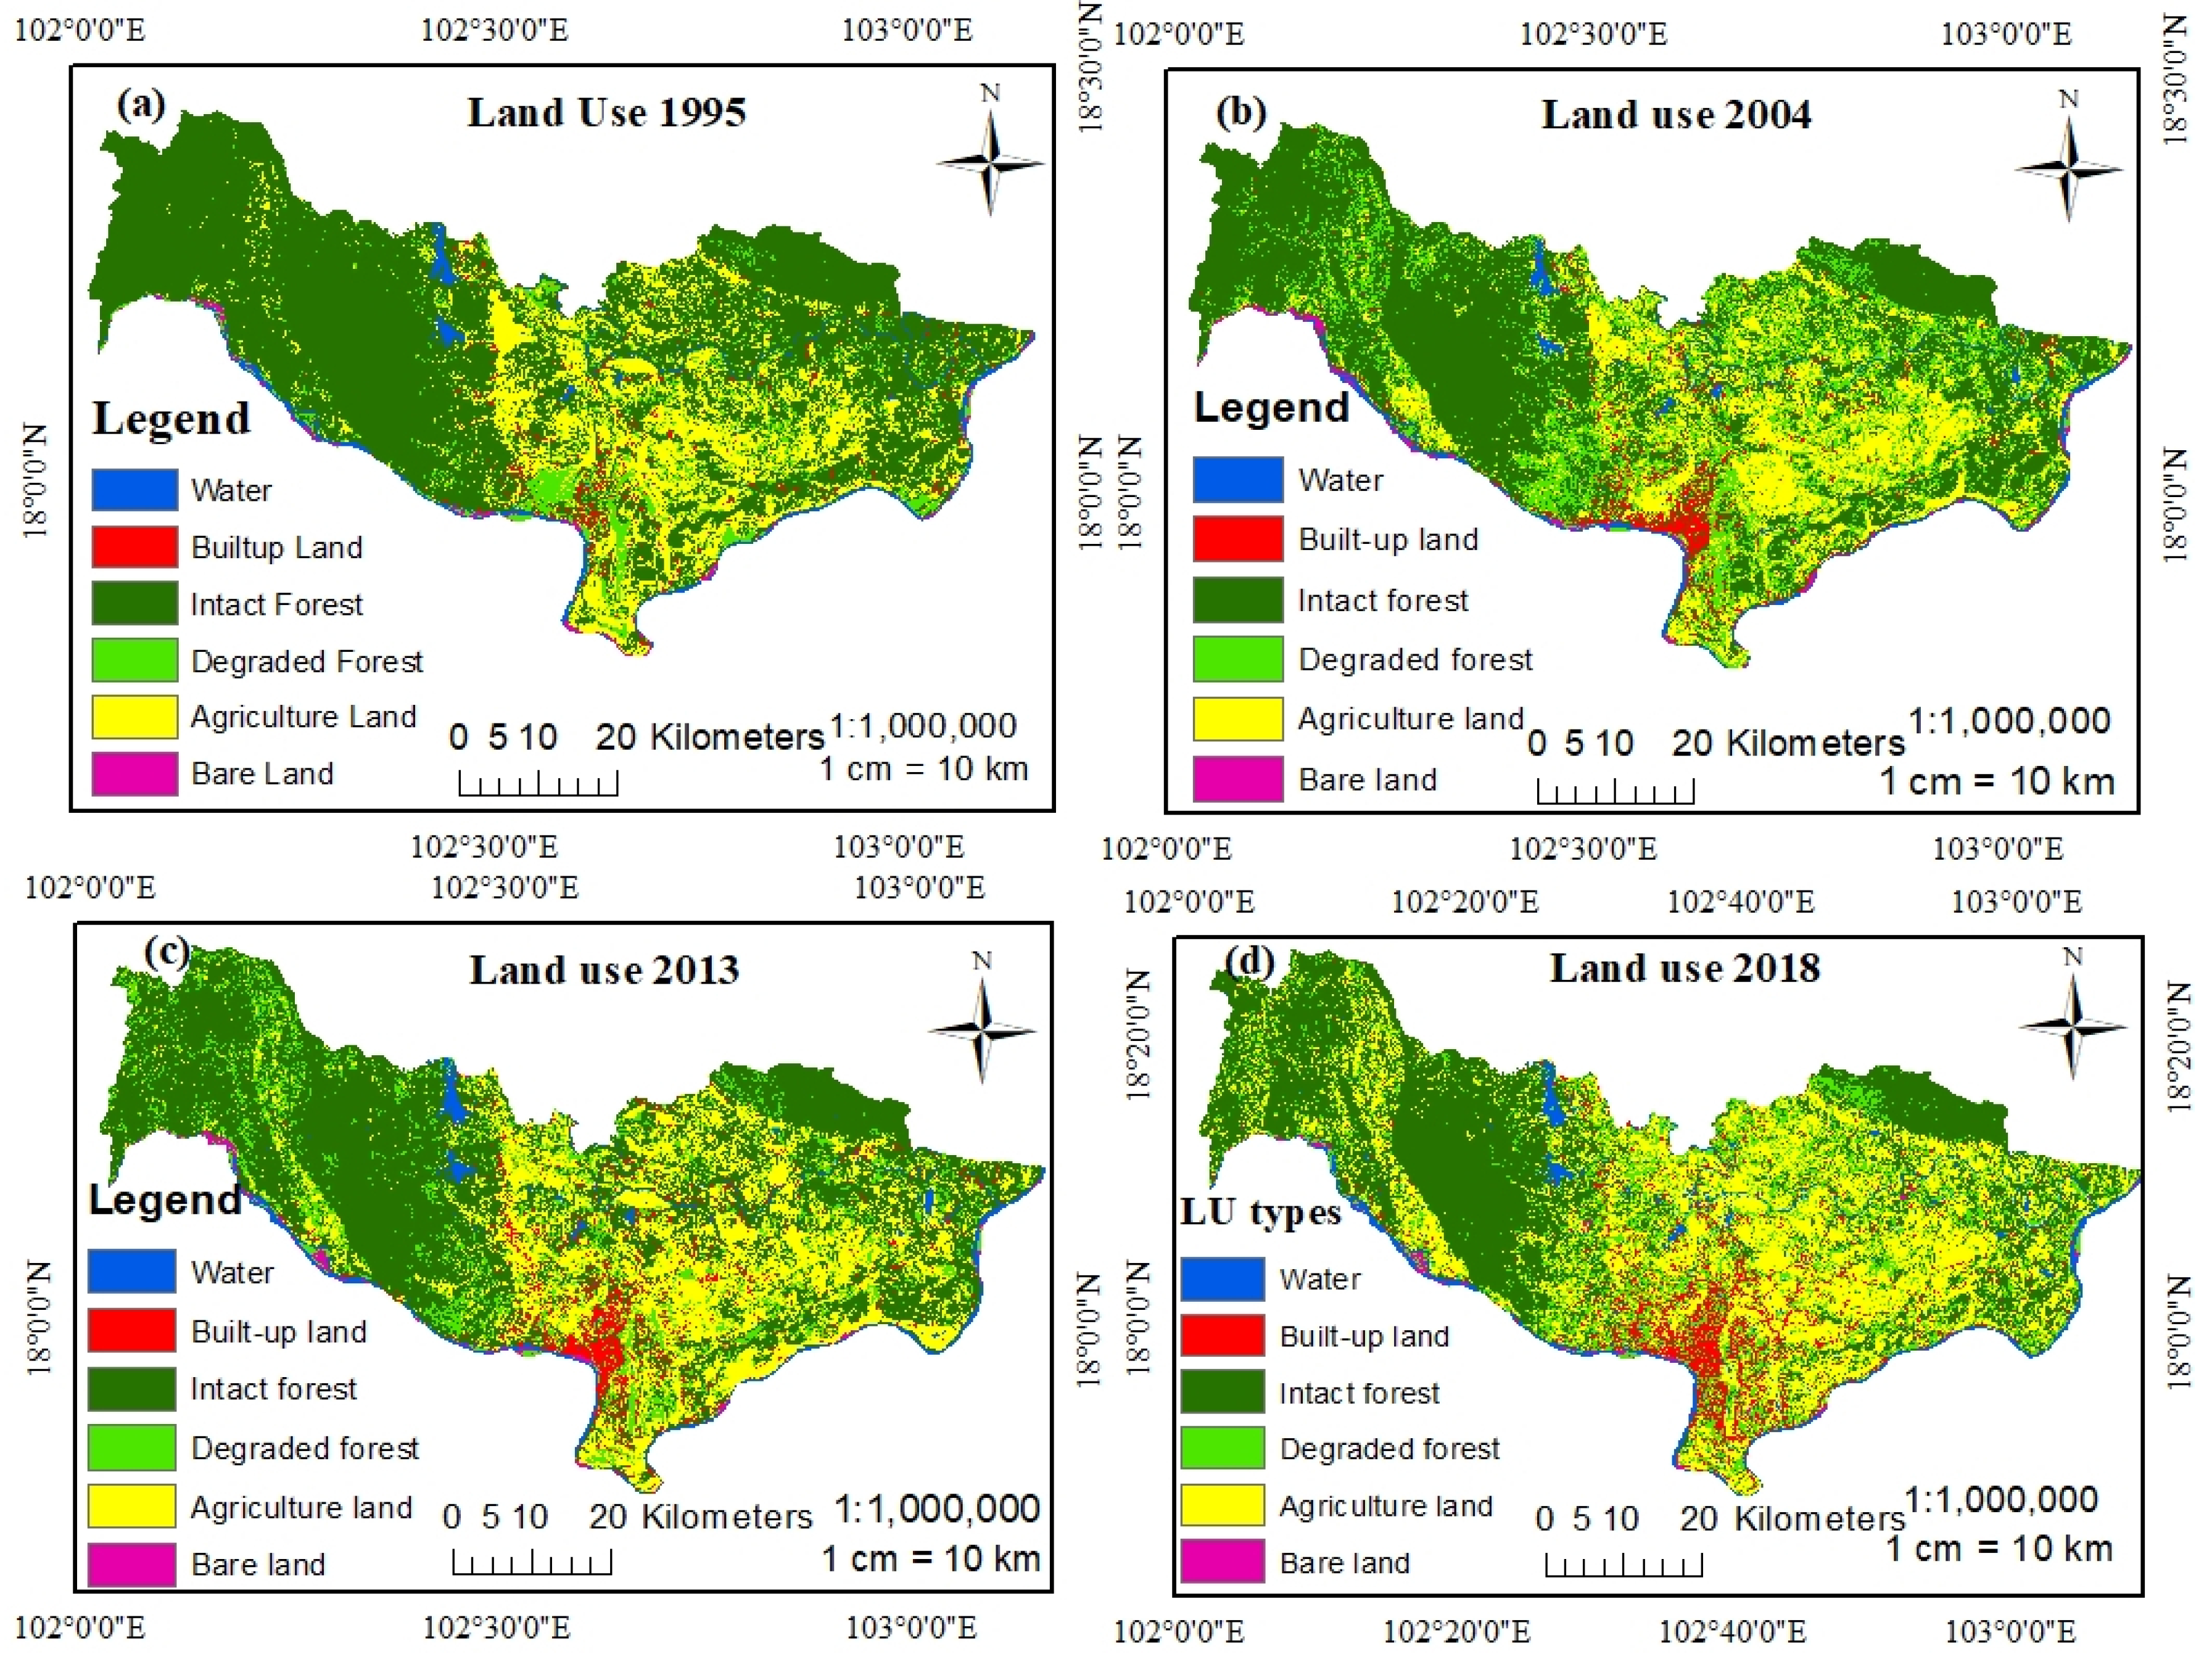
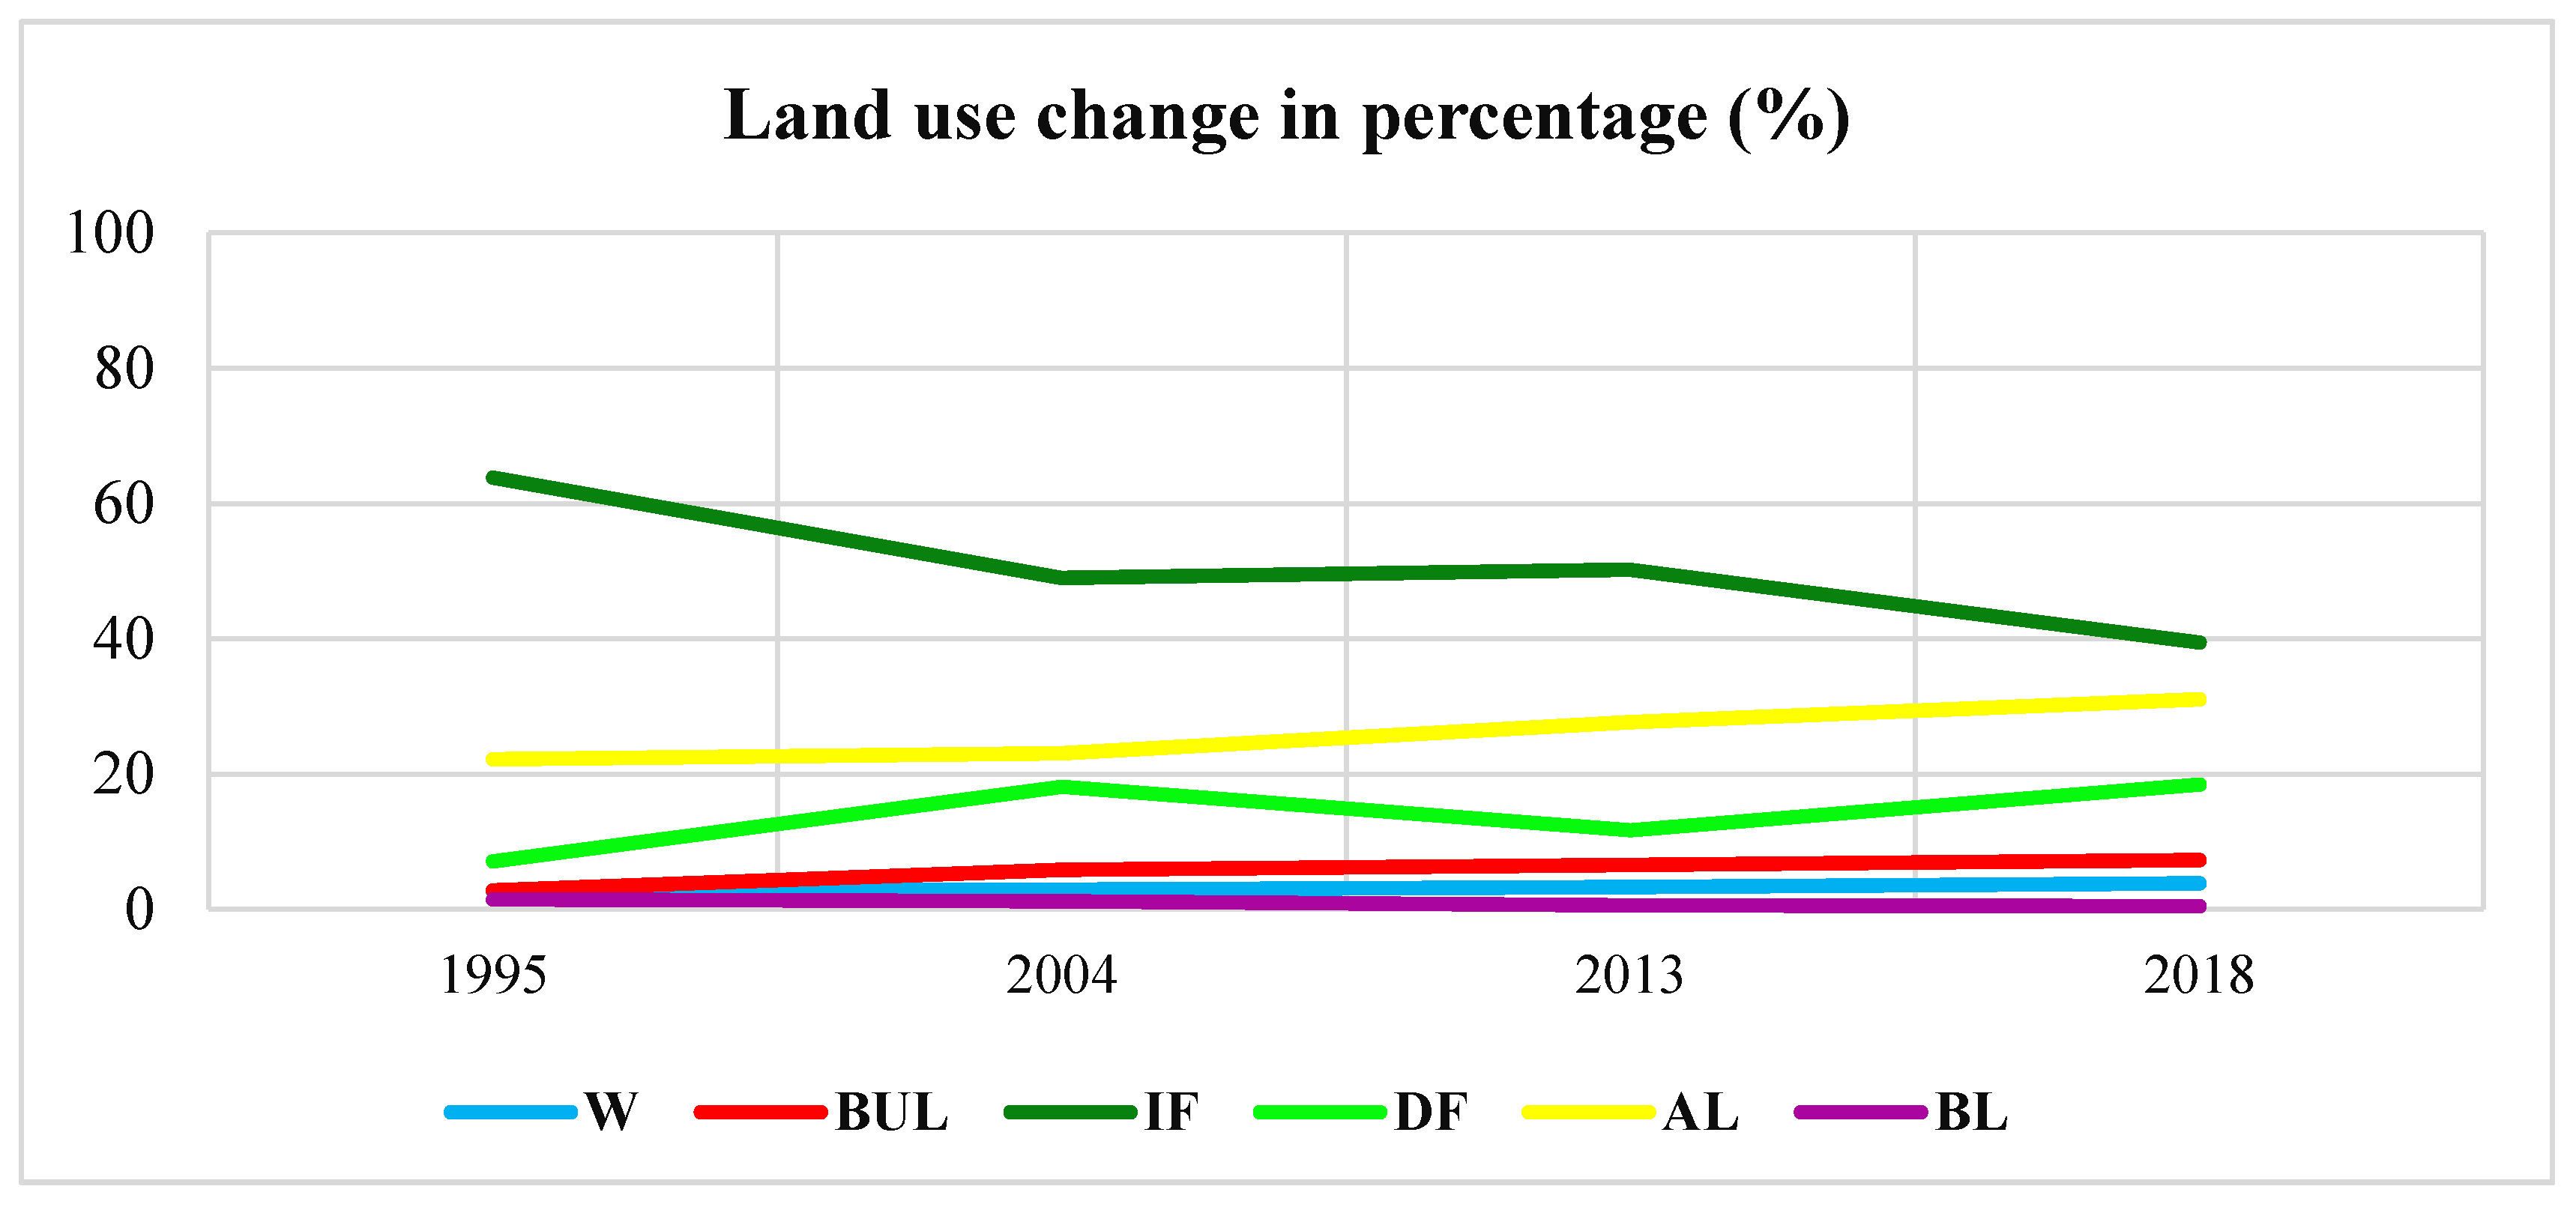
3.2. Analysis of Land Use/Cover Change from 1995 to 2018
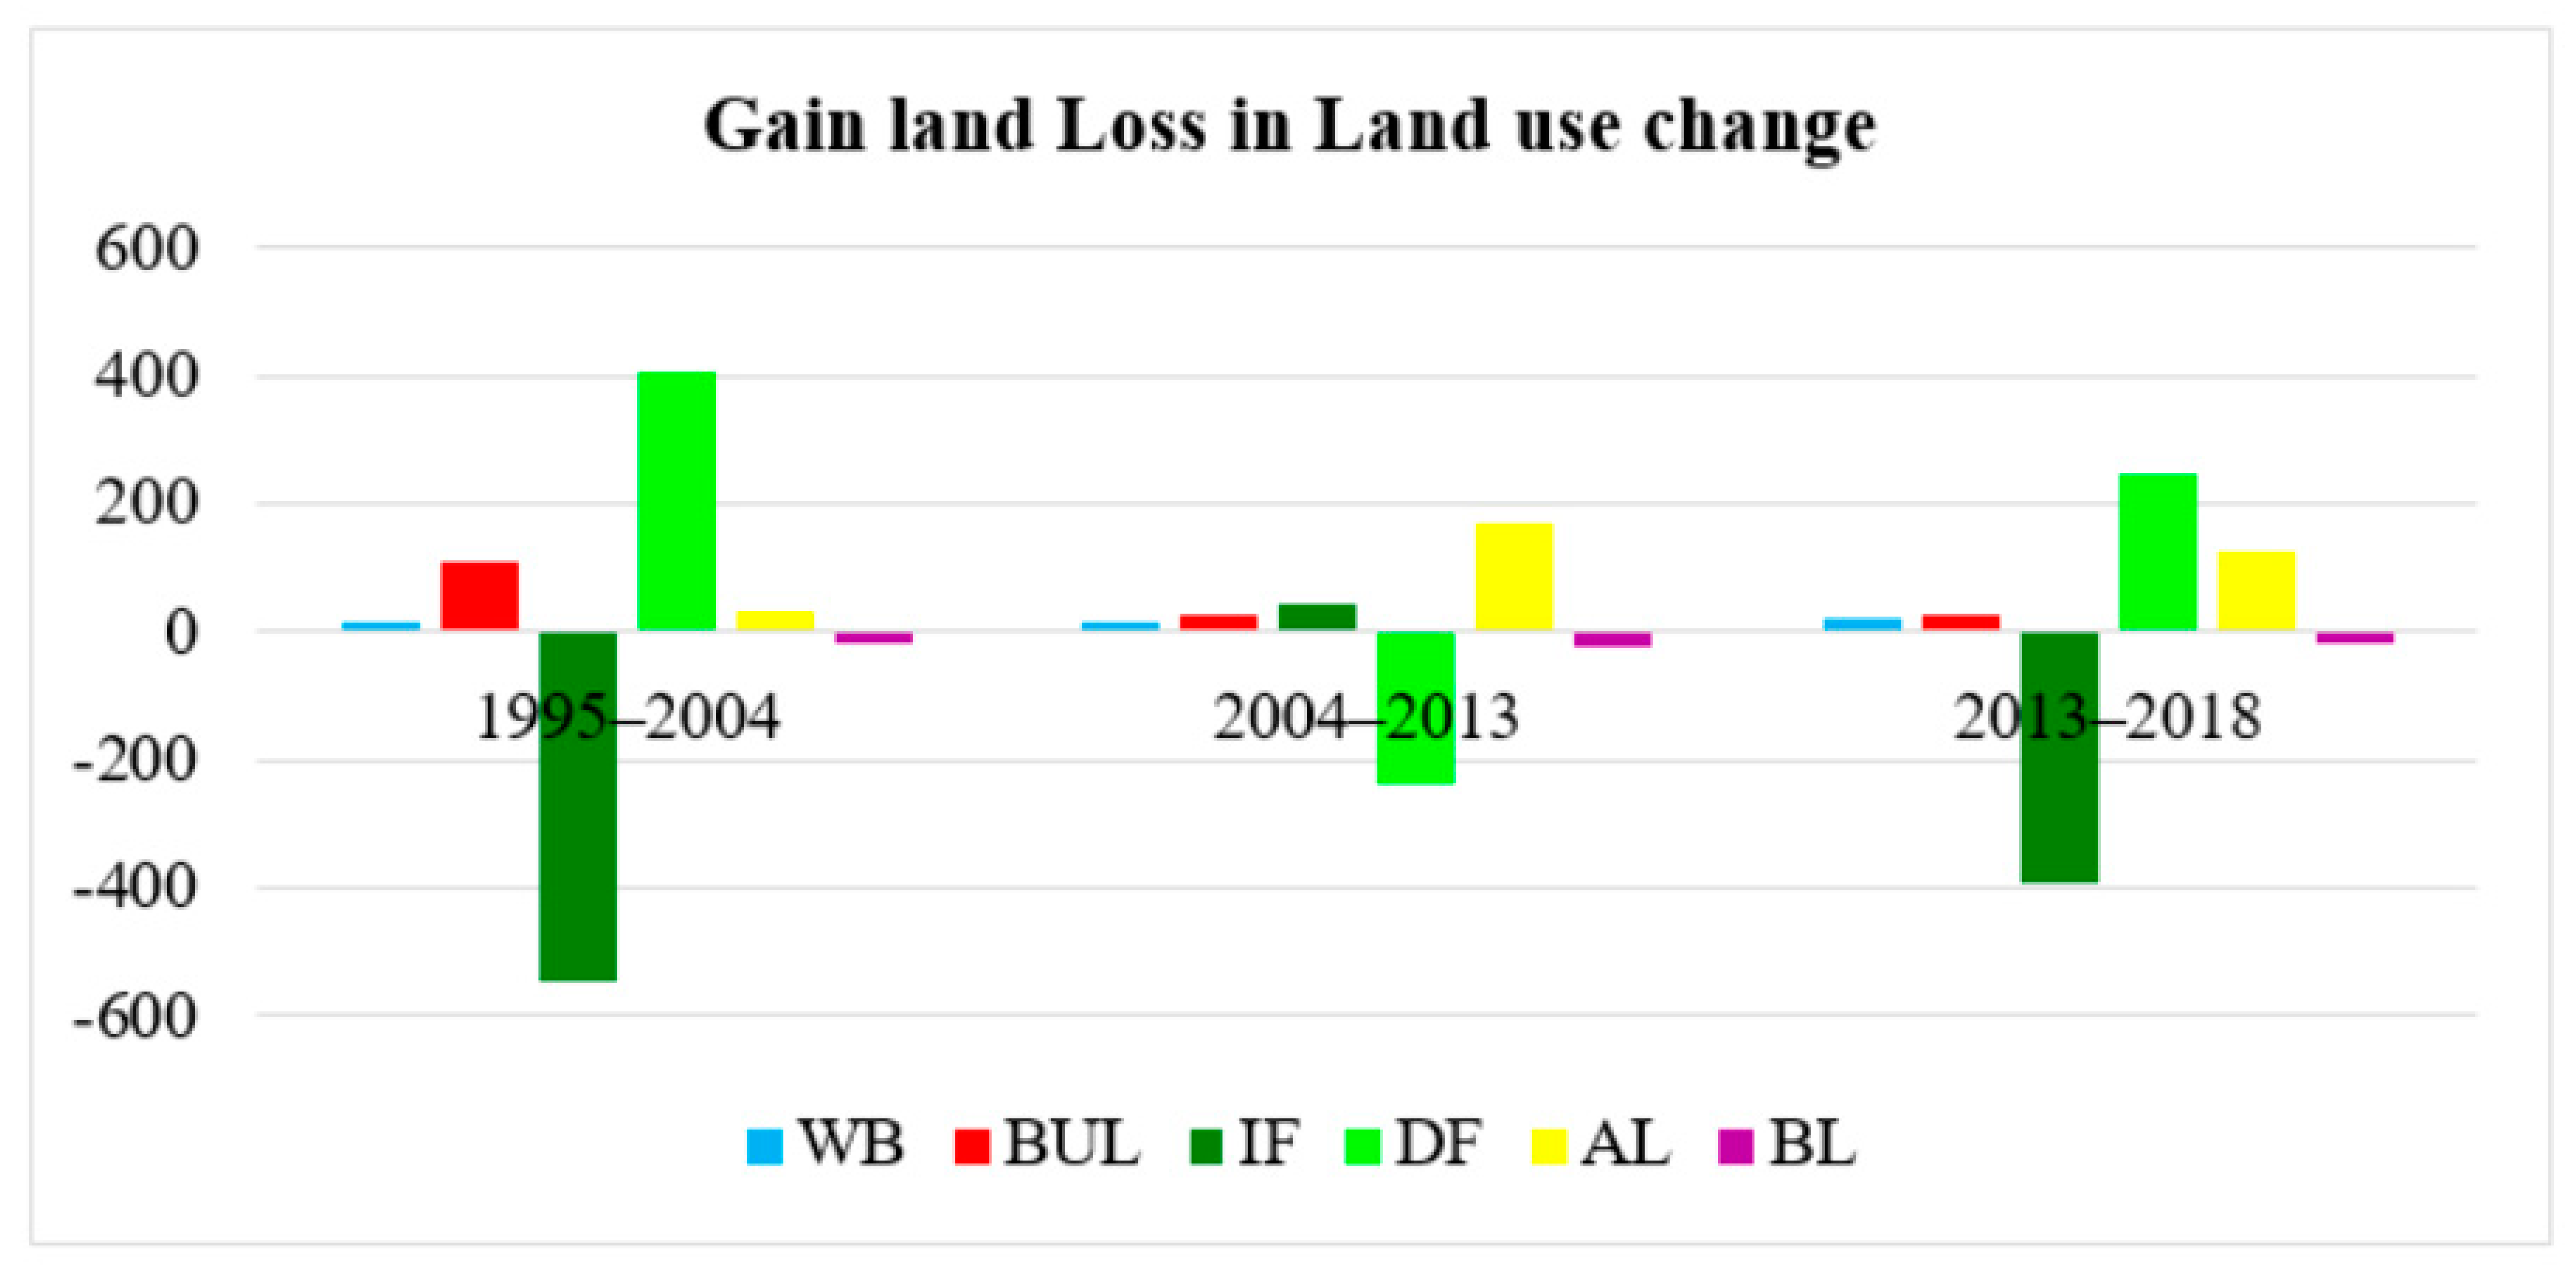
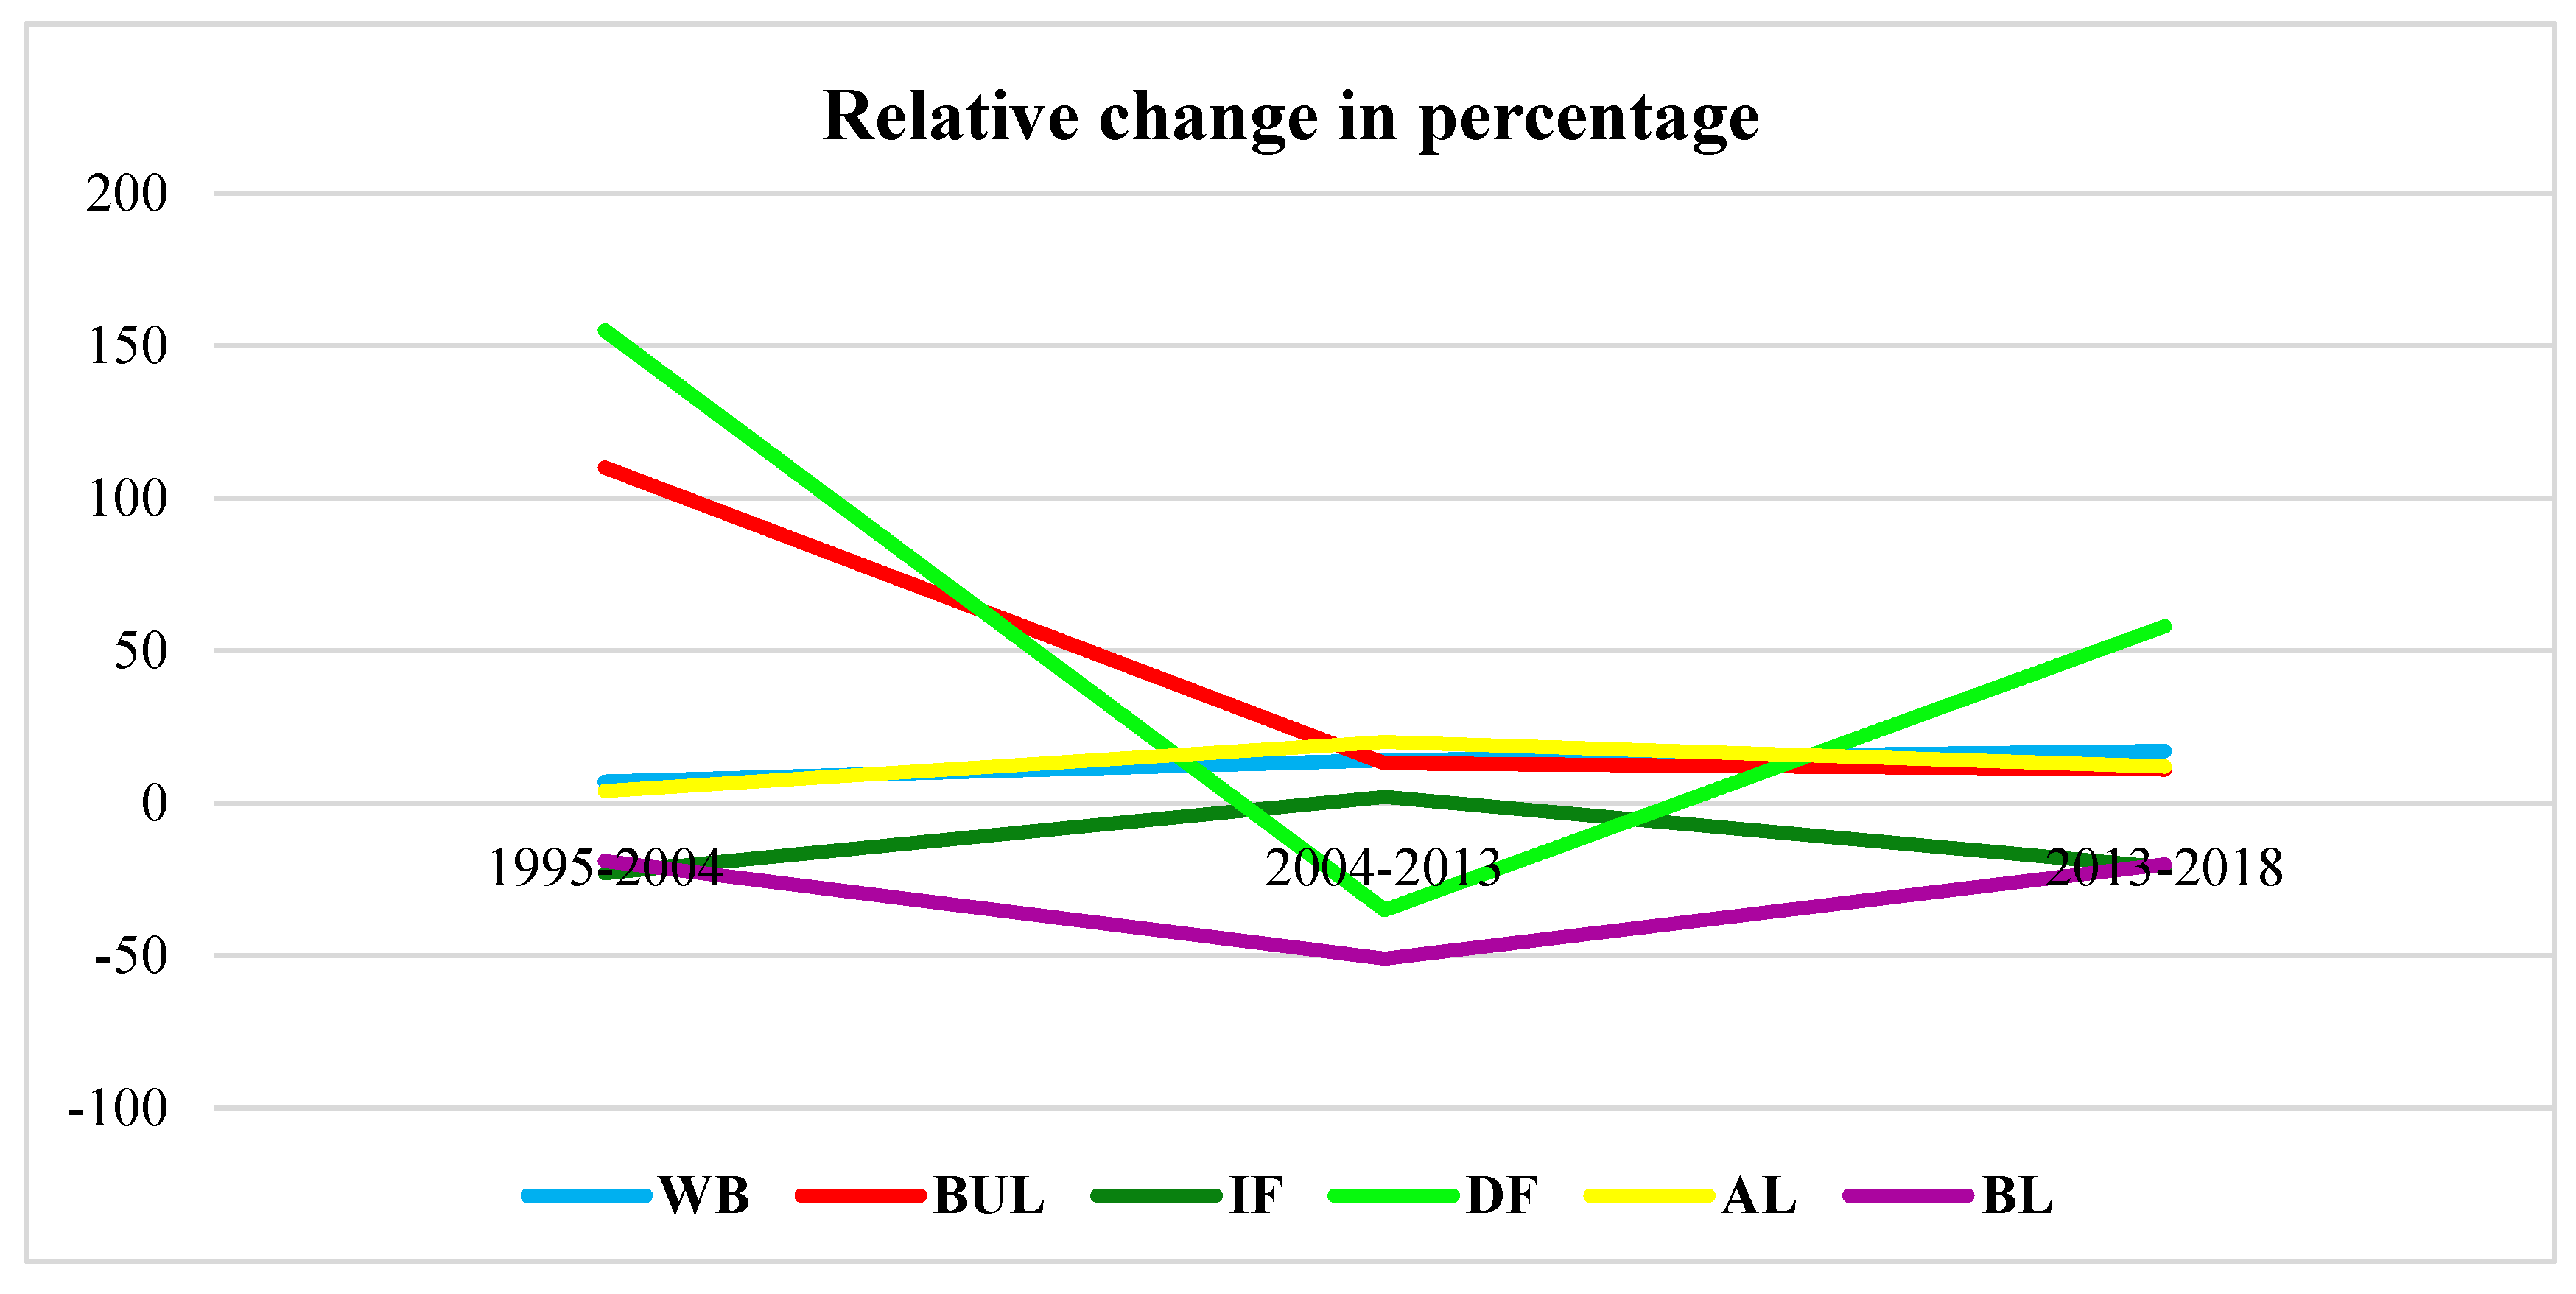
3.3. LUCC Detection Matrix from 1995 to 2004 and 2013 to 2018
3.4. Future Land Use/Cover Change Simulations
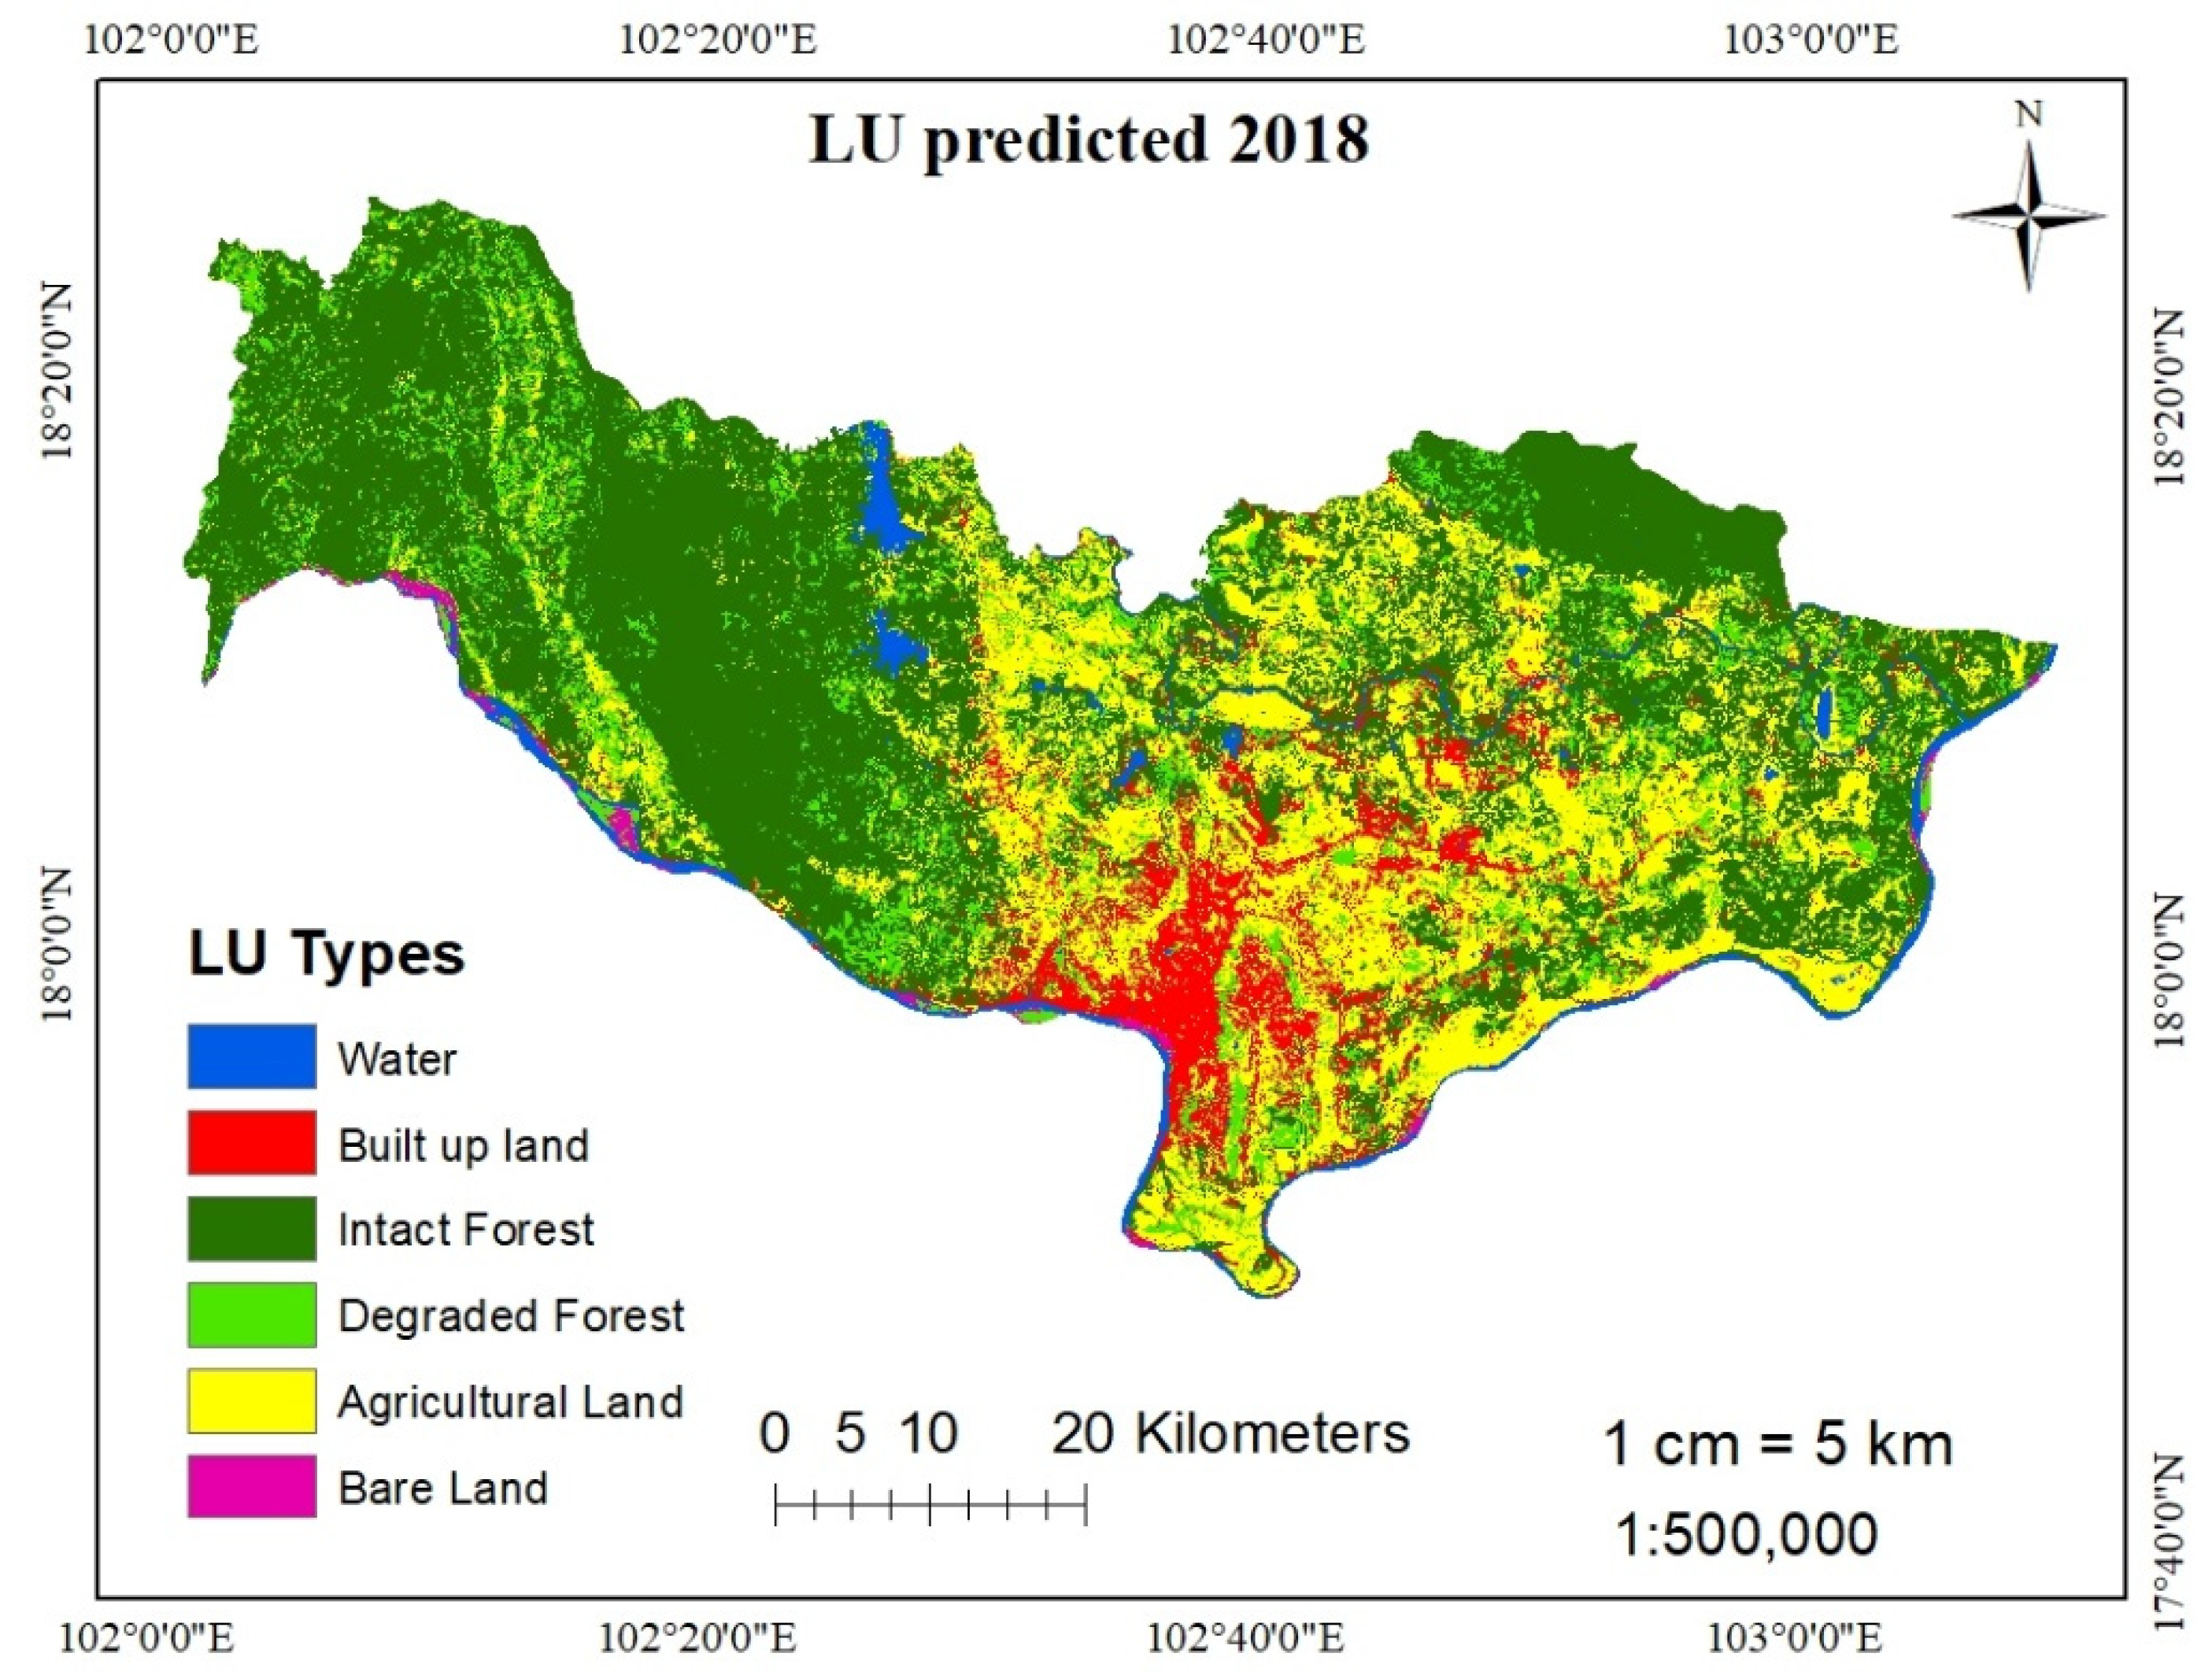
3.4.1. Model Validation of Predicted Land Use/Cover Change in 2018
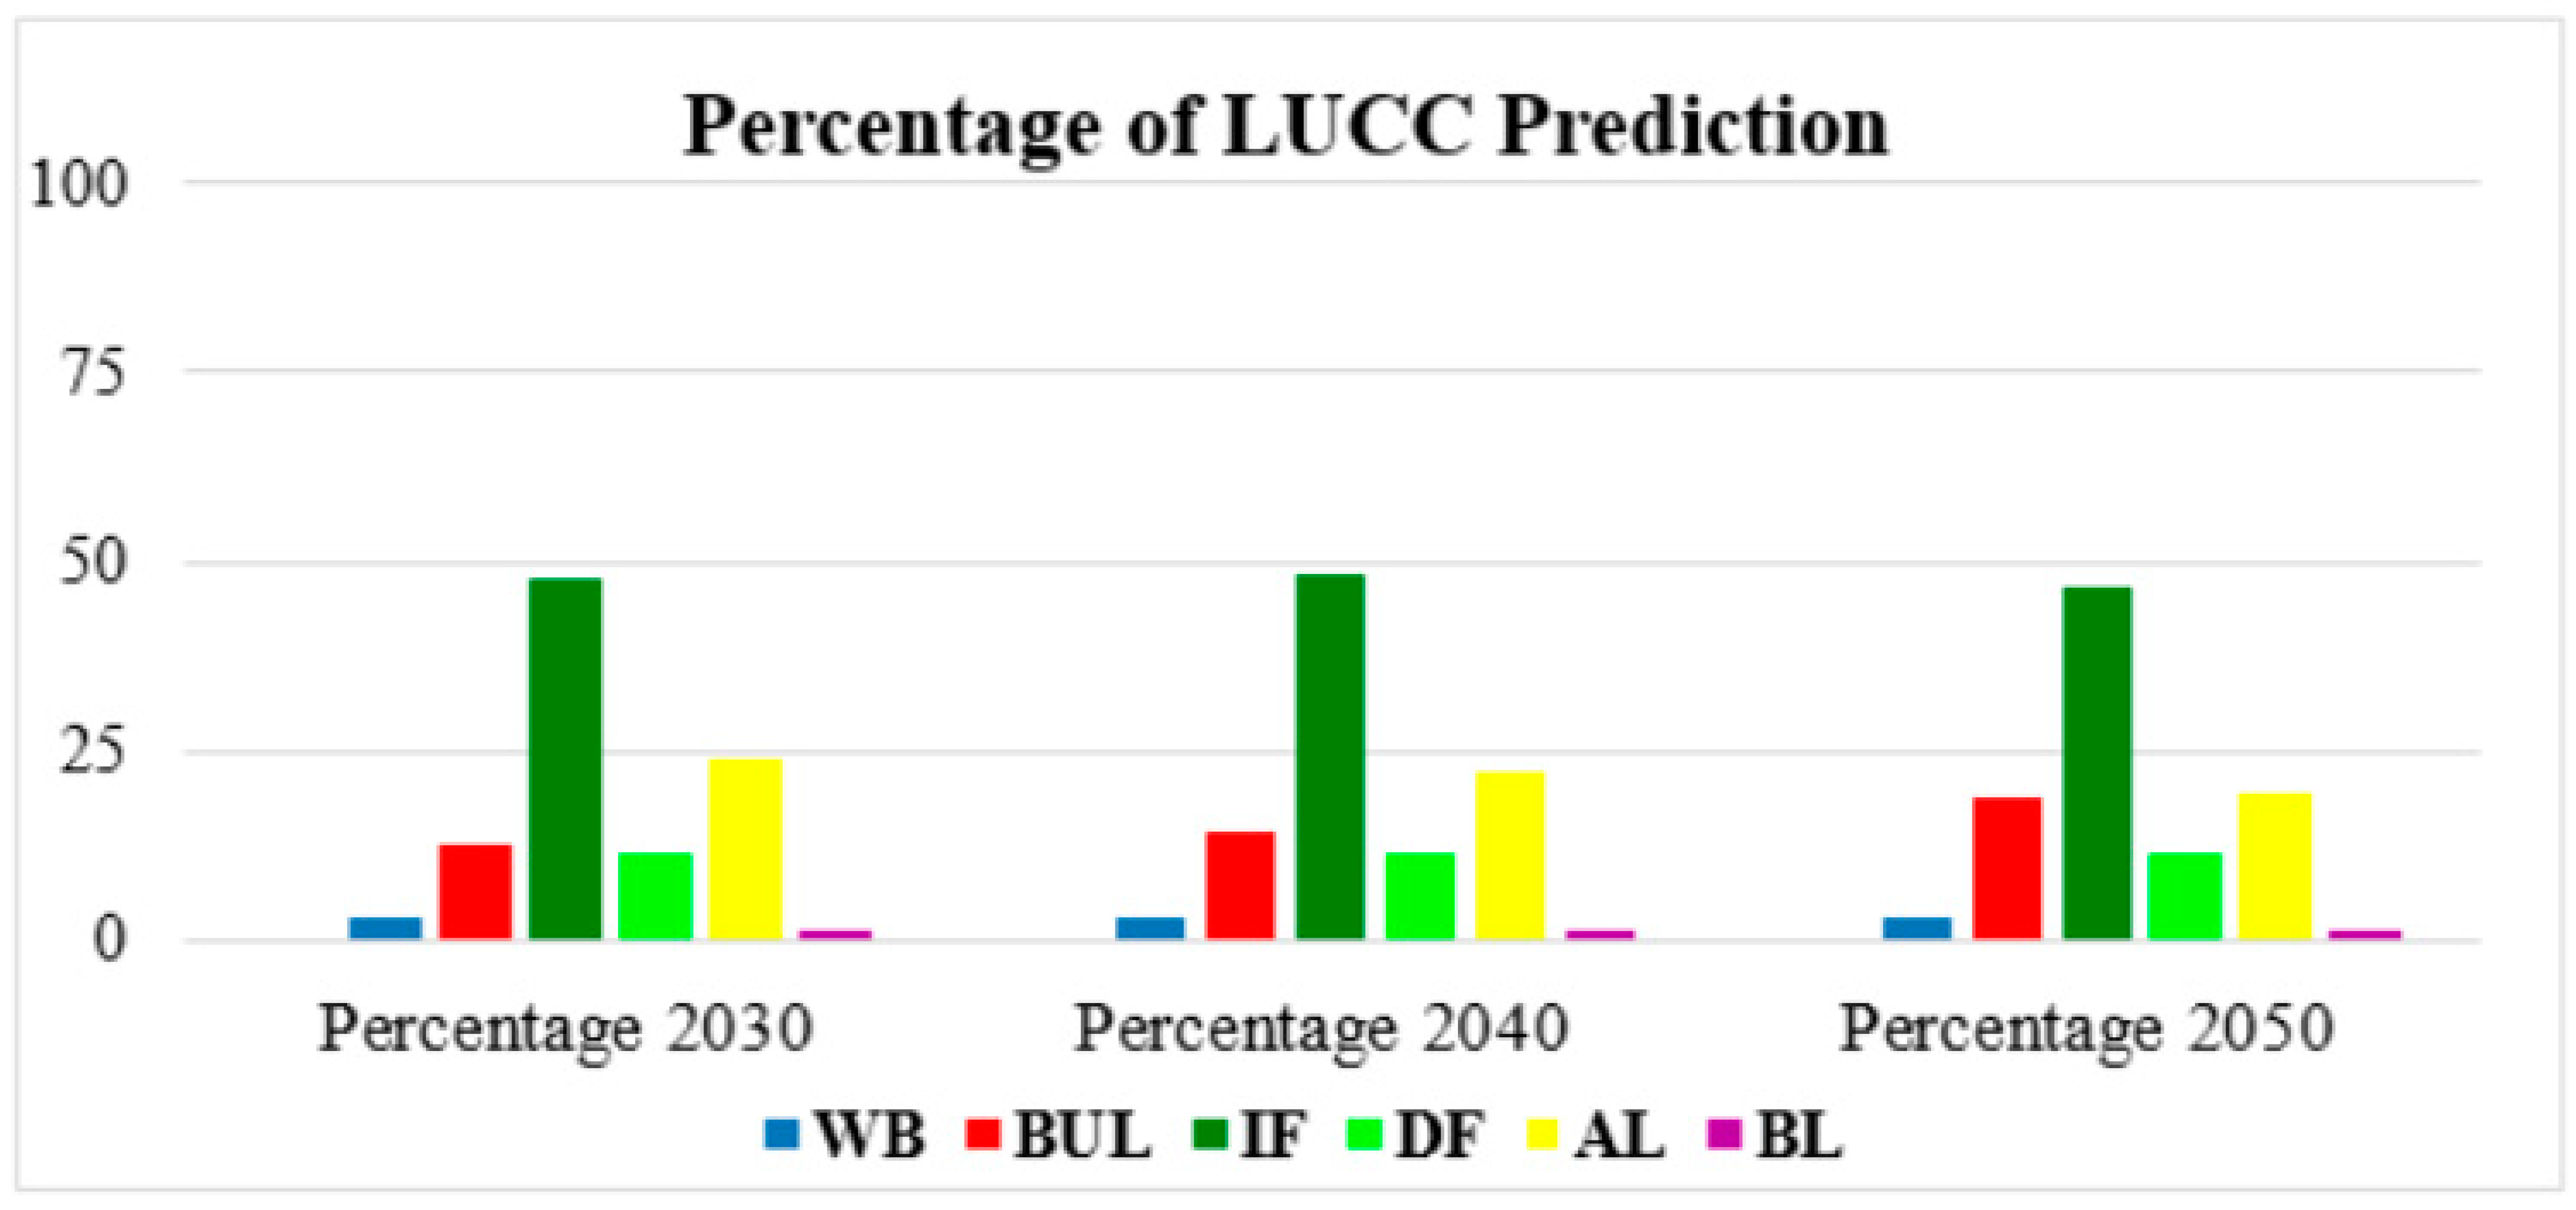
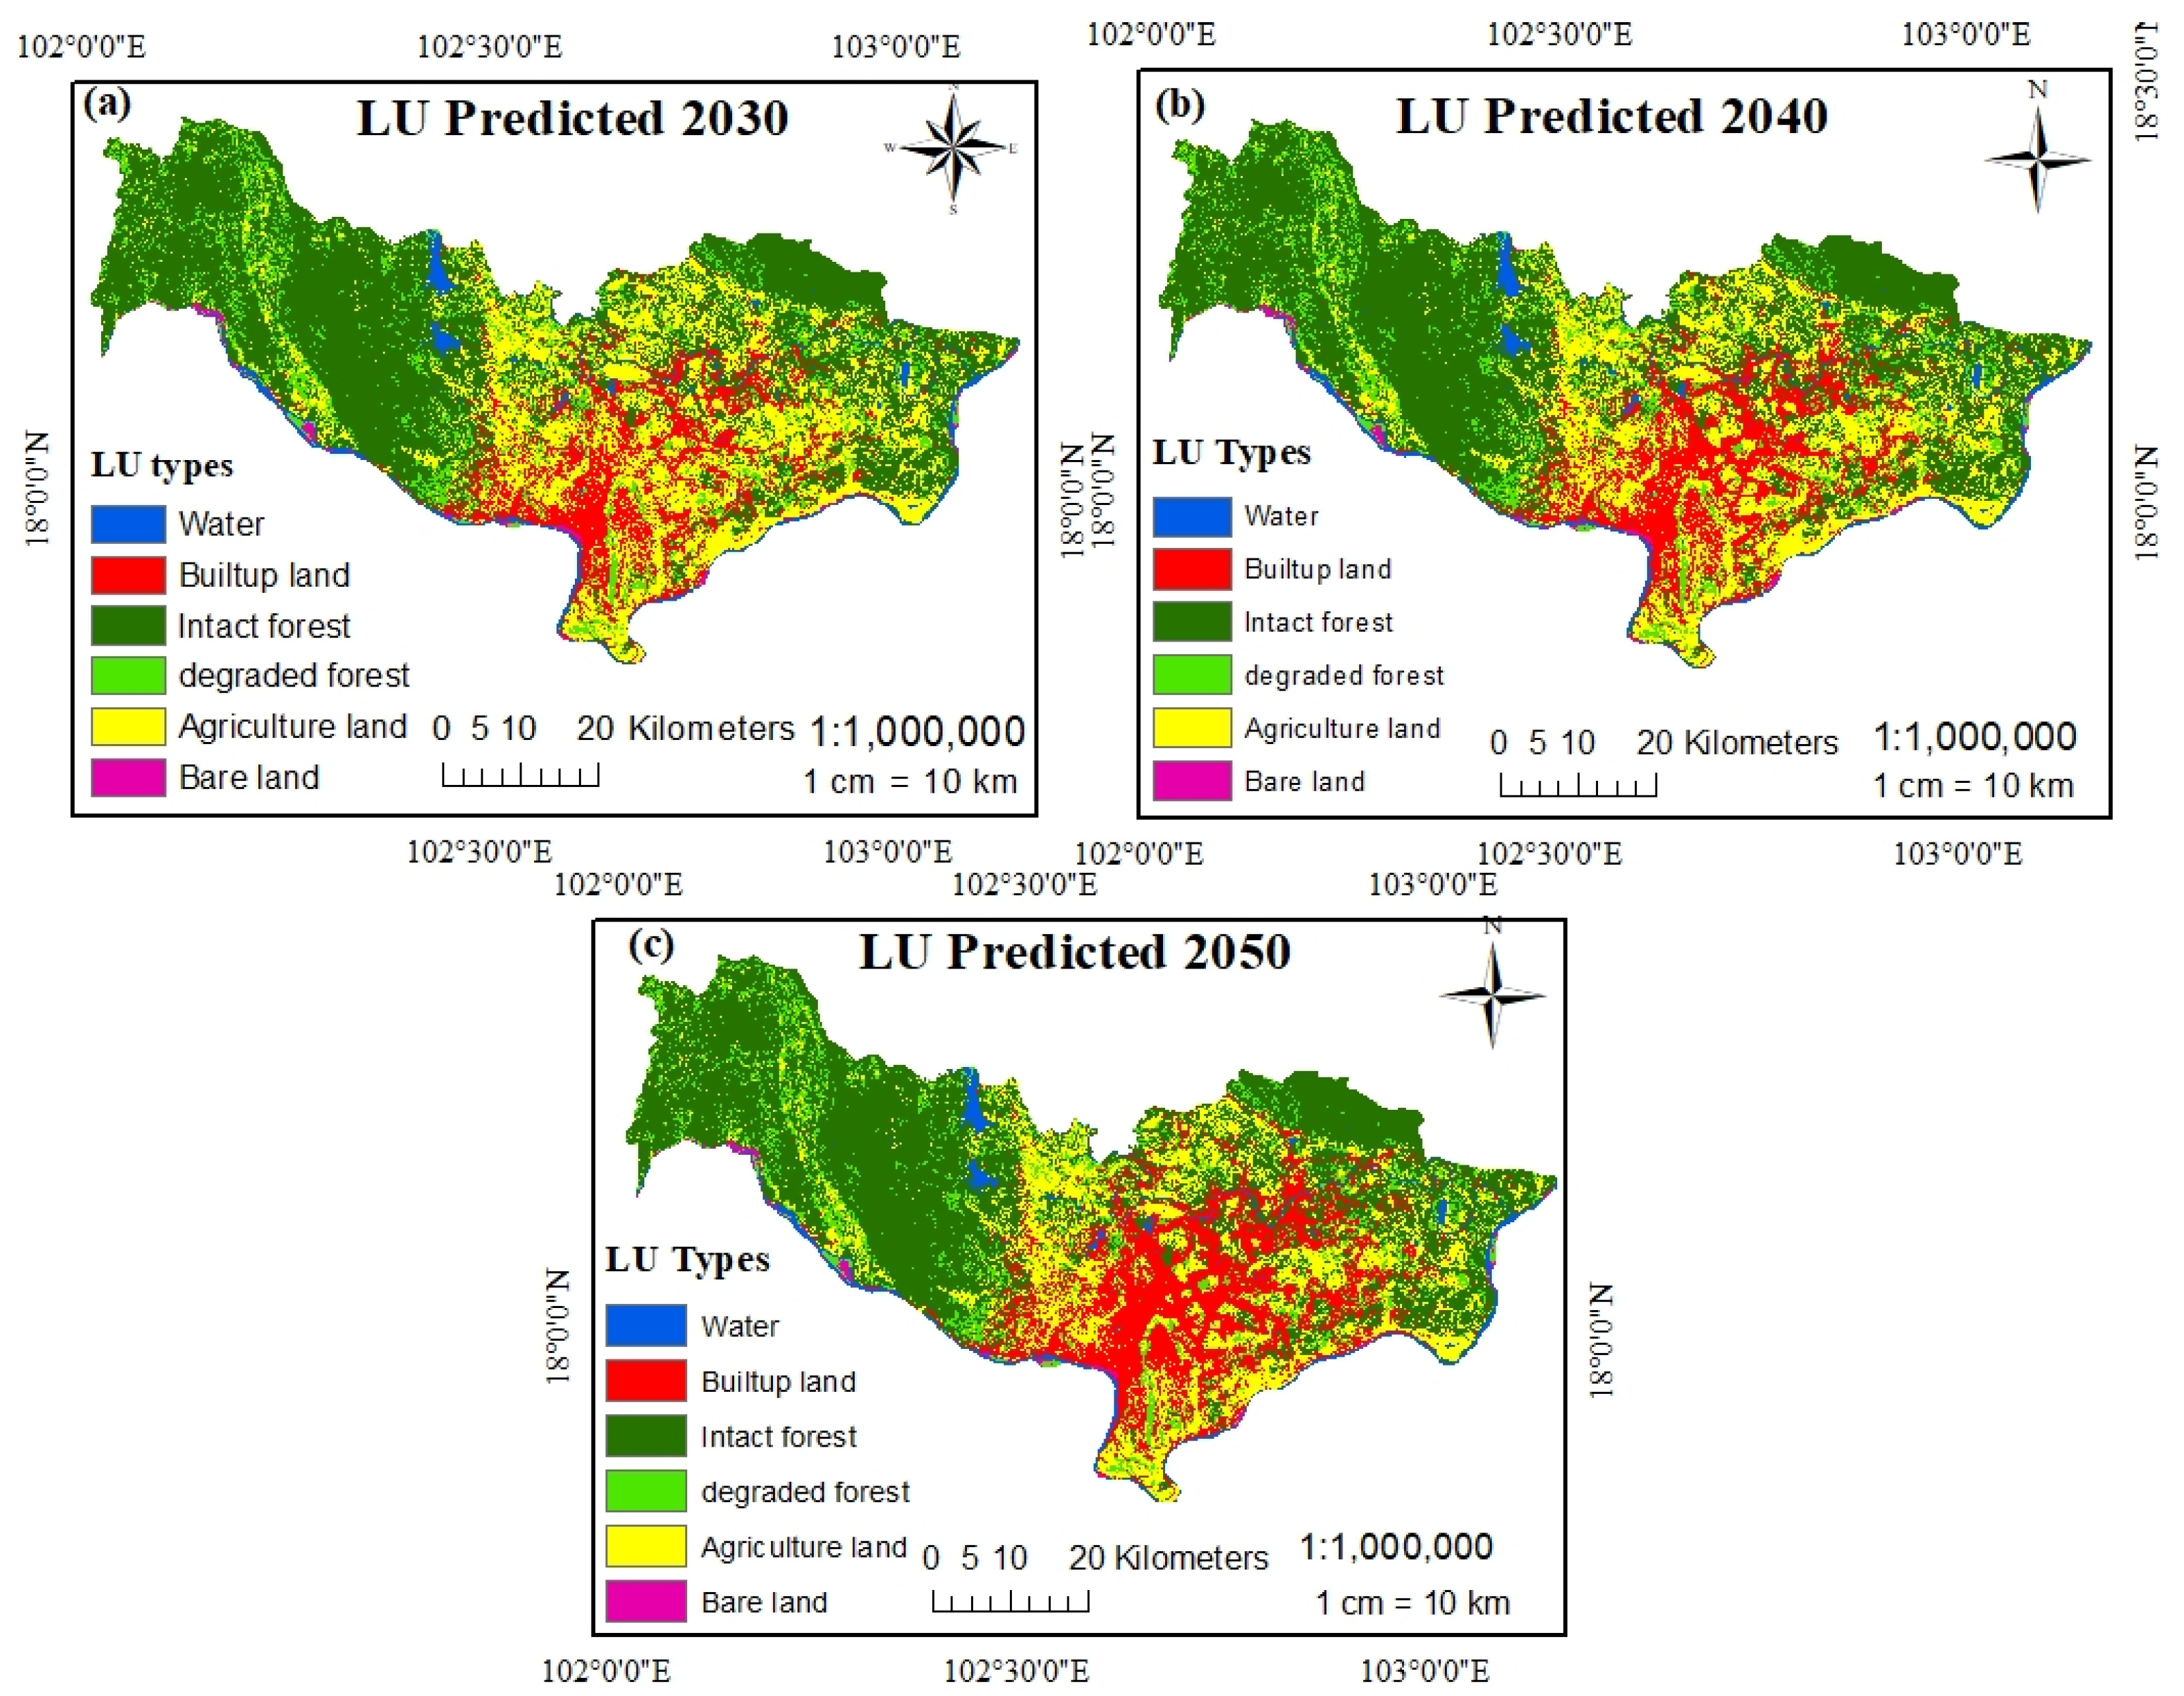
3.4.2. Future LUCC Simulations for 2030, 2040 and 2050
4. Conclusions
Author Contributions
Funding
Acknowledgments
Conflicts of Interest
References
- Li, P. Urbanization and the New Phase of Growth in China. In Urbanization and Its Impact in Contemporary China; Springer: Berlin/Heidelberg, Germany, 2019; pp. 1–20. [Google Scholar]
- Chauhan, R.P.; Gordon, M.L. A Systematic Review Analyzing the Prevalence and Circulation of Influenza Viruses in Swine Population Worldwide. Pathogens 2020, 9, 355. [Google Scholar] [CrossRef] [PubMed]
- Rawat, J.; Kumar, M. Monitoring land use/cover change using remote sensing and GIS techniques: A case study of Hawalbagh block, district Almora, Uttarakhand, India. Egypt. J. Remote Sens. Space Sci. 2015, 18, 77–84. [Google Scholar] [CrossRef]
- Wu, Q.; Li, H.-Q.; Wang, R.-S.; Paulussen, J.; He, Y.; Wang, M.; Wang, B.-H.; Wang, Z. Monitoring and predicting land use change in Beijing using remote sensing and GIS. Landsc. Urban Plan. 2006, 78, 322–333. [Google Scholar] [CrossRef]
- Guan, D.; Li, H.; Inohae, T.; Su, W.; Nagaie, T.; Hokao, K. Modeling urban land use change by the integration of cellular automaton and Markov model. Ecol. Model. 2011, 222, 3761–3772. [Google Scholar] [CrossRef]
- Kleemann, J.; Baysal, G.; Bulley, H.N.; Fürst, C. Assessing driving forces of land use and land cover change by a mixed-method approach in north-eastern Ghana, West Africa. J. Environ. Manag. 2017, 196, 411–442. [Google Scholar] [CrossRef]
- Schwalm, C.R.; Anderegg, W.R.L.; Michalak, A.M.; Fisher, J.B.; Biondi, F.; Koch, G.; Litvak, M.; Ogle, K.; Shaw, J.D.; Wolf, A.; et al. Global patterns of drought recovery. Nature 2017, 548, 202–205. [Google Scholar] [CrossRef]
- Halmy, M.W.A.; Gessler, P.E.; Hicke, J.A.; Salem, B. Land use/land cover change detection and prediction in the north-western coastal desert of Egypt using Markov-CA. Appl. Geogr. 2015, 63, 101–112. [Google Scholar] [CrossRef]
- Hamad, R.; Balzter, H.; Kolo, K. Predicting Land Use/Land Cover Changes Using a CA-Markov Model under Two Different Scenarios. Sustainability 2018, 10, 3421. [Google Scholar] [CrossRef]
- Hadgu, K. Temporal and Spatial Changes in Land Use Patterns and Biodiversity in Relation to Farm Productivity at Multiple Scales in Tigray, Ethiopia; Wageningen Universiteit: Wageningen, The Netherlands, 2008. [Google Scholar]
- Rahel, H.; Kamal, K.; Heiko, B. Land Cover Changes Induced by Demining Operations in Halgurd-Sakran National Park in the Kurdistan Region. of Iraq. Sustainability 2018, 10, 2422. [Google Scholar] [CrossRef]
- Liu, L.; Liang, Y.; Hashimoto, S. Integrated assessment of land-use/coverage changes and their impacts on ecosystem services in Gansu Province, northwest China: Implications for sustainable development goals. Sustain. Sci. 2019, 15, 297–314. [Google Scholar] [CrossRef]
- Giri, C.; Defourny, P.; Shrestha, S. Land cover characterization and mapping of continental Southeast Asia using multi-resolution satellite sensor data. Int. J. Remote Sens. 2003, 24, 4181–4196. [Google Scholar] [CrossRef]
- Ruben, G.B.; Zhang, K.; Dong, Z.; Jun, X. Analysis and Projection of Land-Use/Land-Cover Dynamics through Scenario-Based Simulations Using the CA-Markov Model: A Case Study in Guanting Reservoir Basin, China. Sustainability 2020, 12, 3747. [Google Scholar] [CrossRef]
- Shamsi, S.F. Integrating Linear Programming and Analytical Hierarchical Processing in Raster-GIS to Optimize Land Use Pattern at Watershed Level. J. Appl. Sci. Environ. Manag. 2010, 14. [Google Scholar] [CrossRef]
- Hyandye, C.; Mandara, C.G.; Safari, J. GIS and Logit Regression Model Applications in Land Use/Land Cover Change and Distribution in Usangu Catchment. Am. J. Remote Sens. 2015, 3, 6–16. [Google Scholar] [CrossRef]
- Aitkenhead, M.; Aalders, I. Predicting land cover using GIS, Bayesian and evolutionary algorithm methods. J. Environ. Manag. 2009, 90, 236–250. [Google Scholar] [CrossRef] [PubMed]
- Singh, S.K.; Mustak, S.; Srivastava, P.K.; Szabó, S.; Islam, T. Predicting Spatial and Decadal LULC Changes Through Cellular Automata Markov Chain Models Using Earth Observation Datasets and Geo-information. Environ. Process. 2015, 2, 61–78. [Google Scholar] [CrossRef]
- Yang, X.; Zheng, X.; Lv, L.-N. A spatiotemporal model of land use change based on ant colony optimization, Markov chain and cellular automata. Ecol. Model. 2012, 233, 11–19. [Google Scholar] [CrossRef]
- Subedi, P.; Subedi, K.; Thapa, B. Application of a Hybrid Cellular Automaton–Markov (CA-Markov) Model in Land-Use Change Prediction: A Case Study of Saddle Creek Drainage Basin, Florida. Appl. Ecol. Environ. Sci. 2013, 1, 126–132. [Google Scholar] [CrossRef]
- Stefanov, W.L.; Ramsey, M.S.; Christensen, P.R. Monitoring urban land cover change: An expert system approach to land cover classification of semiarid to arid urban centers. Remote Sens. Environ. 2001, 77, 173–185. [Google Scholar] [CrossRef]
- Verburg, P.H.; De Nijs, T.C.; Van Eck, J.R.; Visser, H.; De Jong, K. A method to analyse neighbourhood characteristics of land use patterns. Comput. Environ. Urban Syst. 2004, 28, 667–690. [Google Scholar] [CrossRef]
- Chen, L.; Yujun, S.; Saeed, S. Monitoring and predicting land use and land cover changes using remote sensing and GIS techniques—A case study of a hilly area, Jiangle, China. PLoS ONE 2018, 13, e0200493. [Google Scholar] [CrossRef]
- Wang, S.W.; Gebru, B.M.; Lamchin, M.; Kayastha, R.; Lee, W.-K. Land Use and Land Cover Change Detection and Prediction in the Kathmandu District of Nepal Using Remote Sensing and GIS. Sustainability 2020, 12, 3925. [Google Scholar] [CrossRef]
- Khawaldah, H.A. A Prediction of Future Land Use/Land Cover in Amman Area Using GIS-Based Markov Model and Remote Sensing. J. Geogr. Inf. Syst. 2016, 8, 412–427. [Google Scholar] [CrossRef]
- Hue, S.-W.; Korom, A.; Seng, Y.-W.; Sihapanya, V.; Phimmavong, S.; Phua, M.-H. Land Use and Land Cover Change in Vientiane Area, Lao PDR Using Object-Oriented Classification on Multi-Temporal Landsat Data. Adv. Sci. Lett. 2017, 23, 11340–11344. [Google Scholar] [CrossRef][Green Version]
- Shiferraw, H.; Bewket, W.; Alamirew, T.; Zeleke, G.; Teketay, D.; Bekele, K.; Schaffner, U.; Eckert, S. Implication of lad use/land cover dynamics and Prosopis invasion on ecosystem service values in Afar Region, Ethiopia. Sci. Total. Environ. 2019, 675, 354–366. [Google Scholar] [CrossRef] [PubMed]
- Praseuth, S.; Tuan, D.P.; Duc, C.M.; Quang, H.B.; Nhat, T.N.T. Mapping land cover types in Vientiane, Laos using multi-temporal composite Landsat 8 images. In Proceedings of the 6th NAFOSTED Conference on Information and Computer Science (NICS), Hanoi, Vietnam, 12–13 December 2019; pp. 563–568. [Google Scholar]
- Pholsena, V. Mobility, familiarity and prejudice: Living together in a multiethnic town in southern Laos. Ethn. Racial Stud. 2018, 43, 1872–1889. [Google Scholar] [CrossRef]
- Sangha, K.K.; Maynard, S.; Pearson, J.; Dobriyal, P.; Badola, R.; Hussain, S.A. Recognising the role of local and Indigenous communities in managing natural resources for the greater public benefit: Case studies from Asia and Oceania region. Ecosyst. Serv. 2019, 39, 100991. [Google Scholar] [CrossRef]
- Population, C. The population of the provinces of Laos according to census results and latest official projections. Available online: https://www.citypopulation.de/en/laos/cities/ (accessed on 10 September 2019).
- USGS. Earth Explorer. Available online: https://earthexplorer.usgs.gov/ (accessed on 28 August 2016).
- OpenStreetMap© Online Mapping Project Database. Available online: http://www.openstreetmap.org/ (accessed on 11 December 2011).
- Chilagane, N.A.; Kashaigili, J.J.; Mutayoba, E. Historical and Future Spatial and Temporal Changes in Land Use and Land Cover in the Little Ruaha River Catchment, Tanzania. J. Geosci. Environ. Prot. 2020, 8, 76–96. [Google Scholar] [CrossRef]
- Yang, J.; Chen, F.; Xi, J.; Xie, P.; Li, C. A Multitarget Land Use Change Simulation Model Based on Cellular Automata and Its Application. Abstr. Appl. Anal. 2014, 2014, 1–11. [Google Scholar] [CrossRef]
- Potapov, P.; Yaroshenko, A.; Turubanova, S.; Dubinin, M.; Laestadius, L.; Thies, C.; Aksenov, D.; Egorov, A.; Yesipova, Y.; Glushkov, I.; et al. Mapping the World’s Intact Forest Landscapes by Remote Sensing. Ecol. Soc. 2008, 13. [Google Scholar] [CrossRef]
- Watson, J.; Evans, T.; Venter, O.; Williams, B.; Tulloch, A.I.; Stewart, C.; Thompson, I.; Ray, J.C.; Murray, K.A.; Salazar, Á.; et al. The exceptional value of intact forest ecosystems. Nat. Ecol. Evol. 2018, 2, 599–610. [Google Scholar] [CrossRef] [PubMed]
- Malhi, Y.; Gardner, T.A.; Goldsmith, G.R.; Silman, M.R.; Zelazowski, P. Tropical Forests in the Anthropocene. Annu. Rev. Environ. Resour. 2014, 39, 125–159. [Google Scholar] [CrossRef]
- Baird, I.G. Degraded forest, degraded land and the development of industrial tree plantations in Laos. Singap. J. Trop. Geogr. 2014, 35, 328–344. [Google Scholar] [CrossRef]
- Congalton, R.G.; Green, K. Assessing the Accuracy of Remotely Sensed Data: Principles and Practices; CRC Press: Boca Raton, FL, USA, 2019. [Google Scholar] [CrossRef]
- Hsu, L.-C. Applying the Grey prediction model to the global integrated circuit industry. Technol. Forecast. Soc. Chang. 2003, 70, 563–574. [Google Scholar] [CrossRef]
- Murugesan, S.; Zhang, J.; Vittal, V. Finite state Markov chain model for wind generation forecast: A data-driven spatiotemporal approach. In Proceedings of the 2012 IEEE PES Innovative Smart Grid Technologies (ISGT), Washington, DC, USA, 16–20 January 2012; pp. 1–8. [Google Scholar] [CrossRef]
- Mondal, S.; Sharma, N.; Garg, P.; Kappas, M. Statistical independence test and validation of CA Markov land use land cover (LULC) prediction results. Egypt. J. Remote Sens. Space Sci. 2016, 19, 259–272. [Google Scholar] [CrossRef]
- Shelat, S.; Daamen, W.; Kaag, B.; Duives, D.; Hoogendoorn, S. A Markov-chain Activity-based Model for Pedestrians in Office Buildings. Collect. Dyn. 2020, 5, 423–430. [Google Scholar] [CrossRef]
- Ye, Y.-C.; Kuang, L.-H.; Zhao, X.-M.; Guo, X. Scenario-based simulation of land use in Yingtan (Jiangxi Province, China) using an integrated genetic algorithm-cellular automata-Markov model. Environ. Sci. Pollut. Res. 2020, 1–15. [Google Scholar] [CrossRef]
- Omar, N.Q.; Ahamad, M.S.S.; Hussin, W.M.A.W.; Samat, N.; Ahmad, S.Z. Markov CA, Multi Regression, and Multiple Decision Making for Modeling Historical Changes in Kirkuk City, Iraq. J. Indian Soc. Remote Sens. 2013, 42, 165–178. [Google Scholar] [CrossRef]
- Hua, A.K. Land Use Land Cover Changes in Detection of Water Quality: A Study Based on Remote Sensing and Multivariate Statistics. J. Environ. Public Health 2017, 2017, 1–12. [Google Scholar] [CrossRef]
- Congalton, R.G. Accuracy assessment and validation of remotely sensed and other spatial information. Int. J. Wildland Fire 2001, 10, 321. [Google Scholar] [CrossRef]
- Patekar, P.; Unhale, P. Remote Sensing and GIS application in change detection study using Multi Temporal Satellite. Int. J. Adv. Remote Sens. GIS 2013, 2, 374–378. [Google Scholar]
- Mallupattu, P.K.; Reddy, J.R.S. Analysis of Land Use/Land Cover Changes Using Remote Sensing Data and GIS at an Urban Area, Tirupati, India. Sci. World J. 2013, 2013, 268623. [Google Scholar] [CrossRef] [PubMed]
- Asia Pacific Parliamentary Forum. 17th Annual Meeting of The Asia-Pacific Parliamentary Forum (APPF). Vientiane Capital, Lao PDR, 11–15 January 2009. Available online: http://www.na.gov.la/files/appf17/population.html (accessed on 29 June 2020).
- Population, C. Lao People’s Democratic Republic. Available online: http://www.citypopulation.de/en/laos/cities/ (accessed on 8 June 2020).


| Satellite | Sensor | Resolution (m) | Path/Row | Acquisition Date | Season | Cloud Cover (%) |
|---|---|---|---|---|---|---|
| Landsat5 | TM | 30 × 30 | 128/47, 128/48 | 11 Mar 1995 | Dry | 14 |
| Landsat5 | TM | 30 × 30 | 128/47, 128/48 | 16 Feb 2004 | Dry | 6 |
| Landsat8 | OLI-TIRS | 30 × 30 | 128/47, 128/48 | 13 Apr 2013 | Dry | 5.24 |
| Landsat8 | OLI-TIRS | 30 × 30 | 128/47, 128/48 | 10 Mar 2018 | Dry | 12.12 |
| Advanced Spaceborne Thermal Emission and Reflection Radiometer digital elevation model (ASTER DEM) with 30 m spatial resolution was obtained with the same coordinate system as the satellite images. | ||||||
| Google Earth with the 15 m resolution was required for image comparison. | ||||||
| Shapefiles of streets in Vientiane were obtained from OpenStreetMap. | ||||||
| Land Use and Cover Class | Description |
|---|---|
| Water Bodies (WB) | Reservoirs, fish ponds, or drainages. |
| Built-up Land (BUL) | Construction land, including land for marketable services, industry, warehouse, residences, public administration, public services, and transportation (buildings, houses, factories, and roads) [35]. |
| Intact Forest (IF) | Untapped forests not disturbed by human activity [36], high biodiversity and vegetation cover over 70% in the area, and trees higher than 10 m [37]. |
| Degraded Forest (DF) | Forest that has been destroyed by human activity over a long time, resulting in a lack of biodiversity, loss of species, and vegetation cover of 10–15% [38,39]. |
| Agricultural Land (AL) | Land used for cultivation, including rice paddy, garden land, rubber plantation, and grassland. |
| Bare Land (BL) | Beach, rock, and other empty lands. |
| LU Class | Producers Accuracy (%) | Users Accuracy (%) | Kappa Class | Overall Accuracy (%) | Overall Kappa Statistic | |||||
|---|---|---|---|---|---|---|---|---|---|---|
| 1995 | 2004 | 1995 | 2004 | 1995 | 2004 | 1995 | 2004 | 1995 | 2004 | |
| WB | 100 | 100 | 100 | 94.44 | 1 | 0.93 | ||||
| BUL | 100 | 100 | 94.44 | 94.44 | 0.93 | 0.93 | ||||
| IF | 88.89 | 90 | 88.89 | 100 | 0.86 | 1 | 0.91 | 0.91 | ||
| DF | 78.95 | 82.35 | 83.33 | 77.78 | 0.80 | 0.74 | 92.59 | 92.59 | ||
| AL | 89.47 | 84.21 | 94.44 | 88.89 | 0.93 | 0.86 | ||||
| BL | 100 | 100 | 94.44 | 100 | 0.93 | 1 | ||||
| LU Class | Producers Accuracy (%) | Users Accuracy (%) | Kappa Class | Overall Accuracy (%) | Overall Kappa Statistic | |||||
|---|---|---|---|---|---|---|---|---|---|---|
| 2013 | 2018 | 2013 | 2018 | 2013 | 2018 | 2013 | 2018 | 2013 | 2018 | |
| WB | 100 | 100 | 94.44 | 100 | 0.93 | 1 | ||||
| BUL | 93.75 | 94.12 | 83.33 | 88.89 | 0.80 | 0.86 | ||||
| IF | 89.47 | 93.33 | 94.44 | 77.78 | 0.93 | 0.74 | 87.04 | 91.67 | 0.84 | 0.9 |
| DF | 82.35 | 80.95 | 77.78 | 94.44 | 0.73 | 0.93 | ||||
| AL | 65.23 | 85 | 83.33 | 94.44 | 0.78 | 0.93 | ||||
| BL | 100 | 100 | 88.89 | 94.44 | 0.87 | 0.93 | ||||
| LU Types | 1995 | 2004 | 2013 | 2018 | ||||
|---|---|---|---|---|---|---|---|---|
| AREA (%) | AREA (%) | AREA (%) | Area (%) | |||||
| W | 98.40 | 2.68 | 105.09 | 2.87 | 119.98 | 3.28 | 140.72 | 3.84 |
| BUL | 101.60 | 2.77 | 213.54 | 5.83 | 240.38 | 6.56 | 266.00 | 7.26 |
| IF | 2339.56 | 63.83 | 1794.19 | 48.96 | 1838.31 | 50.20 | 1445.44 | 39.47 |
| DF | 260.36 | 7.10 | 664.92 | 18.14 | 428.94 | 11.71 | 676.14 | 18.46 |
| AL | 811.40 | 22.14 | 843.87 | 23.03 | 1013.42 | 27.67 | 1137.04 | 31.05 |
| BL | 53.77 | 1.47 | 43.33 | 1.18 | 21.22 | 0.58 | 16.93 | 0.46 |
| Total | 3665.09 | 100 | 3665.09 | 100 | 3665.09 | 100 | 3665.09 | 100 |
| LU Types | 1995–2004 | 2004–2013 | 2013–2018 | |||
|---|---|---|---|---|---|---|
| Area (%) | Area (%) | Area (%) | ||||
| WB | 6.69 | 7 | 14.89 | 14 | 20.74 | 17 |
| BUL | 111.94 | 110 | 26.84 | 13 | 25.62 | 11 |
| IF | −545.37 | −23 | 44.12 | 2 | −392.87 | −21 |
| DF | 404.56 | 155 | −235.98 | −35 | 247.20 | 58 |
| AL | 32.48 | 4 | 169.55 | 20 | 123.62 | 12 |
| BL | −10.44 | −19 | −22.11 | −51 | −4.29 | −20 |
| LU Types | WB | BUL | IF | DF | AL | BL | Total 2004 |
|---|---|---|---|---|---|---|---|
| WB | 79.70 | 1.06 | 5.5 | 4.11 | 1.72 | 4.48 | 96 |
| BUL | 0.83 | 14.83 | 49.4 | 19.05 | 32.94 | 0.73 | 117.86 |
| IF | 2.66 | 12.70 | 1733.9 | 49.79 | 76.14 | 0.91 | 1876.20 |
| DF | 2.61 | 22.73 | 458.6 | 101.42 | 193.5 | 2.96 | 781.80 |
| AL | 1.95 | 24.14 | 215.3 | 106.01 | 409.3 | 3.13 | 759.82 |
| BL | 4.27 | 0.60 | 2.22 | 8.62 | 2.08 | 13.6 | 31.36 |
| Total 1995 | 92.04 | 76.06 | 2465.3 | 288.99 | 715.6 | 25.8 | 3665.09 |
| LU Types | WB | BUL | IF | DF | AL | BL | Total 2018 |
|---|---|---|---|---|---|---|---|
| WB | 100.6 | 2.28 | 17.06 | 6.71 | 8.56 | 4.76 | 140.1 |
| BUL | 1.92 | 60.23 | 59.46 | 35.92 | 87.19 | 1.25 | 245.97 |
| IF | 2.75 | 7.50 | 1245.5 | 99.33 | 84.96 | 0.76 | 1440.90 |
| DF | 3.42 | 38.80 | 342.25 | 107.6 | 178.20 | 5.72 | 676.09 |
| AL | 2.62 | 48.09 | 289.00 | 215.7 | 585.25 | 0.63 | 1141.31 |
| BL | 1.08 | 0.27 | 3.60 | 3.16 | 1.45 | 7.37 | 16.92 |
| Total 2013 | 112.43 | 157.18 | 1956.96 | 468.52 | 945.60 | 20.50 | 3665.09 |
| Indicators | Predicted |
|---|---|
| 0.8873 | |
| 0.8782 | |
| 0.8782 | |
| 0.8430 |
| LU Types | Actual Area | Predicted Area | Area Difference | Percentage Difference (%) |
|---|---|---|---|---|
| WB | 140.72 | 121.13 | −19.59 | −13.92 |
| BUL | 246.00 | 265.21 | 19.22 | 7.81 |
| IF | 1445.44 | 1676.59 | 231.15 | 15.99 |
| DF | 676.14 | 569.72 | −106.42 | −15.74 |
| AL | 1137.04 | 1015.28 | −121.76 | −10.71 |
| BL | 16.93 | 19.78 | 2.85 | 16.86 |
| LU Types | 2030 | 2040 | 2050 | |||
|---|---|---|---|---|---|---|
| Area (km2) | % Composition | Area (km2) | % Composition | Area (km2) | % Composition | |
| WB | 111.13 | 3.03 | 111.13 | 3.03 | 111.13 | 3.03 |
| BUL | 457.41 | 12.48 | 533.71 | 14.56 | 689.44 | 18.81 |
| IF | 1761.04 | 48.05 | 1764.95 | 48.16 | 1717.24 | 46.85 |
| DF | 429.00 | 11.70 | 421.64 | 11.50 | 413.31 | 11.28 |
| AL | 879.63 | 24.00 | 806.73 | 22.01 | 706.98 | 19.29 |
| BL | 19.50 | 0.53 | 19.55 | 0.53 | 19.62 | 0.54 |
| Total | 3665.09 | 100.00 | 3665.09 | 100.00 | 3665.09 | 100.00 |
© 2020 by the authors. Licensee MDPI, Basel, Switzerland. This article is an open access article distributed under the terms and conditions of the Creative Commons Attribution (CC BY) license (http://creativecommons.org/licenses/by/4.0/).
Share and Cite
Faichia, C.; Tong, Z.; Zhang, J.; Liu, X.; Kazuva, E.; Ullah, K.; Al-Shaibah, B. Using RS Data-Based CA–Markov Model for Dynamic Simulation of Historical and Future LUCC in Vientiane, Laos. Sustainability 2020, 12, 8410. https://doi.org/10.3390/su12208410
Faichia C, Tong Z, Zhang J, Liu X, Kazuva E, Ullah K, Al-Shaibah B. Using RS Data-Based CA–Markov Model for Dynamic Simulation of Historical and Future LUCC in Vientiane, Laos. Sustainability. 2020; 12(20):8410. https://doi.org/10.3390/su12208410
Chicago/Turabian StyleFaichia, Cheechouyang, Zhijun Tong, Jiquan Zhang, Xingpeng Liu, Emmanuel Kazuva, Kashif Ullah, and Bazel Al-Shaibah. 2020. "Using RS Data-Based CA–Markov Model for Dynamic Simulation of Historical and Future LUCC in Vientiane, Laos" Sustainability 12, no. 20: 8410. https://doi.org/10.3390/su12208410
APA StyleFaichia, C., Tong, Z., Zhang, J., Liu, X., Kazuva, E., Ullah, K., & Al-Shaibah, B. (2020). Using RS Data-Based CA–Markov Model for Dynamic Simulation of Historical and Future LUCC in Vientiane, Laos. Sustainability, 12(20), 8410. https://doi.org/10.3390/su12208410