1. Introduction
Innovative information and communication technologies (ICT) for transport sector provides new perspectives for the integration of intelligent transport systems and are forwarded for the improvement of traffic safety and reduction the injuries on the roads [
1,
2,
3,
4]. The objectives of the Sustainable Development Agenda until the 2030 years raise new challenges for the transport sector (SDA’2030) by including the innovative infrastructure for transportation and mobility support [
5].
Our scope of discourse is related to the development of the intelligence-based software components and hardware equipment applicable for service provision in cargo transportation. The development of such service infrastructure is based on the infrastructure of the management processes of transportation with all complexity of information systems (IS), which are implemented on the base of wireless communication networks (WCNs). Wireless technology became more and more important in intelligent transportation [
2,
6]. The possibilities of intelligent transport for enabling the improvement of the level of travel safety and comfort became more prominent in transportation. Currently, one of the most attentions attracting mobile communication technology is vehicular wireless communication networks by offering the potential to develop and produce safer, more reliable, economical, and comfortable vehicles.
These WCNs are gaining more and more commercial relevance, since the adoption of some standards, such as the DSRC (Dedicated Short-Range Communication) and standard Institute of Electrical and Electronics Engineers (IEEE) 802.11p provided by Institute of Electrical and Electronics Engineers (IEEE) are supported by wireless access in vehicular environments (WAVE) [
7,
8,
9]. Such standards and other ICT means give the possibility to reach an entirely new level of services in a vehicle, covering many areas of sustainable transport development, including road safety, traffic management, and comfort applications [
10,
11,
12,
13].
Practices of vehicular communication network’s deployment, research, and scientific projects are developing in two directions: direct vehicle-to-vehicle (V2V) communication and vehicle-to-infrastructure (V2I) communication [
4,
14]. Research studies in these areas address many complex communication problems as there are many specific determinants of the quality of communication.
The problems which influence the formulation of our research objectives arouse such questions for our work:
How to improve highly dynamic traffic of vehicles and help in operative management of cargo transportation;
How to support right communication conditions under unsuspected events and disturbances of WCN, for example, enabling the communication under the conditions of frequent disconnections of nodes;
How to integrate into the common infrastructure the heterogeneity of data transmission links.
This research study aim is to develop an approach for evaluation of cargo transportation needs for smart service support under the conditions of operative management, by implementing the functionality of the wireless networks and by enabling the requirements of sustainable development.
By developing such an approach, the methodology has to be developed and we assume that structured form of stages of such methodology can help in the assessment process of all participating components of infrastructure for operative cargo transportation management.
This research is related with results of some studies presented in previous works [
2,
6,
15,
16] in which we analyse the infrastructure of V2V communication and present the results of the multi-componential service provision for the cooperative vehicular networks. The issues of this area are related to the technology of the Internet of Things (IoT) [
3], which can work under conditions of wireless communication, by implementing the highest mobile technology of 4G (fourth generation) and 5G (fifth generation) protocols, and the functionalities of global positioning system (GPS), geographical information systems (GIS) and the analysis of big data warehouses [
13]. However, the more in-depth description of such technological functions goes beyond the scope of the problems we examine, and thus our study has such limitations. Additionally, we are restricted our consideration on the area of the landscape transportation of cargo (freights) by roads, with the possibilities for the more extensional consideration of such processes under conditions of multi-modal transportation in future. The study does not cover at this stage the optimisation of traffic questions. These questions will be analysed in further studies.
As the main result, we develop the classification structure of smart services which are provided for management of cargo transportation processes in nowadays transportation situation. This assumption is used to classify services that help to reveal the most important drivers and to assess the needs of such intelligent services in limiting unimportant information flows, where a large number of service components are realised in a dynamically changing transport network topology. The results obtained allow us to assume that the method we present can help to manage transport more sustainably in a way that requires a higher percentage of automated information flows in all parts of the organisation without the necessary driver effort. The complex processes, including other sustainable management requirements such as paperless solutions, are implemented in all areas that are changing in the infrastructure of interoperable interconnected information systems. Results are obtained by developing some types of conceptual models and demonstrate the assessment possibilities of wireless service provision capacities in complex and dynamic cargo transportation management under nowadays equipped transport conditions on roads.
The paper is organised as follows. In
Section 2, authors briefly present the multi-layered methodology of assessment of heterogeneous services provided for the transportation of cargo by roads concerning other works in the literature concerning intelligent transport development possibilities. In
Section 3, authors analyse the knowledge representation aspects related to the infrastructure of road topology for vehicular communication networks and the architecture of multi-component smart service provision. In
Section 4, the spectrum of heterogeneous services and the communication of information is presented. In
Section 5, the integration of heterogeneous service infrastructure for the management of cargo transportation processes by roads and process monitoring are analysed and described. The conclusions and prospects for future research are presented at the end of the paper in the Discussion and Conclusion parts.
2. The Methodology for Assessment of Heterogeneous Services Provision for Sustainable Cargo Transportation
The assessment of heterogeneous service provision under the requirements of sustainability is related with the understanding of the complexity and the dynamicity.
Such assessment requires expression of the needs and possibilities of the provision of multi-componential services, which have heterogeneity properties of service provision capabilities, including the different supporting communication links and differentiation of senses of provided services. The framework of methodology for the assessment of services for sustainable cargo transportation includes some layers of structure of assessment of provision capabilities (
Table 1). The methods are related to comparative analysis and statistical data analysis of proposed in literature results by enabling the evaluation of needs for supporting the functionality of complex landscape transportation of cargo (freights) by roads.
All parts of consideration aspects of analysis have horizontal relation with the sustainable requirements of the cargo transportation process. In particular, they are enabling more safety transport by roads, paper-less management, comfortable transportation for drivers, more optimal traffic development requiring the minimisation of pollution in more settlement areas of cities and towns, etc.
Vehicles have good power consumption support systems, and therefore, can be easily equipped with powerful computing devices, wireless transmitters, sensors, complex systems—GPS, photo and video cameras, vibration, acoustic, chemical sensors, etc. [
9,
17].
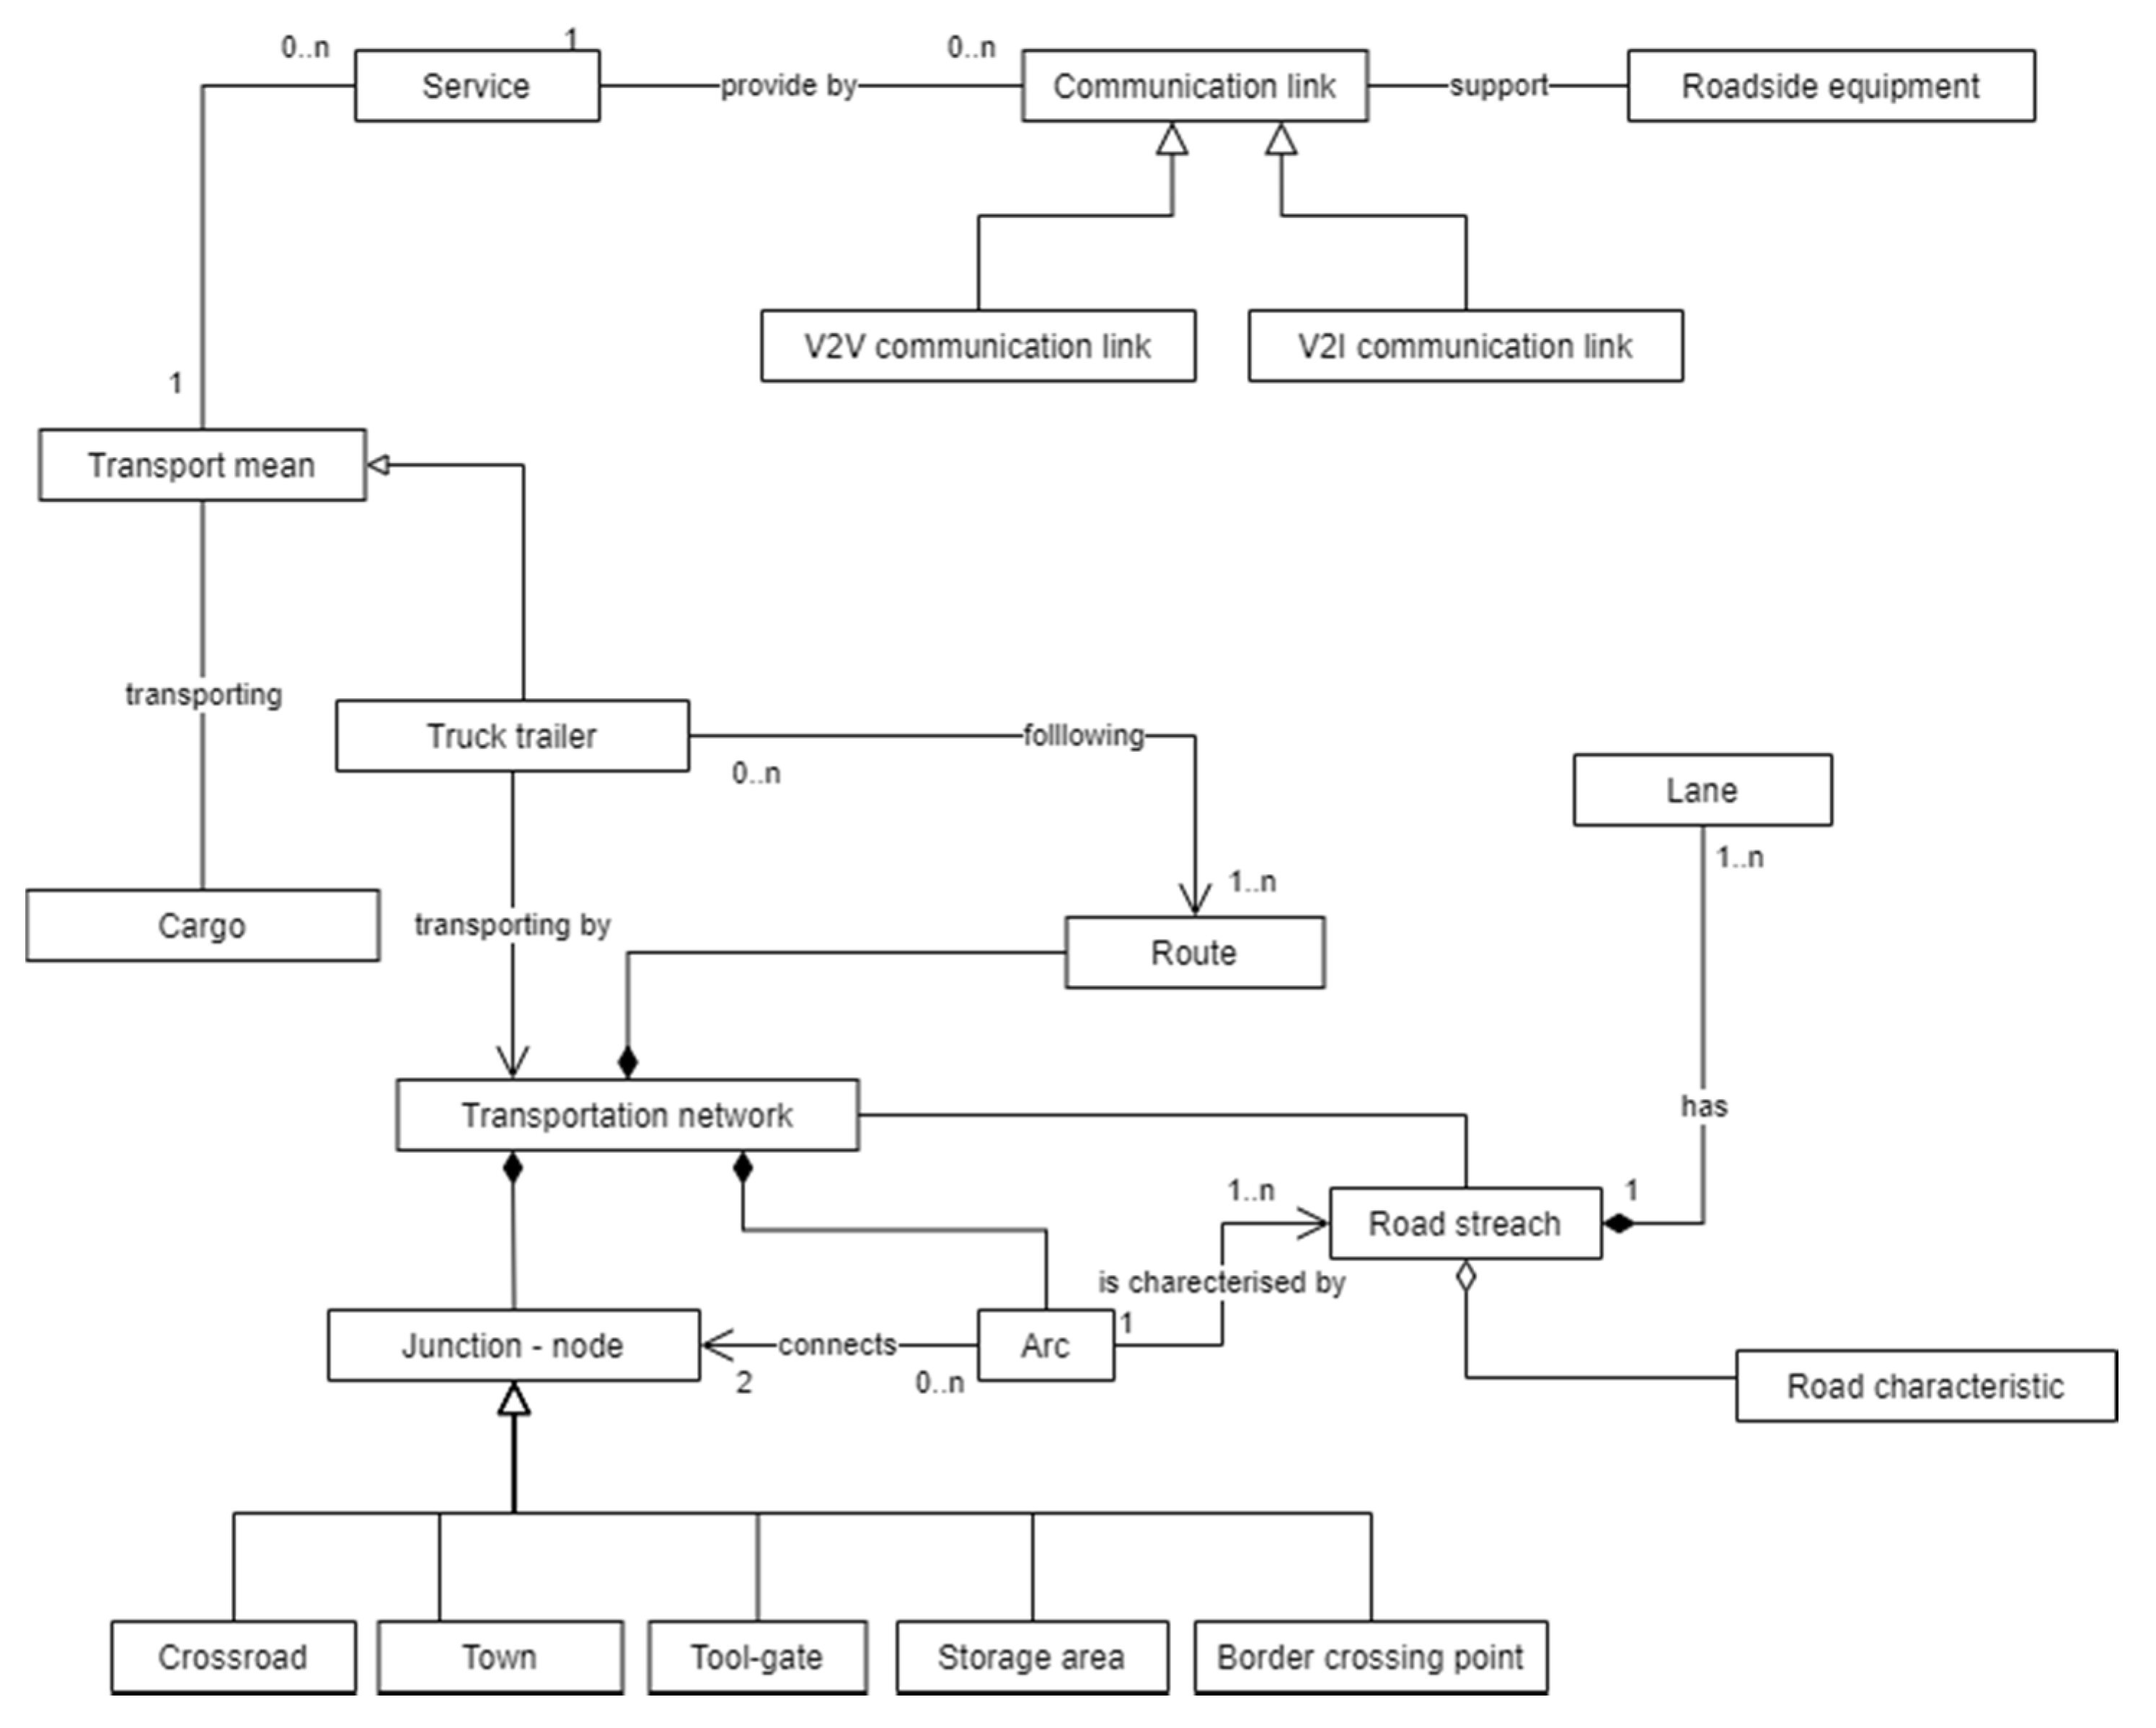
The assessment of supporting facilities and infrastructure for the provision of electronic services (e-services) is analysed on the first layer of the methodology. It is based on the evaluation of infrastructure of IS and DW, computer-based flows of e-documents by supporting managerial and administrative processes of cargo transportation and logistics processes. Such a layer can be named as the information infrastructure support layer. The structure of the knowledge base by using the object-oriented design methodology and implementing the notations of Unified Modelling Language (UML) for developing the structure of computer-based ontology of the analysed service provision infrastructure is developed. The example of implementation of the notation of the object class diagram of UML for the description of transport networks and transportation process without more detailed representation of attributes of classes is presented in
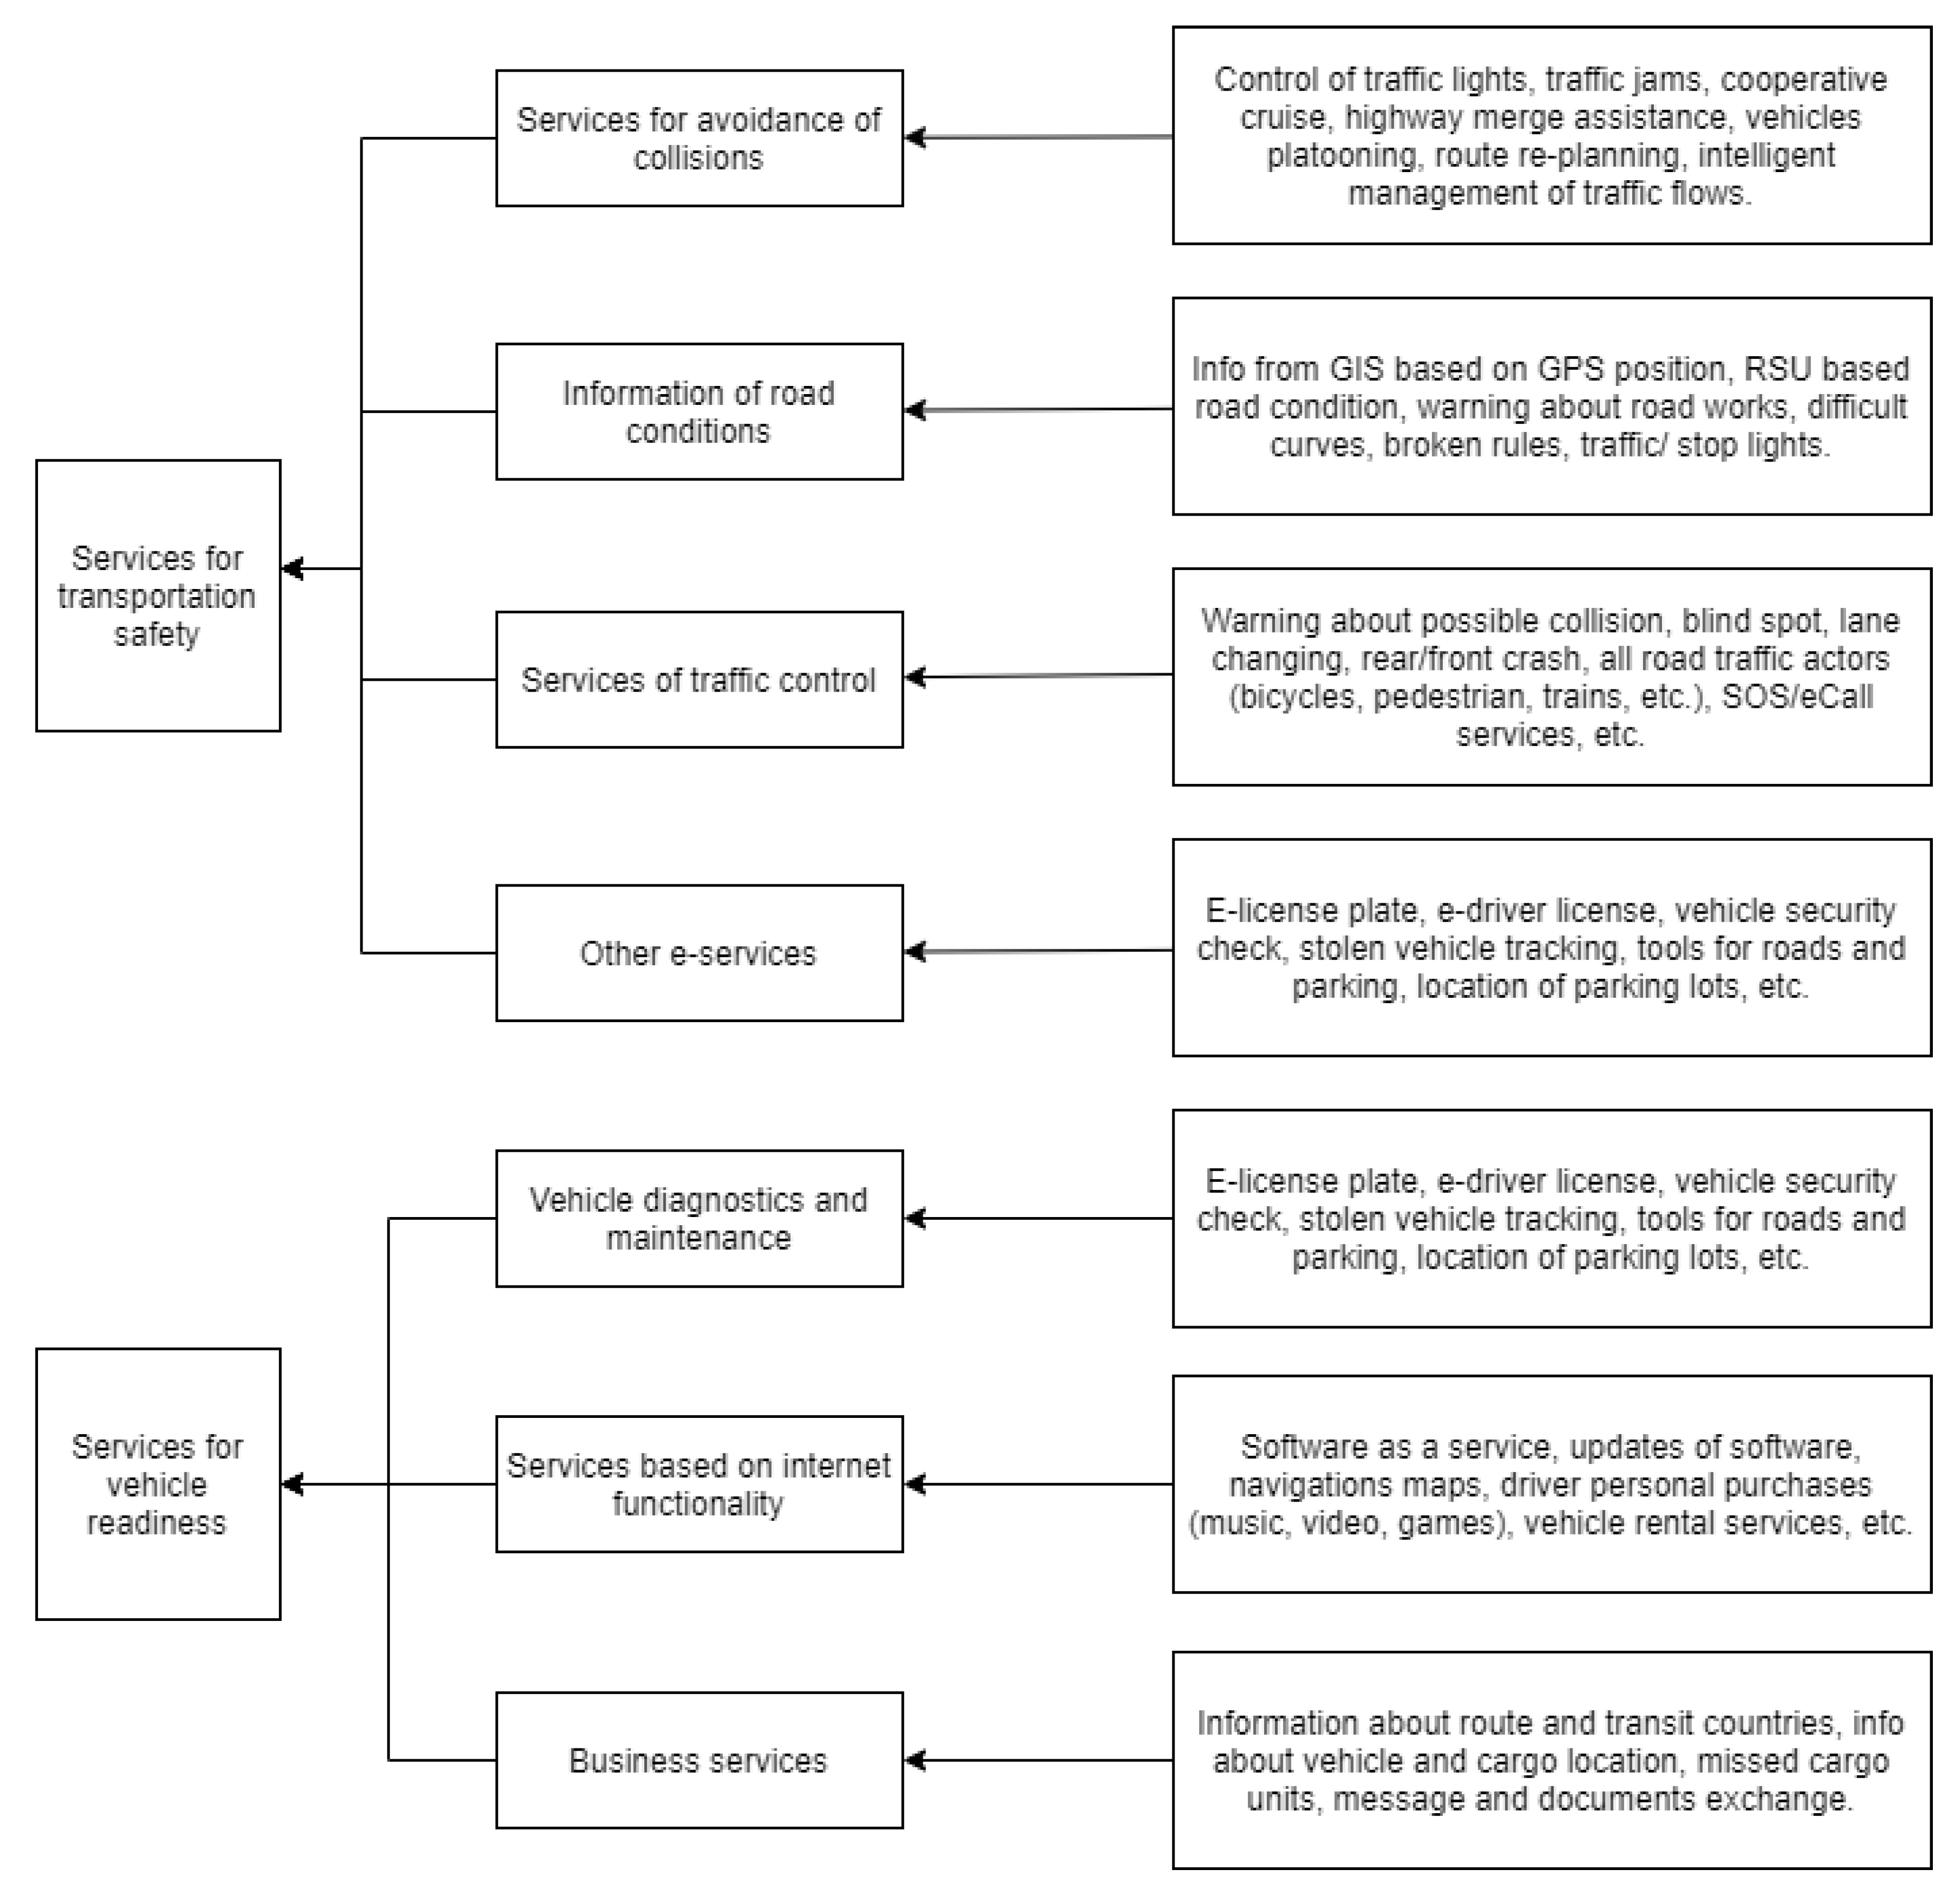
Figure 1. On this layer of consideration, as a result, the classification of services is provided (
Figure 2).
The assessment of possibilities of the communication networks and techniques, like wireless, mobile networks with supporting functionalities of implementing different ICT functions became another the second layer of our consideration of the multi-layered methodology. The aspects of data-transfer capabilities for supporting heterogeneous services within vehicular networks [
3,
8,
17], and different vehicle to vehicle (V2V) and vehicle to infrastructure (V2I) communication links with the implementation of different kinds of standardised protocols and not standardised prototype systems are analysed here.
The third layer of the methodology is dedicated to the processes and the application of e-documents in freight transportation.
The analysis of the performance of the Dedicated Short Range Communication (DSRC) is described by Fallah, Huang, Sengupta, and Krishnan (2011) [
18]. DSRC is based on wireless network infrastructure provided for vehicle networks so named as DSRC-VANETs and devoted for delivering of messages in Cooperative Vehicle Safety Systems (CVSS), which are giving message transferring mechanism [
18]. Here a network performance measure is defined, which can be used as the indicator for the success of CVSS tracking application. Such research study provides an approach and shows the possibilities of how controllable parameters (such as rate and range of transmission) affect these performance measures. Authors revealed some interesting properties of Inter-Domain Routing (IDR). It is shown that robust control of rate or range of transmission based on the relationship between IDR and channel occupancy is possible. Based on these concepts, a robust range control method is analysed and evaluated.
Another performance evaluation of information propagation in a vehicular ad-hoc network was described by Wang, Hu, and Zhang in 2012 [
19,
20]. The authors’ studies packet loss rate expected transmission distance and an adequate coverage range of a roadside station. They state that communication performances are similar under three distributions in most cases where negative-exponential distribution shows the worst performance. It can be assumed that under negative-exponential distribution, the randomness of space headway is secure; this will break down the connectivity of the communication chain.
One part of our approach is related to the classification of provided services for cargo drivers by trying to provide methods for more adaptable service provision, and results are presented in the next sections.
3. Requirements for Infrastructure of Service Provision for Cargo Transportation Processes
Based on wireless networks, the vehicular communication networks can be formed spontaneously between the moving of transport means (as moving nodes) equipped with the homogeneous or heterogeneous wireless interfaces. These interfaces can use different means, for example, protocol 802.11a/b/g/n/p, World-wide interoperability for Mobile access (WiMax) influencing by newest generation mobile telephone systems (here can be mentioned 3G, 4G, 5G range protocols of mobile services), Long Term Evolution (LTE), and other service support functions [
7]. Some functionality of wireless networks also is known as the Vehicular Ad-Hoc Network (VANET) are one type of the mobile ad-hoc network (MANET) applications, allowing communication between the nearby vehicles and vehicles and stationary equipment (roadside units). Following [
15], the areas of vehicular communication applications can be divided into four main categories:
General information—multimedia services;
Road safety and traffic monitoring services;
Management services;
Vehicle engine monitoring information.
The class diagram of the main components of the computer-based ontology of cargo transportation process with assessing infrastructure elements is developed by using UML notation and presented in
Figure 1. In this structure, we have analysed the road that can be divided into road stretches, which have different characteristics. The road stretch can be represented in more detailing style by characterising each parameter (i.e., road ID, road type, number of driving lines, connecting stationary nodes (inter-cross points, crossroads, etc.), traffic rules, etc.). Risk is related to scenarios of accident events, influenced by types of transporting dangerous goods, and types of surroundings.
The approaches of multiple complex descriptions of scenarios affect the classification them by types and can be based on the ontology of this phenomenon. The transportation network can be considered as the graph structure with a few junctions (nodes) linked one to another by several arcs (
Figure 1).
Two categories of nodes for the representation of the transportation networks are described in our developing computer-based ontology. The moving nodes are used for the description of the moving transport means. However, stationary nodes will be implemented for the representation of junctions, crossroads, towns, storage areas, tool-gates, border crossing points, etc. Such stationary nodes can change the time of transportation traffics, influence delays in the network. Two junctions are connected by the arc and are characterised by the number of road stretches and the number of fatalities.
The density of providing services in different regions of roads for different scenarios was analysed. There the communication between the sender and the recipient moving in the opposite directions was made. For an illustration of different parts of roads of various types, we can approximately provide the evaluation of frequency in service delivery (
Table 2).
Communication networks V2V and V2I have specific characteristics and properties that distinguish them from other types of networks. According to [
7,
10], the following unique features were summarised:
Compared with conventional mobile devices, vehicles must have much higher energy reserves. Energy is supplied from rechargeable battery diesel, gasoline, and alternative-fuel motor.
As vehicles are more massive and more extensive compared to traditional wireless devices, and therefore can support much greater and heavier computing, radio, and sensor components.
Computers can be bigger, faster, and provide very high-capacity memory devices (terabytes of data), and powerful wireless interfaces, capable of high-speed communication.
The conditions of transportation can vary in a large spectrum. The vehicles can move from more slowly until very high speed (160 km/h or more), making it difficult to maintain consistency in coherent V2V communication. However, the existing statistical data on vehicle movements, such as the movement together according to specific patterns or peak time, can help to maintain a link between the mobile automotive groups [
21,
22,
23].
Vehicle at any time may be out of communication coverage (wireless fidelity (abbreviated as Wi-Fi), cellular, satellite, etc.), so the network protocols must be designed so that it can easily connect to the Internet, in normal mode. Despite the many positive, unique features, vehicular network’s development is faced with specific challenges, as their primary:
Vehicular communication networks, in principle, can extend across the road network and cover a considerable amount of network equipment (dynamically accessible for vehicles).
The networks are operating in an extremely dynamic environment. In some cases, it may be highly different, for example, in highway speeds can reach up to 300 km/h, in the low-density roads it may be as only about 1–2 transport means per km. On the other hand, the speed of vehicles in urban areas is 50–60 km/h, and the traffic density is relatively high, particularly during the peak periods. Often vehicular communication networks may be fragmented.
The dynamic nature of traffic can lead to large gaps between road traffic actors in sparsely populated areas; it can also be created a few isolated clusters of network nodes. Vehicular communication networks’ scenarios are highly different from the classic ad-hoc networks since the road traffic actors are moving and constantly changing positions, scenarios are highly dynamic. Furthermore, the network topology changes extremely frequently since the persistent connections and disconnects between network nodes. The degree to which the network is combined depends on two factors: distance among the wireless nodes and the number of connected vehicles [
8].
4. Spectrum of Heterogenous Services for Transport Means and the Communication of Information
Service provision for vehicles by using VANET vary in a broad spectrum. By summarising types of services provided in works [
10,
24,
25,
26,
27], we would like to give the classification structure of services in
Figure 2.
In
Figure 2, we have used some standard abbreviations: GIS—Geographic information system, GPS—Global positioning system, RSU—Response Support Unit/Reunification Services Unit.
Services can be divided into two main classes: for transport safety and vehicle readiness for cargo transportation. For supporting high-quality services, some parameters are essential and have considered by evaluating such data as the rate, packet delivery efficiency and collision rate. The analysis shows systematic data quality requirements for different services for vehicle communication networks (
Figure 2) based on the data presented in several studies [
1,
11,
12].
Safety measures improve the protection of drivers by sending and receiving information related to vehicle safety.
Typically, these alerts are generated by GIS, video cameras, and sensors, such as collision alert, lane departure alert, emergency video streaming, and incident management received by the automatic active safety system or reported to drivers by GPS [
28].
The vehicle readiness category is related to freight applications. It aims to improve vehicle availability for cargo carriage, increase drivers and heavers comfort level (make the journey more pleasant) and enhance cargo routing efficiency level.
Information flow is modelled to cover internal and external needs and separated into network-related components (1–2) and carriage-related element (3):
The information flows in the context of traffic jumps;
The information flows in the context of accidents;
The information flows in the context of tracking.
Information about network conditions, vehicle parking and another status is collected by exchanging messages in real-time and could include various identifiers:
The licence plate of cargo vehicle—registration numbers of vehicle visible for everyone, could be removable or transferable,
VIN—identification of the vehicle, i.e., 17-digit numbers stamped on various parts of the vehicle during production, which remains on vehicle from production to the end,
Cargo identification—unique identification of consignment transported by carrier on behalf of the customer, usually referring to the global shipment identification number,
Route code—unique identification number of the route.
Below it is a detailed presentation of separate components of information flow. These identifications will be used to access particular data.
4.1. The Information Flows for the Context of Traffic Jumps
The modern traffic management and guidance systems are always networked in requirements of the high-volume, real-time, traffic data with greater spatial and temporal resolutions that the challenge for traditional traffic monitoring technologies [
29]. For this structure support, some critical hardware equipment’s are implemented, such as inductive loops, video cameras, radars, infrared detectors, satellite images and GPS. The traffic light control at the city intersections can be modelled using the representation of the multi-optimisation problem. There are several examples of the urban traffic management system (UTCS) such as Real-Time Hierarchical Optimized Distributed Effective System (REHODES), as well as Split Cycle Offset Optimization Technique (SCOOT), or Sydney Coordinated Adaptive Traffic System (SCATS), etc., which always use a single loop or double loop’s sensors as a vehicle detector deployed in the front of signalled intersections.
This information is collected to ensure the most efficient traffic. Standard traffic lights change the lights at specific intervals. The time between signal changes is often adjusted according to a pre-programmed time of day (usually peak hours) or when vehicles pass sensors on the road. With cameras and sensors installed, traffic lights can determine if a vehicle is waiting and how many of them are waiting in each lane. Using this information, they can calculate how long it will take to clean each side of the street. These signals can be transferred to other nearby smart signals or connect to the network as a signal network, working together to increase traffic efficiency. Usually, such traffic management strategies and optimisation goals include the strategy and operative management of vehicle’s stopping, average delay, driving time accounts. The monitoring data are represented in big data warehouses by recording in time and geographical position recognition such data of obtaining queue lengths, traffic intensities, vehicle speeds, and even emissions.
The geography of transportation network studies focusses on the typology of the networks. The studies begin in the 1960s, but still, they are failing to present mechanisms of how networks are formed and grow. Optimisation studies are evident from around 1970. The models are oriented to minimise their building costs, network maintenance, and changes in transportation flows. The models solving minimum costs problem are dedicated to finding the cheapest way (minimal costs) for the delivery of freight amount through the transportation network. In particular, optimisation models consider current and forecasted flows. Network models have a unique methodological background and many practical applications. The specific models are created for shared networks. Non-cooperative behaviour of users, when users select route between origin and destination points, which is minimising their freight transportation costs, but do not meet reduction of total costs in the network and result to the increase of traffic.
The move of traffic is more complex in urban areas. Change of traffic includes transportation through streets and intersection. Congestion appears if traffic density is extremely high, and its speed is exceptionally low—the flow reaches the maximum traffic flow. The speed of the stream is at the minimum possible speed. Standard traffic flow analysis started with static single-period models [
30]. The static one-period model is used by authors to estimate the costs of congestions. Later, it was clear that the static model does not capture congestions in time-period. As congestions vary across time, it is actually used to revise traffic patterns in period frame. During modelling, traffic schedule is created for period and location. Additionally, delivery uncertainty could be modelled in time frame models. Some authors search for potential options to reduce congestion or pollution caused by traffic.
Finally, it is necessary to state that the collected data of traffic flow is used for analysis, which includes optimisation models. The gathered results after setup of optimisation models are used for traffic light control, which helps to minimise traffic jump.
4.2. The Information Flows and Modelling for the Context of Accidents
Recent studies present the behavioural models, in which vehicle driver selects the optimal speed to avoid accident cases. There are networks where costs are not considered but just the maximum traffic flow. Of course, studies have not yet proven the optimal design of a transportation network configuration for various time-periods. There are empirical researches that investigated the main reason for the variability in travel time in the occurrence of accidents, including major accidents, which block traffic lanes for long periods and several minor incidents such as vehicle failure and other factors [
31]. Such analysis describes the lost time that happened due to such accidents on roads.
There are on-going discussions about how to report accidents. Automatically detected traffic accidents using accelerometers could be reported to the central server immediately after the crash event using GPS coordinates. Along with the data, the vehicle number is reported as well. The following messages are created after traffic accidents are detected through the arm (ARM) controller. In such cases, ARM7 controller, accelerometer (sensor used for accident detection), Global System for Mobile (GSM) communications, and GPS are used to provide information about the situation. By using accident detection and messaging systems in the vehicle, it is possible to reduce response time. However, such systems are not available in all truck due to being expensive. In case of installation, the system “On Star” for accident detection and communication is widely used.
Other studies are oriented to identification of risky locations in the network. For such cases, the critical issue is data gathering and the identification of locations. In many cases reported messages in social media are not always linked with GPS coordinates of accident locations. Some of this data is available from traffic cameras and/or traffic monitoring devices. The new data collection methods involve satellite images collected from Google Map API (Application Programming Interface) after the messages on social media appear with the identified street section which is blocked because of the accident [
32].
The third type of studies focuses on accident removal time. These investigations extend the first type of studies and add information on accident detection and communication, and analyse traffic light control options. Authors propose the control traffic signals automatically by taking the Radio Frequency (RF) module, which indicates when an emergency vehicle is arriving at crossroad signal lights (closer than 100 m [
33]) and when it is approaching to help the actors of an accident. Such a system decreases the time of road block.
4.3. The Information Flows and Modelling for the Context of Tracking
The status of cargo delivery is especially important for the receiver. It also shows efficient use of resources. There are several possibilities: (a) tracking the road vehicle and (b) tracking the cargo.
The investigations in literature are dedicated to various types of tracking means. For vehicle tracking, most of the authors discuss aspects linked with GPS tracking and less of the present options of radio frequency identification (RFID) identification. These authors present RFID data cleaning, stored RFID data compression, RFID event detection, cluster analysis of RFID data, and model of frequent data extraction. By using RFID and sensing technologies, the status of road and bridge infrastructure is identified by traffic characteristics and can predict the state of the road in real-time information. The most excellent value of tracking is the ability to extract useful vehicle information and information processed efficiently to resolve the road congestion problem [
34].
4.3.1. Tracking the Road Vehicle
The critical aspect of freight transportation is truck tracking, which consists of key elements:
Data Identifier,
Standards,
Marking forms.
The Global Individual Asset Identifier (GIAI) and the automatic identification (AI) (8004) format is used for assets that are not consumed by business. GIAI is a unique code, which cannot be reused for any other fixed assets of a cargo company. The application of Data Identifier helps automatically track assets from acquisition until retirement, and make updates on assets, monitor their repair and maintenance activities. It is possible to install Data Identifier during the asset production process on the name of producer or customer and to represent unique asset world-wide.
The vehicle identification number (VIN) can be integrated into the GIAI as a reference to a specific transport unit in the GIAI identifier structure. VIN consists of 17 symbols, where three first symbols are dedicated to the World Manufacturer Identification (WMI).
There are two GIAI standards, which are created by a not-for-profit organisation named as GS1, for communication, are widely used for reporting purposes.
The GIAI-96 standard’s partition value (P) has several alternatives, which means the exact number of digits and bits. The alternative (P = 2) includes company prefix (maximum ten symbols), which is provided for entity managing asset and reference to the individual asset (14 numbers). The first digits of company prefix could include zero values, which are added during the decoding procedure, which are necessary to have a length (L) equal to symbols (as defined in
Table 3).
However, GIAI-202 has reference to individual asset up to 24 symbols; but there is no need to fill all 24 digits. According to GIAI-96, VIN could be reported under Partition Value (P), which ranges from 2 to 6. In the case of GIAI-202, VIN could be presented under any Partition Value.
GIAI marking could be realised in Radio frequency identification (RFID) tags; such is widely used in Finland and Sweden. Asset tracking typically starts at the beginning of the production line then RFID tag is inserted into the vehicle and can thus be tracked both in the production hall, when from it gradually becomes a final product. After delivery to a customer, then the RFID tag on the truck is scanned when passing the readers until it arrives at the destination place.
For tracking assets, it is recommended to refer to time intervals to get an actual history of transport mean.
Various tags could be used for the vehicle’s tracking purpose. The best suits RFID passive tags, i.e., Electronic product code (EPC) Generation (Gen) 2 version 2, which is incorporated into standard provided by International Organization for Standardization/International Electrotechnical Commission (ISO/ IEC) ISO/ IEC 18000-63 and is used as a write-once tag. The comparison of tags is presented in
Table 4.
For freight transport, the approach of the passive tag is selected. The operating radio frequency range is between 860 to 960 MHz for the 2nd version of passive tags. Radio waves capture unique identifiers at extremely high speeds and distance greater than 10 m without straight-line contact. The second version includes new features and additional features that help in dealing with increasingly complex transportation challenges, including security aspects.
Apart from EPC/RFID tags, the GIAI data could also be carried in two-dimensional data carriers such as GS1-128, GS1 DataMatrix, and GS1 matrix barcode quick response (QR) code (which are as well ISO/IEC 15424 symbology identifiers used in GS1 system). However, the system using data reported from trackside reader must be able to distinguish vehicle GIAI from other identification numbers or GIAIs that might be identified when passing the tag’s reader.
Reading reliability is a critical aspect ultra-high-frequency radio frequency identification (RFID) system when many markers are in the reading area with complex road obstructions. The frequency of reading errors can be caused not only by the position and orientation of the random tag but also due to RF shading by other objects and tags may misalign the main sections of the label and the scanner antennas. When considering why to practically increase system coverage and overall read the output in a closed environment, a possible solution is to employ multiple readers with overlapping reading areas. However, when labels are in the reading areas of several readers, the usual label the separation protocol will experience a severe clash in reader-reader (R2R) communication, unless conflicting readers can agree on appropriate time and space sharing schemes.
Indefinite multiple access to time allocation and the lack of end-time sequence can further affect the reading process, mainly when the RFID system is used for applications that require real-time access, observation, and sensing. Collaborative reader code in a harmonic RFID system provides asynchronous tag access for all readers. The tag can distinguish redirection from multiple readers and then formulate the answer accordingly [
35].
Some papers analyse the multiantenna readers and single antenna tags to achieve longer read range when reader downlink the multiple tags (as specified in
Table 5).
4.3.2. Tracking the Cargo
There are some benefits stated in the literature regarding cargo tracking: (a) each sender could monitor the cargo; (b) also, the carrier could identify any missing freight part [
36]. For cargo tracking, it is especially important to use RFID tags, barcodes, and sensors.
For the analysis of tracking cargo, the Global Shipment Identification Number (GSIN) is essential, which is a number assigned by the cargo shipper for cargo identification. It provides a globally unique number that identifies the grouping of logistics units (pallets) for transportation from the seller to buyer under single waybill. It defines one or more pallets, each identified by a different code (serial shipping container code (SSCC)); which is linked with cargo that is part of the commercial seller-buyer relationship and that travel at the same time. GSIN could be stated in waybill or despatch advice; it can be used as a consignment reference and/or consignor loading list. All these documents are issued by using traditional or electronic means which send Electronic Data Interchange (EDI) messages.
The GSIN is printed on the label, which could be captured by a barcode or tag reader. For international cargos, the rule is that an individual GSIN number must not be reused within ten years from the date of issue and must match the standards of the World Customs Organization (WCO). For domestic cargos reuse, the period is regulated by national governing body, industry, or cargo shipper. The prefix allocated by cargo shipper makes GSIN the unique number world-wide.
Tracking and tracing of logistics units through cargo transportation is a key aspect for the application of GSIN. The scanning of GSIN which is marked on each logistic unit (pallet) allows to trace and track the physical movement of the logistics units, create a link between the physical the movement of objects and the related flow of information. It also opens the possibility of implementing a wide range of applications such as cross-dock, batch routing, and automatic receipt [
37].
5. Integration of Heterogeneous Service Infrastructure for Management of Cargo Transportation Processes by Roads and Process Monitoring
Cargo transportation processes cover the business agreement between the delivery service provider and the buyer on operational and tactical elements. They include the following components, the roles and responsibilities of which have been described in the agreement and implemented in practice. For that, the parameters and objectives must be defined: integration of necessary data, management of transport capacity, service provision, invoicing for freight delivery service, payment for the service, claims, system security, confidentiality/non-disclosure agreement, traceability requirements, service levels (and other operational measures), quality management requirements, and escalation procedures. These elements also cover the technical and administrative levels that can be used to integrate the delivery service provider; and the buyer, including applicable standards, performance, back-up procedures, and privacy instructions.
The exchange of messages and documents is the key to the management of cargo transportation processes. There are internal and external needs. Among internal needs, there is route construction and identification of transit countries, also, the control of route fulfilment. During cargo transportation, the shipping company controls a driver by checking the route data and trip time. This information is mandatory for revising driving and rest time, fulfilments of shipping instructions, getting information about vehicle accidents or inspections; identifying cargo units missed during the accident and taking post-delivery actions (i.e., archiving information and reporting statistical data).
Among obvious needs, there is a necessity to know about cargo loading and the finalisation of formalities by the sender, to plan cargo arrival to warehouse or custom declaration point and setup related actions. In case of full load delivery, the cargo recipient could track the vehicle. However, in the case of part load delivery, the cargo recipient could track the cargo [
38].
In the case of governmental needs, vehicle registration number could also be used for defining cabotage cases, for the evaluation of customs performance and waiting time or the identification of paid road charges. Additionally, each vehicle could be weighted, and its weight could be linked with the vehicle registration number. However, these needs are essential to further on authors focus on business–business (B2B) needs.
In general, many documents are being used in the context of the cargo transportation process. Some of them focus on cargo-related content (consignment note, ADR or live animal transport document, if applicable), others—to the means of transport (vehicle registration, insurance) or drivers (driver license, European health insurance card).
Among the cargo transportation service buyer and carrier, there is the circulation of documents, which defines cargo and requirements for its delivery (i.e., shipping instructions: temperature, volume, weight, danger, etc. settings), pickup and delivery point, loading and delivery time. They also agree in which form the status of cargo transportation will be reported in the provision of transport service time frame.
To follow the above-specified needs, information flow is modelled in a sustainable manner. The modelling of information flow is analysed by authors [
39] and defined as significant to the management of Cargo transportation processes (
Table 6).
First, the carrier gets the places of loading and delivery, and by using the network, data checks the possible route. Together carrier looks for shipping instructions and after the revision of vehicle park data assigns vehicle that matches specified requirements. Before the route start time, it is essential to track vehicle arrival to loading place on a specified date. When route starts on loading date, it is important to monitor both vehicle and cargo and revise the network conditions (traffic jumps and accidents). The carrier must follow the time limit for transit and bring cargo on-time to the place of delivery.
Most of the data is defined in the agreement of between cargo sender/recipient and carrier. This data is transferred to the main carrier documents. Two main documents are used in Cargo transportation processes: “Transports Internationaux Routiers” or “International Road Transports” (TIR) and the Contract for the International Carriage of Goods by Road (CMR).
Most of this information is replicated in carrier documents which have paper or electronic form. Places of loading and delivery are stated in CMR, together with shipping instructions and the date of upload. Additionally, the date of departure and the time limit for transit are specified in TIR. The information about successive carriers is presented in CMR. There is also the registration number(s) of road vehicle(s) which is/are stated in both documents (TIR and CMR). Arrival to the customs office is identified in TIR and fulfilment of shipping instructions is presented in CMR, where carrier indicate any reservations about the goods or the shipping requirements. Finally, the information of road accidents is marked in TIR.
5.1. Statistical Data Analysis of the Evaluation of e-Documents of Cargo Transportation by Application of TIR and CMR in Europe Countries
The cargo (accompanying) transport document performs three main (statutory) functions: (a) prove the contract of carriage with liability, (b) prove ownership of the goods, and (c) description of the cargo and show transit route. The information which is retrieved covers such aspects of cargo transportation activity:
Process status. The consignor and the carrier (or their representatives) have agreed on cargo transportation and status reporting;
Cargo information. All vital information about the load, such as its temperature setting (in the case of a temperature-controlled cargo), dangerous goods data, handling instructions, and pick up and drop off places (also known as pickup/delivery points);
Delivery conditions. These conditions apply to the cargo shipment are specified in consignment note named as Contract for International Carriage of Goods by Road (CMR) and delivery terms called as Incoterms;
Delivery payments. It proves the payment of import charges and other taxes which are paid during the carriage.
Two main documents are used for cargo transportation: TIR and CMR. Each of them is presented below in detail.
5.1.1. Integration of the TIR System in Heterogeneous Service Provision Infrastructure
The computerisation of freight documents is not easy and is taking many years. Slow computerisation is due to insufficient physical infrastructure and complex cross-border formalities and procedures. The results of the implementation by International Road Transport Union (IRU), which are carried during international operations at the driver cabin are shown in
Table 7.
Many freight operations in EU-28 territory still require the carriage of paper copies by a lorry driver, among European countries where is a large quantity of TIR Carnets provided by World Road Transport Organisation. A key element for the cross-border movement of goods is e-documents instead of paper ones. This simplification is the result of the development of integrated information flow model. The exchange of relevant information is facilitated by applying available ICT tools. For transit, a key element is electronic TIR (eTIR) presenting all process monitoring information and cross-border movement of goods based on e-documents.
The computerisation of TIR Carnets started in 1995. Inefficiencies and unfair customs practices in transit procedures were major challenges for developing countries which faced to strengthen their competitive positions in global markets.
The development of the eTIR system started in 2003. The computerisation of TIR Carnets provides benefits for all participants in the cargo transportation processes such as the systematic availability of extended information, which enables stakeholders to carry out risk assessments before the cargo arrival.
For transit and the usage of the eTIR, it is highly essential to define countries, which will be crossed. In literature, it is also mentioned as a transit route assignment problem. For solving this problem, the rule of how the transit route is chosen must be specified. The framework can consider the transit route choice behaviours, including multiple carriers that interact on the same physical network. One of the main features is that framework finds the effects on the transportation network, including congestion and capacity elements. At the first level, the time of departure and the transfer point for switching carrier are selected. The assumption is made that drivers minimise freight delivery time when they are travelling between specified locations. The transit travel time is randomly distributed among drivers. Equilibrium will be reached when no one of drivers believes that travel time could be improved by changing the route. Such is characterised as a stochastic equilibrium condition [
41]. For traffic, the assignment could also be used for the all-or-nothing procedure, which is using empty network time intervals for transit route assignment. For selecting the solution, assignment loads the freight delivery trips between points (in particular, origins and destinations) for searching the shortest transit route. In the case of multiple carriers, route code could be used for identification. The carrier assigns the route code for international solutions, and it defines ship-to-postal code information. In the case of several carriers entering cooperative agreements, then routing code could be applied as the common indicator. The route code could be captured with any reader.
5.1.2. Assessing of CMR Implementation
By assessing of carriage of goods by road (CMR), we found that the around 88 per cent of all European Union (EU) cross-border transportation operations still include paper waybills.
IRU initiated protocol to the CMR concerning the electronic its version, which allows that CMR could be managed electronically and should include the same content as its paper version. This protocol entered into force on the 5 June 2011. Up to date, 20 European Union countries out of 28 have acceded it including Bulgaria, Croatia, Czech Republic, Denmark, Estonia, Finland, France, Latvia, Lithuania, Luxembourg, Malta, The Netherlands, Portugal, Poland, Romania, Slovakia, Slovenia, Spain, The United Kingdom, and Sweden. However, the protocol has acceded; there is no legal obligation to use electronic CMR form between supply chain or transport partners. Even though the first, computerised CMR form was officially launched in the European Union (EU) for cargo transportation between Spain and France in January 2017.
Later, more EU countries have started pilots without having a common framework on the eCMR data content. However, the main issue is to standardise and harmonise the content for the exchange between the actors of cargo transportation that an electronic form would have evidentiary value.
The electronic form of CMR should have the same procedures as paper form: issue, cancellation (used with defined reason code), cargo return (the change of freight receiver by stating return reason code) and CMR closure (when cargo receiver confirms cargo receipt and notifies the number of packages accepted in full, 100%, or any other amount).
CMR holds all critical information about the cargo, such as its temperature settings, dangerous goods data, and other handling instructions and information about locations, also known as the place of loading and delivery. Indications concerning dangerous goods (abbreviated DG) are mandatory for DG.
Delivery conditions applied to the shipment are specified in CMR together with delivery terms specified as Incoterms rules. Instructions are provided for a cargo carrier, if necessary. All instructions that could affect the transport, such as the instructions concerning customs procedures, the request on transhipment of the goods, insurance of the cargo or any other useful instructions are indicated in CMR. Field 15 also shows the Incoterms conditions which are applied to sales transactions. Reservations and observations of the carrier at the time of taking cargo are essential, as the number of packages and their packaging are stated herein. There are notes on cargo damage; in particular, it is noted the nature of the defects and the amount of cargo damaged. The field holds other useful indications such as the net weight of the goods, the number of the TIR Carnet, or any other relevant document numbers.
Overall, the application of eCMR form could guarantee faster administration (i.e., reduction of manual data entry, paper printing, handling, and archiving, improvement of data quality, and minimisation of time required for issuing paper version).
6. Discussion
The assessment of support infrastructure of cargo transportation processes for today’s needs is complex and dynamic. The research results have obtained by developing the assessment methodology by covering some layers of analysis, including the horizontal and vertical means of activities in multi-componential management processes of transportation of cargo. As well as the contextual information being especially crucial in the transportation process, our future consideration will cover more detailed contextual infrastructure analysis for multi-modal transportation requirements. The review of heterogeneous services providing possibilities by analysing of communication links in our methodology presented in this paper are more common and must be examined in a more detailed style from the future perspective. The complexity of analysing transportation processes is revealed, and results are forwarded for more sustainable transport issues by implementing intellectual means as heterogeneous services, which are provided for sustainable management of transportation processes. The future directions of such research work will concern the consideration of scenarios of accident events and possibilities to classify the types of infrastructure components and implementation ofspecification of contextual information in information systems by providing the smart services for avoiding of accident events and unsafety situations.
The solutions responding to the modern needs of intelligent contextual data collection, aggregation and dissemination in the processes of cargo transportation logistics through the ground surface are very needful for the operational management. The information communication methods and tools used for developing smart services have a sense for operative control of transportation. It pays more attention for adaptability for the recognition of real situations, relevant to all transit countries of EU, which are going to develop contemporary, good access to unified infrastructure guaranteeing the cargo delivery by various transport means.
The needs of this research are based on requirements to support more effective operative management of the complex supply chain processes. Communication network problems are caused by a large amount of network data traffic, by the transport structure of a rapidly changing topology and the complex nature of information interpretation by requiring many network resources. To achieve the better understanding of real environment, it is necessary to exchange the available data with other nodes of the network, which in this case are means of freight transport, thus forming a cooperative system. When network nodes flood, transmit all collected contextual data to all surrounding nodes, and lack proper network topology information, a network load problem occurs, resulting in the slowdown or some cases downtime of infrastructure capacity in each area. Alongside the development of the infrastructure for delivering smart services in the freight transport process, the challenges posed by the Internet of Things, interoperability scenarios, communication network capacity, and constraints must be addressed. The question is given the direction forwards how to select, which data have to pass to the surrounding nodes without sacrificing the quality of contextual data or reducing the overall efficiency of the network. These problems require intelligent adaptive methods to evaluate internally (location, time, environment, user state, truck dynamics) and external contextual information (information from other freight vehicles), as well as network mobility conditions and load, according to the data packet generation and transmission processes.
7. Conclusions
Practices of vehicular communication network’s deployment, research, and scientific projects are developed in two directions: direct vehicle–vehicle (V2V) communication and vehicle-to-infrastructure (V2I) communication.
In the study, the authors provided the multi-layer methodology for the assessment of heterogeneous services provision for sustainable cargo transportation.
The network topology varies very rapidly, situations change dynamically, and service control systems have support possibilities to contain communications from one to several hundred of the network nodes.
For the provision of heterogeneous services, it is necessary for new routing protocols and channel access methods for the large volume of fast-changing topology networks. The investigations in VANET communication development are essential. Some possibilities to solve the problem are provided. They are associated with communication between the sender and the receiver moving to opposite directions in the road. This approach is based on the construction of service provision infrastructure by developing a knowledge base for rapidly changing communication networks with the standardised networks supporting possibilities by evaluating the data transferring capacities for cargo transportation processes.
The authors emphasise the information flows that are created for the transmission of messages and electronic documents used in freight transport. All these flows are essential for adequate transport safety, paperless management, driver comfort, and optimal traffic development, and are focused on reducing pollution. All the required data, which is essential during the process, is linked with network elements and content presented in electronic format.
Further research directions could focus on the review of heterogeneous services for cargo transportation by rail, and also include multi-modal and autonomous transportation aspects. Additionally, the authors plan to extend the research to the infrastructure of vehicle-to-vehicle (V2V) and vehicle-to-infrastructure (V2I) communication.


