Abstract
How to reduce the negative transport externalities, especially its carbon emissions, without having significant negative influence on economic and social development is the key for sustainable development in China. This paper explores the impacts of China’s recent modal shift policy on carbon emissions, summaries experience from China, and points out future development directions. The paper first compares the different energy consumption and carbon emissions between the road freight transport and the railways in China, and then has a scenarios analysis on China’s energy consumption and carbon emissions of the transport sector in 2025. The latest progress and major problems of modal shift policy in China are presented, and a methodology to address this problem is also proposed. Based on the methodology, we compare the benefits and costs brought by modal shift policy in the case of Ordos, Inner Mongolia. Based on the results, principles and suggestions on how to design and implement more efficient modal shift policy are proposed. We find that road transport is the most polluting mode among various modes of transport, and the railway transport has the least carbon emissions. Furthermore, the modal shift policy plays a positive role in carbon emissions, but the costs caused by the policy are higher than the benefits at some circumstances. Moreover, to achieve the sustainable modal shift policy by relying on the feasible market mechanism, together with scientific and effective regulation, instead of “one size for all” administrative policy, are likely the way forward.
1. Introduction
The Chinese government and people have realized that economic and social development need not only focus on GDP growth but also on the sustainability of environment, which has been faced with severe environmental pollution and ecological destruction for more than twenty years. According to the statistics of the International Energy Agency (IEA), the annual average growth rate of carbon emissions from fuel combustion in China was 7.5% from 2000 to 2015, much higher than the world average of 2.3% [1].
As shown in Figure 1, China’s total carbon emissions have continued to grow rapidly since 2000. China’s carbon emissions are higher than those of other countries and regions in the world, and it surpassed the United States and became the world’s most carbon-emitting country in 2005. China’s total carbon emissions increased by about 2.9 times from 2000 to 2014. Based on China’s “13th Five-Year Plan” carbon emission reduction target, China has promised to reduce carbon emissions of per unit of GDP by 60% to 65% by 2030, from 2005 levels, and the total carbon emissions will peak in 2030.
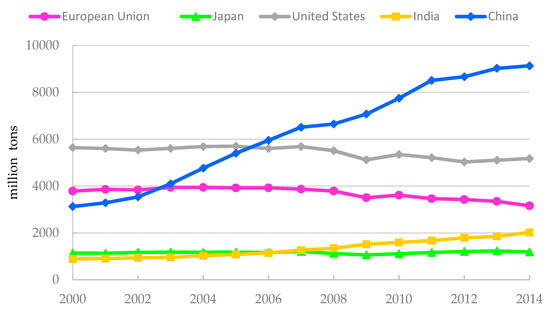
Figure 1.
Carbon emissions from fuel combustion from 2000 to 2014. Data Sources: CO2 Emissions from Fuel Combustion, International Energy Agency (IEA), 2016 and 2017.
The European Commission pointed out in 2014 that the transport sector is the second largest source of carbon emissions. About one-quarter of the European Union’s (EU) greenhouse gas emissions came from the transport sector, and the road sector accounted for more than one-fifth of the total carbon emissions in the EU. China’s total carbon emissions from fuel combustion in 2015 were 9.084 billion tons, of which 843.9 million tons came from the transport sector, accounting for 9.3% of the total. Moreover, the total carbon emissions of road transport in China is 698.2 million tons, accounting for 82.7% of the transport sector [1].
The carbon emissions from the transport sector account for about 20% of the total emissions in Japan and the European Union, and it even reaches about 35% in the United States. Although the current proportion of carbon emissions from the transport sector in China does not exceed 10%, the transport sector will become the main source of carbon emissions in China in the future with the adjustment of industrial structure and the improvement of people’s living standards. As shown in Table 1, whether it is in developed countries and regions or developing countries, the carbon emissions from the road sector accounts for the highest proportion in the transport sector. The share in China’s is more than 80%, while the percentage of the United States, Japan, and India is above 85%, and it is more than 95% in the EU. Therefore, the road sector has a large potential for energy conservation and emissions reduction, and should be the focus of carbon emissions reduction [2].

Table 1.
Carbon emissions from fuel combustion in 2015.
Therefore, the developed countries have implemented the modal shift policy (from the road to the railway, the most environmental friendly transport) for more than decades. Enlightened by the experience of the policy, the Chinese government initiated the radical modal shift policy in 2016, which mainly includes the “overload and over clearance control on road transport” and “prohibition of road for transporting the coal”, as well as promoting the development of railways. Although the continuous radical modal shift policies and implementation have achieved obvious reduction effects, a series of negative outcomes have come after the “one-size for all” administrative means as well, especially uneconomical logistics cost growth and social economic operations. In short, this paper will address the significance of the “Road to Rail” policy and study how the policy can better achieve environmental goals without having significant negative influence on economic and social development.
2. Literature Review
Most national researches on measures to reduce carbon emissions from the transport sector focus on new energy vehicles and public transport. Few studies involve the modal shift policy, and most of them involve qualitative analysis, but less quantitative analysis. Factors affecting the carbon emissions from the Chinese transport sector can be various. Fan [3] and Yuan et al. [4] found that transport energy intensity, energy efficiency, energy structure, and transport market structure are the major factors contributing to energy consumption and carbon emissions. Ding [5] estimated that road transport contributes significantly to carbon emissions in the transport sector, and Lv et al. [6] found that road freight is the largest increasing sub-sector of carbon emissions in the freight transport sector. Therefore, the transport structure mainly based on road transport will generate more greenhouse gas, and shifting the traffic from road to more environmentally friendly transport modes will affect energy consumption and carbon emissions. Similar conclusions were made by Wei et al. [7], Pang [8], Liu [9], Yuan et al. [10], and Yang et al. [11]. Chai et al. [12] compared the carbon emissions reduction effects of modal shift policy in China, the United States, the EU, and Japan, and found that China’s transport industry has a large potential for structural carbon emissions reduction. Yang et al. [13] and Ke et al. [14] set different scenarios to analyze the potential to reduce carbon emissions from China’s transport sector, and the results indicate that China’s carbon emissions of the transport sector show a rapid upward trend from 2011 to 2020, and Chen et al. [15] found that the carbon emissions in the country will peak in 2036. These researches point out that the transport structure will have an impact on carbon emissions, but there is no further study on how to implement the modal shift policy.
Faced with increasingly serious environmental pollution, the Chinese government has begun to introduce some countermeasures recently. The “Controlling overload and over-clearance for trucks” and “Modal shift from Road to Rail” (“Road to Rail”) are the main governance policies in response to the problems caused by road. With these policies, issues related to the adjustment of structure in the freight transport market have attracted attention. The implementation of these policies has increased the cost of long-distance road transport by more than 25%. Ding [16] and Zhang et al. [17] hold the opinion that the cost increase of road transport will cause some road freight traffic flow to rail. The policies will promote the competition order of the freight market, create a fair environment for the transport market, and improve the development of railway freight transport. However, these countermeasures do not take economic factors into consideration, which leads to huge economic losses.
The core of the developed countries’ transport environment policy is to achieve sustainable mobility, which should ensure mobility first. Japan, France, the United States, and other countries all advocate modal shift in their basic transport policies, so that the traffic volume is shifted to an environmentally friendly transport mode to optimize the transport market structure and the goal of energy conservation and emissions reduction is achieved. International studies on the modal shift policy predate China for many years, but due to the enforcement and economic goals, how to effectively implement the policy has not been fully studied.
The study results of Solaymani [18] indicated that, during 2000–2015, transport carbon emissions increased in the United States, China, India, Canada, Russia, and Brazil, whereas they decreased in Japan. Hu et al. [19] estimated the amount of CO2 emissions in the footprint coming from transport for Sweden, and results showed that 14% of the total Swedish CO2 footprint was coming from transport activities occurring in the global supply chain. From an environmental perspective, Fumio K [20] explored how the railway, as an environmentally friendly mode of transport, has received various forms of governmental and social support. In order to implement modal shift policy, the Japanese government has taken a series of measures to promote the development of the railway on the legislative and operative aspects. The French government has adjusted the transport structure since 2011. The focus of its modal shift policy is to develop railway freight, and to regard railways as the key sector for sustainable development of transport and environment. In March 2011, France issued the “National Commitment for Rail Freight” [21], aiming to accelerate the rapid development of rail freight transport and transfer freight traffic volume from road to rail. The Association of American Railroads point out that the fuel efficiency of rail is four times that of road, and fuel efficiency of rail has increased by 106% since 1980. From 1980 to 2010, carbon emissions from the rail freight decreased by 658 million tons due to fuel efficiency improvement. Besides, replacing road freight with rail freight has reduced carbon emissions by 75% [22]. Marsden et al. [23] summarized governance policies on transport and climate change in the United Kingdom (UK). UK proposed a development direction from a macro level in 2009, which made good use of market mechanisms to encourage a shift to low-carbon transport, such as the EU Emissions Trading Scheme and modal shift policy.
The European Environment Agency’s 2007 Transport and Environment Report [24] states that the transport sector, as one of the important sources of carbon emissions, contributes about 20% of Europe’s greenhouse gas emissions. In order to reduce carbon emissions and meet the emissions reduction targets set by the European Commission, the transport sector has become an important sector for reducing emissions. Road transport, as the main source of carbon emissions in the transport sector, needs to shift to a cleaner transport mode, and the transfer from road to rail is the currently recognized direction of modal shift. The current EU modal shift policy has played a good role in energy conservation and emissions reduction in the transport sector. It is the currently recognized idea in China that the freight traffic volume should be transferred from road to rail, but how can this modal shift policy best be designed and implemented in China’s context? Can China get its late-mover advantage? Yang et al. [25] point out that to avoid losses, the market-oriented approach is worth promoting.
The contributions of this paper lie in two aspects. First, it is different from most previous studies which focus on the carbon emissions trend and qualitative analysis about modal shift policy. This paper compares the energy consumption and carbon emissions of road and rail, and estimates the energy conservation and emissions reduction brought by modal shift policy in different scenarios to reflect the effectiveness of policy. Second, unlike other studies that focus on environmental goals of policy, this paper focuses more on how to effectively implement modal shift policy. We analyze the cost-benefit of China’s modal shift policy and the existing problems with the case in Ordos, Inner Mongolia, and propose corresponding solutions to balance environmental protection and economic growth. The remainder of this paper is organized as follows: in Section 3, this paper executes the comparative analysis and the traffic forecast of railway and road; in Section 4, this paper estimates energy consumption and carbon emissions under different scenarios; in Section 5, the implementation of China’s modal shift policy and the challenges it is facing will be elaborated; for studying the benefits and costs caused by modal shift policy, the case in Ordos will be analyzed in Section 6; and in Section 7 some conclusions and recommendations are provided.
3. Comparative Analysis and the Traffic Forecast of Rail and Road
Due to the differences in energy technologies, efficiencies, transport capabilities, service characteristics, and market demands, there are also differences in energy consumption and carbon emissions generated by a traffic unit of rail and road. By comparing the unit energy consumption and carbon emissions, the differences between rail and road in terms of energy conservation and environmental protection can be calculated, and the effects of the modal shift policy can be analyzed and predicted.
3.1. Comparative Analysis of Energy Consumption and Carbon Emissions in Rail and Road
As shown in Table 2, the energy consumption of China’s transport sector in 2015 was 12.5 EJ (that is, Joule), resulting in carbon emissions of 964 million tons [26]. In addition, the energy consumed by the railway sector was 461 PJ (that is Joule), accounting for 3.7%. The carbon emissions generated from railway were 147 million tons, taking up for 15.3%. Besides, the energy consumption of the road sector was about 10.3 EJ, with the percentage of 82.5. And the carbon emissions were about 690 million tons, which is about 71.7%.
Table 2.
Energy consumption and carbon emissions of China’s transport sector in 2015.
From Table 2, the unit energy consumption of road was 1.75 PJ/billion TU (PJ is joule, and billion TU is one billion turnover), which is about 41,726 tons of oil equivalent (TOE) (1 ton oil equivalent = 41.868 GJ (41.868 × 10⁹ J)); the unit energy consumption of railway was 0.13 PJ/billion TU, which consumes about 3083 TOE. The unit carbon emissions of road was 117,000 tons, while that of railway was 41,000 tons. On the whole, the unit energy consumption of railway transport was only 7.4% of road transport. Its unit carbon emissions were also much lower than that of road. As a result, railway in China has much higher energy efficiency and much lower carbon emissions than road. So shifting the road traffic to the railway will be the key to reduce carbon emissions in the transport sector.
3.2. Prediction of the Traffic Turnover of China’s Road and Rail under the Do Nothing (Existing) Scenarios
To study the impact of modal shift on energy conservation and emissions reduction, it is necessary to predict the future railway and road freight traffic turnover in the existing scenarios. The predicted results will be applied to the scenario analysis to explore the possible energy saving and emissions reduction effects under different scenarios.
(a) Sample selection and data sources
The data used for forecasting is the annual data of China Railway Cargo Turnover and Road Cargo Turnover from 1978 to 2016 [27]. The freight turnover was predicted to explore the trending evolution of rail and road transport without changing existing transport policies.
(b) Stationary test, information criterion, and lag order
The Augmented Dicky-Fuller (ADF) test is used to verify the stationary of rail and road time series. The test was executed by statistical software Stata12.0, and the test results show that the time series of rail and road are unstable, but first-order differential time series of rail (∆Rail) and road (∆Road) are stable which can been seen in Table 3. Thus, the models use their first-order difference of rail and road to construct an autoregressive model.
Table 3.
The ADF (Augmented Dicky-Fuller) test results of first-order differential time series.
The null hypothesis () of ADF test is that the time series are random, and the alternative hypothesis () is that the time series are stable. The p-value of is 0.0737, and we reject the under critical level of 10%; the p-value of is 0.0001, and we reject the under critical level of 1%.
Before constructing the autoregressive model, the lag order in the model was determined according to the information criterion. In this paper, the Akaike information criterion (AIC) is used to select the lag order that minimizes the AIC value. As shown in Table 4, the AIC value of the fourth-order autoregressive model of ∆Rail is minimum, and it is determined that ∆Rail is a fourth-order autoregressive (AR) model, which is AR (4) model; the AIC value of the first-order autoregressive model of ∆Road is minimum, and ∆Road is a first-order autoregressive model, which is AR (1) model.
Table 4.
The AIC (Akaike information criterion) value of different lag orders.
(c) Model construction and Empirical results
The autoregressive model is used to predict the volume of cargo turnover in China. The autoregressive models are constructed as follows:
The Equation (1) is the AR (4) model of , and Equation (2) is the AR (1) model of .
The statistical software Stata12.0 was used to construct the autoregressive models, and the coefficients were estimated by the ordinary least square) (OLS) estimation method. The estimation results are shown in Table 5 and Table 6.
Table 5.
AR (1) model regression results of ΔRoadt.
Table 6.
AR (4) model regression results of ΔRailt.
On the basis of regression results in Table 5 and Table 6, the predictions of ∆Rail and ∆Road from 2017 to 2025 were calculated, as shown in Table 7, and the freight transport turnover of rail and road are estimated by the predicted data.
Table 7.
Forecast results of freight transport turnover in China from 2017 to 2025 (unit: billion ton-km).
4. Scenario Analysis on the Numerical Results of “Road to Rail”
We explore the numerical results of China’s modal shift actions by scenario analysis in the following part. By setting different percentages of the road freight turnover shifting to the rail, forecast on the future freight traffic of the both sectors can be foreseen, and then, the effect of modal shift on energy consumption and carbon emissions will be illustrated in quantitative approach.
4.1. Assumptions and Scenarios Setting
The assumptions for the scenario analysis are two: (a) assume that there is no significant technological advancement; (b) there has not been a major change in the energy structure. Four different scenarios were conducted to compare the transport energy consumption and carbon emissions. In the first scenario, the modal shift policy is not implemented. According to the original trend, we have predicted the energy consumption and carbon emissions generated by rail and road freight transport in 2025. The second scenario is to transfer 10% of the road freight turnover to the rail. The third scenario is to transfer 20% of the road freight turnover to the rail. In the fourth scenario, 30% of the road freight turnover is transferred to the rail.
According to the forecast results, if the modal shift policy is not implemented, the railway freight traffic turnover in 2025 will be 3095.49 billion ton-km, and the road will be 7776.89 billion ton-km. Table 8 is calculated based on the predicted data.
Table 8.
Rail freight and road freight traffic in different scenarios (unit: billion ton-km).
4.2. Energy Consumption and Carbon Emissions under Different Scenarios
For the comparison of four scenarios, the first scenario is used as the basis and the reference objects for the other three scenarios. From Table 2, the unit energy consumption, of road is 41,726 TOE, and the unit carbon emissions is 117,000 tons. The railway’s unit energy consumption is 3038 TOE, and the unit carbon emissions are 41,000 tons. Given the standard, the energy consumption and carbon emissions generated by railway and road under the four scenarios were calculated separately, to obtain Table 9.
Table 9.
Energy consumption and carbon emissions of railway and road freight transport.
As Table 8 and Table 9 shown, when freight transport modal shift policy is not implemented, road transport accounts for a large share of the freight market. The energy consumed by rail and road freight is 333.90 million TOE by 2025, and the carbon emissions are 1036.8 million tons, an increase of about 22.9% over 2015 (According to data from IEA, China’s carbon emissions from transport sector is 843.9 million tons in 2015).
The optimization of transport structure is conducive to reduce carbon emissions at large, and different shifted traffic volumes can result in different effects of energy saving and emissions reduction. From Table 9, we know that when the transfer amount reaches 10%, the total energy consumption of about 30 million TOE can be reduced, saving more than 9% of energy consumption, thereby reducing carbon emissions by about 59.1 million tons, which is about 5.7% lower than that of do nothing. When the amount of transfer reaches 30%, the total energy consumption saving is about 90 million TOE, saving more than 27% of energy consumption. As a result, the carbon emissions can be reduced about 177 million tons, which is approximately 17% lower. It can be seen that the energy conservation and emissions reduction effects brought by the modal shift are obvious.
5. Chinese Government’s Modal Shift Policy So Far
The results of the scenario analysis indicate that the modal shift policy can effectively reduce carbon emissions from the transport sector if it can be implemented. However, China’s freight market still has problems such as shrinking railway market share and slow development of intermodal traffic. At the same time, the Chinese government has not yet formed an integrated policy for transport and environment. Compared with China, Japan, the United States, France, and EU have implemented modal shift policy earlier. They have a balanced transport-environmental policy, which takes economic goals into account. The policy not only needs to protect environment, but also needs to guarantee the normal operation of economy and society. In recent years, the continuous modal shift policies and the effective implementation have achieved immediate reduction effects, but a series of negative effects have come as well. The government only focuses on environmental goals, but ignores the losses caused by the modal shift policy. The policy just relying on administrative power cannot be cost-effective and environmentally sustainable.
5.1. The Latest Radical Government Policy on the Modal Shift
So far, the transport environment policy formulated by the Chinese government has mainly implemented different measures for roads and railways. The policy initially focused on promoting renewable and clean energy vehicles, encouraging the use of new energy vehicles to replace traditional motor vehicles, and relying on financial subsidies and supporting infrastructures to expand its markets and increase demand. As environmental pollution problems have become more and more serious since 2016, the government has implemented a series of more stringent measures to limit the air pollution caused by road freight transport. The “overload control on road transport” and “prohibition of road for transporting the coal” are the main means of restricting road freight transport at present. Aiming at the achievement of modal shift policy and the goal of environment protection, the government provides supports for railway freight transport, which include increasing the construction of railway lines and guiding the traffic volume to railway. The policies about modal shift in China are in Table 10.
Table 10.
Policies and regulations on modal shift in China.
(a) Forbid the road transport between the coal producing areas and the ports strictly
In order to reduce the air pollution in the Beijing-Tianjin-Hebei region, the Ministry of Ecology and Environment of the People’s Republic of China (PRC)issued the “Work plan for air pollution prevention and control in Beijing, Tianjin, and Hebei and surrounding areas in 2017” jointly with the MOF, the NDRC, and other departments [28]. The work plan pointed out that it was necessary to control road freight transport in the Beijing-Tianjin-Hebei region and significantly increase the proportion of railway freight transport volume within the region. The plan stipulated that trucks were banned for coal transport to Tianjin Port, and firms should make full use of railway capacity such as Zhang-Tang line (Zhangjiakou–Tangshan) to speed up the development of the intermodal traffic between railway and water transport. For reducing the impact of road freight transport on air pollution, ports companies should forbid the coal transport with diesel vehicles.
(b) Control the overload and over-clearance in road freight transport strictly
In August 2016, the MOT of the PRC issued relevant regulations on “control of highway over-clearance and overload”. In order to limit the over-clearance and overload in road freight transport, a more stringent regulation “Highway management regulations for over-clearance transport vehicles” was implemented [29]. As the statistics from the Ministry of Public Security of the PRC show, China had a total of 410,000 semi-trailers over the length of the national standard of “1589” at the end of 2016, including 110,000 flat-panel semi-trailers with 17.5 m and over 300,000 over-standard box cars and container semi-trailers. There are about 40,000 commercial automobile transport vehicles in the country, of which more than 90% are illegal vehicles. After limiting the over-clearance and overload in road transport, prices of road freight transport generally rose, thereby guiding some of the freight volume back to the railway.
(c) Use railway freight transport as far as possible
On 17 September, 2018, the “Three-Year action plan for advancing modal shift (2018–2020)” issued by the State Council required that the structure of freight transport should be optimized and the proportion of railway freight transport should be substantially increased for the environmental protection goals [30]. By 2020, the national railway freight volume would increase by 30% compared with 2017, the Beijing-Tianjin-Hebei region and the surrounding areas would increase by 40%, the Yangtze River Delta region would increase by 10%, and the Fen-Wei plains would increase by 25%. In order to achieve the railway transport growth target, government will further promote the construction of key railway projects, which include increasing investment in freight railway construction and accelerating the construction of freight railway lines such as Meng-Hua line, Tang-Cao line, and Shui-Cao line, as well as vigorously increasing the coal volume of railway in Zhang-Tang line and Wa-Ri line.
According to the “Work plan for comprehensive governance of air pollution in Beijing-Tianjin-Hebei and surrounding areas in the autumn and winter of 2018–2019”, with the target to control the Beijing-Tianjin-Hebei region air pollution in autumn and winter, it is required to achieve energy conservation and emissions reduction by modal shift [31]. All provinces (cities) should formulate a three-year action plan for the modal shift, propose implementation plans for the “Road to Rail” of bulk cargo, containers and medium- and long-distance cargo transport, rail-water intermodal traffic and the construction of green freight hubs, and clarify the targets of modal shift.
(d) Develop intermodal transport vigorously
In accordance with the requirements of the State Council, it needs to vigorously develop intermodal traffic to win “the blue sky defense”. Relying on railway logistics bases, highway ports, coastal and inland river ports, and so forth, we have to promote the construction of stem-branch freight hubs (logistics parks) and accelerate the promotion of container intermodal traffic. The city’s green logistics system will be built to support the transformation and upgrading of the city’s existing railway freight yard and logistics freight yards into urban distribution centers. The government encourages the development of transport and organization methods such as river-sea transport, ro-ro transport, and tractor-and-trailer transport, and reduce the empty-loading rate of cargo transport. Simultaneously, the sea-rail combined transport will be vigorously promoted, and the volume of sea-rail combined transport with container in national key ports will increase by more than 10% annually.
5.2. The Negative Impacts of the “One Size for All” Administrative Policy
Although China has introduced relevant modal shift policies, there are obstacles in the implementation of policies because of the original problems of China’s freight market and the negative impacts brought by policies. These problems damaged the effects of energy conservation and emissions reduction. Whether the policies can conform to China’s actual conditions and achieve the original purpose or not, it depends on the policies’ feasibility.
The current modal shift policy simply prohibits vehicles from entering the coal transport ports and replaces the road transport by rail. But the policy does not take the negative impacts of such “one size for all” into account. It is not economically efficient to rely solely on the simple and ruthless administrative means of prohibiting road transport, regardless of the impacts on logistics cost growth and social economic operations. Such policies are also difficult to maintain for a long time.
The negative impacts of this kind of modal shift policy mainly include the following three aspects.
Firstly, the policy has reduced the profit of coal transport sea ports. After the implementation of the “Road to Rail” policy, the ports face a huge challenge in the short term with the gap between large bulk cargo throughput and the delay in the construction of the railway hub and port system. Before the completion of the construction of supporting facilities in the ports, the economic benefits of the ports are affected by problems such as lack of sufficient transport capacity of rail-port link facilities, lag timeliness, and inadequate service.
Take Tianjin Port as an example, the coal transport port has an annual throughput of nearly 100 million tons, and road transport accounts for more than half. The total coal throughput of Tianjin Port in 2016 was 109.7 million tons, and the volume of road transport was 56 million tons, accounting for 51.04%. At the end of April 2017, Tianjin Port stopped receiving coal by road and its coal and coal product throughput decreased by 30.15%, and the metal ore throughput decreased by 14.10%. Tianjin Port achieved a total profit of 1.571 billion CNY in 2017, a decrease of 29.19% compared with the same period of 2016. Its annual reports showed that the decrease in profit was mainly due to the reduction of the loading and unloading business of coal and coal products, ore, and steel (http://www.zgsyb.com/html/content/2018-05/10/content_869844.shtml).
Secondly, the policy has negative impacts on road logistics companies, especially for the bulk transport business of road. To cope with “the most severe regulation for over-clearance and overload in history”, which forbids the truck with 30 t capacity to transport the cargo with 50 t, many logistics companies have purchased larger vehicles to increase their transport capacity since September 2016 [32], however, because of the implementation of the “Road to Rail” policy, many small- and medium-sized (SMEs) logistics companies that purchased larger vehicles have experienced problems such as excess capacity and reduced business volume. In addition, the expenses for borrowing bank loans and employee salary are also a burden, and then some SMEs have to withdraw from the transport business. The current problem encountered by road logistics companies is rearranging the trucks that are newly bought or not in retirement period given that excess supply capacity. Logistics enterprises can hardly adjust their transport plan in time because of the radical change of governmental policy. Meanwhile, some of these enterprises cannot survive in this situation, because they are accustomed to ports transport, which might lead to panic and anxiety within the industry.
Finally, the policy increases the social logistics costs. In short term, the “Road to Rail” policy will increase transport costs and decrease social and economic benefits. From the perspective of costs, railway is more suitable for medium and long distance and direct freight transport, and road has obvious advantages in short or multiple loading and unloading transport. After the implementation of “Road to Rail” policy, the transport costs will increase in the short term, which will cause a certain price increase of the downstream enterprise. In January 2018, the higher coal price reflected the increase of logistics costs [32]. The lack of transport capacity and construction of ports and railway lines have an impact on the daily operation of ports, resulting in the loss of the entire social and economic benefits. Railway cannot completely accomplish the door-to-door transport service, which will affect the timeliness and integrity for carriers. When the road transport is used to complete the “last-mile” of the two ends, the logistics costs will increase, which will inevitably increase the railway transport costs and reduce economic benefits.
5.3. A Contrastive Analysis of the Railway Experience between US and China
Figure 2 shows that the market share of US railways has been kept around one-third of its freight market since 1990s, while that of China has declined from 60% in 1990 to 18% in 2016. At the same time, the rail intermodal traffic increased from 5.8 million Twenty Inch Equivalent Unit (TEU) to 27 million TEU in 2016 in US, which was approximately 8 times and 2.5 times higher than that of China. The US railway freight market share is higher than that of road, which set a good example for Chinese Railways.
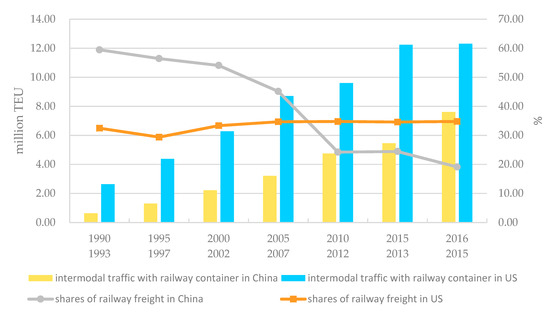
Figure 2.
Comparison of market share of railway freight transport and railway container traffic between China and the US. 1. The data sources come from U.S. Department of Transport, Pocket Guide to Transport, 1997–2017; Chinese railway year book, 1990–2017; and Authors’ study. 2. The left vertical axis is the intermodal traffic with railway container, whose unit is million TEU (Twenty Inch Equivalent Unit); and the right vertical axis is the shares of railway freight transport, whose unit is %. 3. The first row in horizontal axis is the year for the intermodal traffic with railway in China and US; and the second row in horizontal axis is the year for the shares of railway freight transport in China and US.
The major reasons for the huge difference are (a) the railway freight institutional structures are different. The number of railway freight companies in the US exceeds more than 500, so the fierce competition makes these companies have flexible adaptability and low freight rates. In contrast, China Railway is a state-owned and operated enterprise (SOE) with over 80% of rail market share, which results in a lack of competition pressure, inflexible operation, higher freight rates, and poor service level. All of these conductors drive the traffic from the rail to road; (b) the cooperation mechanism between different rail companies and other modes in the fields of technical, operational, and commercial interoperability is different [33]. In US, taking the intermodal transport as a good example, the container transport can realize the seamless connection between railway companies and other transport modes, and save the time and cost of cargo loading and unloading in intermodal traffic. The railway industrial/feeding lines are directly built into the mines, logistics parks, and the ports, so that major traffic can be completed either by different railway companies or by rail-water operation, without road transport. On the contrary, in China, the existing state-owned railway company has been abusing its market power to combat new entrants in terms of network connection, line capacity allocation, revenue distribution, access charge, and others. All of these discriminations raise the barriers to entry into the railway freight market, and discourage the private investors and entities to join the railway freight market to reduce the costs and improve service capabilities of railway freight.
6. Analysis Methodology of Modal Shift Policy
6.1. Cost-Benefit Analysis of the Policy
In order to simplify the analysis and facilitate discussion, the environmental protection benefits in this paper mainly consider energy conservation and emissions reduction. Considering the current market situation and the actual losses caused by the policy, the costs of the policy are about three aspects, which are the losses of ports companies and road logistics enterprises, the investment in new railway projects, and the additional logistics costs. The benefits and costs of the modal shift from road to rail (“Road to Rail” policy) are defined as follows:
is the corresponding energy price, is the amount of energy saved; is the unit price of carbon emissions control, is the reduction amount of carbon emissions; is the benefit from safety; is the benefit from reduction of road congestion; is the benefit from reduction of additional road investment and land use (In China, the land occupied by rail for undertaking one traffic unit is 1/19 of that of road. Meanwhile, this ratio is 1/5 in US. So, when road capacity is short, implementing the “Road to Rail” policy can generate land use value); is the operating financial loss caused by the policy for ports companies and road logistics enterprises; is the new investment and operating costs for new railway projects to increase capacity; is the additional item related logistics costs due to longer transport time, short-term incapacity delay, intermediate costs; is service-related cost due to a lower service levels and is the social cost; π is the net benefit of the “Road to Rail” policy, which is equal to the total benefits minus total costs.
Take the coal transport in Ordos, Inner Mongolia as an example to analyze the benefits and costs caused by the modal shift policy. The effects of “Road to Rail” policy are obvious in Ordos. In 2017, the sales volume of coal in Ordos was about 602.46 million tons, and the railway traffic volume was about 333.64 million tons, which accounted for 55.38%. In 2018, the sales volume of coal in Ordos was about 663.72 million tons, and the railway traffic volume increased to 373.22 million tons, whose proportion was 56.23%. The total sales volume of coal increased by 61.26 million tons, and railway traffic increased by 39.58 million tons. The increase in railway traffic volume exceeded the increase in sales volume of coal. See as following, the railway coal transport line and road transport line from Ordos to the east region of Ningxia Province are shown in Figure 3.
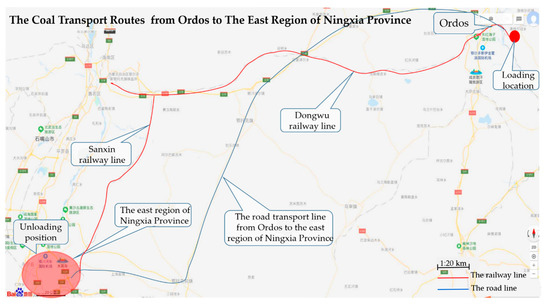
Figure 3.
The coal transport routes from Ordos to the east region of Ningxia Province. 1. The Sanxin railway line is from Sanbeiyangchang to Xinshanghai Miao, and it connects the Dongwu railway in the north to the Ningdong railway in the south. 2. Dongwu railway line is from Dongsheng of Ordos to Wuhai, Inner Mongolia.
There are 350 coal mines with an annual output of more than 1.5 million tons in Ordos. For the target to shift traffic from road to rail, Inner Mongolia Autonomous Region “Three-year action plan for Road to Rail” required that more than 80% coal mines with an annual output of more than 1.5 million tons would have railway industrial siding by the end of 2020 [34]. It means that Ordos will play an important role in the implementation of “Road to Rail” policy. In 2018, the traffic volume of coal shifted from road to rail is about 4 million tons in Ordos. We take the coal transport route from Ordos to East of Ningxia Province as an example to estimate the benefits and costs brought by the modal shift policy. The distance of road from Ordos to East of Ningxia Province is 450 km, and that is 510 km of railway. Due to the data availability, we mainly consider the benefits of energy saved and emissions reduction, and the costs of additional logistics cost by “Road to Rail” and new investment and operating costs for new railway projects.
6.2. The Effects of “Road to Rail” Policy: A Case in Ordos Region
The benefits brought by the policy are energy conservation and emissions reduction. We can calculate the energy consumption and carbon emissions for road and railway transport respectively when we take the coal transport route from Ordos to East of Ningxia Province as an example. The energy consumption and carbon emissions are calculated in Table 11.
Table 11.
The energy consumption and carbon emissions from Ordos to East of Ningxia Province.
In Table 12, the energy saving and emissions reduction effects brought by the modal shift in Ordos is that the energy consumption reduction is 68,817.48 TOE (It is approximately 98,312.65 tons of standard coal (1 TOE = 1.4286 tons of standard coal.)) and carbon emissions reduction is 126,960 tons. According to data from China Coal Resource Network, the annual unit averaged price of thermal coal with 5500 calories was 653.07 CNY in 2018, then the unit price of standard coal with 7000 calories was 831.18 CNY. The price for unit carbon emissions is different in China. There are seven major trading markets for carbon emissions in China, which are Beijing, Tianjin, Shanghai, Hubei, Guangzhou, Shenzhen, and Chongqing, and most of them are in the economic developed area or southeast coastal area. Ordos is located in the north-west region of China, and the “Road to Rail” policy is mainly for controlling the air pollution in Beijing. Thus, we used the price of Beijing Environment Exchange in 2018 to estimate the carbon emissions price in Ordos. From the website of Beijing Environment Exchange, the volume of carbon emissions in 2018 was 3,320,406 tons, and the turnover was 187,817,002.5 CNY, then we get the average price of carbon emissions was about 56.56 CNY (https://www.bjets.com.cn/article/jyxx/). As a result, the total environmental benefit brought by the modal shift policy was about 94.68 million CNY. The unit benefit from road safety improvement was 0.00321 CNY for per ton-kilometer, which is the standard regulated by Ministry of Housing and Urban-Rural Development of the People’s Republic of China (According to the “Case of economic evaluation of construction project” in 2006, the Ministry of Housing and Urban-Rural Development of the People’s Republic of China made the safety losses standard for road transport. The safety losses of road is 0.00321 CNY for per ton-km, and it assumes no incidents on railway).
Table 12.
The benefits from China’s modal shift policy in Ordos.
The costs of modal shift policy are mainly about the losses of ports and road freight enterprises, the investment cost of new railways, and additional social logistics costs. And the investment costs and social logistics costs are the long-term costs for the modal shift policy. For the availability of data, we mainly consider the investment costs and additional logistics costs in this paper. The cost of railway construction in Ordos varies from region to region, which is about 40 million CNY per kilometer in the eastern region and about 30 million CNY per kilometer in the central and western regions. A large number of railway projects need to be built in Inner Mongolia as the requirement of government, and the investment costs will become an important part of the policy.
The modal shift policy caused the traffic volume to shift from road to rail, which also increased freight rates and social logistics costs. We take the coal transport route from Ordos to East of Ningxia Province as an example to analyze the costs caused by “Road to Rail” policy. In the east region of Ningxia Province, the power plant needs coal as thermal coal to generate electricity, and the power plant has an industry railway line. In order to analyze the difference between with and without industry line, we set different scenarios to compare the costs.
(a) With one existing industry line linking one end of the railway trunk line
As shown in Table 13, with one industry line linking one end of the railway line, the railway freight transport cost of coal from the Dongsheng of Ordos to the east region of Ningxia Province is about 149.58 CNY per ton, because it can save a fee of short-distance road transport and loading or unloading with 20 CNY. While the road freight is about 120 CNY. In 2018, the coal shift volume was 4 million tons in Ordos. Then, the total transport cost of the road was 480 million CNY, and that was 598.32 million CNY for railway. Compared with the road, the transport cost of railway increased by 24.65%. The additional logistics cost was about 118.32 million CNY, which is as much as more than 1.25 times of the total environmental benefits brought by the modal shift policy, which was 94.68 million CNY based on the previous calculation.
Table 13.
The freight rates of coal transport line with one industry line in one end from Ordos to East of Ningxia Province.
(b) Without industry line in both ends of the railway trunk lines
Without industry line in both ends of the railway line, the railway freight rates of coal transport from the Dongsheng of Ordos to the east region of Ningxia Province is about 169.58 CNY per ton, and total transport cost of the railway is 678.32 million CNY, which increased by 41.32% compared with road. The additional logistics cost is about 198.32 million CNY, which is as much as more than 2.09 times of the total benefits brought by the road to the railway. The freight rates are shown in Table 14.
Table 14.
The freight rates of coal transport line without industry line in both ends from Ordos to East of Ningxia Province.
(c) Building a new railway (industry) line for 1.5 million tons initial traffic volume
For the requirement of the central government policy, all the companies with an annual bulk product output of more than 1.5 million tons need to construct railway industry line. The investment cost and operation cost for new railway industry line are the long-term and main costs for the modal shift policy. Given the fact that the power plant in the east region of Ningxia Province has an industry line system already, suppose only one new railway (industry) line in Ordos. We take Dongsheng–Wuhai and Baotou–Lanzhou linking line in Table 15 as an example to estimate the unit cost of new railway industry line. Its mileage is about 23 km and its unit construction cost is about 47 million CNY/km.
Table 15.
The costs of the planned new railway projects.
Based on the reality, 30% of the construction cost of new railway industry line comes from capital and 70% comes from bank loans. The annual interest rate of bank loan is about 6%, and the annual comprehensive depreciation rate for railway asset is 3%. Thus, we can see the costs in Table 16 that the capital is about 14.1 million CNY, and bank loan is about 32.9 million CNY. Moreover, the annual interest cost is about 1.974 million CNY, and the annual depreciation cost is 1.41 million CNY.
Table 16.
The investment and operation costs for a new railway industry line in Ordos.
The requirement of government is that the coal mines with an annual output of more than 1.5 million tons should construct new railway industry line. We consider two scenarios to analyze the operation cost for new railway industry line: the initial traffic volume is 1.5 million tons and the initial traffic volume is 5 million tons. The unit transport cost for new railway industry line for 1.5 million tons is shown in Table 17.
Table 17.
The unit transport cost of new railway industry line for 1.5 million tons.
As shown in Table 18, with new industry line for 1.5 million tons initial traffic volume, the railway freight rate of coal transport from the Dongsheng of Ordos to the east region of Ningxia Province is about 182.62 CNY per ton, and the road freight is about 120 CNY. The total transport cost of railway was 730.47 million CNY in 2018 in Ordos. Compared with the road, the transport cost of railway increased by 52.18%. The additional logistics cost is about 250.47 million CNY, which is as much as more than 2.65 times of the total environmental benefits brought by the modal shift policy.
Table 18.
The freight rates of coal transport with new industry line for 1.5 million tons initial traffic volume from Ordos to East of Ningxia Province.
(d) Building a new railway (industry) line for 5 million tons initial traffic volume
When the initial traffic volume is 5 million tons for new railway industry line, the full freight rate for industry line is three times lower than that with 1.5 million tons. The total railway freight rate is about 146.30 CNY. In this scenario, the total transport cost of railway is 585.19 million CNY, which increased by 21.91% compared with road. The additional logistics cost is about 105.19 million CNY, which is as much as more than 1.11 times of the total environmental benefits brought by the modal shift policy. The unit transport cost of new railway industry line for 5 million tons can been seen in Table 19, and the freight rates of coal transport with new industry line for 5 million tons initial traffic volume from Ordos to East of Ningxia Province can been seen in Table 20.
Table 19.
The unit transport cost of new railway industry line for 5 million tons.
Table 20.
The freight rates of coal transport with new industry line for 5 million tons initial traffic volume from Ordos to East of Ningxia Province.
The full freight rate equals the break-even freight rate multiplied by 23 km, and its unit is CNY/ton.
The additional cost in four scenarios is different, and the highest cost is to construct new railway industry line with initial traffic volume 1.5 million tons. As shown in Figure 4, the costs caused by modal shift policy in four scenarios are all higher than the benefits brought by the policy. The most effective method of implementing “Road to Rail” policy is to construct new railway industry line when the initial traffic volume is large enough, but the cost is expensive if the initial traffic volume is insufficient, such as 1.5 million tons. When the initial traffic volume is small, the railway with industry line is suitable and cost-effective for shifting the traffic volume from road. The railway without industry line will cause large additional transport cost losses.
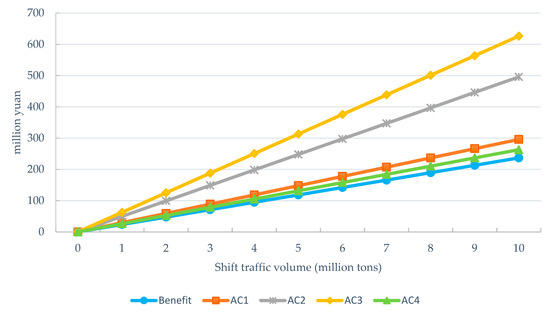
Figure 4.
The benefits and cost caused by “Road to Rail” policy in Ordos. 1. The benefit and costs are calculated on the basis on pervious analysis. 2. AC1 is the additional cost with one industry line in the one end of railway; AC2 is the additional cost without industry line in both ends of railway; AC3 is the additional cost with new railway industry line for 1.5 million tons initial traffic volume; AC4 is the additional cost with railway industry line for 5 million tons initial traffic volume.
According to the previous calculation, we get the slope of benefit line is 23.67, and the slope of AC4 (additional cost, AC4 is the additional cost with railway industry line for 5 million tons initial traffic volume) line is 26.3. With the shift traffic volume increasing, the benefit is always lower than AC4, which indicates the policies will lead to economic losses when achieving environment goals. The slope of benefit line depends on the unit price of carbon emissions, which is lower in China. In this paper, we use the price 56.56 CNY of Beijing Environment Exchange in 2018. If we use the 2015 World Bank economic price for carbon emissions of US dollar 30 per ton [35], then the slope would be larger than 27.58. It means that the benefits will exceed the AC4, and the policy can balance the economic growth and environment protection. However, the carbon emissions trade market in China is imperfect, and the market underestimates the price of carbon emissions.
Moreover, the road transport is more flexible and convenient. The railway not only needs to ask for the wagons and coordinate the vehicles, but also needs to guarantee large traffic volume. If the traffic volume is not stable and sufficient, it is more difficult to coordinate the vehicles for the consignors. Furthermore, the additional costs do not include the loss of ports companies and road logistics enterprises, the loss due to a lower service levels, and the social cost for inefficiency. If these costs are taken into consideration, the costs caused by policy will be larger. According to the current situation (the initial traffic volume of most coal miners is small and insufficient), the “Road to Rail” policy is more suitable for railways with industry lines in the ends.
In general, the current modal shift policies have had negative impacts on the economic development when they achieved environmental goals. Therefore, ensuring economic growth and taking environmental goals into account is a key point of the modal shift policy. The market tools to achieve modal shift are to be considered, and simply relying on administrative means will inevitably lead to economic inefficiency. Policies that only consider environmental protection goals and do not pay attention to economic effects will face many problems in the implementation process.
7. Conclusions and Recommendations
China’s current environmental pollution problem is serious, and the transport sector should play a significant role in carbon emissions reduction. By comparative analysis and scenario analysis, the article finds that road transport is the most energy consuming and most polluting mode among various modes of transport, and the railway transport has the lowest energy consumption and the least carbon emissions. Currently, from the cost-benefit analysis of the “Road to Rail” policy, we find that China’s “Road to Rail” policy has a positive effect on carbon emissions reduction, but it also increases the logistics cost and results in other economic and social losses, which has been partly proved in Ordos’s case. Therefore, how to realize “Road to Rail” has become a vital part of China’s current institutional reform and policy adjustment in the transport sector. In short, when implementing the modal shift policy, it is necessary to design a package of fair and reasonable transport and environmental policies in aim of balancing between environmental protection and economic development on the basis of China’s reality.
Firstly, with railway’s own advantages, China should promote railway instead of road. However, the low marketization level of China’s railway is to be blamed for the high transaction costs and inflexible operation in freight market. In the process of shifting road freight traffic to railway, it is necessary not only to curb the irrational growth and illegal transport of road, but also to break the monopoly structure of China Railways. China should use market mechanism to realize the reform of railway freight transport. Opening up the railway freight market, reducing the entering barriers, and attracting private enterprises to join in it are main ways to strengthen service capabilities of railway freight.
Secondly, lay a level of playing field between rail and road. It needs to formulate a corresponding legal framework to ensure not only the entry of private enterprises into the railway freight market, but also fair competition between different transport modes, especially focusing on overloading and over-clearance, which prevents road transport from reducing its costs in the illegal way. Meanwhile, it also requires the internalization of the external costs of different modes, such as the pollution, congestion, and safety costs.
Thirdly, how to balance the relationship between the economic development and environmental protection needs to be further explored. China’s current modal shift policy is “one size for all”, and this simple method of prohibiting truck to transport of coal is not very rational. The policy simply relies on administrative/rigid means to forbid the road transport for coal and other goods, and does not consider the economic losses and the increase of logistics costs, which does not meet the goals of sustainable development.
Therefore, the modal shift policy conducted by the government should be comprehensive and rational, which needs to balance the environmental and economic goals. The “one size for all” administrative policy is unable to achieve sustainable development of the environment, economy, and society. Encouraging cooperation between road and railway in various ways and giving full play to the advantages of road and railway will improve the logistics efficiency of the whole society. The appropriate modal shift policy not only can reduce carbon emissions in China, but will contribute to the world’s sustainable development as well.
In future, more works can be devoted to improve this topic, mainly because the environmental benefits and costs’ parameters on which the study has relied need further exploring in China and there is limited public data after implementing the policy. Moreover, the case in Ordos only reflects the situation in the Inner Mongolia region and cannot fully reflect the effects in the whole country. With the government continuing to implement the “Road to Rail” policy, a further study needs to be done to explore how to design the practical market mechanism to achieve policy goals.
Author Contributions
S.C., J.W. and Y.Z. conceived, designed, prepared and revised this paper together. All authors have read and agreed to the published version of the manuscript.
Funding
This research was funded by China Social Science Fund, grant number 2017ZDA084. The APC was funded by BJTU’s Fund of 2019JBM340.
Acknowledgments
The paper is supported by the China Social Science Fund (No.2017ZDA084) and BJTU’s Fund of 2019JBM340.
Conflicts of Interest
The authors declare no conflict of interest.
References
- International Energy Agency. CO2 Emissions from Fuel Combustion; IEA Report; IEA: Paris, France, 2017. [Google Scholar]
- Zhou, Y.; Li, M. Measurement and Correction of China’s Transport Carbon Emissions Based on IEA Statistical Caliber. J. Green Sci. Technol. 2017, 12, 264–268. [Google Scholar] [CrossRef]
- Fan, F. Study on the Impact Factors of Carbon Emissions and the Emissions Reduction Policy in Beijing. Ph.D. Thesis, China University of Geosciences (Beijing), Beijing, China, 2016. [Google Scholar]
- Yuan, M.; Meng, G. Exploring the driving factors of carbon dioxide emission from transport sector in Beijing-Tianjin-Hebei region. J. Clean. Prod. 2019, 226, 692–705. [Google Scholar] [CrossRef]
- Ding, X. Analysis of Carbon Emissions and Emissions Reduction Potential of China’s Transport Industry. Compr. Transp. 2012, 12, 20–26. [Google Scholar]
- Lv, Q.; Liu, H.; Yang, D.; Liu, H. Effects of urbanization on freight transport carbon emissions in China: Common characteristics and regional disparity. J. Clean. Prod. 2019, 211, 481–489. [Google Scholar] [CrossRef]
- Wei, Q.; Zhao, S.; Xiao, W. A Quantitative Analysis of Carbon Emissions Reduction Ability of Transport Structure Optimization in China. J. Transp. Syst. Eng. Inf. Technol. 2013, 13, 10–17. [Google Scholar] [CrossRef]
- Pang, S. The Analysis of Impact on Transport Energy Consumption by Transport Structure. Ph.D. Thesis, Beijing Jiaotong University, Beijing, China, 2017. [Google Scholar]
- Liu, J. Energy Saving Potential and Carbon Emissions Prediction for the Transport Sector in China. Resour. Sci. 2011, 33, 640–646. [Google Scholar]
- Yuan, C.; Zhang, Q.; Rui, X.; Jiao, P. Spatiotemporal Evolution and Difference of Transport Carbon Emissions in China. Acta Sci. Circumstantiae 2016, 36, 4555–4562. [Google Scholar] [CrossRef]
- Yang, W.; Wang, W.; Ouyang, S. The influencing factors and spatial spillover effects of CO2 emissions from transport in China. Sci. Total Environ. 2019, 696, 133900. [Google Scholar] [CrossRef]
- Cai, J.; Xing, L.; Zhou, Y.; Wei, B.; Wang, S. Effect of Transport Structure Change on CO2 Emissions. Oper. Res. Manag. Sci. 2017, 26, 110–116. [Google Scholar]
- Yang, Q.; Zhu, R.; Zhao, X. Calculation Decoupling Analysis and Scenario Prediction of Carbon Emissions of Transport in China. J. Chang. Univ. Nat. Sci. Ed. 2014, 34, 77–83. [Google Scholar] [CrossRef]
- Ke, S.; Wang, Y.; Chen, Y.; Liu, A. Carbon Emissions and Reduction Scenarios of Transport in Beijing. China Popul. Resour. Environ. 2015, 25, 81–88. [Google Scholar]
- Chen, X.; Shuai, C.; Wu, Y.; Zhang, Y. Analysis on the carbon emission peaks of China’s industrial, building, transport and agricultural sectors. Sci. Total Environ. 2020, 709, 135768. [Google Scholar] [CrossRef] [PubMed]
- Ding, Y. Rational Division of Labour and Coordinated Development of Railway and Highway Logistics Transport. Railw. Transp. Econ. 2016, 11, 21–25. [Google Scholar] [CrossRef]
- Zhang, X.; Kang, F.; Ge, J.; Liu, J.; Wang, P. Discussion on Countermeasures of Developing Railway Commercial Automobile Logistics under Highway Overload Control. Railw. Transp. Econ. 2017, 3, 4. [Google Scholar] [CrossRef]
- Solaymani, S. CO2 emissions patterns in 7 top carbon emitter economies: The case of transport sector. Energy 2019, 168, 989–1001. [Google Scholar] [CrossRef]
- Hu, J.; Wood, R.; Tukker, A.; Boonman, H.; Boer, B. Global transport emissions in the Swedish carbon footprint. J. Clean. Prod. 2019, 226, 210–220. [Google Scholar] [CrossRef]
- Fumio, K. Japanese Railways and Their Outlook: An Environmental Perspective. Jpn. Railw. Transp. Rev. 2009, 51, 12–17. [Google Scholar]
- Ministry of Environment, Ecology, Sustainable Development, Transport and Housing. National Commitment to Rail Freight Transport; Ministry of Environment, Ecology, Sustainable Development, Transport and Housing: Paris, France, 2011.
- Association of American Railroads. Rail Intermodal Keeps America Moving; Association of American Railroads: Washington, DC, USA, 2013. [Google Scholar]
- Marsden, G.; Rye, T. The Governance of Transport and Climate Change. J. Trans. Geogr. 2010, 18, 669–678. [Google Scholar] [CrossRef]
- European Environment Agency. Transport and Environment: On the Way to a New Common Transport Policy; EEA Report; EEA: Copenhagen, Denmark, 2007. [Google Scholar]
- Yang, W.; Li, T.; Cao, X. Examining the impacts of socio-economic factors, urban form and transport development on CO2 emissions from transport in China: A panel data analysis of China’s provinces. Habitat Int. 2015, 49, 212–220. [Google Scholar] [CrossRef]
- International Union of Railways. Energy Consumption and CO2 Emissions. International Energy Agency and International Union of Railways; IEA: Pairs, France, 2017. [Google Scholar]
- National Bureau of Statistics. China Statistical Yearbook; China Statistics Press: Beijing, China, 1978–2016.
- Ministry of Ecology and Environment of the People’s Republic of China; National Development and Reform Commission; Ministry of Finance of the People’s Republic of China; Local Governments. Work Plan for Air Pollution Prevention and Control in Beijing, Tianjin and Hebei and Surrounding Areas in 2017; Ministry of Ecology and Environment of the People’s Republic of China: Beijing, China, 2017.
- Ministry of Transport of the People’s Republic of China. Highway Management Regulations for Over-Clearance Transport Vehicles; Ministry of Transport of the People’s Republic of China: Beijing, China, 2016.
- State Council. Three-Year Action Plan for Advancing Modal Shift (2018–2020); State Council: Beijing, China, 2018.
- Ministry of Ecology and Environment of the People’s Republic of China; National Development and Reform Commission; Ministry of Transport of the People’s Republic of China. Work Plan for Comprehensive Treatment of Air Pollution in Beijing-Tianjin-Hebei and Surrounding Areas in the Autumn and Winter of 2018–2019; Ministry of Ecology and Environment of the People’s Republic of China, National Development and Reform Commission and Ministry of Transport of the People’s Republic of China: Beijing, China, 2018.
- Ji, P. Forbidding Road Transport of Coal Accelerates the “Highway to Railway” but Harms the Semi-trailer Production Enterprise in the Beijing-Tianjin-Hebei region. Spec. Purp. Veh. 2018, 7, 28–32. [Google Scholar]
- Chen, S.; Kang, Z.; Wu, J. The International Comparison of Environmental policy in the transport and its enlightenment on the China’s Modal Shift Policy. Railw. Transp. Econ. 2018, 40, 33–37. [Google Scholar] [CrossRef]
- Inner Mongolia Autonomous Region Development and Reform Commission. Inner Mongolia Autonomous Region Three-Year Action Plan for “Road to Rail”; Inner Mongolia Autonomous Region Development and Reform Commission: Hohhot, China, 2019. [Google Scholar]
- International Bank for Reconstruction and Development. China’s High-Speed Rail Development; International Bank for Reconstruction and Development: Washington, DC, USA, 2019; p. 70. [Google Scholar]


© 2020 by the authors. Licensee MDPI, Basel, Switzerland. This article is an open access article distributed under the terms and conditions of the Creative Commons Attribution (CC BY) license (http://creativecommons.org/licenses/by/4.0/).