Article

Assessing the Potential Conflict Occurrence Due to Metropolitan Transportation Planning: A Proposed Quantitative Approach

by
Athanasios-Alexandru Gavrilidis
,
Andreea Nita
* and
Mihaita-Iulian Niculae
Center for Environmental Research and Impact Studies, University of Bucharest, 030018 Bucharest, Romania
*
Author to whom correspondence should be addressed.
Sustainability 2020, 12(2), 527; https://doi.org/10.3390/su12020527
Submission received: 30 November 2019 / Revised: 5 January 2020 / Accepted: 8 January 2020 / Published: 10 January 2020
(This article belongs to the Special Issue Dealing with Environmental Conflicts)

Abstract

:
Large urban settlements are being organized in metropolitan areas, with a polarizing city influencing and shaping the landscape of the hinterland. Transport infrastructure networks are the main vectors for the permanent flux of resources, and these exchanges should be maintained undisturbed. A poor transportation network impedes the continuity of these flows, causing unsatisfaction, ultimately generating planning-based conflicts within metropolitan zones. This study aims in assessing the potential occurrence of metropolitan conflicts generated by the transportation network design. We used a quantitative approach based on a set of new proposed indexes. The methods were applied on nine metropolitan zones from Romania. The results show that each metropolitan zone has specific potential for conflict occurrence. The higher potential was recorded within the more recent established metropolitan zones. Our results raise the question on whether the Romanian metropolitan zones are fully functional and worthy of this status. The study provides a useful and usable tool in assessing the effectiveness of the transportation networks within metropolitan areas, establishing the potential conflict occurrence and it provides interesting insights about the metropolitan transportation issues, raising red flags toward local and regional decision makers and planners.

1. Introduction

Contemporary human society lies on the continuous flow of resources, information, and knowledge. However, despite the global interlinkage of human communities, most of these resources are concentrated in highly urbanized areas that keep relentlessly growing [1]. Changes from natural and seminatural landscape into urbanized environments have shaped wide urban settlements, characterized by high population densities and large built areas [2,3,4]. The dawn of the Fourth Industrial Revolution [5] has reshaped the structure and functionality of the traditional types of urban settlements through the emergence of rural depopulation [6], shrinkage of small and medium sized cities [7], and sprawling pattern developments [8,9].
Resources, goods, jobs, or services are scattered throughout the territory and need to be accessible for population in exchange for a high effectiveness of urban settlements [10]. Therefore, urban structure and form should provide appropriate ground for efficient mobility networks, allowing access to various types of resources. However, in the context of volatile planning system and procedures, the dynamic of urban structure and form can be unpredictable, affecting the mobility flows within [11].
The constraint of access to the demanded and needed types of resources cause dissatisfaction among people, that usually lead to local, regional, or global conflicts. The occurrence of these type of conflicts are diminished or enhanced by territorial managers and local authorities, through planning strategies. Most of the conflicts arising within human settlements are rooted in the planning approaches or the lack of them [12]. Whether we refer to conflicts generated by the association of incompatible functions [13,14,15,16], pollution effects [17], nature conservation actions [18], land ownership [19,20] or limited accessibility levels [21], they are all directly or indirectly rooted in the planning systems.
In this study we bring into spotlight the conflicts induced by the design of the transportation network. Ganciu et al. [22] emphasize that services distribution in a territory generates daily commuting flows, significantly influencing the territory’s development patterns, causing congestions and discomfort in large areas. Within the context of rapidly urban expansion, Zhao [23] points out that a fundamental aspect of planning policies must take into account that urban growth management should be efficiently implemented to facilitate changes in the urban form for the sake of sustainable and qualitative transport networks’ development. Many studies have focused on the public transportation system, emphasizing how it can strongly contribute to the sustainability of urban settings [10,24]. The concerns regarding public transportation are relevant, as more urban environments are overcrowded, and distances are getting wider in terms of travel time [25]. The shape, density and growth of a transportation network determine changes in property values [26,27,28], exposure levels to air and noise pollution [24,29], accessibility degree to private or public services [30,31], or sprawling patterns [21,32]. Thus, the design of the mobility networks within human settlements can influence their livability levels, unfunctional networks conducting to public anger and eventually to planning-based conflicts.
Transportation efficiency is dependent on the settlement’s structure and shape. Policy makers have tried to establish the perfect mean of governance for the spreading urban settlements. Available land, as well as undisturbed environmental quality are vital assets for overcrowded cities [11]. To reach these assets, metropolitan zones were set around major cities. The most common structure of a metropolitan zones consists of a polarizing city surrounded by polarized settlements, such as medium or small sized cities and rural areas [3]. However, some metropolitan zones can expose polycentric patterns, where there are more than one polarizing urban core [22]. In Europe, the term for such urbanized clusters was established by the European Union in collaboration with the OECD as metropolitan areas, represented by functional urban areas (FUA), consisting of a city with its commuting zone, counting a minimum of 250,000 inhabitants [33]. The metropolitan structures are supposed to be based on symbiotic relations between the urban cores and the hinterland, in which each side provides the required resources for the other (e.g., jobs, higher quality services or access to the markets for the settlements in the hinterland and available land, improved environmental quality or leisure areas for the city core). The evolution and decay of human settlements have been always linked with the transportation networks, as most modern cities have flourished due to their position on strategic transportation routes. Therefore, metropolitan functionality is relying on the uninterrupted flux and exchanges between its components [33,34].
Through this study we aim to assess if the transportation planning strategies may lead to planning-based conflicts within metropolitan areas. In reaching our goal we have designed a methodological framework to help us assess the potential conflict occurrence due to transportation infrastructure planning in Romanian metropolitan areas. Within the methodological framework we proposed several tools for (1) analyzing the current situation of the metropolitan transportation networks; (2) assessing the level of collaboration between different actors from different levels for enhancing the accessibility towards private and public services; and (3) assessing the political stability degree within the metropolitan areas.

2. Materials and Methods

2.1. Case Studies

We analyzed nine metropolitan areas (legally defined as metropolitan zones [35]) from Romania (Figure 1), covering 5 out of 8 Romania’s development regions (NUTS II level) [36]. The analyzed metropolitan zones are diverse in terms of area, urbanization, and demographic features (Figure 1 and Table 1). All the selected metropolitan zones have a share of urban population above 70%, which is to be expected for this type of territorial administration. However, three out of the nine metropolitan zones have only one city within their limits, represented by the core urban centers (MZ_1, MZ_2 and MZ_6). The other six metropolitan zones have other urban settlements besides their urban cores contributing to the share of urban population per metropolitan zone. For instance, MZ_3 Brasov has another 6 urban areas besides its core city, and it has the higher urban population share. Nevertheless, we need to emphasize that the share of urban population considers the population living in settlement recognized as being urban. However, some of these urban areas are profoundly characterized by rural landscape and rural quality of living. Thus, the share of urban population could be a misleading index if we view it as projecting the amount of population having access to an urban way of living.
As an overview of the economies characterizing the selected metropolitan zones, we compiled a chart, highlighting the main economic sectors. The presented data are based on the average number of employees per sector out of the total metropolitan population and the share of enterprises per sector out of the total official enterprises within the metropolitan zones (Figure 2). The overall situation for the nine metropolitan zones shows that commercial activities detached as the top economic sector in terms of employees and enterprises amount. They are by far followed by the manufacture industries in terms of employees number and by scientific and technical activities in terms of number of registered businesses. These data emphasize that the metropolitan economies are based on consumption, as the commercial sector along with the restaurant and hotel activities sum 34.37% of the total business taking place in the selected metropolitan areas, while the production activities such as different industries and agriculture sum only 12.26%.
Romanian metropolitan zones have their legal bases within Law 351/2011 and Law 190/2019 [35,37] in which the metropolitan zones are considered to contribute to the balanced development of the Romanian capital and the cities ranked I and II. The metropolitan zones should enhance the complementarities between the members and the decision makers interested in developing the territory. Legal acts emphasize that for the establishment of metropolitan zones, they should include the polarizing city and the settlements in its commuting areas, within a limit of 30 km. This legal provision is slightly ambiguous and can lead to diverse interpretation, as the 30 km limits is not explained how is calculated (it can be the distance between the core urban area and the residency settlements of the other administrative units within the metropolitan area). Romanian administrative units, especially rural ones, are consisted of several distinct settlements or villages, some of them being remote and difficult to reach. Furthermore, it is not clear if this distance relates with ground distances, it is based on the existing transport infrastructure, or it represents the distances in straight line. This regulation flaw may lead to malfunctions within the metropolitan area. Therefore, transportation infrastructure is an important feature to be considered when analyzing metropolitan functionality as accessibility towards private and public services is a key aspect for sustainable metropolitan planning.

2.2. Analyzing the Status of the Metropolitan Transportation Network

Determining the status of the transportation infrastructure in the selected metropolitan zones is a major objective of our analysis. By doing this, we identify potential issues that the metropolitan zones can have in terms of accessibility. Through our analysis we developed three indexes to help us assess the mobility design of the metropolitan zones: Transportation Infrastructure Complexity Index (TIC), Sustainability of Transportation Infrastructure Index (STI), and Public Transport Coverage Index (PTC).

2.2.1. Assessing the Complexity of Transportation Infrastructure

We used the road and railway data from Open Street Map (OSM) and we reclassified the default types based on their representation in the terrain, resulting seven classes for road infrastructure and two classes for railways (Table 2). As the OSM is not an official recognized database regarding transport infrastructures, we cross checked the OSM shapefiles with aerial imagery and the base-map of the Romanian road networks. We included a multiplication factor (s) for each of the resulting classes, calculated based on the maximum speed limit that these transportation infrastructures are suited for.
After the reclassification, we calculated the Transportation Infrastructure Complexity Index (TIC) for each territorial administrative unit (TAU) within each metropolitan zone selected for our study, using the following proposed formula (formula (1)):
TIC = ( L tn × s tn T il ) N t + ( N t N lt )
where:
  • Ltn = the length of the infrastructure type n within the territorial administrative unit (TAU);
  • stn = the multiplication factor s for the infrastructure type tn (see Table 2);
  • Til = total transport infrastructure length within the territorial administrative unit (TAU);
  • Nt = number of infrastructure types, in our case Nt = 9, as we have 9 infrastructure types after reclassification;
  • Nlt = number of lacking infrastructure types within the territorial administrative unit (TAU).
By applying formula 1, the result will be a float number where the integer value will range from 1 to 9. If the integer is higher, it means that the TAU has more types of transport infrastructures and if the decimals are higher it means that the TAU has a considerable length of transport infrastructures suited for high speed travels (e.g., TIC = 4.62 means the TAU has 4 types of transport infrastructure and a slightly long transportation network suited for high speed travels).

2.2.2. Assessing the Sustainability of the Transportation Infrastructure

We considered as sustainable the transportation infrastructure designated for travels without using fossil-based fuels. Thus, starting from the reclassification of the OSM types presented above, we considered as sustainable infrastructure type the cycleways, footways, railways and tramways. For a quantitative approach we proposed an index to quantify the sustainability degree of the transportation infrastructure of each TAU within the selected metropolitan zones. For more accurate results we established a division factor (d) for the cycleways (dcw = 2) and footways (dfw = 3). These division factors were established based on the average speed used for motion on these infrastructure types. Therefore, the Sustainability of Transport Infrastructure Index (STI) was calculated using the following proposed formula (formula (2)):
STI = ( Cw d Cw ) + ( Fw d Fw ) + Rw + Tw Aw + Mtw + Mw + Rr + Lr
where:
  • Cw, Fw, Rw, Tw = the length of cycleways, footways, railways and tramways within the territorial administrative unit (TAU);
  • dCw and dFw = the division factor for cycleways, respectively footways;
  • Aw, Mtw, Mw, Rr, Lr = the length of accessways, motorways, mainways, regional roads and local roads within the territorial administrative unit (TAU).
STI values usually range between 0 and 1, smaller values meaning a less sustainable transportation network and values closer to 1 indicate higher sustainability of the transportation network. Of course, STI can exceed the value of 1, in this case, meaning that the length of the transportation infrastructure designed for non-polluting vehicles is higher than the length of the traditional transportation infrastructure. However, this situation may occur in a few situations and mainly in small cities.

2.2.3. Assessing the Passenger Transportation Coverage Degree within the Metropolitan Areas

For completing the analysis regarding the current status of the mobility networks, we looked at the passenger transportation system from the selected metropolitan zones as it is one of the key features ensuring livability in metropolitan areas. We focused only at the on-road passenger transportation network, connecting the metropolitan members. We compiled a database using the bus routes linking all the metropolitan settlements. As raw data we used the number of travels from one member to another. We have extracted the data from the national web platform of private transportation operators [38]. This is the most used platform by commuters as there is no other alternative for commuting since there are no longer state-owned, on-road transportation operators in Romania. After completing the database, we used a network analysis using UCINET [39] to evaluate the complexity of public transportation network for each analyzed metropolitan zone. We have made matrices including every metropolitan member for each of the nine selected metropolitan zones and introduces the number of travels from one member to another per day.
Next, we used the data resulted from the social network analysis to compile the Passenger Transport Coverage Index (PTC), calculated as follows (formula (3)):
PTC =   ( C TAU T TAU ) · ND
where:
  • CTAU = Number of territorial administrative units (TAU) included in the private transportation network;
  • TTAU = Total territorial administrative units (TAU) included in the metropolitan zone (MZ);
  • ND = net density value resulted from the social network analysis.
The proposed index records values ranging from 0 to 1, PTC values equal to 1 meaning that all the metropolitan members are included in the transportation operators’ network, thus all inhabitants are exposed to higher mobility levels within the metropolitan zones. Lower PTC values (PTC < 1) reflect that some settlements included in the metropolitan zones are skipped by the transportation operators and are subject to the usage of private cars or hitchhiking to reach the existing network. Unlike the other two proposed indexes which were calculated at a TAU level, PTC is calculated at a metropolitan zone level.
We have focused our attention on this mean of public transportation as it is the most popular throughout the country and because the alternative is provided by train transportation which, within the selected metropolitan zones, have a very poor developed network. Data provided in Table 3, show that there is an average of 2.63 metropolitan settlement for 1 train station, out of the total train stations within the metropolitan zones and an average of 6.80 metropolitan settlements for 1 main station, in which all types of passenger trains stop. If we are to calculate the density of train station per 10 km2, the results will show that there is an overall average density of 0.069 train stations/10 km2 and an average density of 0.025 main train stations/10 km2 for all the selected metropolitan zones. Thus, the low coverage of the railroad networks made the private passenger road-transportation operators flourish, becoming the most popular inter-urban mean of public transport.

2.3. Assessing the Collaboration Degree between Actors for Enhancing the Metropolitan Mobility Levels

Planning a sustainable metropolitan mobility network requires the appliance of participatory planning principles and the involvement of different actors that are the direct or indirect beneficiaries of the transportation network. Therefore, we have conducted an analysis in which we assessed if actors from different levels are collaborating to enhance the accessibility towards the transportation network of the metropolitan residents and if this aspect represents a priority in their collaboration. For this analysis we applied a survey to the local authorities (city and town halls) within the selected metropolitan zones in which we assessed if they collaborate with one another and with other actors from the private sector or from regional and national levels (Table S1) to enhance the accessibility levels of the population towards 12 public and private services, including transportation. The survey was sent via e-mail, mail and in-person to all the 152 town halls from the selected metropolitan zones. The survey had attached a note in which it was stated that it complies the European and national regulations on personal data processing, and had attached an official request of data, as it is stipulated in Law 544/2001 [40]. In this way the public authorities are obliged to provide an answer to your request within 30 working days. After validating the received answers, the resulting database was used to create matrices for the two-mode networks investigated [41], where the nodes are the services (i.e., cultural, leisure, green spaces, waste management, transport, education, health, security etc.) and the actors (see Table S1) that collaborate to improve the accessibility towards these services. For the resulted networks, we calculated the cohesion measures and the centrality metrics [42] to identify the collaboration patterns of the network structure.
We focused on determining the position of transportation issues within the collaboration network and to determine if, based on the social network analysis, the governance of the metropolitan zones is centralized, decentralized or balanced. For doing that we used the Eigenvector Centrality values resulted from the network analysis, which shows the node’s influence by counting the number of links it has to other nodes within the network, and takes into account how well connected the specific node is and how many links their connection have. Thus, using this centrality metric we were able to determine how many actors collaborate on the metropolitan transportation issues and especially their influence in the collaborative process. Furthermore, we could determine what type of actors and from what levels are more involved in collaborations regarding the accessibility improvement of the metropolitan population towards several private and public services.
The results of this assessment include the overall situation of the selected metropolitan zones. Thus, they apply to each of the metropolitan zones.

2.4. Establishing Political Stability within the Metropolitan Zones

Metropolitan governance, including mobility network planning, is strongly dependent on the policy makers who are represented by mayors, elected by the population. Therefore, the final step before establishing the potential conflict occurrence within metropolitan zones was to evaluate the political stability within the selected case study areas. For doing that, we used the databases provided by the Elections Permanent Authority (AEP) and extracted data regarding the persons and political parties that won the local election since 2004 [43]. We monitored the period between 2004 and 2019, summing four election (in 2004, 2008, 2012 and 2016).
Using the resulting database, we processed the data and calculated the Political Stability Index (PSI), based on the number of times an individual was elected as mayor and the number of times a specific party was represented by the elected mayor. The proposed main algorithm of calculating PSI is (formula (4)):
PSI =   ( N p × p c N e N i )
where:
  • Np = number of parties represented by the elected mayor throughout the analyzed period (15 years—4 election times);
  • pc = party coefficient p, established as follows:
    • 1 party wining in 4 election times: pc = 2.5;
    • 2 parties winning in 4 election times: pc = 5;
    • 3 parties winning in 4 election times: pc = 7.5;
    • 4 parties winning in 4 election times: pc = 10;
  • Ne = number of elections held in the analyzed period
  • Ni = number of individuals elected for mayor during the analyzed period.
However, we identified situations in which the number of individuals elected as mayor (Ni) was smaller than the number of political parties represented by the elected mayor (Np), and in this case it meant that an individual switched from one party to another in order to increase his/her chances of winning the elections. This case was tagged as an opportunistic political behavior and PSI was calculated as follows (formula (5)):
P S I N i < N p =   ( N p p c N e N i ) + ( N p N i )
By using formula (5), the PSI values for our case studies are rigid, each possible scenario projecting its specific PSI value. PSI was calculated for each TAU within the metropolitan zones and its values were interpreted according to the scale emphasized in Table 4.

2.5. Assessment Framework for Establishing the Potential Conflict Occurrence within the Metropolitan Zones

The scope of our study was to determine the degree in which the mobility issues can conduct to planning based conflicts in metropolitan zones. Thus, we developed an assessment framework in which we compiled our results and established the potential conflict occurrence in each of the nine selected metropolitan zones using a three-level interpretation scale where 1 = low potential of conflict occurrence; 2 = medium potential of conflict occurrence; 3 = high potential of conflict occurrence (Table 5).
The established framework was used for each of the nine metropolitan zones, where the only constant values were the ones referring to collaboration level and priority of transportation issues in the collaboration network.

3. Results

3.1. Existing Status of the Metropolitan Transportation Network

After calculating the Transportation Infrastructure Complexity Index (TIC) for each administrative unit within the selected metropolitan zones, we averaged the values to project the situation for the entire metropolitan zones. The results show that eight metropolitan zones have TIC values projecting a medium complexity level of their existing transport infrastructure type, while one metropolitan zone (MZ_5—Constanța) has a high complexity of infrastructure types (Figure 3). TIC values could be also spatially represented for each administrative unit, showing that MZ_1—Iași and MZ_3—Brașov have one member with low complexity of transport infrastructures (Figure S1).
The second calculated index for establishing the current transportation network status was the Sustainability of Transport Infrastructure (STI). Again, the index was calculated for each administrative unit within the metropolitan zones and the values were averaged to project the situation at a metropolitan level. In this case, the results show that there is not a similar pattern across the selected metropolitan zones. Three metropolitan zones are characterized by low sustainability levels of the transport infrastructure network (MZ_4—Târgu-Mureș; MZ_8—Botoșani, and MZ_9— Baia-Mare) and one metropolitan zone recorded a STI value that projects its transport network as more sustainable (MZ_2—Oradea). All other five metropolitan zones have STI values showing an average degree of transport network sustainability (Figure 4). STI values were also mapped for each metropolitan member, as in the case of TIC. It interesting to observe the situation of the core urban settlement of each metropolitan zones. The case of MZ_2—Oradea, which is the only metropolitan zone with a STI value showing a higher sustainability of the transportation network, is one to focus on, as its core city recorded a STI value revealing an unsustainable transportation infrastructure (Figure S2).
Moving forward, we calculated the cohesion measures for each metropolitan zone taking into consideration one-mode networks that envisage how each metropolitan member is connected at the passenger transportation network of private operators within each case study area. The results of the cohesion metrics are emphasized in Table 6 showing the cohesion measures for each transport metropolitan zone. It can be noticed that MZ_9 has the highest average degree, showing a larger connectivity between the different areas of the metropolitan zone, while the others have less than 3 average degree. This fact is confirmed also by the network density values, which show that 43% of all the possible ties are present in the MZ_9 case, although MZ_7 has the highest number of localities within the metropolitan zone, followed by MZ_6, and MZ_5 and MZ_1. These results were plotted for each metropolitan zone for visually emphasizing the complexity of the passenger transportation network within each metropolitan zone (Figure S3).
As we mentioned in the Materials and Methods section, we compiled an index revealing the Passenger Transportation Cover (PTC) using the net density values from the social network analysis. The results revealed that all metropolitan zone have a poor passenger transportation network, none of the PTC values being placed above the low PTC threshold (Figure 5).

3.2. Collaboration Degree between Actors for Enhancing the Metropolitan Mobility Levels

We have recorded a survey answer rate of 23.68%, (meaning 36 out of 152 town halls took part at the survey). In the beginning of the study we aimed in reaching an answer rate of at least 30%. Despite the fact that we have waited for five months, time in which we have sent one reminder, only one town hall sent back a refusal to complete the survey, arguing that the institution doesn’t own the information we require, even though we have required a perception. From the other 115 town halls, not answering to our request we have not received any motivation for doing so, despite de legal bound to provide an answer within a 30 working days period. However, we used the received answer and moved on with the analysis.
The social network analysis results show that, according to the local authorities’ answers, metropolitan transportation issues are placed in a central position within the collaboration network between different actors from different levels (Figure 6). Furthermore, the collaboration for metropolitan issues is established mainly between local actors, followed by regional, private and national actors, meaning a decentralized approach in metropolitan management.
The network analysis was based on the response given by 30% of the total local authorities from the nine metropolitan zones. For a better understanding of the importance given by the actors to metropolitan transportation issues, we calculated Eigenvector Centrality for each of the public or private services being subject to the survey, and presented the results using a Pareto plot (Figure 7). The results show that transportation issues are included in the collaboration of more than 80% of the actors mentioned in the survey, meaning that this issue is among the priorities of the metropolitan governing actors.

3.3. Political Stability within the Metropolitan Zones

The political stability assessment within the metropolitan zones was estimated using Political Stability Index (PSI). The index was calculated for each administrative unit and by averaging the results at a metropolitan level we were able to provide an overview for each of the nine metropolitan zones. The results revealed that all analyzed metropolitan zones are characterized by strong political stability (Figure 8), meaning that political turmoil couldn’t affect the development of transport infrastructure within the metropolitan zones. For a more detailed representation of the PSI results, we mapped the values for each metropolitan zone (Figure S4). The results show that MZ_1 and MZ_7 have members characterized by opportunistic political behavior. This can be interpreted as a lack of political principles in policy making, but on the other hand it represents a strong trust of the voters in individuals, as they reconfirmed them in the mayor position. Another interesting aspect is that MZ_6 and MZ_8 have each one a member characterized by political instability, meaning that those members could be untrustworthy when developing the planning strategies for the metropolitan zone. These situations could also be explained through a lack of confidence from the local population towards their governing leaders, meaning that those individuals have failed to fulfill their demands and needs.

3.4. Potential Conflict Occurrence within the Metropolitan Zones

After compiling all results, we were able to establish whether there is reasonable evidence that a transportation planning-based conflict can occur within the selected metropolitan zones. Results show that all metropolitan zones have an average potential of conflict occurrence rooted in the mobility network design (Table 7). The youngest metropolitan areas, MZ_8 and MZ_9 are recording high potential of conflict occurrence based on their transportation network issues. This could be considered a normal score given the fact that the metropolitan status is relatively young and once the proper management mechanism is put in motion the scores may decrease. However, a different explanation applies for MZ_4, which has a metropolitan status since 2006, and the management mechanism should have been functional and able to improve the transportation network design within the metropolitan zone.

4. Discussion

The main outcome of our study consists of the proposed methodological framework used to determine the potential conflict occurrence generated by the mobility networks within metropolitan areas. Comparing with other methodological frameworks used to assess the transportation networks, the one proposed through this study has a modular characteristic, meaning that every single analysis tool can be extracted and integrated into other methodological approaches. The current study provides a quantitative analysis alternative to potential conflict assessments using qualitative and sociological methods [44].
Transportation infrastructure complexity was assessed as multiple motion types provide alternatives in terms of speed or mean of travel for the users. However, a high complexity of transport infrastructure doesn’t imply an efficient mobility network design. Different types of transport infrastructure should be complementary, not exclusive for designing an effective network [45]. Niță et al. [46] conducted an assessment regarding the cycleways design in Bucharest concluding that it is not enough to design an infrastructure type, but it should also determine an increase of connectivity within the networks. This means that an effective planning of transportation networks should consider, besides infrastructure’s typology, what functions or structures it connects.
Studies focused on transport infrastructure rarely address the issue of complexity, being more interested in efficiency evaluation. However, for the Romanian situation the complexity of the transport infrastructure is a thorny subject as the European Commission has placed Romania last in the 2018 ranking of road quality and among the last three countries in the same years ranking regarding the efficiency of train services [47]. Additionally, Bulai and Ursu [48] emphasized that low road quality affects travel costs in Romania, while Shepherd and Wilson [49] emphasized that the economies from Albania, Hungary, and Romania are strongly deprived of economic growth due to poor transportation networks. The low complexity of transportation infrastructure, especially the lack of motorways became the subject of national level conflicts, springing in February 2019 when a local businessman from the Romanian historical region of Moldova protested against the politicians that ruled the country since the fall of communism, as they had failed to initiate any project of motorway construction in this part of the country. The peculiar way of the businessman’s choice of protest, by constructing one meter of motorway using his own money launched a national protest movement under the slogan #ȘÎeu, which was rapidly spread through social media and transformed in a national protest against the Government in office at that time. National and foreign companies, as well as other politicians, including the President of the Republic manifested their support for the protesters [50,51]. Thus, as our results have showed, the analyzed metropolitan areas are characterized by an average complexity of transport infrastructure, but our assessment has not included quality indicators of the infrastructures. However, our results emphasize that, at least at metropolitan levels, the transportation infrastructures are not completely missing, and they need further refurbishment and development.
Studies of other researchers addressing the issue of mobility networks within urbanized settlements have analyzed the sustainability levels of the transport infrastructure. Kołoś and Taczanowski [29] highlighted that the increasingly negative effects of car usage are fast creating a need for a means of public transport that is not only separated from street traffic, but that it is also effective and environmentally friendly, proposing light rail transportation as such an alternative. While developing our Sustainability Transport Infrastructure Index (STI) we considered railways and tramways as the most sustainable types of transport infrastructure and designed the formula to be able to emphasize the amount of these types of infrastructures within the metropolitan settlements. Besides a low environmental impact generated by the users of such infrastructure, Cloutier et al. [52] state that alternative transportation can enhance the happiness levels of a community. Our results suggested that some Romanian metropolitan zones failed to record satisfying STI values, meaning that their residents are forced to use traditional means of transportation, which according to Cloutier et al. decrease the quality of life levels. This proved to be another useful tool to assess whether the metropolitan transportation network can represent a source of dissatisfaction, further generating potential conflicts. These assumptions are also endorsed by Alonso Raposo et al. [53] and the European Commission [54] by establishing their goals on developing a fully sustainable mobility network by decreasing the oil consumption for transportation at EU levels. If the current reality doesn’t change, then it can project a potential institutional conflict between EU and Romanian national bodies.
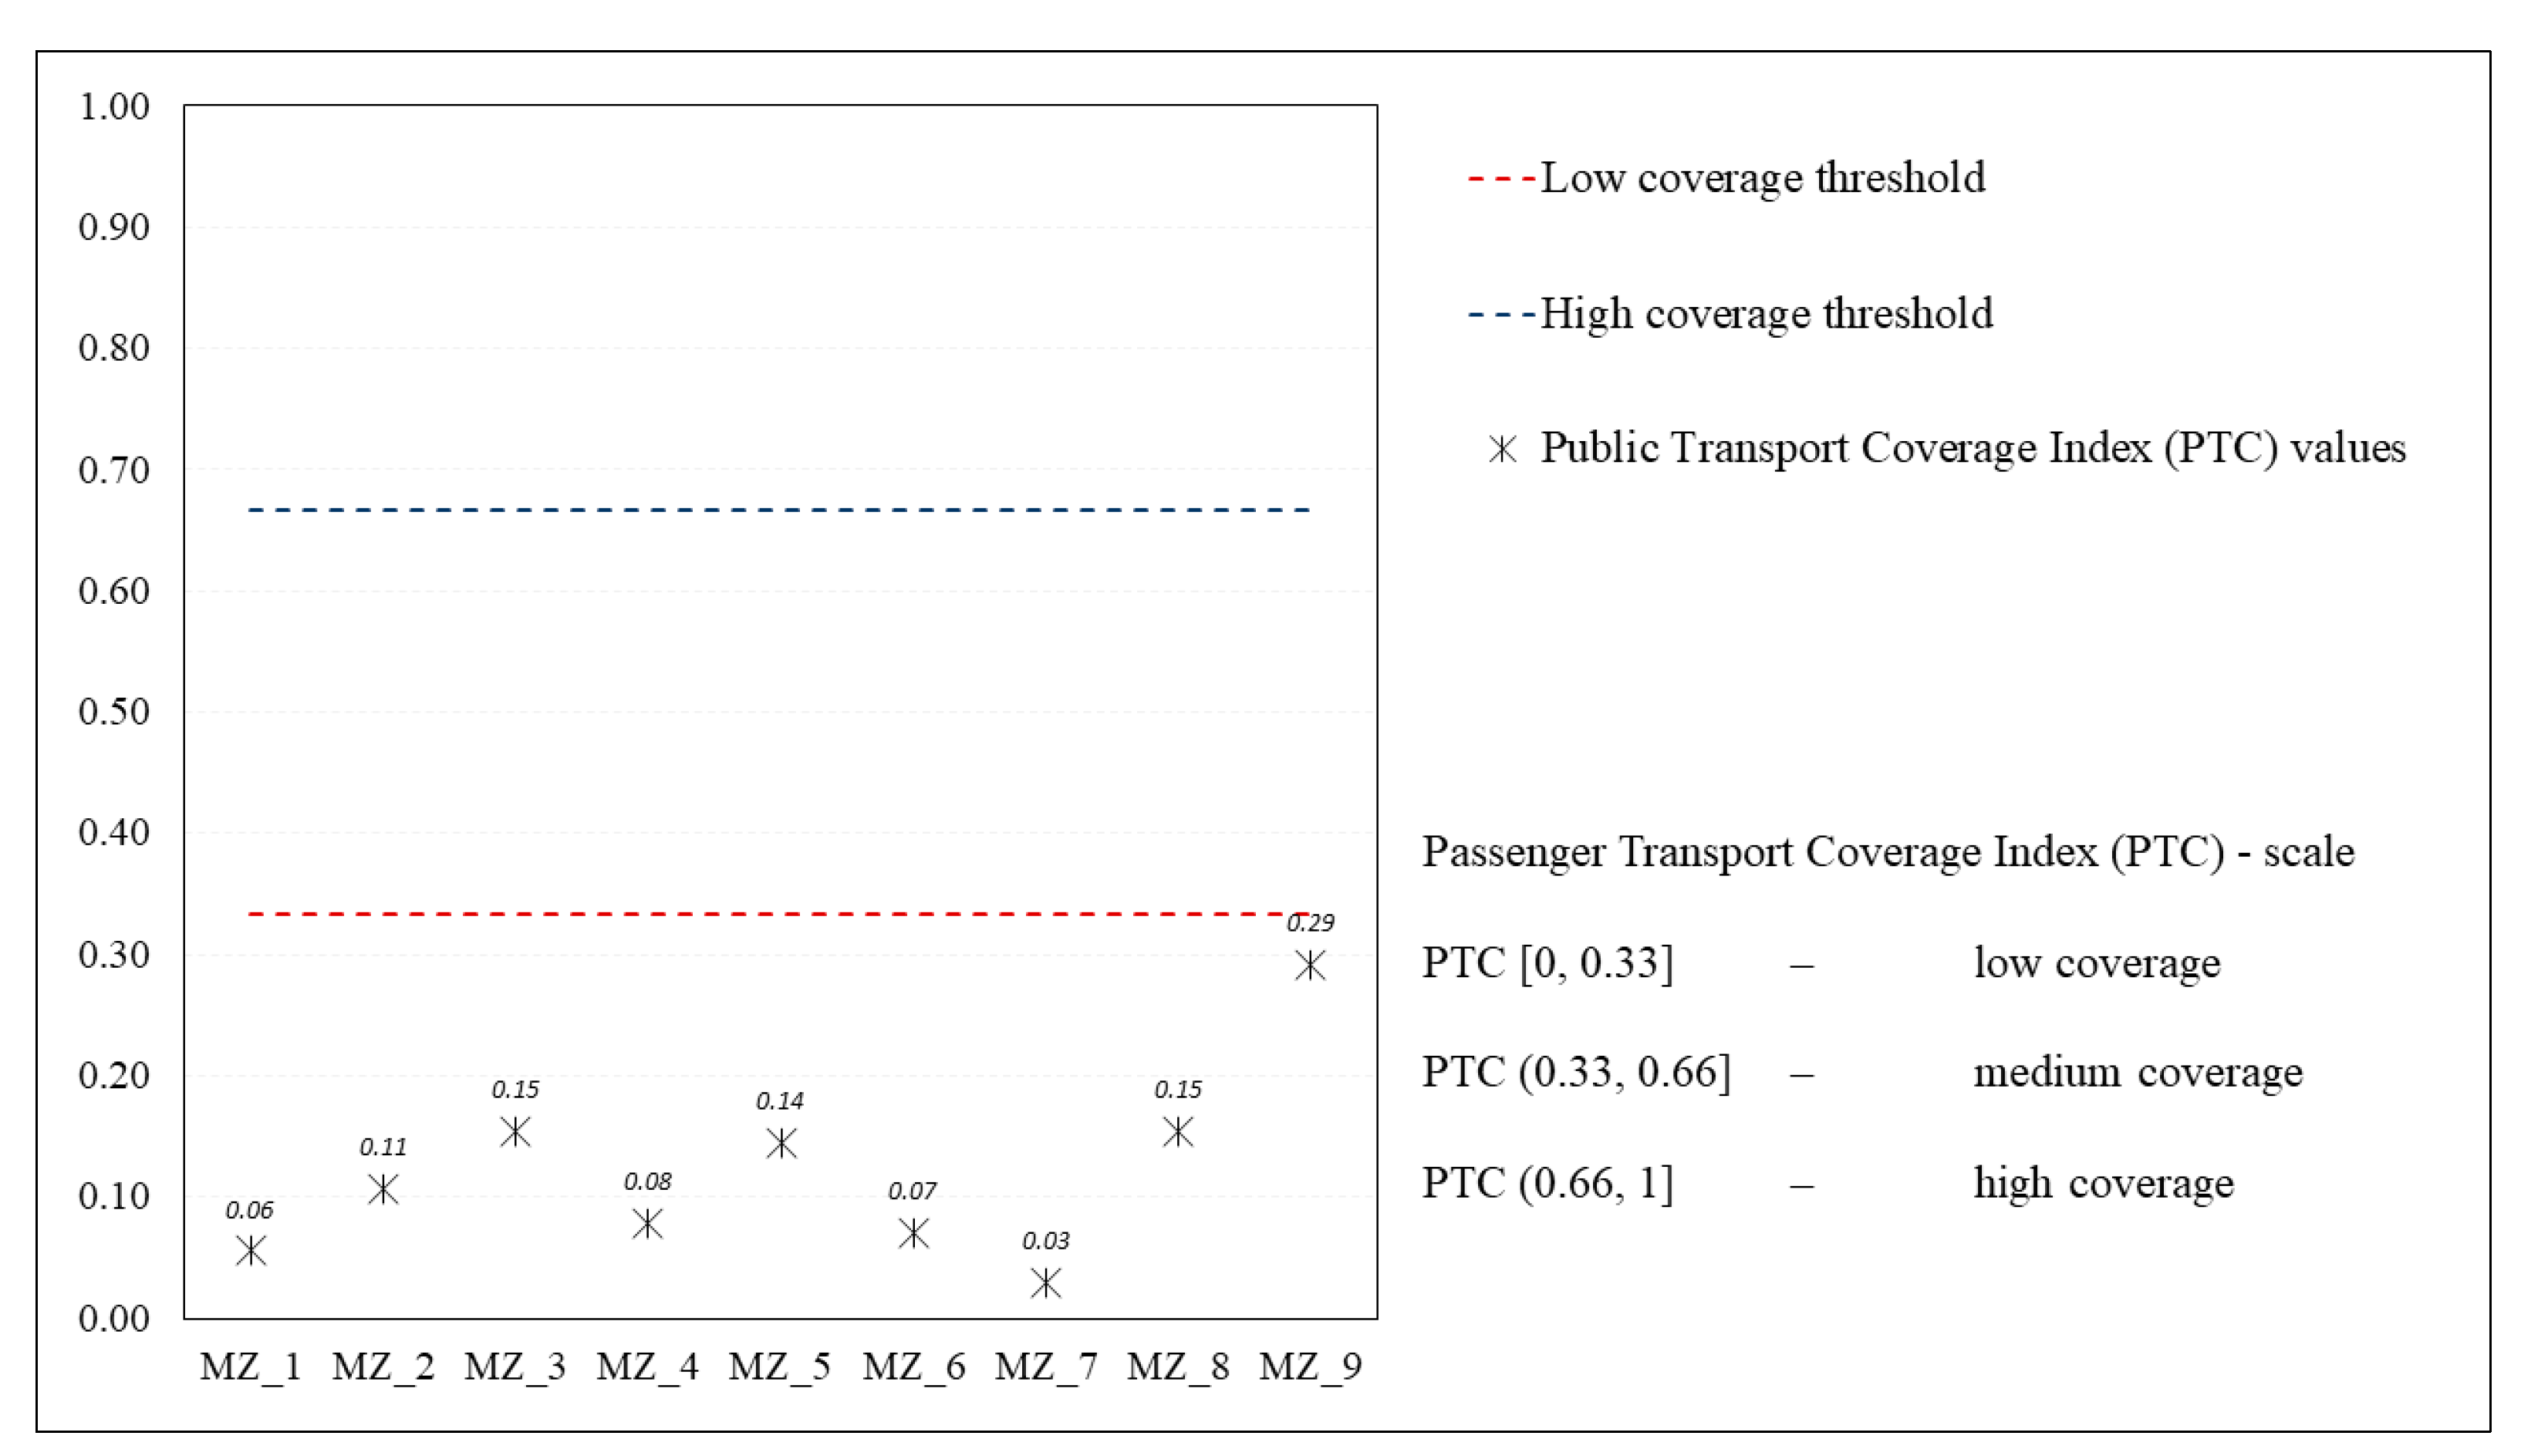
Public transportation coverage is a hot topic, covered by many research studies. Scholars have proposed various way for assessing the public transportation coverage, including data related to time distance [55], accessibility towards public transportation [10,55] or accessibility of residential areas to roads [56]. The Public Transportation Coverage Index (PTC) proposed in this study uses as input data the amount of metropolitan settlements included in the public transportation network and the density of the passenger transportation network within the metropolitan zones, which is in accordance with other similar approaches. More detailed calculations are hard to be compiled as the interurban passenger transportation system in Romania is exclusively private and there are a multitude of operators in this sector which makes it hard to access any statistics regarding the number of passengers, rush ours or precise timetables. Another shortcoming in developing more complex formulas to calculate the coverage of interurban passenger transportation is due to the fact that there are transportation operators which are not registered in any data base or online platform, thus are completely missing from the statistics, even though they operate as passenger transporters in field. By using the official data provided by the verified private passenger transporters, our results showed that there is at least one metropolitan settlement not covered by the passenger transport network. PTC results for all nine metropolitan zones were under the minimum coverage threshold. This means that all metropolitan zones being subject to our study have at least one administrative unit not being linked to the passenger transportation network. Thus, parts of the metropolitan population must drive their personal cars, walk, or hitchhike to reach the existing passenger transportation networks.
If we cross-check our results with the ones presented in the study of Man et al. [57] regarding the accessibility of Romanian settlements towards the major urban areas, we should consider that the hinterland of the analyzed metropolitan zones is poorly connected to their urban core. Additionally, the passenger transportation network design for all nine metropolitan zones emphasize that, except the situation of MZ_9, all passengers from the settlements placed in the hinterland of the metropolitan zones have to pass through the urban core to reach other settlements within the same metropolitan zone.
Assessments of the collaboration degree of different actors have proved to be a useful approach in analyzing the flows of knowledge in developing planning strategies and in the decision-making process. Social network analysis was used in various studies leading to valuable information about the governance of natural protected areas [58,59,60] or urban settings [61]. The network analysis used in our study revealed that enhancing the accessibility of metropolitan residents towards the transportation network is among the top priorities of different stakeholders and public institutions. These results are encouraging as the European authorities put a high price on mobility improvements at the EU level [25,54]. Angel and Blei [62] emphasize that focusing on developing the mobility levels and shortening the commuting time within the metropolitan areas, by planning effective transportation networks will increase the productivity of the cities, otherwise the metropolitan areas are at risk to become unfunctional, determining a decrease in cities’ productivity and quality of life, as revealed by the study of García-Palomares [63]. Thus, our results show that institutional and private stakeholders are working together to address the issue of mobility in the metropolitan zones, meaning that they acknowledge the importance of this issue.
Another important aspect of our analysis was whether the collaboration regarding metropolitan management and development is made using a decentralized or centralized approach. Researchers opinion differ on this subject based on the political system in which they professionally developed, and it is hard to provide an unbiased perspective over this subject. There are studies considering that a centralized approach of metropolitan management leads to malfunction as central authorities are not familiar with the specific issues occurring at regional level [64] and there are studies emphasizing the benefits of centralized management of metropolitan zones, as the central Government has the overall picture of the territorial planning and can enhance further developments [65]. We have opted to consider that a decentralized approach of metropolitan management is more suited for the Romanian context and the results have shown that there are stronger links of collaboration between local authorities and regional or private actors.
Although apparently not related with the metropolitan transport network design, political stability represents a driving force of development. Political influence over the metropolitan development is acknowledged by Vojnovic [66] and this influence may adopt a sustainable approach or not, based on how rich the metropolitan areas are, as emphasized by the author. On the other hand, the study of Greasley et al. [67] regarding the influence of local governing bodies over urban development contradicts the findings of Vojnovic and others, in which the local authorities play a significant role in establishing the urban planning direction. However, the authors concluded that their study is contradicting most of the researches, stating that this might be the situation for the British urban areas. Thus, if local politicians are important in metropolitan development, political instability can halt the progress of the region. Additionally, permanent changes of the community leaders reveal a high degree of unsatisfaction in regard with how the community is led. Our results show that all our case studies are characterized by high political stability rates, following the calculation of the Political Stability Index (PSI). This is also a positive result, as political turmoil can’t interfere in the process of the effective planning of metropolitan transportation network, high political stability being also an indicator of people’s agreement with the ways their communities are managed, preventing the manifestation of future conflicts.
There are several limitations of our methodological approach that need to be clarified in this study. The first one is related with the raw data used to develop the proposed indexes. We used data provided by public institutions or self-generated data using GIS techniques (e.g., the length of infrastructures in the metropolitan areas). Self-generated data may be sometimes subject to error occurrence. Romanian institutions managing transport infrastructures are not providing any GIS data to the public, thus we used a private database (OSM) to compile our results. As we have mentioned in the methods section we have cross-checked and refined this database with aerial imagery and official transportation maps to decrease the error levels, leading to misinterpretations. However, the level of accuracy of our indexes might not be perfect, but they can still provide an accurate image of the current state of the mobility networks within the metropolitan zones.
Another limitation of our study consists of the answer rate we have received for our survey regarding the collaboration between different actors on metropolitan issues. We have failed to reach the minimum target of 30%. However, we moved forward an presented the results as a methodological demonstration. Better answer rates are required for more accurate results, but our experience have once again emphasized the lack of dialog between the scientific community and the policy makers in Romania.

5. Conclusions

The proposed methodological approach and the resulting outcomes may provide an integrative oversight of the metropolitan situation in Romania for practitioners and decision makers, helping them to properly assess the hotspots of planning-based conflict occurrence. With further improvements, mainly regarding the input data, the proposed indexes can be transferred and used within feasibility studies. Using more quantitative data, with the capability to be spatially represented will help establishing sustainable and efficient transportation networks. The use of quantitative methods will help moving a step forward, from establishing an existing issue to determining how big the issue is, which are the negative outcomes and who is affected by them.
Overall, the results projecting the potential conflict occurrence within the selected metropolitan zones reveal that Romanian metropolitan planning was artificially promoted through regulations and was swiftly and inadvertently implemented at regional level. Thus, the planning of the metropolitan zones was made without fully understanding the basic purposes of these ways of territorial establishments. In this regard, the mobility networks within the metropolitan zones can trigger planning-based conflicts in the long term as they cannot ensure even and permanent fluxes of resources, knowledge and information towards all metropolitan members. The proposed methodological approach and the resulting outcomes may provide an integrative oversight of the metropolitan situation in Romania for practitioners and decision makers, helping them to properly assess the hotspots of planning-based conflict occurrence.

Supplementary Materials

The following are available online at https://www.mdpi.com/2071-1050/12/2/527/s1, Figure S1: TIC values spatially represented for each metropolitan member; Figure S2: STI values spatially represented for each metropolitan member; Figure S3: The passenger transportation networks for each metropolitan zone; Figure S4: PSI values spatially represented for each metropolitan member; Table S1: Actors included in the collaboration network analysis regarding metropolitan management and development.

Author Contributions

Conceptualization, A.-A.G. and A.N.; Data curation, A.-A.G. and A.N.; Formal analysis, A.-A.G., A.N. and M.-I.N.; Funding acquisition, A.-A.G.; Investigation; A.-A.G. and M.-I.N.; Methodology, A.-A.G., and A.N.; Visualization, A.-A.G., and A.N.; Writing—original draft, A.-A.G., A.N. and M.-I.N.; writing—review and editing, A.-A.G., and A.N. All authors have read and agreed to the published version of the manuscript.

Funding

This work was supported by a grant from the Romanian National Authority for Scientific Research, CNDI-UEFISCDI PN-III-P1-1.1-PD-2016-0658– “Developing a model of integrated planning regarding the public and private services accessibility in metropolitan areas”.

Acknowledgments

This work was supported by a grant from the Romanian National Authority for Scientific Research, CNDI-UEFISCDI PN-III-P1-1.1-PD-2016-0658– “Developing a model of integrated planning regarding the public and private services accessibility in metropolitan areas”.

Conflicts of Interest

The authors declare no conflict of interest.

References

  1. United Nations. World Urbanization Prospects. The 2018 Revision; United Nations: New York, NY, USA, 2019. [Google Scholar]
  2. Gavrilidis, A.A.; Grădinaru, S.R.; Iojă, I.C.; Carstea, E.M.; Pătru-Stupariu, I. Land use and land cover dynamics in the periurban area of an industrialized East-European city. An overview of the last 100 years. Carpath. J. Earth Environ. Sci. 2015, 10, 29–38. [Google Scholar]
  3. Göddecke-Stellmann, J.; Kawka, R.; Lutter, H.; Pütz, T.; Schmidt-Seiwert, V.; Schön, K.P.; Spangenberg, M.; Costa, G.; Gebhardt, D.; Kemmerling, H. Metropolitan Areas in Europe; (BBSR) within the Federal Office for Building and Regional Planning (BBR); Bonn BBSR-Online-Publikation; Nr. 01/2011 2011; Federal Institute for Research on Building, Urban Affairs and Spatial Development: Bonn, Germany, 2011. [Google Scholar]
  4. Kaur, H.; Garg, P. Urban sustainability assessment tools: A review. J. Clean. Prod. 2019, 210, 146–158. [Google Scholar] [CrossRef]
  5. Schwab, K. The Fourth Industrial Revolution; Crown Business: New York, NY, USA, 2017. [Google Scholar]
  6. Collantes, F.; Pinilla, V. Peaceful Surrender: The Depopulation of Rural Spain in the Twentieth Century; Cambridge Scholars Publishing: Newcastle, UK, 2011. [Google Scholar]
  7. Martinez-Fernandez, C.; Audirac, I.; Fol, S.; Cunningham-Sabot, E. Shrinking cities: Urban challenges of globalization. Int. J. Urban Reg. Res. 2012, 36, 213–225. [Google Scholar] [CrossRef] [PubMed]
  8. Christiansen, P.; Loftsgarden, T. Drivers behind urban sprawl in Europe. TØI Rep. 2011, 1136, 2011. [Google Scholar]
  9. Hennig, E.; Ireneusz; Soukup, T.; Orlitova, E.; Schwick, C.; Kienast, F.; Jaeger, J.A.G. Urban Sprawl in Europe. Joint EEA-FOEN Report; European Environment Agency: Luxembourg, 2016. [Google Scholar]
  10. Bok, J.; Kwon, Y. Comparable Measures of Accessibility to Public Transport Using the General Transit Feed Specification. Sustainability 2016, 8, 224. [Google Scholar] [CrossRef] [Green Version]
  11. Al-Thani, S.; Amato, A.; Koç, M.; Al-Ghamdi, S. Urban Sustainability and Livability: An Analysis of Doha’s Urban-form and Possible Mitigation Strategies. Sustainability 2019, 11, 786. [Google Scholar] [CrossRef] [Green Version]
  12. Iojă, C.I.; Niţă, M.R.; Vânău, G.O.; Onose, D.A.; Gavrilidis, A.A. Using multi-criteria analysis for the identification of spatial land-use conflicts in the Bucharest Metropolitan Area. Ecol. Indic. 2014, 42, 112–121. [Google Scholar] [CrossRef]
  13. Atay Kaya, İ.; Kaya Erol, N. Conflicts over Locally Unwanted Land Uses (LULUs): Reasons and solutions for case studies in Izmir (Turkey). Land Use Policy 2016, 58, 83–94. [Google Scholar] [CrossRef] [Green Version]
  14. Bennett, G.; Davies, P.J. Urban cemetery planning and the conflicting role of local and regional interests. Land Use Policy 2015, 42, 450–459. [Google Scholar] [CrossRef]
  15. Ianoş, I.; Sorensen, A.; Merciu, C. Incoherence of urban planning policy in Bucharest: Its potential for land use conflict. Land Use Policy 2017, 60, 101–112. [Google Scholar] [CrossRef]
  16. Tudor, C.A.; Iojă, C.I.; Hersperger, A.M.; Pătru-Stupariu, I. Is the residential land use incompatible with cemeteries location? Assessing the attitudes of urban residents. Carpath. J. Earth Environ. Sci. 2013, 8, 153–162. [Google Scholar]
  17. De Roo, G. Environmental conflicts in compact cities: Complexity, decisionmaking, and policy approaches. Environ. Plan. B Plan. Des. 2000, 27, 151–162. [Google Scholar] [CrossRef]
  18. Iojă, I.-C.; Hossu, C.-A.; Niţă, M.-R.; Onose, D.-A.; Badiu, D.-L.; Manolache, S. Indicators for environmental conflict monitoring in Natura 2000 sites. Procedia Environ. Sci. 2016, 32, 4–11. [Google Scholar] [CrossRef] [Green Version]
  19. Dadashpoor, H.; Ahani, S. Land tenure-related conflicts in peri-urban areas: A review. Land Use Policy 2019, 85, 218–229. [Google Scholar] [CrossRef]
  20. Kim, I.; Arnhold, S. Mapping environmental land use conflict potentials and ecosystem services in agricultural watersheds. Sci. Total Environ. 2018, 630, 827–838. [Google Scholar] [CrossRef] [PubMed]
  21. Gil Solá, A.; Vilhelmson, B.; Larsson, A. Understanding sustainable accessibility in urban planning: Themes of consensus, themes of tension. J. Transp. Geogr. 2018, 70, 1–10. [Google Scholar] [CrossRef]
  22. Ganciu, A.; Balestrieri, M.; Imbroglini, C.; Toppetti, F. Dynamics of Metropolitan Landscapes and Daily Mobility Flows in the Italian Context. An Analysis Based on the Theory of Graphs. Sustainability 2018, 10, 596. [Google Scholar] [CrossRef] [Green Version]
  23. Zhao, P. Sustainable urban expansion and transportation in a growing megacity: Consequences of urban sprawl for mobility on the urban fringe of Beijing. Habitat Int. 2010, 23, 236–243. [Google Scholar] [CrossRef]
  24. Gössling, S. Urban transport justice. J. Transp. Geogr. 2016, 54, 1–9. [Google Scholar] [CrossRef]
  25. European Commission. European Urban Mobility. Policy Context; Directorate-General for Mobility and Transport; General Directorate of the Infrastructural Investment; Publications Office of the European Union: Luxembourg, 2017. [Google Scholar]
  26. Knowles, R.; Ferbrache, F. Evaluation of wider economic impacts of light rail investment on cities. J. Transp. Geogr. 2016, 54, 430–439. [Google Scholar] [CrossRef]
  27. King, D.A.; Fischer, L.A. Streetcar projects as spatial planning: A shift in transport planning in the United States. J. Transp. Geogr. 2016, 54, 383–390. [Google Scholar] [CrossRef]
  28. Mulley, C.; Ma, L.; Clifton, G.; Yen, B.; Burke, M. Residential property value impacts of proximity to transport infrastructure: An investigation of bus rapid transit and heavy rail networks in Brisbane, Australia. J. Transp. Geogr. 2016, 54, 41–52. [Google Scholar] [CrossRef] [Green Version]
  29. Kołoś, A.; Taczanowski, J. The feasibility of introducing light rail systems in medium-sized towns in Central Europe. J. Transp. Geogr. 2016, 54, 400–413. [Google Scholar] [CrossRef]
  30. Coppola, P.; Silvestri, F. Estimating and visualizing perceived accessibility to transportation and urban facilities. Transp. Res. Procedia 2018, 31, 136–145. [Google Scholar] [CrossRef]
  31. Tsiotas Dimitrios, K.; Kalantzi Olga, S.; Gavardinas Ioannis, D. Accessibility assessment of urban mobility: The case of Volos, Greece. Transp. Res. Procedia 2017, 24, 499–506. [Google Scholar] [CrossRef]
  32. Chen, N.; Akar, G. Effects of neighborhood types & socio-demographics on activity space. J. Transp. Geogr. 2016, 54, 112–121. [Google Scholar] [CrossRef]
  33. European Committe of the Regions. The Impacts of Metropolitan Regions on Their Surrounding Areas; Publications Office of the EU: Brussels, Belgium, 2019. [Google Scholar] [CrossRef]
  34. Dadashpoor, H.; Azizi, P.; Moghadasi, M. Analyzing spatial patterns, driving forces and predicting future growth scenarios for supporting sustainable urban growth: Evidence from Tabriz metropolitan area, Iran. Sustain. Cities Soc. 2019, 47. [Google Scholar] [CrossRef]
  35. Romanian Parliament. Legea Nr. 351/2001 Privind Aprobarea Planului de Amenajare a Teritoriului National—Secțiunea a IV-a Rețeaua de Localități; en: Law no. 351/2001 reagarding the approval of the National Teritorial Develeopment Plan—Section IV Human settlement network; Monitorul Oficial al Romaniei: Bucharest, Romania, 2001; Volume 351.
  36. European Commission. Regions in the European Union. Nomenclature of Territorial Units for Statistics—NUTS 2016/EU-28; Publications Office of the European Union: Luxembourg, 2018. [Google Scholar] [CrossRef]
  37. Romanian Parliament. Legea Nr. 190/2019 Pentru Modificarea Legii Nr. 351/2001 Privind Aprobarea Planului de Amenajare a Teritoriului Național—Secțiunea a IV-a—Rețeaua de Localități; en: Law no. 90/2019 for the modification of Law no. 351/2001 reagarding the approval of the National Teritorial Develeopment Plan—Section IV Human settlement network); Monitorul Oficial al Romaniei: Bucharest, Romania, 2019; Volume 190.
  38. Autogari.ro. Available online: https://www.autogari.ro/ (accessed on 23 August 2019).
  39. Borgatti, S.P.; Everett, M.G.; Freeman, L.C. Ucinet for Windows: Software for Social Analysis. Available online: https://www.researchgate.net/publication/216636663_UCINET_for_Windows_Software_for_social_network_analysis (accessed on 30 November 2019).
  40. Romanian Parliament. Lege Nr. 544/2001 Privind Liberul Acces la Informatii de Interes Public; en: Law no. 544/2001 regading the free acces to public interest information—Updated 2019; Monitorul Oficial al Romaniei: Bucharest, Romania, 2001.
  41. Berardo, R. Bridging and Bonding Capital in Two-Mode Collaboration Networks. Policy Stud. J. 2014, 42, 197–225. [Google Scholar] [CrossRef]
  42. Hanneman, R.A.; Riddle, M. Introduction to Social Network Methods; University of California Riverside: Riverside, CA, USA, 2005. [Google Scholar]
  43. Autoritatea Electorala Permanenta. Istoric Electoral Romania (en: Election Hystory in Romania). Available online: http://www.roaep.ro/istoric/ (accessed on 1 September 2019).
  44. Onose, D.-A.; Niţă, M.R.; Ciocănea, C.M.; Pătroescu, M.; Vanău, G.O.; Bodescu, F. Identifying Critical Areas of Exposure To Environmental Conflicts Using Expert Opinion And Multi-Criteria Analysis. Carpath. J. Earth Environ. Sci. 2015, 10, 15–28. [Google Scholar]
  45. Xu, X.; Chen, A.; Jansuwan, S.; Yang, C.; Ryu, S. Transportation network redundancy: Complementary measures and computational methods. Transp. Res. Part B Methodol. 2018, 114, 68–85. [Google Scholar] [CrossRef]
  46. Niță, M.R.; Badiu, D.L.; Onose, D.A.; Gavrilidis, A.A.; Grădinaru, S.R.; Năstase, I.I.; Lafortezza, R. Using local knowledge and sustainable transport to promote a greener city: The case of Bucharest, Romania. Environ. Res. 2018, 160, 331–338. [Google Scholar] [CrossRef] [PubMed]
  47. European Commision. Investments and Infrastructure. Available online: https://ec.europa.eu/transport/facts-fundings/scoreboard/compare/investments-infrastructure/quality-roads_en#2018 (accessed on 12 April 2019).
  48. Bulai, M.; Ursu, A. Creating, Testing and Applying a GIS Road Travel Cost Model for Romania. Geogr. Tech. 2012, 15, 8. [Google Scholar]
  49. Shepherd, B.; Wilson, J.S. Road Infrastructure in Europe and Central Asia: Does Network Quality Affect Trade? The World Bank: Washington, DC, USA, 2007. [Google Scholar]
  50. Ion, M.J. Romanian Businessman Builds World’s Shortest Highway. Available online: https://www.euronews.com/2019/03/15/romanian-businessman-builds-world-s-shortest-highway (accessed on 22 April 2019).
  51. Timu Andra, I.V. Fury at EU’s Worst Highways Fuels New Kind of Protest in Romania. Available online: https://www.bloomberg.com/news/articles/2019-03-15/fury-at-eu-s-worst-highways-fuels-new-kind-of-protest-in-romania (accessed on 22 April 2019).
  52. Cloutier, S.; Karner, A.; Breetz, H.; Toufani, P.; Onat, N.; Patel, S.; Paralkar, S.; Berejnoi, E.; Morrison, B.; Papenfuss, J.; et al. Measures of a Sustainable Commute as a Predictor of Happiness. Sustainability 2017, 9, 1214. [Google Scholar] [CrossRef] [Green Version]
  53. Alonso Raposo, M.E.; Ciuffo, B.; Ardente, F.; Aurambout, J.-P.; Baldini, G.; Braun, R.; Christidis, P.; Christodoulou, A.; Duboz, A.; Felici, S.; et al. The Future of Road Transport. Implications of Automated, Connected, Low CARBON and shared Mobility; European Commission: Luxembourg, 2019. [Google Scholar]
  54. European Commission. White Paper on Transport. Roadmap to a Single European Transport Area—Towards a Competitive and Resource Efficient Transport System; Publications Office of the European Union: Luxembourg, 2011. [Google Scholar] [CrossRef]
  55. Kim, H.; Lee, K.; Park, J.S.; Song, Y. Transit network expansion and accessibility implications: A case study of Gwangju metropolitan area, South Korea. Res. Transp. Econ. 2018, 69, 544–553. [Google Scholar] [CrossRef]
  56. Niţă, M.R. Mapping favorability for residential development. Case study: Bucharest Metropolitan Area. Procedia Environ. Sci. 2012, 14, 59–70. [Google Scholar] [CrossRef] [Green Version]
  57. Man, T.; Rusu, R.; Moldovan, C.; Ionescu-Heroiu, M.; Moldovan, N.-S.; Harangus, I. Spatial impact of the road infrastructure development in Romania. An accessibility approach. Rom. Rev. Reg. Stud. 2015, 11, 101–112. [Google Scholar]
  58. Niculae, M.I.; Avram, S.; Vânău, G.O.; Pătroescu, M. Effectiveness of Natura 2000 network in Romanian Alpine Biogeographical Region: An assessment based on forest landscape connectivity. Ann. For. Res. 2017, 60. [Google Scholar] [CrossRef] [Green Version]
  59. Nita, A.; Manolache, S.; Ciocanea, C.-M.; Rozylowicz, L. Real-World Application of Ego-Network Analysis to Evaluate Environmental Management Structures; Springer: Berlin, Germany, 2019. [Google Scholar] [CrossRef]
  60. Nita, A.; Rozylowicz, L.; Manolache, S.; Ciocanea, C.M.; Miu, I.V.; Popescu, V.D. Collaboration Networks in Applied Conservation Projects across Europe. PLoS ONE 2016, 11, e0164503. [Google Scholar] [CrossRef]
  61. Zhuang, T.; Qian, Q.K.; Visscher, H.J.; Elsinga, M.G.; Wu, W. The role of stakeholders and their participation network in decision-making of urban renewal in China: The case of Chongqing. Cities 2019, 92, 47–58. [Google Scholar] [CrossRef]
  62. Angel, S.; Blei, A.M. The productivity of American cities: How densification, relocation, and greater mobility sustain the productive advantage of larger U.S. metropolitan labor markets. Cities 2016, 51, 36–51. [Google Scholar] [CrossRef]
  63. García-Palomares, J.C. Urban sprawl and travel to work: The case of the metropolitan area of Madrid. J. Transp. Geogr. 2010, 18, 197–213. [Google Scholar] [CrossRef]
  64. Henderson, S.R. Outer metropolitan areas and infrastructure deficits: Policy dynamics on the edge of Melbourne, Australia. Cities 2019, 90, 24–31. [Google Scholar] [CrossRef]
  65. Ye, L. State-led metropolitan governance in China: Making integrated city regions. Cities 2014, 41, 200–208. [Google Scholar] [CrossRef]
  66. Vojnovic, I. Urban sustainability: Research, politics, policy and practice. Cities 2014, 41, S30–S44. [Google Scholar] [CrossRef]
  67. Greasley, S.; John, P.; Wolman, H. Does government performance matter? The effects of local government on urban outcomes in England. Urban Stud. 2011, 48, 1835–1851. [Google Scholar] [CrossRef]
Figure 1. Position within the national territory of the selected metropolitan zones as case study areas for the analysis.
Sustainability 12 00527 g001
Figure 2. The main economic activities taking place in the selected metropolitan zones according with the average number of employees per sector and the number of enterprises per sector (data—2018).
Sustainability 12 00527 g002
Figure 3. Infrastructure Complexity Index (TIC) values’ distribution for the selected metropolitan zones.
Sustainability 12 00527 g003
Figure 4. Transportation Infrastructure Index (STI) values' distribution for the selected metropolitan zones.
Sustainability 12 00527 g004
Figure 5. Passenger Transportation Cover (PTC) values’ distribution for the selected metropolitan zones.
Sustainability 12 00527 g005
Figure 6. Collaboration network of different actors on enhancing the public accessibility towards 12 services within the metropolitan zones. Actors’ codes: LOC—local actors; REG—regional actors; GOV—national actors; PRV—private actors.
Sustainability 12 00527 g006
Figure 7. Eigenvector Centrality values from the social network analysis represented using a Pareto plot.
Sustainability 12 00527 g007
Figure 8. PSI values’ distribution for the selected metropolitan zones.
Sustainability 12 00527 g008
Table 1. General characteristics of the selected metropolitan zones as case studies for the analysis.
NameArea (km2)No of SettlementsPopulation (2019)Establishment YearShare of Urban Population [%]
RuralUrbanRuralUrban
Iași (MZ_1)1184.67191144,712378,954200472.37
Oradea (MZ_2)749.4911152,737221,407200580.76
Brașov (MZ_3)1693.1811770,289408,011200585.30
Târgu Mureș (MZ_4)656.1912268,530155,404200669.40
Constanța (MZ_5)1110.2810689,311401,797200781.81
Cluj Napoca (MZ_6)1740.56191113,788324,960200874.07
Craiova (MZ_7)1512.1621364,099327,628200983.64
Botoșani (MZ_8)526.707236,190125,661201177.64
Baia Mare (MZ_9)1399.9413649,917193,714201279.51
Table 2. Reclassification of Open Street Map (OSM) types of transportation.
Classes Used in the StudyOSM ClassificationLegal Speed LimitMultiplication Factor (s)
CyclewayCycleway15 km/h *3.00
FootwayFootway; Pedestrian; Path; Track5 km/h *2.00
AccesswayLiving-street; Residential; Road; Unclassified30 km/h4.00
MotorwayMotorway130 km/h9.00
MainwayPrimary; Trunk100 km/h8.00
Regional roadSecondary70 km/h7.00
Local roadTertiary50 km/h6.00
RailwayRail70 km/h 7.00
TramwayTram40 km/h 5.00
* Average speed.
Table 3. The density of train station per 10 km2 within the selected metropolitan zones and the number of settlements connected to one train station per metropolitan zone.
Train StationsTrain Stations Density per 10 km2Train Stations per Number of Settlements
TotalStations *Stops **TotalStationsStopsTotalStationsStops
MZ_18260.0680.0170.0512.5010.003.33
MZ_27250.0930.0270.0671.716.002.40
MZ_313670.0770.0350.0411.383.002.57
MZ_44220.0610.0300.0303.507.007.00
MZ_5144100.1260.0360.0901.144.001.60
MZ_610370.0570.0170.0402.006.672.86
MZ_711470.0730.0260.0462.186.003.43
MZ_82110.0380.0190.0194.509.009.00
MZ_94220.0290.0140.0144.759.509.50
* Stations in which all type of passenger trains stop; ** Stations in which only local and regional trains stop.
Table 4. Interpretation framework for the Political Stability Index (PSI) values for the period between 2004 and 2016, including four election times.
PSI ValueOpportunistic Political BehaviorIndividuals in OfficeWining PartiesInterpretation
0.63no11stability
1.25no21
1.88no31
2.50no41
3.50yes12
5.00no22
7.50no32
7.63yes13
10.00no42
12.25yes23
13.00yes14
16.88no33relative stability
22.00yes24
22.50no43
31.00yes34instability
40.00no44
Table 5. Framework for determining the potential conflict occurrence in metropolitan zones due to transportation issues.
Potential Conflict OccurrenceTICSTIPTCCollaboration LevelPriorityPSI
Low (1)>6.6>0.66>0.66decentralized>66.6 %<13.33
Medium (2)3.3–6.60.33–0.660.33–0.66balanced33.3–66.6%13.3–26.6
High (3)<3.3<0.33<0.33centralized<33.3%>26.6
Table 6. Network cohesion metrics on the passenger transportation network for the selected metropolitan zones; the values have been normalized.
MZ_1MZ_2MZ_3MZ_4MZ_5MZ_6MZ_7MZ_8MZ_9
Av. Degree1.402.002.781.572.141.901.222.227.68
Deg. Centralization0.740.440.880.580.710.650.490.290.27
Out-Central0.700.400.820.530.650.620.470.250.25
In-Central0.700.400.820.530.650.620.470.250.25
Density0.070.180.160.120.170.100.060.280.43
Components6.006.002.006.003.007.0012.005.007.00
Connectedness0.550.320.890.400.730.480.260.280.46
Fragmentation0.450.680.110.600.280.520.740.720.54
Avg Distance1.871.431.821.691.891.791.791.001.06
Diameter2.002.002.002.003.002.002.001.002.00
Table 7. Overall results for the nine metropolitan zones and the associated potential conflict occurrence scores.
MZPotential Conflict Occurrence According to:Ovrl. Score
TICScoreSTIScorePTCScorePriorityScoreCollab. lvl.ScorePSIScore
MZ_14.892.000.572.000.063.00<33.3%1.00decentr.1.005.741.001.67
MZ_25.432.000.871.000.113.00<33.3%1.00decentr.1.002.811.001.50
MZ_35.672.000.482.000.153.00<33.3%1.00decentr.1.005.811.001.67
MZ_45.312.000.303.000.083.00<33.3%1.00decentr.1.002.711.001.83
MZ_56.791.000.482.000.143.00<33.3%1.00decentr.1.005.561.001.50
MZ_65.772.000.372.000.073.00<33.3%1.00decentr.1.005.261.001.67
MZ_75.292.000.432.000.033.00<33.3%1.00decentr.1.005.601.001.67
MZ_85.842.000.143.000.153.00<33.3%1.00decentr.1.008.651.001.83
MZ_95.392.000.323.000.293.00<33.3%1.00decentr.1.007.711.001.83

