Article

Assessing Genetic Diversity and Population Structure of Kalmia latifolia L. in the Eastern United States: An Essential Step towards Breeding for Adaptability to Southeastern Environmental Conditions

1
College of Forestry, Central South University of Forestry and Technology, 498 South Shaoshan Road, Changsha 410004, Hunan, China
2
Department of Horticulture, University of Georgia, 1111 Miller Plant Sciences Building, Athens, GA 30602, USA
*
Author to whom correspondence should be addressed.
Sustainability 2020, 12(19), 8284; https://doi.org/10.3390/su12198284
Submission received: 27 August 2020 / Revised: 4 October 2020 / Accepted: 6 October 2020 / Published: 8 October 2020
(This article belongs to the Special Issue Sustainable Horticultural Practices)

Abstract

:
Kalmia latifolia L. (mountain laurel), an attractive flowering shrub, is considered to be a high-value ornamental plant for the eastern United States. Limited information on the genetic diversity and structure of K. latifolia is available, which obstructs efficient germplasm utilization and breeding for adaptability to southeastern environmental conditions. In this study, the genetic diversity of 48 wild K. latifolia plants sampled from eight populations in the eastern U.S. was assessed using eight inter simple sequence repeat (ISSR) markers. A total of 116 bands were amplified, 90.52% of which (105) were polymorphic. A high level of genetic diversity at the species level was determined by Nei’s gene diversity (0.3089) and Shannon’s information index (0.4654), indicating that K. latifolia was able to adapt to environmental changes and thus was able to distribute over a wide latitudinal range. In terms of the distribution of genetic diversity, Nei’s genetic differentiation and analysis of molecular variance (AMOVA) showed 38.09% and 29.54% of diversity existed among populations, respectively, elucidating a low-to-moderate level of among-population genetic differentiation. Although a relatively large proportion of diversity was attributed to within-population variation, low diversity within populations (mean genetic diversity within populations (HS) = 0.19) was observed. Both STRUCTURE and unweighted pair group method with arithmetic mean (UPGMA) dendrograms exhibited the clustering of populations that inhabit the same geographic region, and four clusters correlated with four geographic regions, which might be attributed to insect pollination, small population size, and environmental conditions in different habitats. These results function as an essential step towards better conserving and utilizing wild K. latifolia resources, and hence promoting its genetic improvement and breeding for adaptability to southeastern environmental conditions.

1. Introduction

The genus Kalmia is a member of Ericaceae along with genera Rhododendron and Vaccinium. It consists of seven species that primarily distribute in temperate zones. Most of them are shrubs and subshrubs, some are herbs, and a few are trailing vines [1]. Kalmia latifolia L. (mountain laurel, 2n = 2x = 48) is the most famous species in genus Kalmia [1]. It is an outstanding spring–summer blooming shrub and a promising ornamental in the eastern United States [2].
Since the early 1960s, the breeding of K. latifolia has led to the release of various new cultivars. More than 140 cultivars have been documented by The European Kalmia Society (http://www.kalmia-society.org/cultivars.php?&lang=gb), of which about 30 obtained popularity because of their attractive characteristics and superior landscape performance. Efforts from breeders (Dr. Richard Jaynes at Broken Arrow Nursery (Hamden, CT) who devoted himself to genus Kalmia for more than 40 years, for instance) have notably increased the availability of cultivars and market shares of K. latifolia in the northeastern U.S. It hence has become a popular ornamental plant in the northeastern region and was elected as the state flower of Connecticut [1]. Conversely, the low tolerance of these K. latifolia cultivars to heat and intense light has limited their acceptance in areas of USDA zone 7, in the southeastern U.S. in particular [3]. In the southeastern U.S., few cultivars are available on the market, and those cultivars are principally produced by niche Ericaceous nurseries. Although being produced in a few southeastern nurseries, K. latifolia is rarely utilized in southeastern landscapes. In order to enhance production and utilization of K. latifolia in the southeastern U.S., the breeding of improved plants that have adaptability to southeastern environmental conditions is urgently needed.
Historically, wild plant resources have been involved in breeding programs worldwide to introduce desirable traits and increase genetic diversity, and therefore aid plant improvement [4]. In the United States, K. latifolia is naturally distributed in the east, specifically from southern Maine (USDA Zone 4a) west through southern New York (4a) to central Ohio (6a), south to eastern Louisiana (8b), southern Mississippi (8b), Alabama (8b), Georgia (8b), and northwestern Florida (8b) [1]. K. latifolia plants in wild populations, particularly southeastern populations, are valuable resources for developing improved cultivars. Thus, collecting and conserving wild K. latifolia plants has been considered as the foundation of breeding for adaptability to southeastern environmental conditions [5]. Due to the consideration of lowering facility and labor cost, it is always desired to minimize the quantity of plants collected and conserved and meanwhile maximize the genetic diversity that collection may provide [6]. Genetic diversity and population structure studies are therefore urgently needed for efficient K. latifolia germplasm collection and conservation. Additionally, yet as a cross-pollinating species, K. latifolia was found to be able to self-pollinate, while the significant reduction in survival and vigor of seedlings from self-pollinated plants indicated inbreeding depression in K. latifolia [7]. From a breeders’ standpoint, in order to prevent inbreeding depression as well as maximize genetic variations among progenies, individuals that are genetically distinct should be used as parents in cross hybridization. Genetic relationship information will therefore tremendously benefit breeding programs by providing a guidance for effectively utilizing wild K. latifolia plants as parental materials.
Many studies have been carried out to assess the genetic diversity of wild populations of genus Rhododendron that are closely related to K. latifolia (genus Rhododendron and Kalmia are members of Ericoideae, a subfamily of Ericaceae) in recent years. The genetic diversity of Rhododendron was principally attributed to within-population variation (62–83%), while a low level of genetic diversity was observed among populations [8,9,10]. These results illuminated the importance of individual plants within a population and revealed the levels and patterns of genetic variation for Rhododendron, which facilitate cultivar development by efficiently maximizing genetic diversity in both conservation and cross hybridization. Similar studies on K. latifolia are needed as an essential step toward better collecting, conserving, and utilizing wild resources.
Molecular markers have been widely used to elucidate genetic diversity in woody species due to the reliability and efficiency [11,12,13,14]. The inter simple sequence repeat (ISSR) markers detect polymorphisms in inter-microsatellite loci and can produce a much greater number of fragments per primer, with the advantages of high reproducibility and relatively low cost. Moreover, ISSR exists regardless of the availability of information about the genome sequence [15]. Therefore, ISSR has been employed in Cunninghamia lanceolata [16], Prunus spp. [17], Quercus susber [18], Haloxylon salicornicum [19], and Rhododendron spp. [20,21] to reveal genetic variation and population structure. Such information played fundamental roles in establishing an effective strategy for conservation and breeding purposes. In the present study, ISSR markers were employed to assess (1) the levels of the genetic diversity within and among eight investigated K. latifolia populations in the eastern U.S., (2) the degree of genetic differentiation among populations, and (3) the genetic relationship and population structure of 48 wild K. latifolia individuals sampled from eight populations. The results provide guidance for efficient germplasm conservation and utilization, and thus promote the breeding of K. latifolia plants that have adaptability to southeastern environmental conditions.

2. Materials and Methods

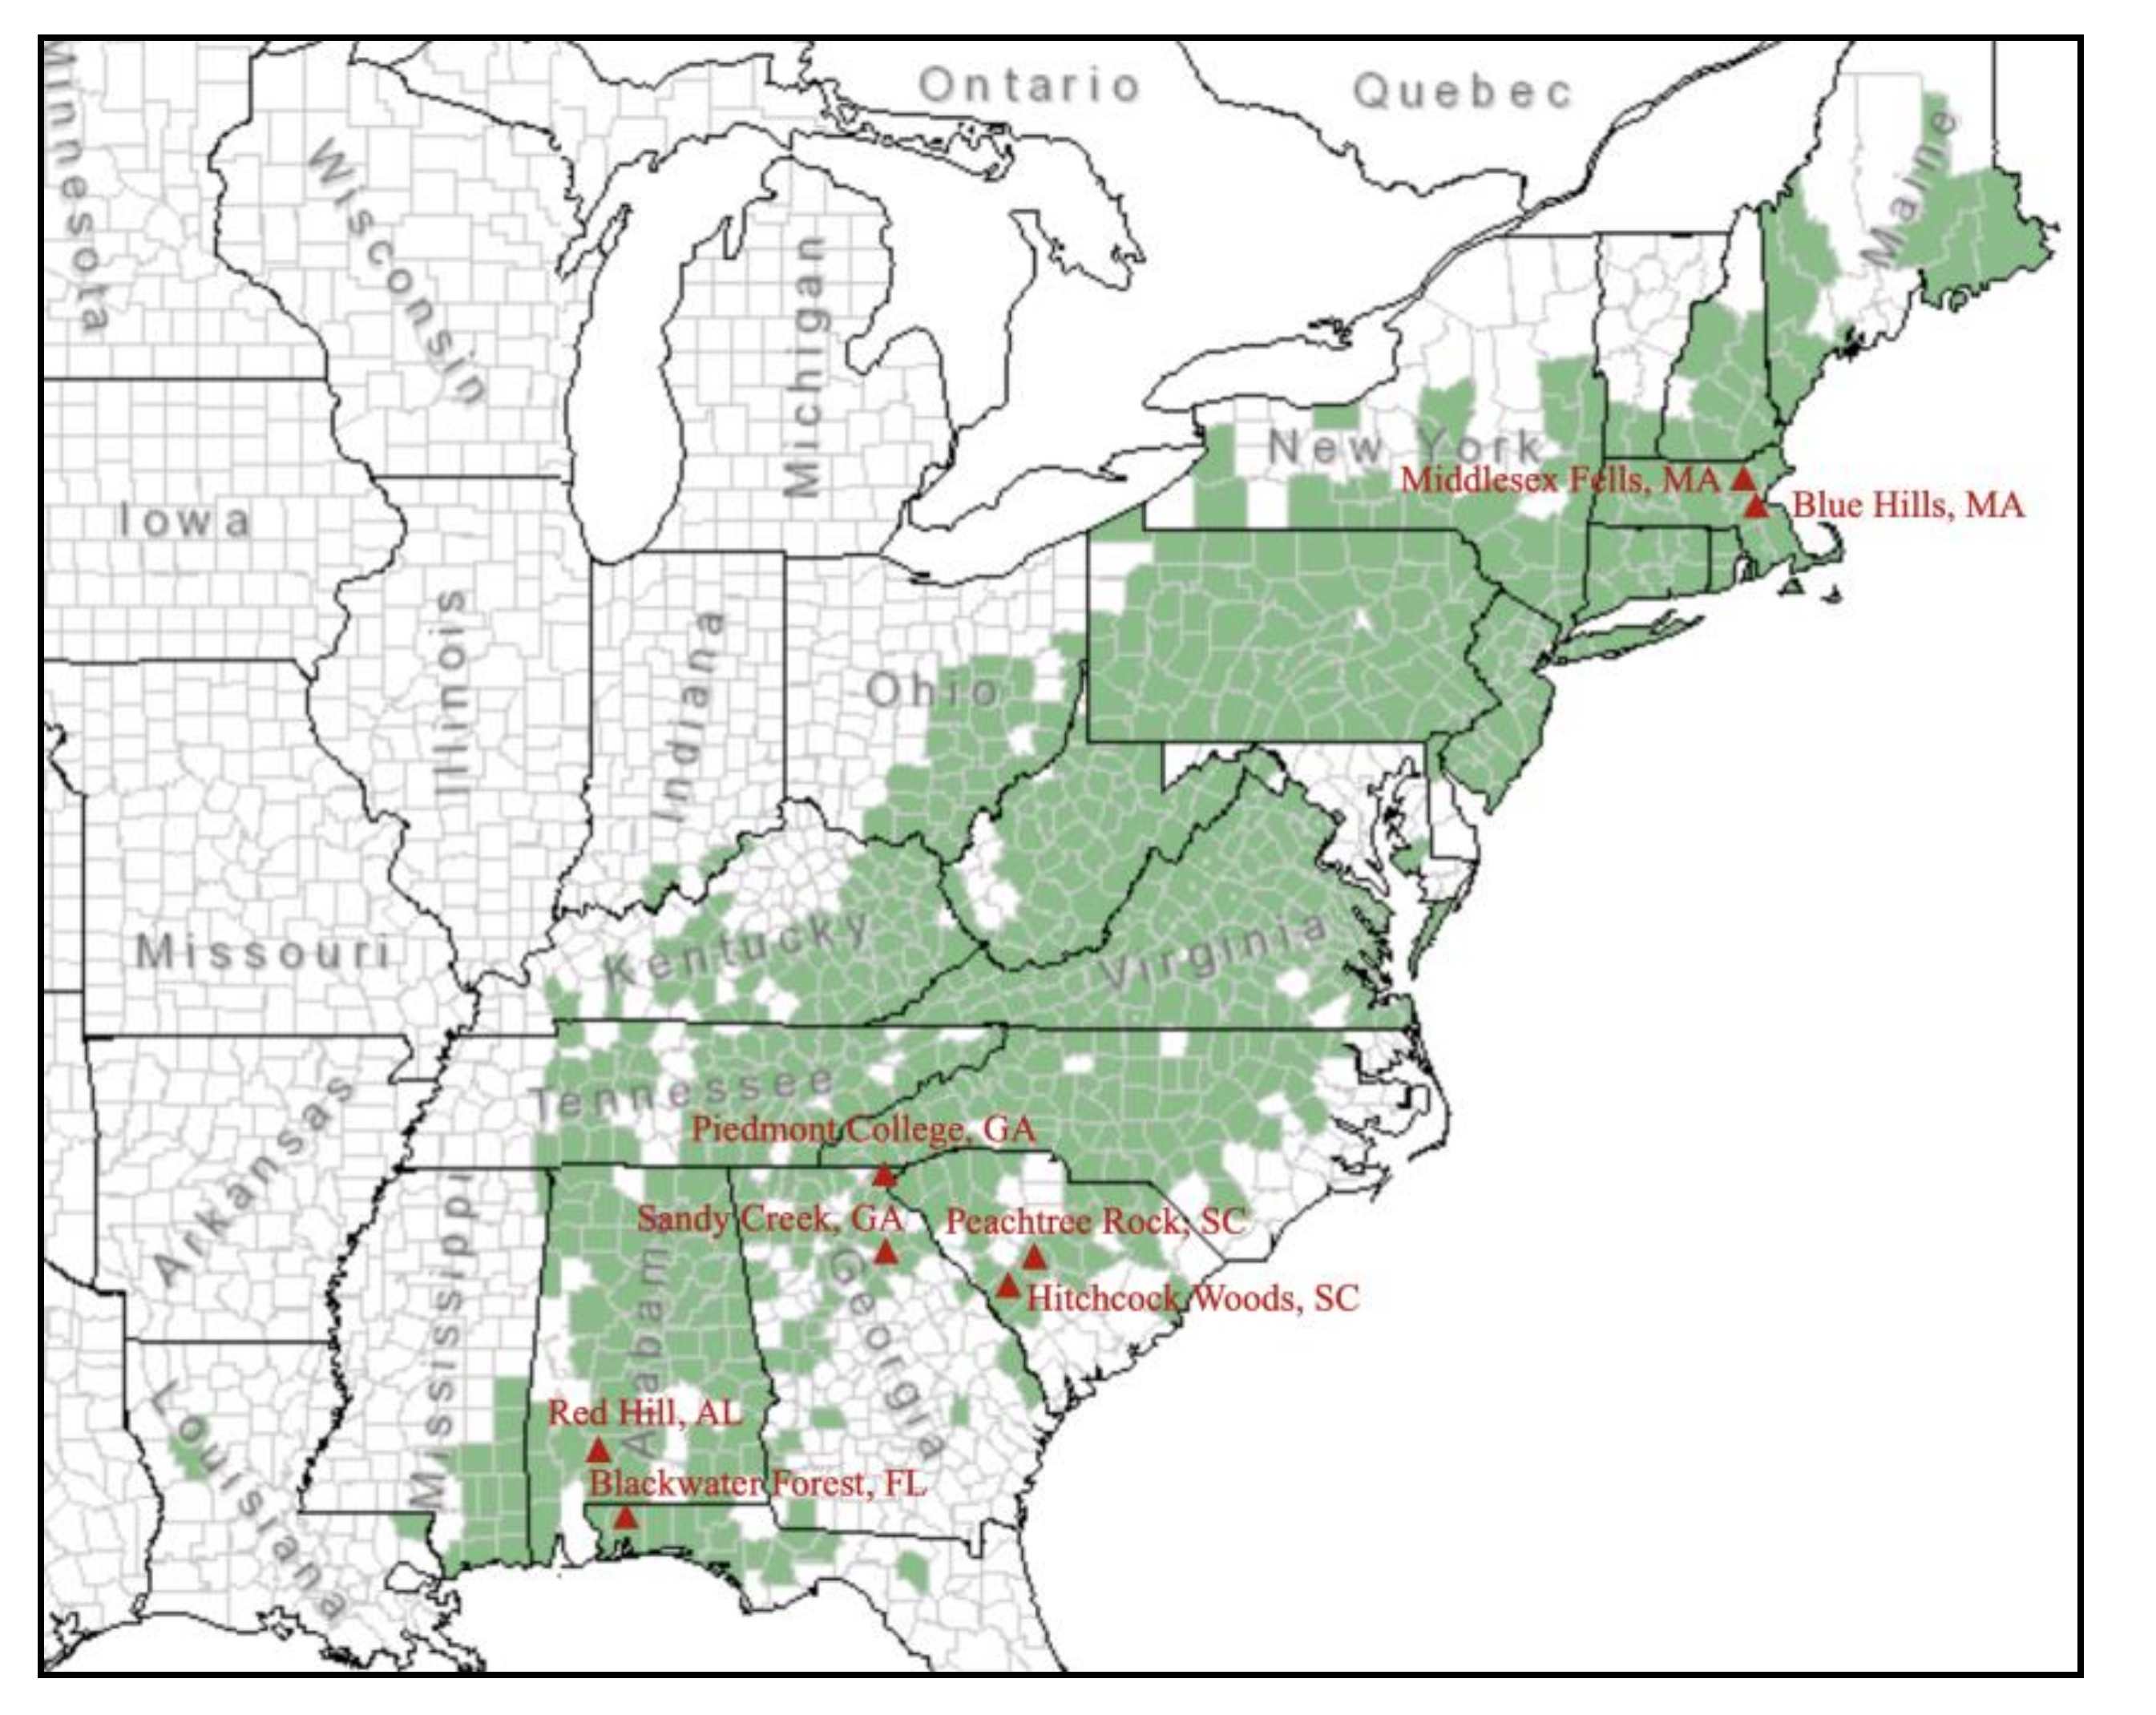
2.1. Plant Materials and Collection

K. latifolia naturally distributes in the eastern U.S. (Figure 1). Wild populations were identified in the native range, and eight populations with a minimum of 15 individuals were selected for sampling (Figure 1, Table 1). In each population, a random sample of six individual plants was obtained. Individuals were evenly distributed throughout the population and were at least 10 m away from each other. The youngest leaves were individually collected from six sampled plants and placed in six envelopes. Envelops were carefully labeled and placed in a heavy-duty zip-lock bag filled with 100 g silica gel. Leaf tissues were maintained in the bag until being transported back to the laboratory and stored at −80 °C. Genomic DNA was extracted from 100 mg leaf tissue using Plant DNAzol® Reagent (Invitrogen, Carlsbad, CA) following manufacturer’s protocols. The DNA samples were diluted to 10 ng·μL−1 and then stored at −20 °C until further analysis.

2.2. ISSR Procedure

Cultivars “Olympic Fire”, “Ostbo Red” (maternal parent of “Olympic Fire”), and “Starburst” were used to screen 96 ISSR primers designed by the University of British Columbia (UBC 801-896). Eight primers were selected based on the strong, clear, reproducible, and polymorphic banding patterns they produced. ISSR-PCR amplifications were performed in a total volume of 20 μL consisting of 2 μL (20 ng) template DNA, 2 μL primer, 10 μL master mix (Applied Biosystems, Foster city, CA, USA), and 6 μL double-distilled water. The amplifications were programmed in a Mastercycler nexus gradient (Eppendorf, Hamburg, Germany) under following conditions: an initial denaturation step at 94 °C for 5 min; 40 cycles of 94 °C for 30 s, 52 °C for 50 s, and 72 °C for 120 s; followed by an extension for 7 min at 72 °C. Samples were then cooled to 4 °C and placed in a refrigerator until being loaded into gels. The PCR products were electrophoresed on 1.2% (w/v) agarose gels that, in 0.5 × TBE buffer solution (Fisher Scientific, Fair Lawn, NJ, USA) (80 V for 3.5 h) and stained with 0.5 mg·L−1 ethidium bromide solution (Sigma-Aldrich, St. Louis, MO, USA). 100-bp DNA ladder (Invitrogen, Carlsbad, CA, USA), were loaded onto the outside two lanes of each gel to estimate the size of amplified fragments. Gels were visualized and photographed using a BioDoc-ItTM Imaging System (UVP, Upland, CA, USA).

2.3. Data Analysis

ISSR amplified fragments were scored based on the presence (1) or absence (0) for each sample, and values recorded in Excel. POPGENE version 1.32 [22] were used to calculate the following parameters: total number of observed alleles (Na), mean observed number of alleles (Noa), mean effective number of alleles (Nea), Nei’s gene diversity (h), Shannon’s information index (I), percentage of polymorphic bands (PPB) for each population, Nei’s unbiased genetic identity and distance [23], the total genetic diversity (HT), mean genetic diversity within populations (HS), coefficient of genetic differentiation among populations [GST = (HT-HS)/HT], and pairwise Gst between populations [24]. Analysis of molecular variance (AMOVA) was employed to determine the partitioning of genetic variance within and among populations using Arlequin version 3.5.2.2 [25]. The significance of this F-statistic was tested with 1000 random permutations. The average genetic distance (AD) of each individual was firstly calculated. A group of genetically distinct individuals was subsequently identified by a means of iteration through the stepwise selection (proportional increment of 0.1 with 9 steps) of individuals with the highest AD values and AMOVA for the assessment of the change of genetic differentiation in the selected individuals using AveDissR [26]. Additionally, PCA was performed on a pairwise genetic distance matrix using AveDissR. Eigenvectors were obtained using “vegan” cmdscale, and the first two principal components were selected for a scatter plot. The generated PCA plot of the genetic associations between the identified group and original samples was used to assess the representativeness of the selected individuals [26].
The genetic structure of the investigated populations was analyzed using STRUCTURE version 2.3.4 [27]. The number of discontinuous K was estimated from two to ten with 20 replicates; both the value of Markov chain Monte Carlo (MCMC) and the length of burn-in period were set to 100,000 times. Subsequently, structure harvester (http://taylor0.biology.ucla.edu/structureHarvester) [28] was used to harvest the optimum number of cluster (K) according to the greatest delta K value. CLUMPAK was then used to perform repeated sampling analysis and generate genetic structural plot [29]. In this approach, each sample was assigned to populations (named RPs and MIX) according to its maximum membership coefficient (Q value) using a threshold value of 0.65 based on the optimum K value. Each sample was assigned to RPs if its Q value was above 0.65; otherwise, it was grouped into MIX [30]. An unweighted pair group method with arithmetic mean (UPGMA) dendrogram, based on Nei’s unbiased genetic distance, was generated to determine the relationships among all individuals using NTSYS-pc version 2.10e [31]. Additionally, Mantel tests were conducted between the matrices of geographic distance and pairwise Gst, geographic distance and Nei’s unbiased genetic distance, and Nei’s unbiased genetic distance and pairwise Gst using R, respectively.

3. Results

3.1. ISSR Polymorphism

Ninety-six ISSR primers were screened in this study, and eight primers were employed to assess the genetic diversity and structure of K. latifolia in the eastern U.S. based on the strong, clear, reproducible, and polymorphic banding patterns they produced. A total of 116 bands were generated in 48 K. latifolia individuals by eight ISSR markers, of which 105 (90.52%) were polymorphic. The number of bands amplified per primer ranged from 10 to 19, with an average of 14.5 (Table 2). The molecular weight of bands was found between 150 and 2000 base pairs (bps).

3.2. Genetic Diversity

Among eight investigated populations, the percentage of polymorphic band (PPB) ranged from 40.52% to 56.03% (Table 3). With the largest PPB, Piedmont College population also had the largest number (97) of observed alleles (Na), Nei’s gene diversity (h) of 0.2213, and Shannon’s information index (I) of 0.3249, while Blue Hills, with the smallest PPB, showed the smallest Na (78), h of 0.1485, and I of 0.2224. The overall within-species genetic diversity results were PPB = 90.52%, h = 0.3089, and I = 0.4654, assessed by ISSR analysis.
Both Nei’s genetic differentiation and AMOVA analysis were performed to investigate the distribution of genetic diversity within and among populations. The total genetic diversity at the species level (HT) and average genetic diversity within populations (HS) assessed by ISSR were 0.3089 and 0.1912, respectively. The coefficient of genetic differentiation (GST) for eight populations was estimated as 0.3809, which indicated that 38.09% of the total genetic diversity was distributed among populations (Table 4). Pairwise Gst between populations varied from 0.1818 to 0.3586, with smaller values between populations in a geographic group (0.1818–0.2023), while larger values between populations inhabited different geographic regions (0.2049–0.3586) (Table 4 and Table 5). The AMOVA analysis revealed that 29.54% (P < 0.001) of genetic variation occurred among populations, while 70.46% (P < 0.001) of variation was observed within populations (Table 6), which was consistent with the results of Nei’s genetic differentiation analysis.

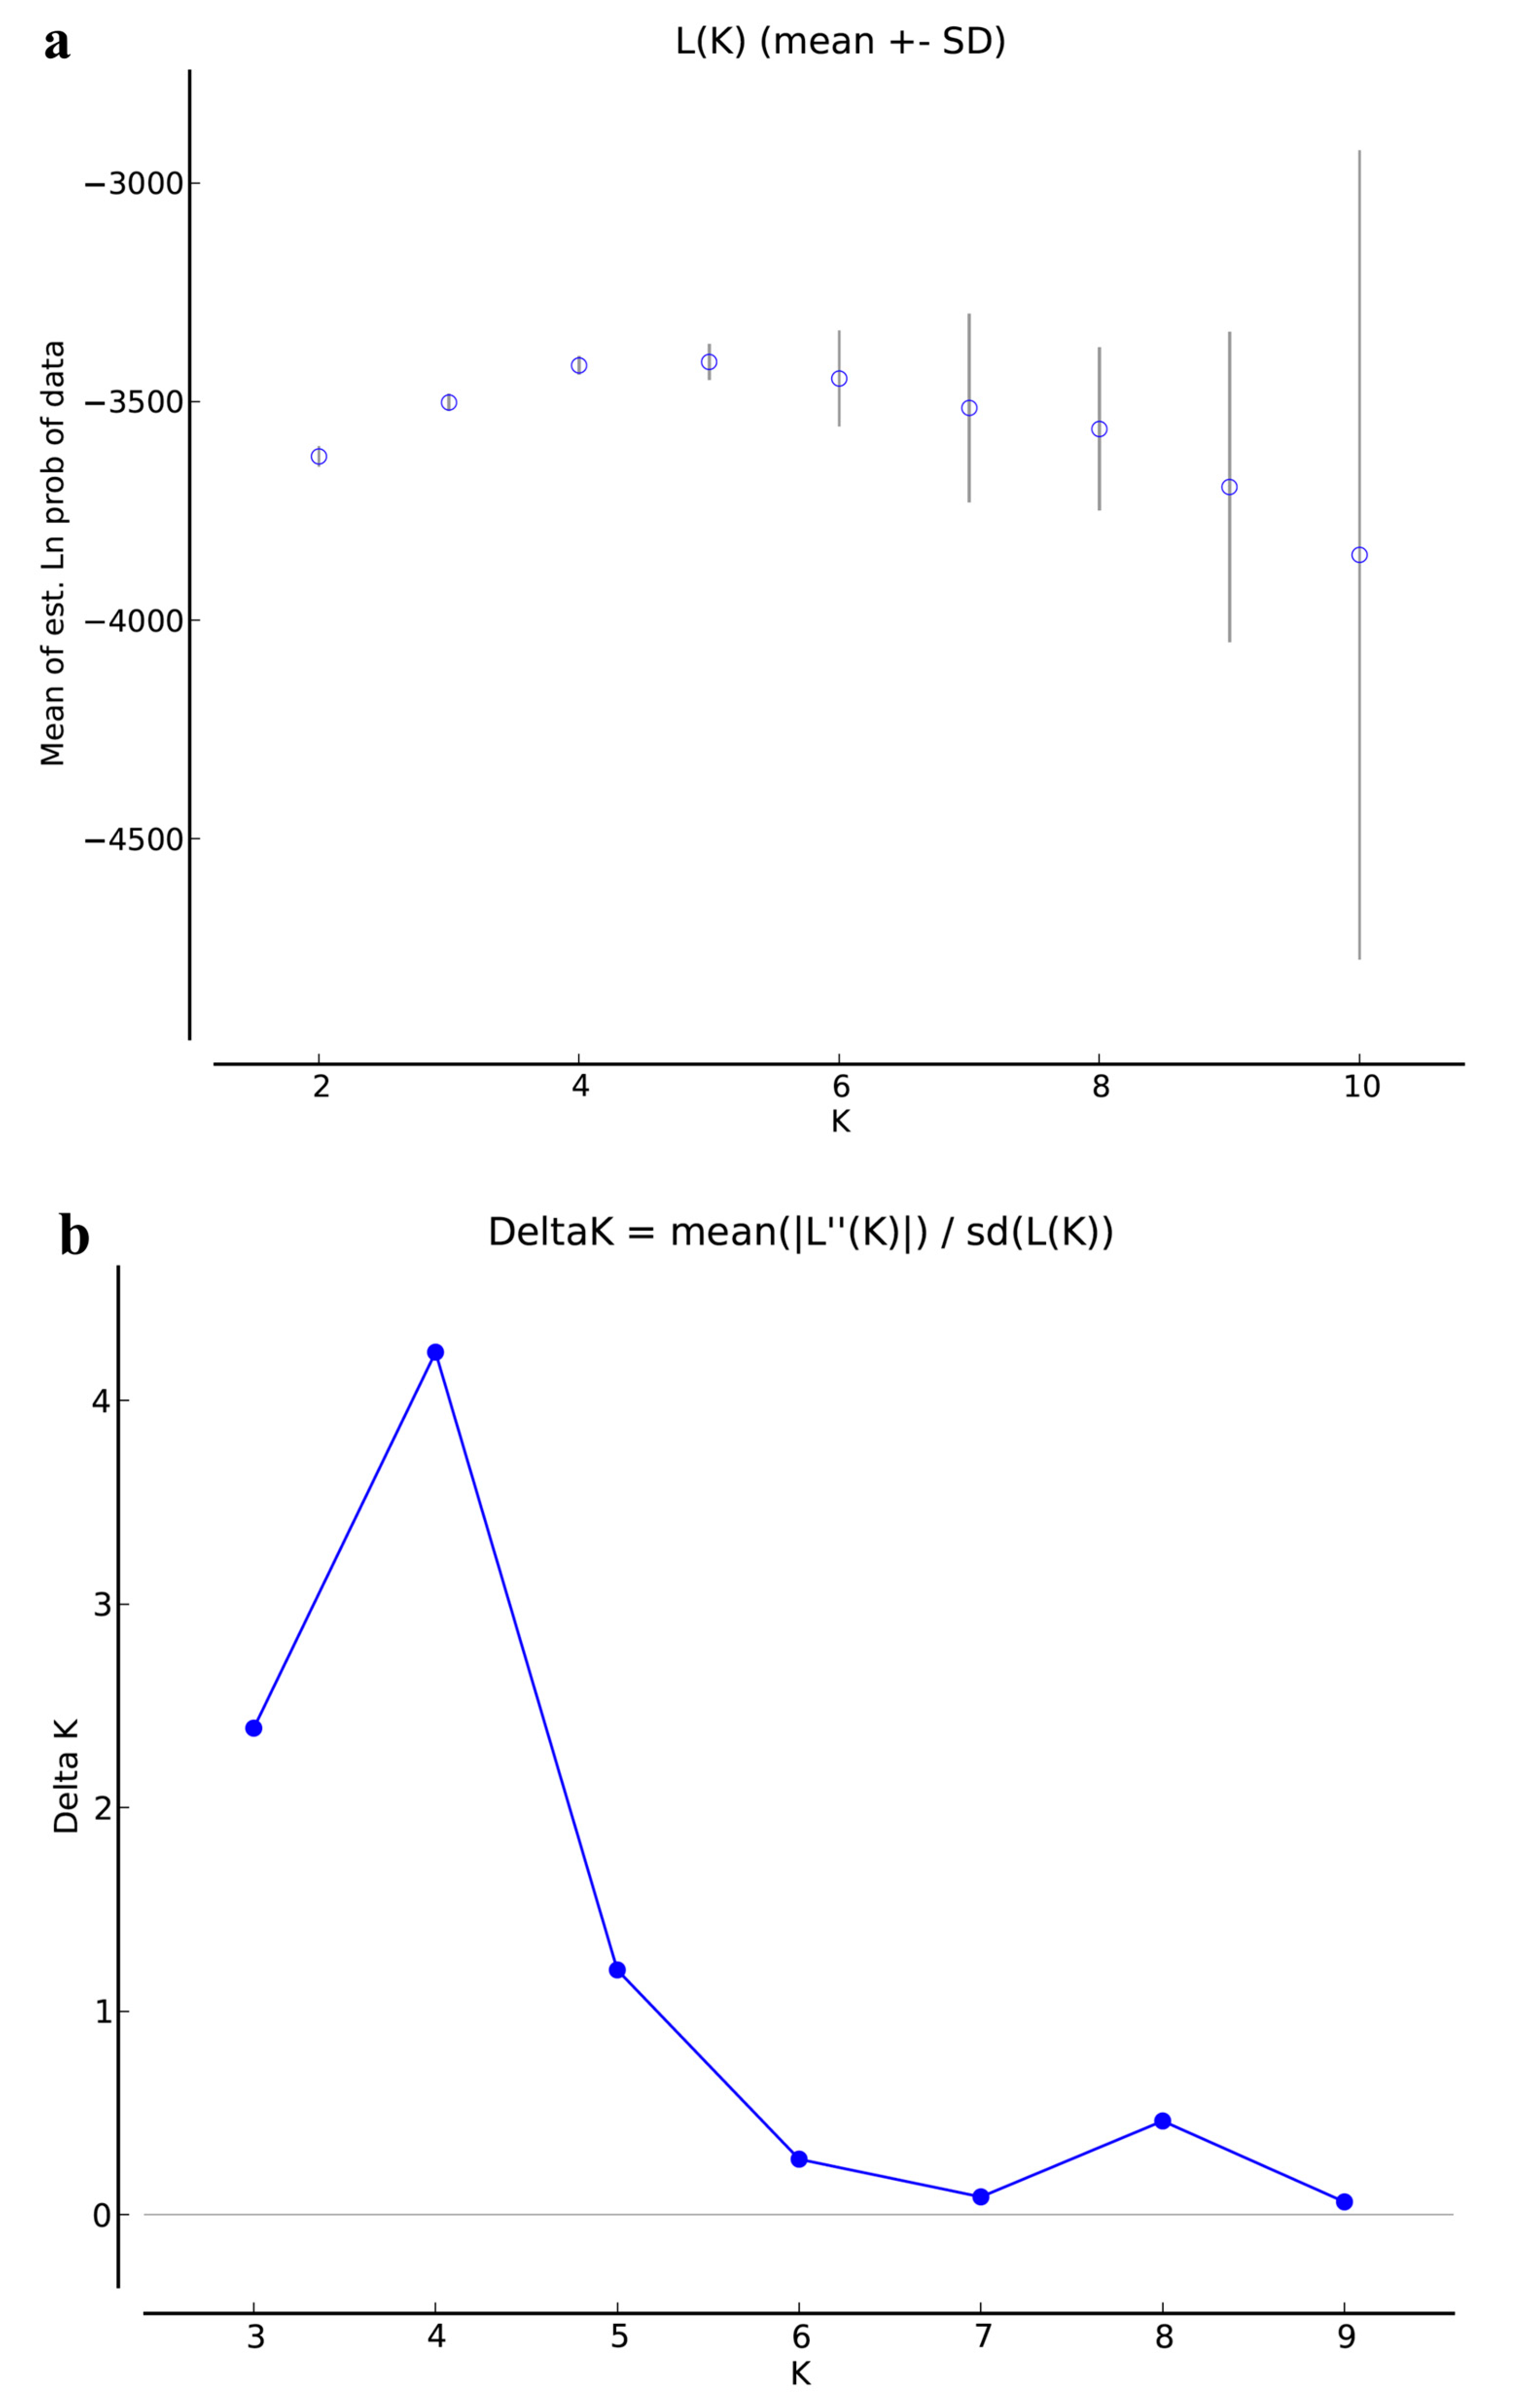
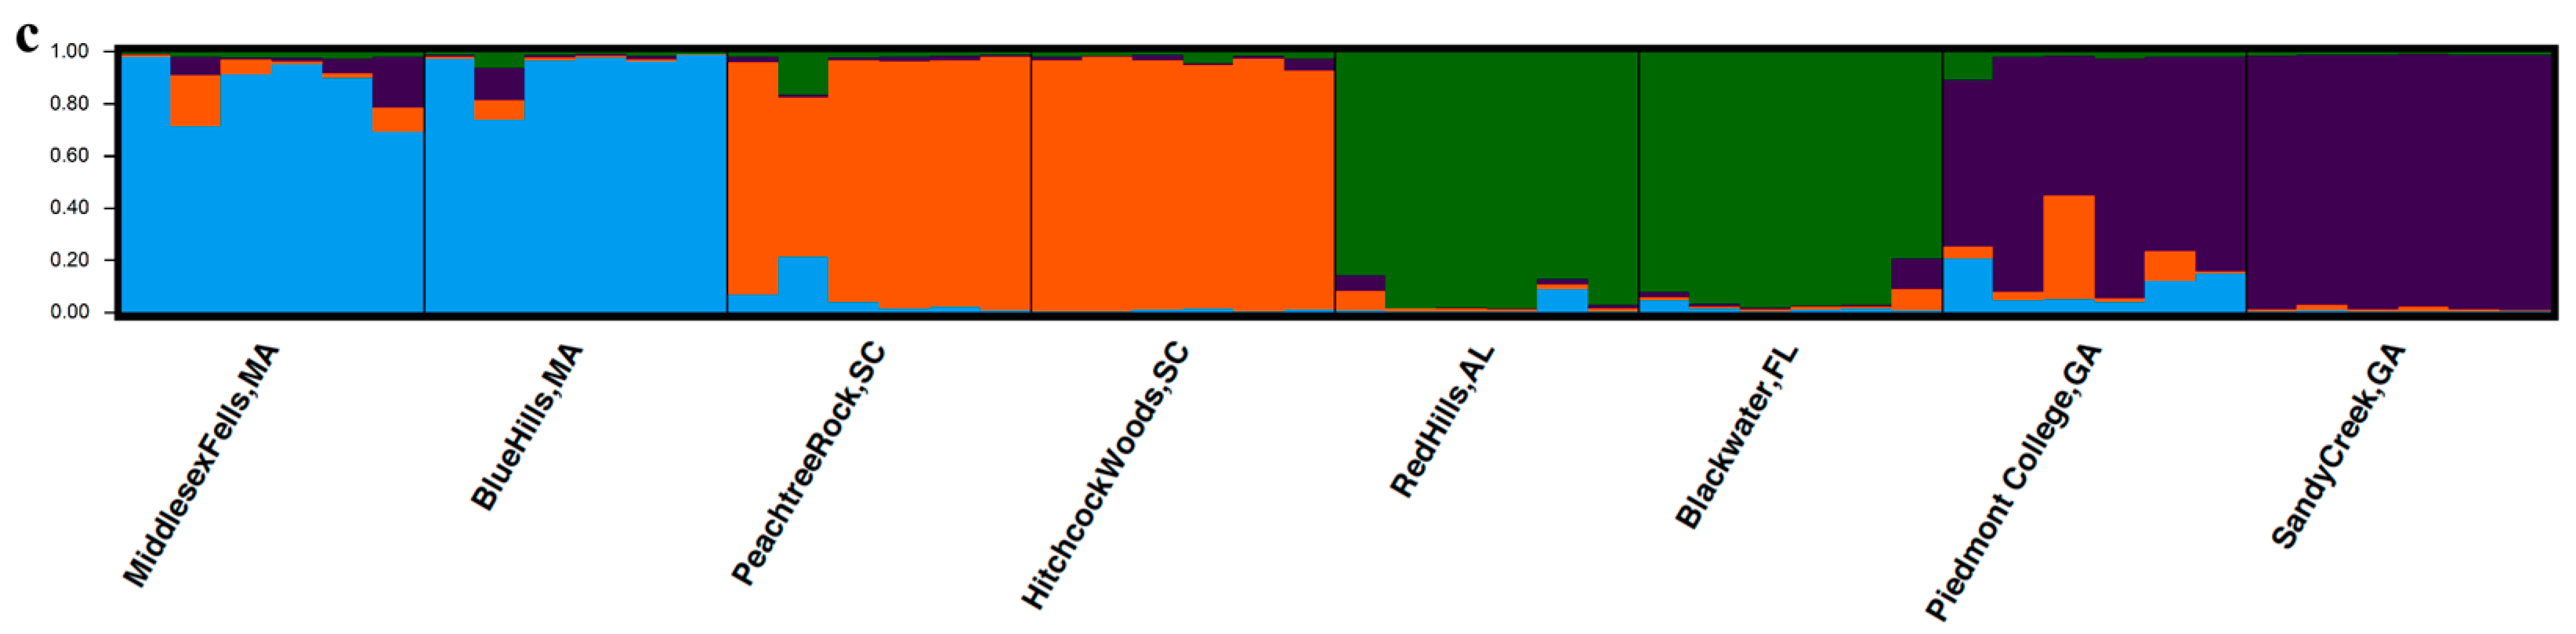
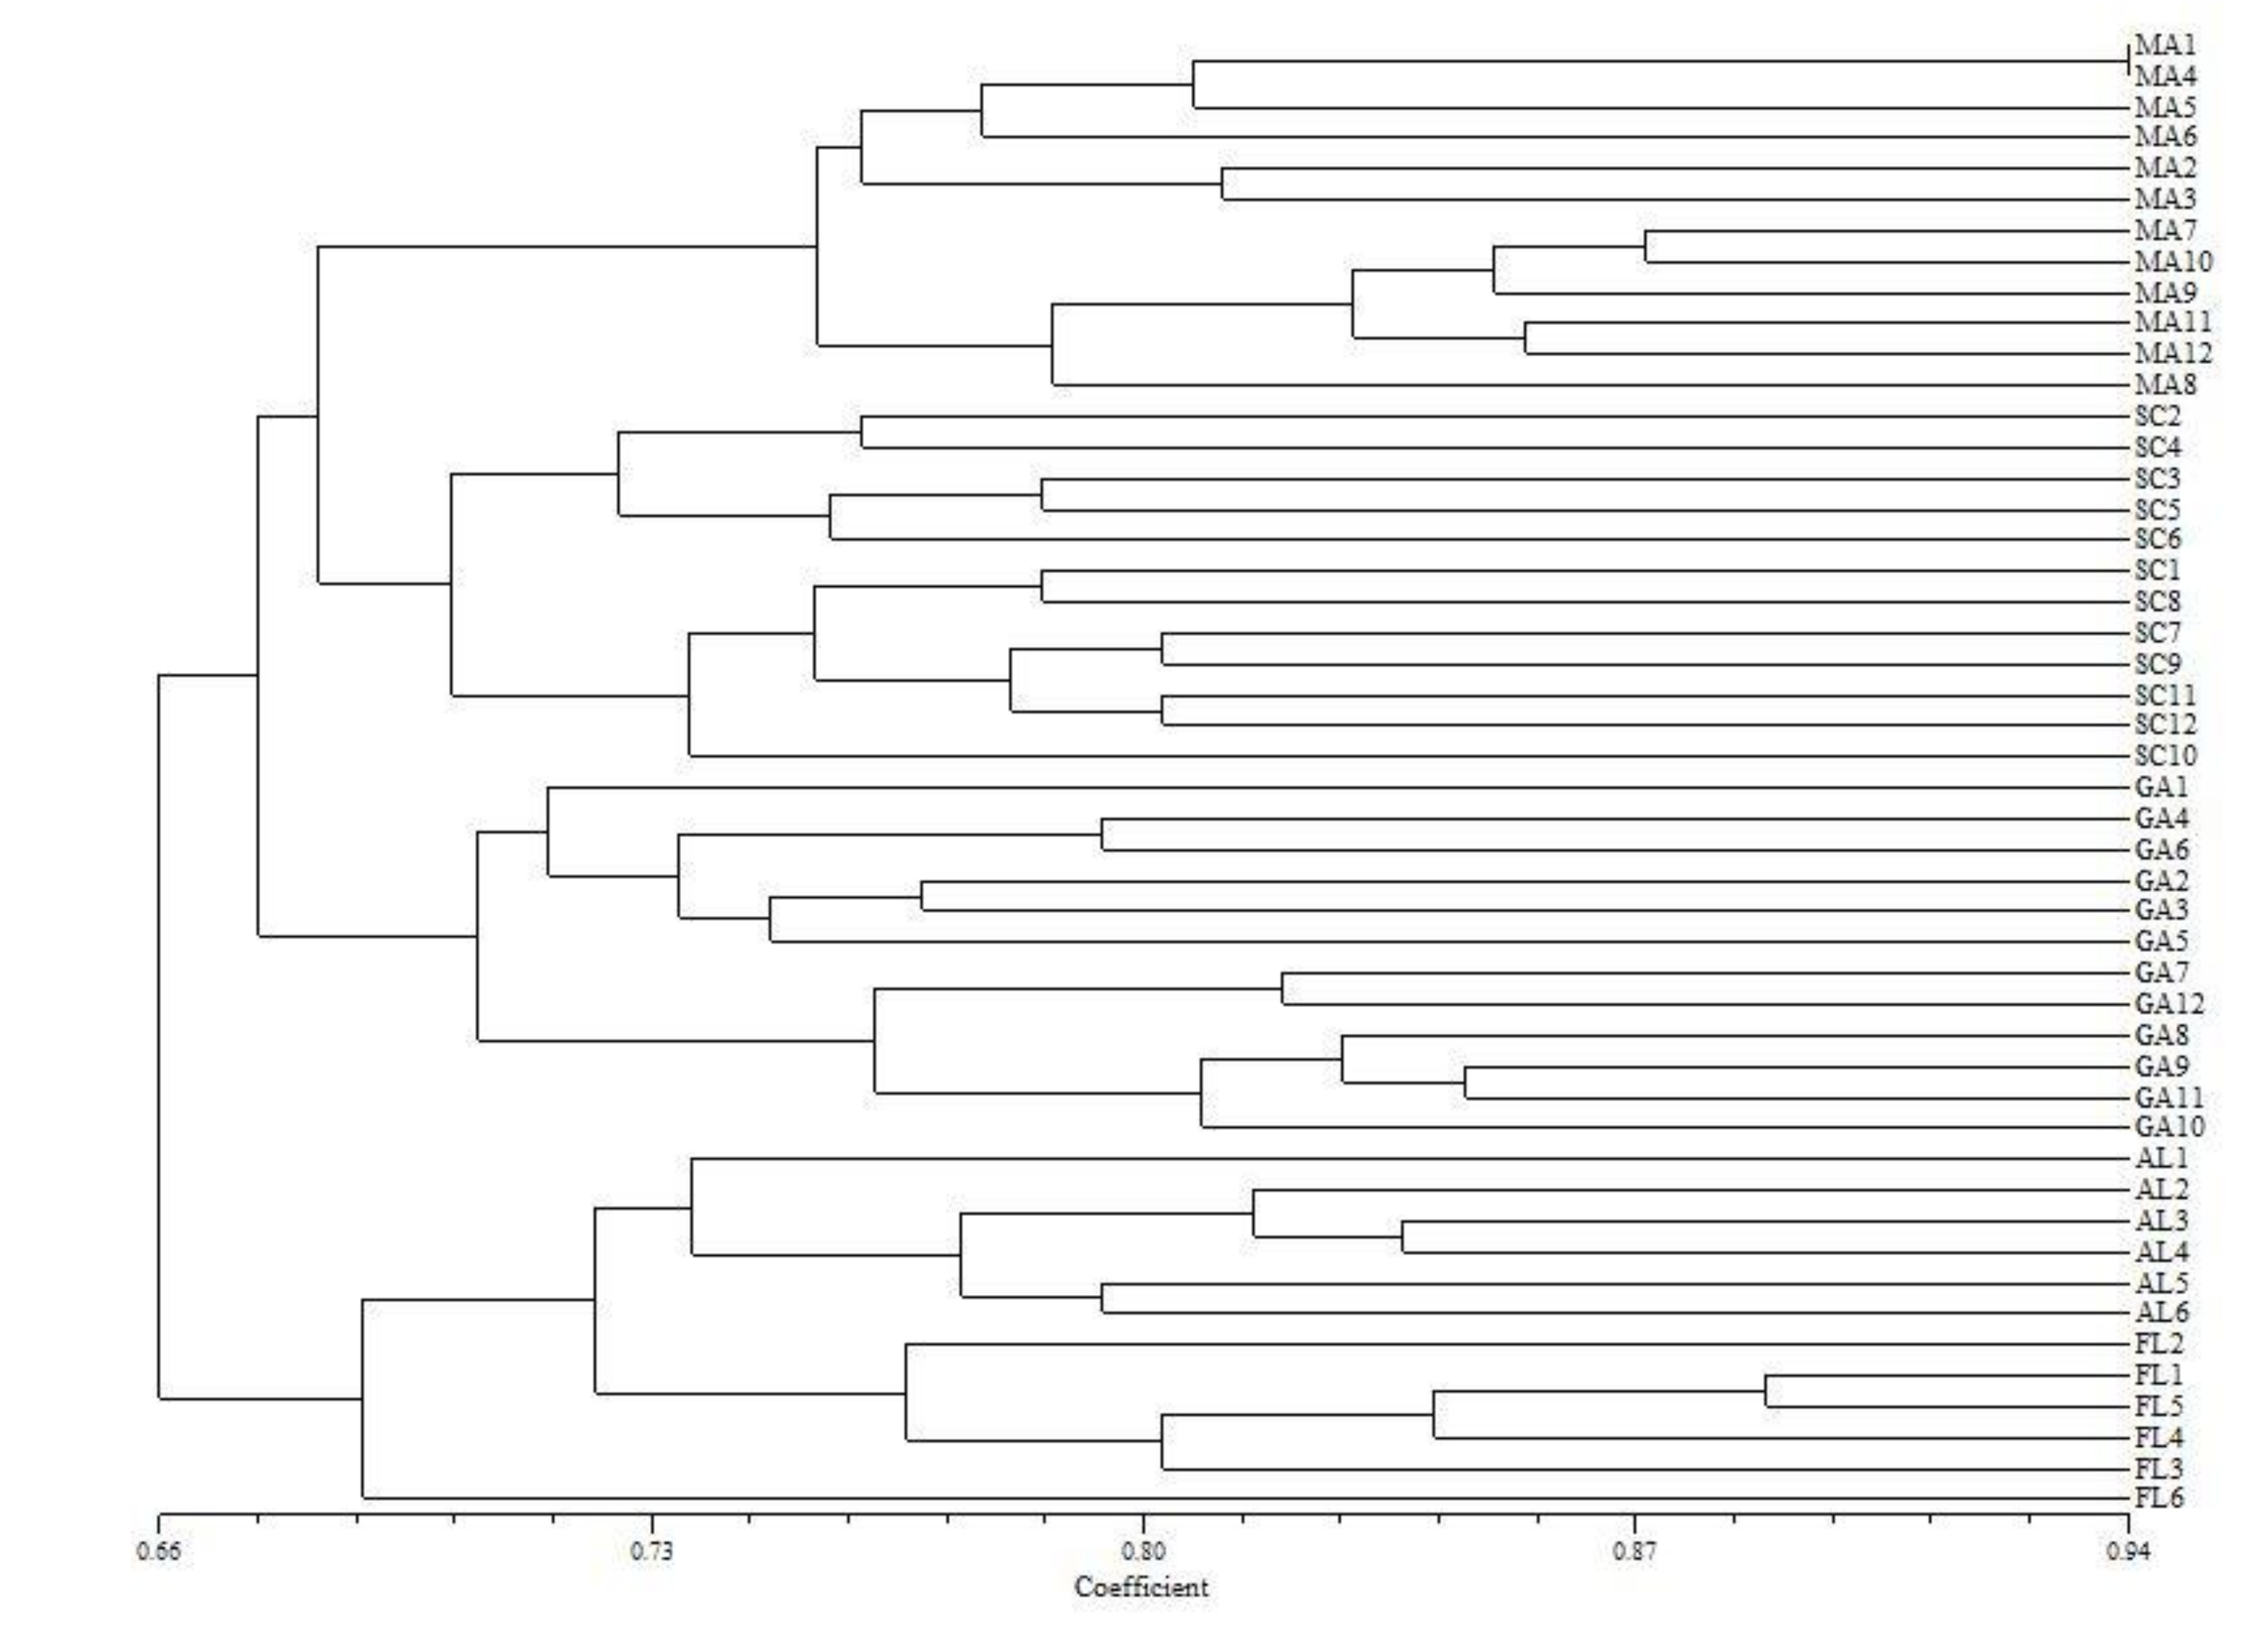
3.3. Population Structure

An admixture model-based approach was performed to evaluate the population structure of 48 K. latifolia samples. The optimal cluster value (K) of sampled individuals was four, with the highest values of both LnP(K) (log probability of data, - 3417.37) and delta K (4.24) obtained from the structure harvester (Figure 2a,b). Based on K of four, a bar plot of estimated membership coefficients of each sample was displayed in Figure 2c. Each sample was represented by a vertical line, and each color displayed the proportion of membership of each sample to the four clusters. The individual with the maximum membership coefficient (Q value) higher than 0.65 was recognized as a pure one and lower than 0.65 was an admixture one. In the analysis, 45 individuals were relatively pure and the other three were more complex. The blue cluster consisted of 12 Massachusetts pure individuals, and the green cluster included 12 pure individuals sampled from the southernmost range. The orange and purple group comprised 12 South Carolina individuals with 11 pure and one admixture one and 12 Georgia individuals with 10 pure and two admixture ones, respectively.
Nei’s unbiased genetic distance between populations ranged from 0.0868 to 0.2201, with smaller distance (0.0868–0.1061) between populations in the same geographic group than that between populations inhabiting different geographic regions (0.1151–0.2201) (Table 7). The UPMGA dendrogram was then generated based on Nei’s unbiased genetic distance between K. latifolia individuals, which showed similar results to the STRUCTURE analysis (Figure 3). Six individuals within the population were clustered together. Meanwhile, populations located in a geographic region were grouped into a cluster and four clusters correlated with four geographic regions were observed. Average genetic distance (AD) of 48 sampled individuals varied from 0.2777 to 0.3650 (Figure 4a). Nine groups were then generated through stepwise selection, which included 5, 9, 14, 18, 25, 30, 35, 40, and 45 individuals with the highest AD values, respectively. By assessing the changes in genetic differentiation with the increased selection of individuals with the highest AD values using AMOVA, 40 individuals (in the eighth step) were identified as the genetically distinct ones because they largely maintained the extent of genetic differentiation (percentage of variance among populations of 29.33%) in 48 original samples (29.54%). The PCA plot of the genetic associations between 40 selected and 48 original individuals showed the representativeness and genetic distinctness of selected individuals (Figure 4b).
Mantel tests between the matrices of geographic distance and pairwise Gst (Figure 5a), geographic distance and Nei’s unbiased genetic distance (Figure 5b), and Nei’s unbiased genetic distance and pairwise Gst (Figure 5c) were subsequently performed, respectively. The results indicated that the correlation between geographic distance and pairwise Gst (r2 = 0.5646, P = 0.0004) as well as between geographic distance and genetic distance (r2 = 0.4715, P = 0.0166) were not as significant as that between genetic distance and pairwise Gst (r2 = 0.9629, P = 0.0001).

4. Discussion

4.1. Effectiveness of ISSR in K. latifolia

Although the reduced accuracy of estimation of genetic diversity using dominant markers was reported, it has been well documented that ISSR is a reliable technique for detecting DNA polymorphisms and assessing genetic diversity of many woody plant species [16,17,18]. Even though no ISSR analysis study has been carried out on K. latifolia, numerous similar researches have been conducted on other two genera, Rhododendron and Vaccinium, in Ericaceae. Zheng et al. found that 13 ISSR primers amplified 106 fragments in Rhododendron hybrdum in total, of which 85.48% were polymorphic, and each primer produced 9.5 bands in average [21]. In nine cold-hardy Rhododendron spp., thirteen ISSR primers amplified fragments between 300 and 2000 bps, and 90.63% of them were polymorphic [20]. In blueberries, six ISSR primers generated 87 bands, of which 80.4% were polymorphic [32]. Similar to the results reported by these studies, ISSR produced reproducible and highly polymorphic fragments in present study, which indicated that ISSR was a reliable and effective technique to amplify the loci between microsatellites in K. latifolia.

4.2. Genetic Diversity and Differentiation of K. latifolia

Genetic diversity in wild plant species is generally related to life form, mating/breeding system, seed dispersal, geographic range, and population size. In this study, ISSR analysis of eight investigated K. latifolia populations revealed a high level of genetic diversity at the species level (h = 0.3089, I = 0.4654, PPB = 90.52%) (Table 3). The considerable existing genetic diversity in K. latifolia could be predominantly explained by life form, breeding system, and geographic range. Generally, long-lived perennial species having a mixed breeding system and regional distribution have relatively high genetic diversity [33]. K. latifolia is a long-lived, perennial, evergreen shrub that is regionally distributed in the eastern U.S. It is a cross-pollinating species that relies on insects, bumble bees in particular, for pollination [1]. Anthers eventually release without a visitor at the end of floral life, and this autonomous selfing assures reproduction in the absence of pollinators. Hence, K. latifolia has been considered as a species with predominant out-crossing and low selfing ability [34]. This association has resulted in a high level of within-species genetic diversity of K. latifolia. The observed high genetic diversity indicated that K. latifolia should be able to adapt to environmental changes, and thus being able to distribute along different latitudes.
For dominant markers, the proportion of genetic diversity attributed to among-population variation (GST = (HT-HS)/HT) has been widely used to estimate genetic differentiation among populations [35,36]. GST of eight K. latifolia populations was 0.38, which indicated that a low-to-moderate proportion of total genetic diversity was observed among populations (38.09%) whereas a relatively high level of diversity was found within populations (61.91%) (Table 4). The low GST values have been found in Rhododendron spp. (0.37 in R. aureum, 0.26 in R. prunifolium) that closely related to K. latifolia and other out-crossing species (mean GST of 0.22) [8,10,36]. Because of the high potential for pollen dispersal, out-crossing species tend to have higher level of gene flow among populations, which leads to a similar complement of alleles in similar frequencies and thus a low level of genetic diversity observed at the population level [35], whereas compared with other out-crossers, the level of genetic differentiation among K. latifolia populations was relatively higher [36], which might have been due to geographic distribution pattern of K. latifolia. Wild K. latifolia plants have been restricted in the eastern U.S. while distributed over a wide latitudinal range. Different phenological phases caused by temperature, light, and other environmental factors between different latitudinal populations have led to reduced pollination across them. For instance, K. latifolia populations at the southernmost range usually have a flowering time one month earlier than populations in Massachusetts according to our investigation. This gap in blooming period, coupled with the large geographic distance, could prevent insect pollination [37]. Therefore, a relatively higher level of among-population differentiation was observed on K. latifolia than other out-crossing species. Geographic distribution pattern could also account for the difference in pairwise Gst between populations. Due to limited barriers and phenotypical differences between populations within in a geographic group, insect pollination could take place easily between them, resulting in more frequent gene flow and hence smaller Gst values (0.1818–0.2023) than that between populations located at different geographic regions (0.2049–0.3586) (Table 4 and Table 5) [38]. AMOVA results (Table 6) indicated a small proportion of variation observed among populations (29.54%; P < 0.001) and a high level of variation within populations (70.46%; P < 0.001), which was consistent with observed GST value (0.38). The relatively low GST value corresponding with the low level of genetic variation among populations revealed by AMOVA elucidated that individuals within populations tended to be genetically different, but each population comprised a similar complement of alleles in similar frequencies [38].
One of the most commonly employed methods to estimate within-population diversity is HS, Nei’s average genetic diversity within populations. In contrast to the proportion of genetic diversity partitioned among and within populations estimated by GST and AMOVA, HS is a direct measure of average diversity within populations [36]. HS of eight K. latifolia wild populations was 0.1912 (Table 4), which was lower than that of other out-crossing species (mean HS = 0.27) [36] yet reasonable. One likely cause for overall lower diversity within populations was small population size. A trend toward lower genetic diversity for smaller populations was illustrated by previous studies [8,10,39]. The populations surveyed in present study inhabit a relatively small geographic area. Differing from larger populations, insects could cover the entire population and easily transport pollen among all individuals of the population, leading to gene flow among individuals and thus significant reductions in heterozygosity. In addition to population size, the capability of selfing of K. latifolia might be a factor causing the lower diversity within populations, compared with other out-crossers, supported by the HS approaching that of species having mixed breeding system (mean HS = 0.18) [36]. Some extent of inbreeding due to small population size and selfing ability could increase the expression of recessive deleterious alleles and result in inbreeding depression in individuals that were likely to be eliminated, which could reduce the genetic diversity within populations [10]. The difference in within-population genetic diversity was observed among populations, which might be predominantly accounted by population size. The lowest genetic diversity was observed in Blue Hills population (h = 0.1485, I = 0.2224), which was the smallest of eight investigated populations (<20 individuals), followed by Sandy Creek population, where approximately 20 individuals formed a small patch (Table 3). In contrast, Piedmont College population, which inhabits the largest geographic area, exhibited the highest genetic diversity (h = 0.2213, I = 0.3249).

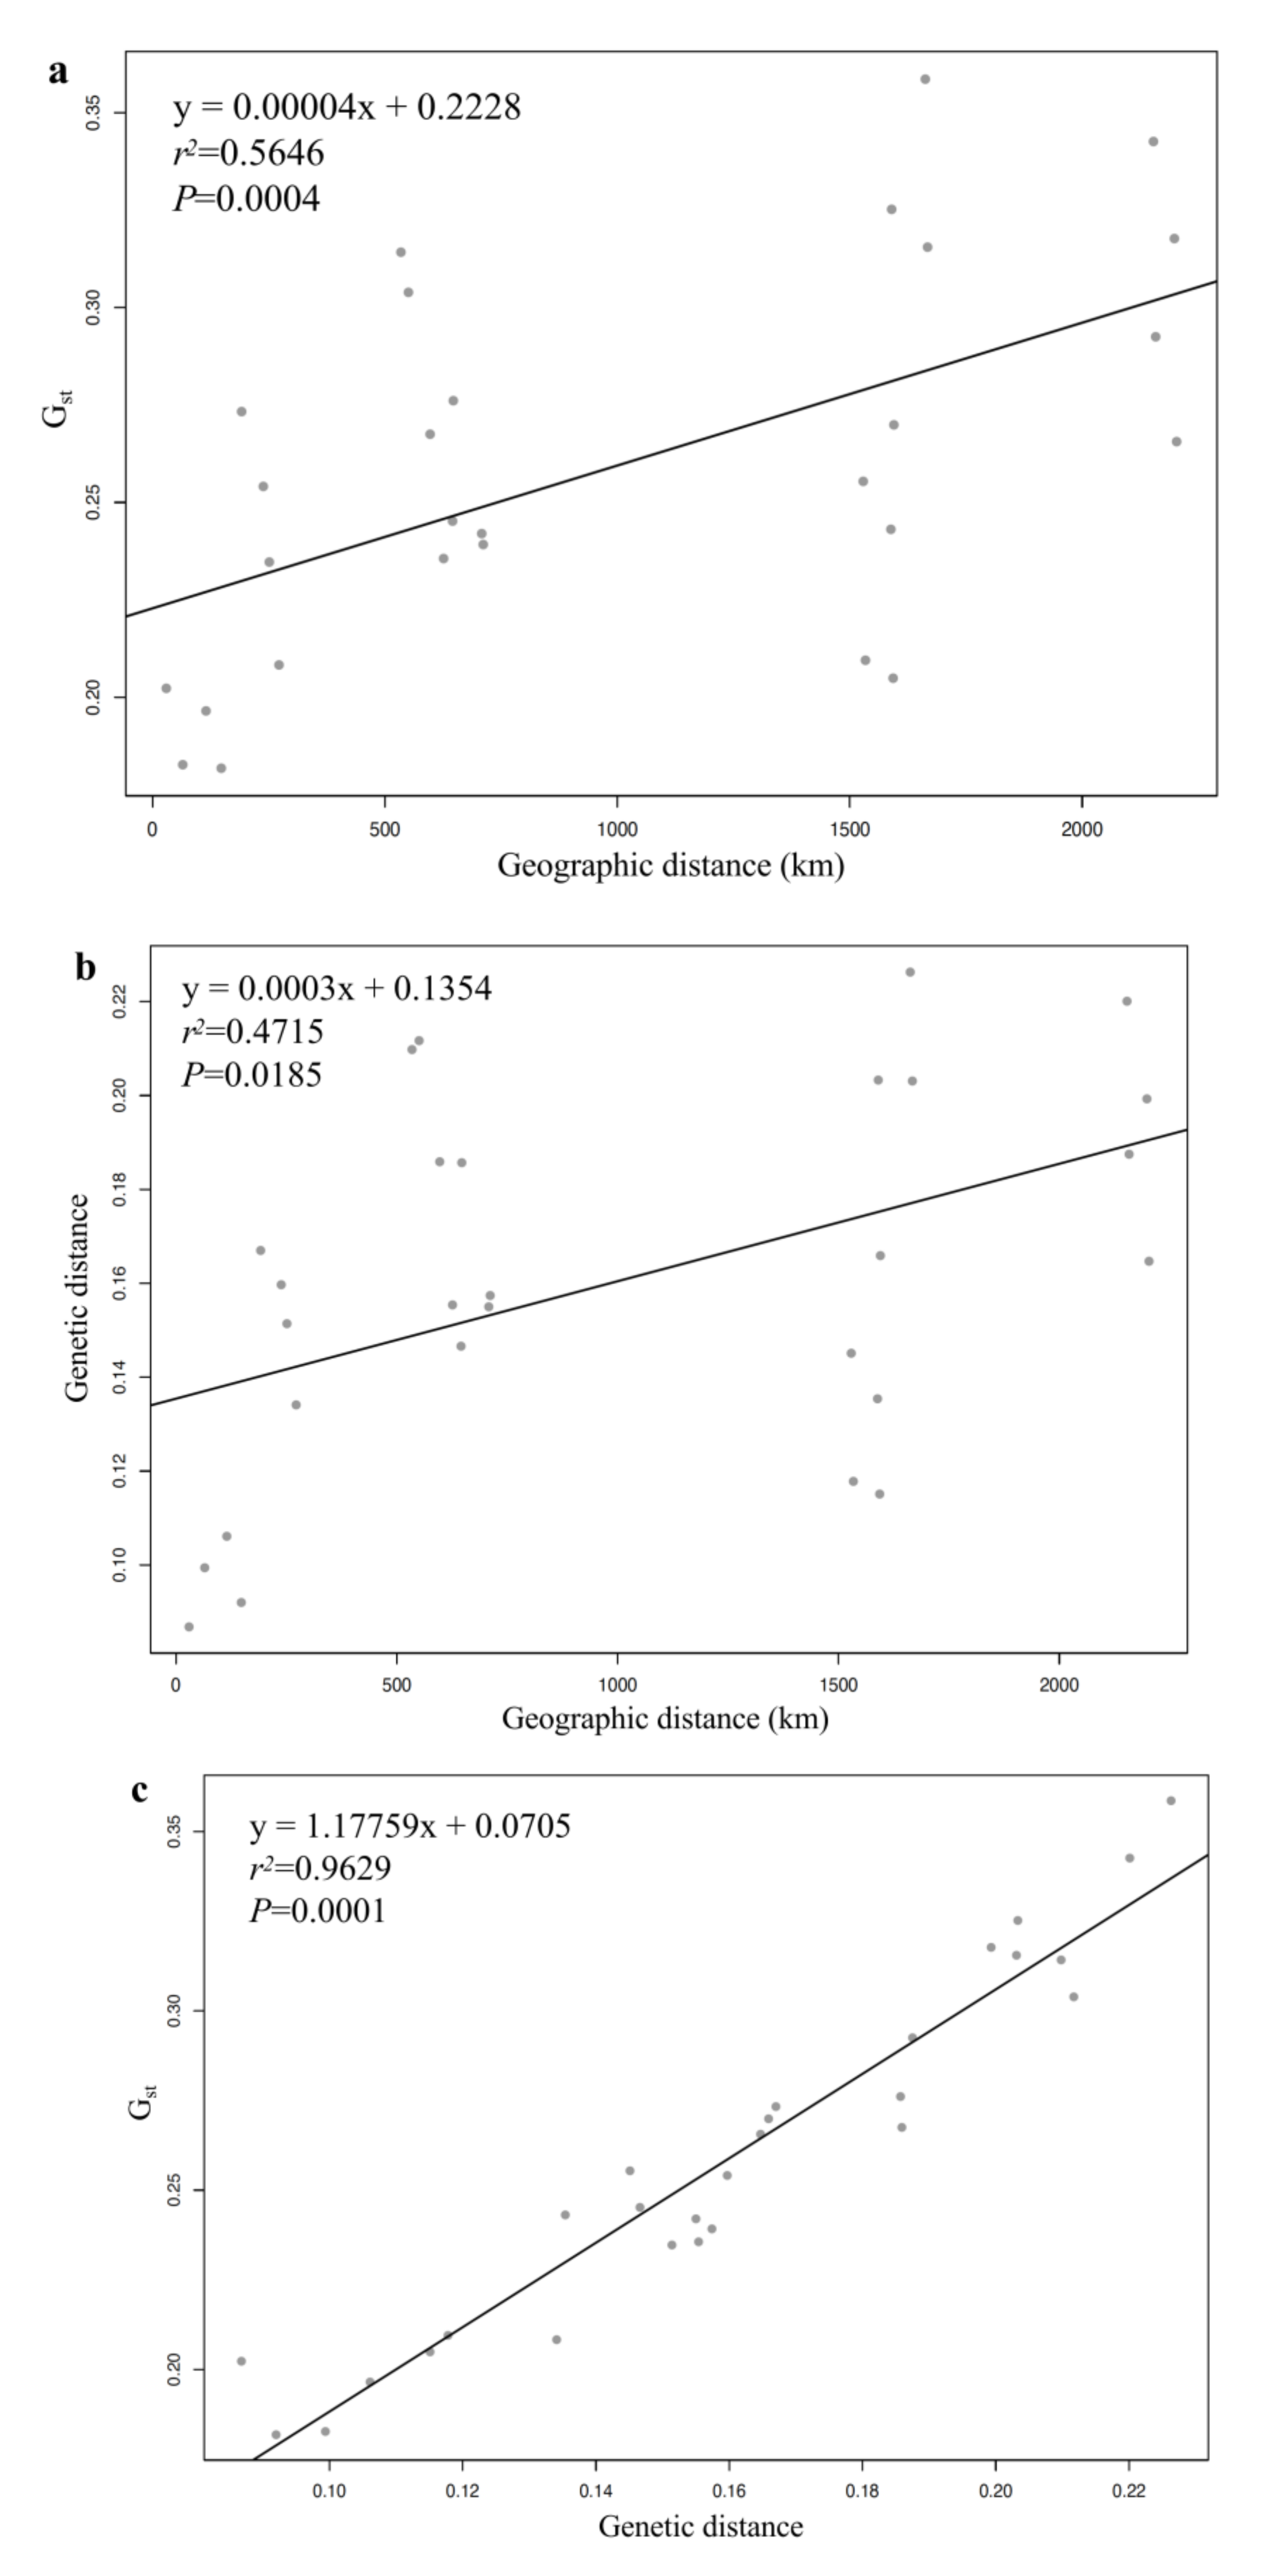
4.3. Population Structure of K. latifolia

The population structure of 48 K. latifolia individuals assessed by STRUCTURE indicated four clusters corresponding with four geographic regions (Figure 2c). Among 48 individuals, 45 were relatively pure according to Q > 0.65 as the pure standard. The other three, including two individuals sampled from Piedmont College and one from Peachtree Rock population, were more complex, which suggested that they were genetically admixed. Individuals within populations tended to be genetically diverged, resulting in higher genetic diversity in Piedmont College (h = 0.2213, I = 0.3249) and Peachtree Rock population (h = 0.2174, I = 0.3194), compared with other six populations (Table 3). Nei’s unbiased genetic diversity and UPGMA dendrogram revealed the population structure that was consistent with STRUCTURE result. Smaller Nei’s unbiased genetic distance was observed between populations in a geographic group (0.0868-0.1061) and compared with that between populations inhabiting different geographic regions (0.1151–0.2201) (Table 7). For instance, two populations in South Carolina, Peachtree Rock, and Hitchcock Woods had the genetic distance of 0.0994, while Hitchcock Woods population was 20.33% genetically different to Blue Hills population in Massachusetts. Correspondingly, UPGMA dendrogram revealed four clusters, which were correlated with four geographic regions (Figure 3).
The population structure of K. latifolia was found to be correlated with its geographic distribution, which however might not be directly attributed to geographic distance between these populations. Mantel tests revealed positive relationship between pairwise Gst and geographic distance (r2 = 0.5646, P = 0.0004), as well as between genetic distance and geographic distance (r2 = 0.4715, P = 0.0166), indicating that genetic differentiation and genetic distance were not significantly correlated with geographic distance between populations. It has been concluded in previous studies that there was no direct correlation between the geographic distance between populations and the distribution of genetic diversity [30,35,40]. As the geographic region correlated with the genetic structure found on Rhododendron spp. in the eastern U.S. [8], several factors related to breeding system, population size, and environmental conditions most likely led to this population structure of K. latifolia. Cross pollination of K. latifolia relies on insects. Small size of investigated populations in the study allowed insects to cover all individuals throughout the entire population, so relatively smaller genetic distances were observed among individuals within the population and they were clustered together. In general, environmental conditions, including temperature, precipitation, light, and soil, gradually vary as the geographic distance between populations increases. Due to insect pollination and similar environmental conditions, out-crossing can easily occur between populations that distribute in a geographic region. Frequent gene flow led to low level of genetic differentiation and small genetic distance between them [38]. By contrast, gene flow between populations inhabiting different geographic regions was reduced because of different phenological phases (e.g., blooming time) caused by different environmental conditions [37]. In addition to limited gene flow, the result of plants’ adaptations to different growing conditions might also account for the higher level of genetic differentiation and larger genetic distance between populations that distribute in different geographic regions. Hence, both STRUCTURE and UPMGA analysis suggested that populations in the same geographic region were less genetically different and fell into a cluster, and eight investigated K. latifolia populations were classified into four clusters correlated with four geographic regions (Figure 2c and Figure 3).

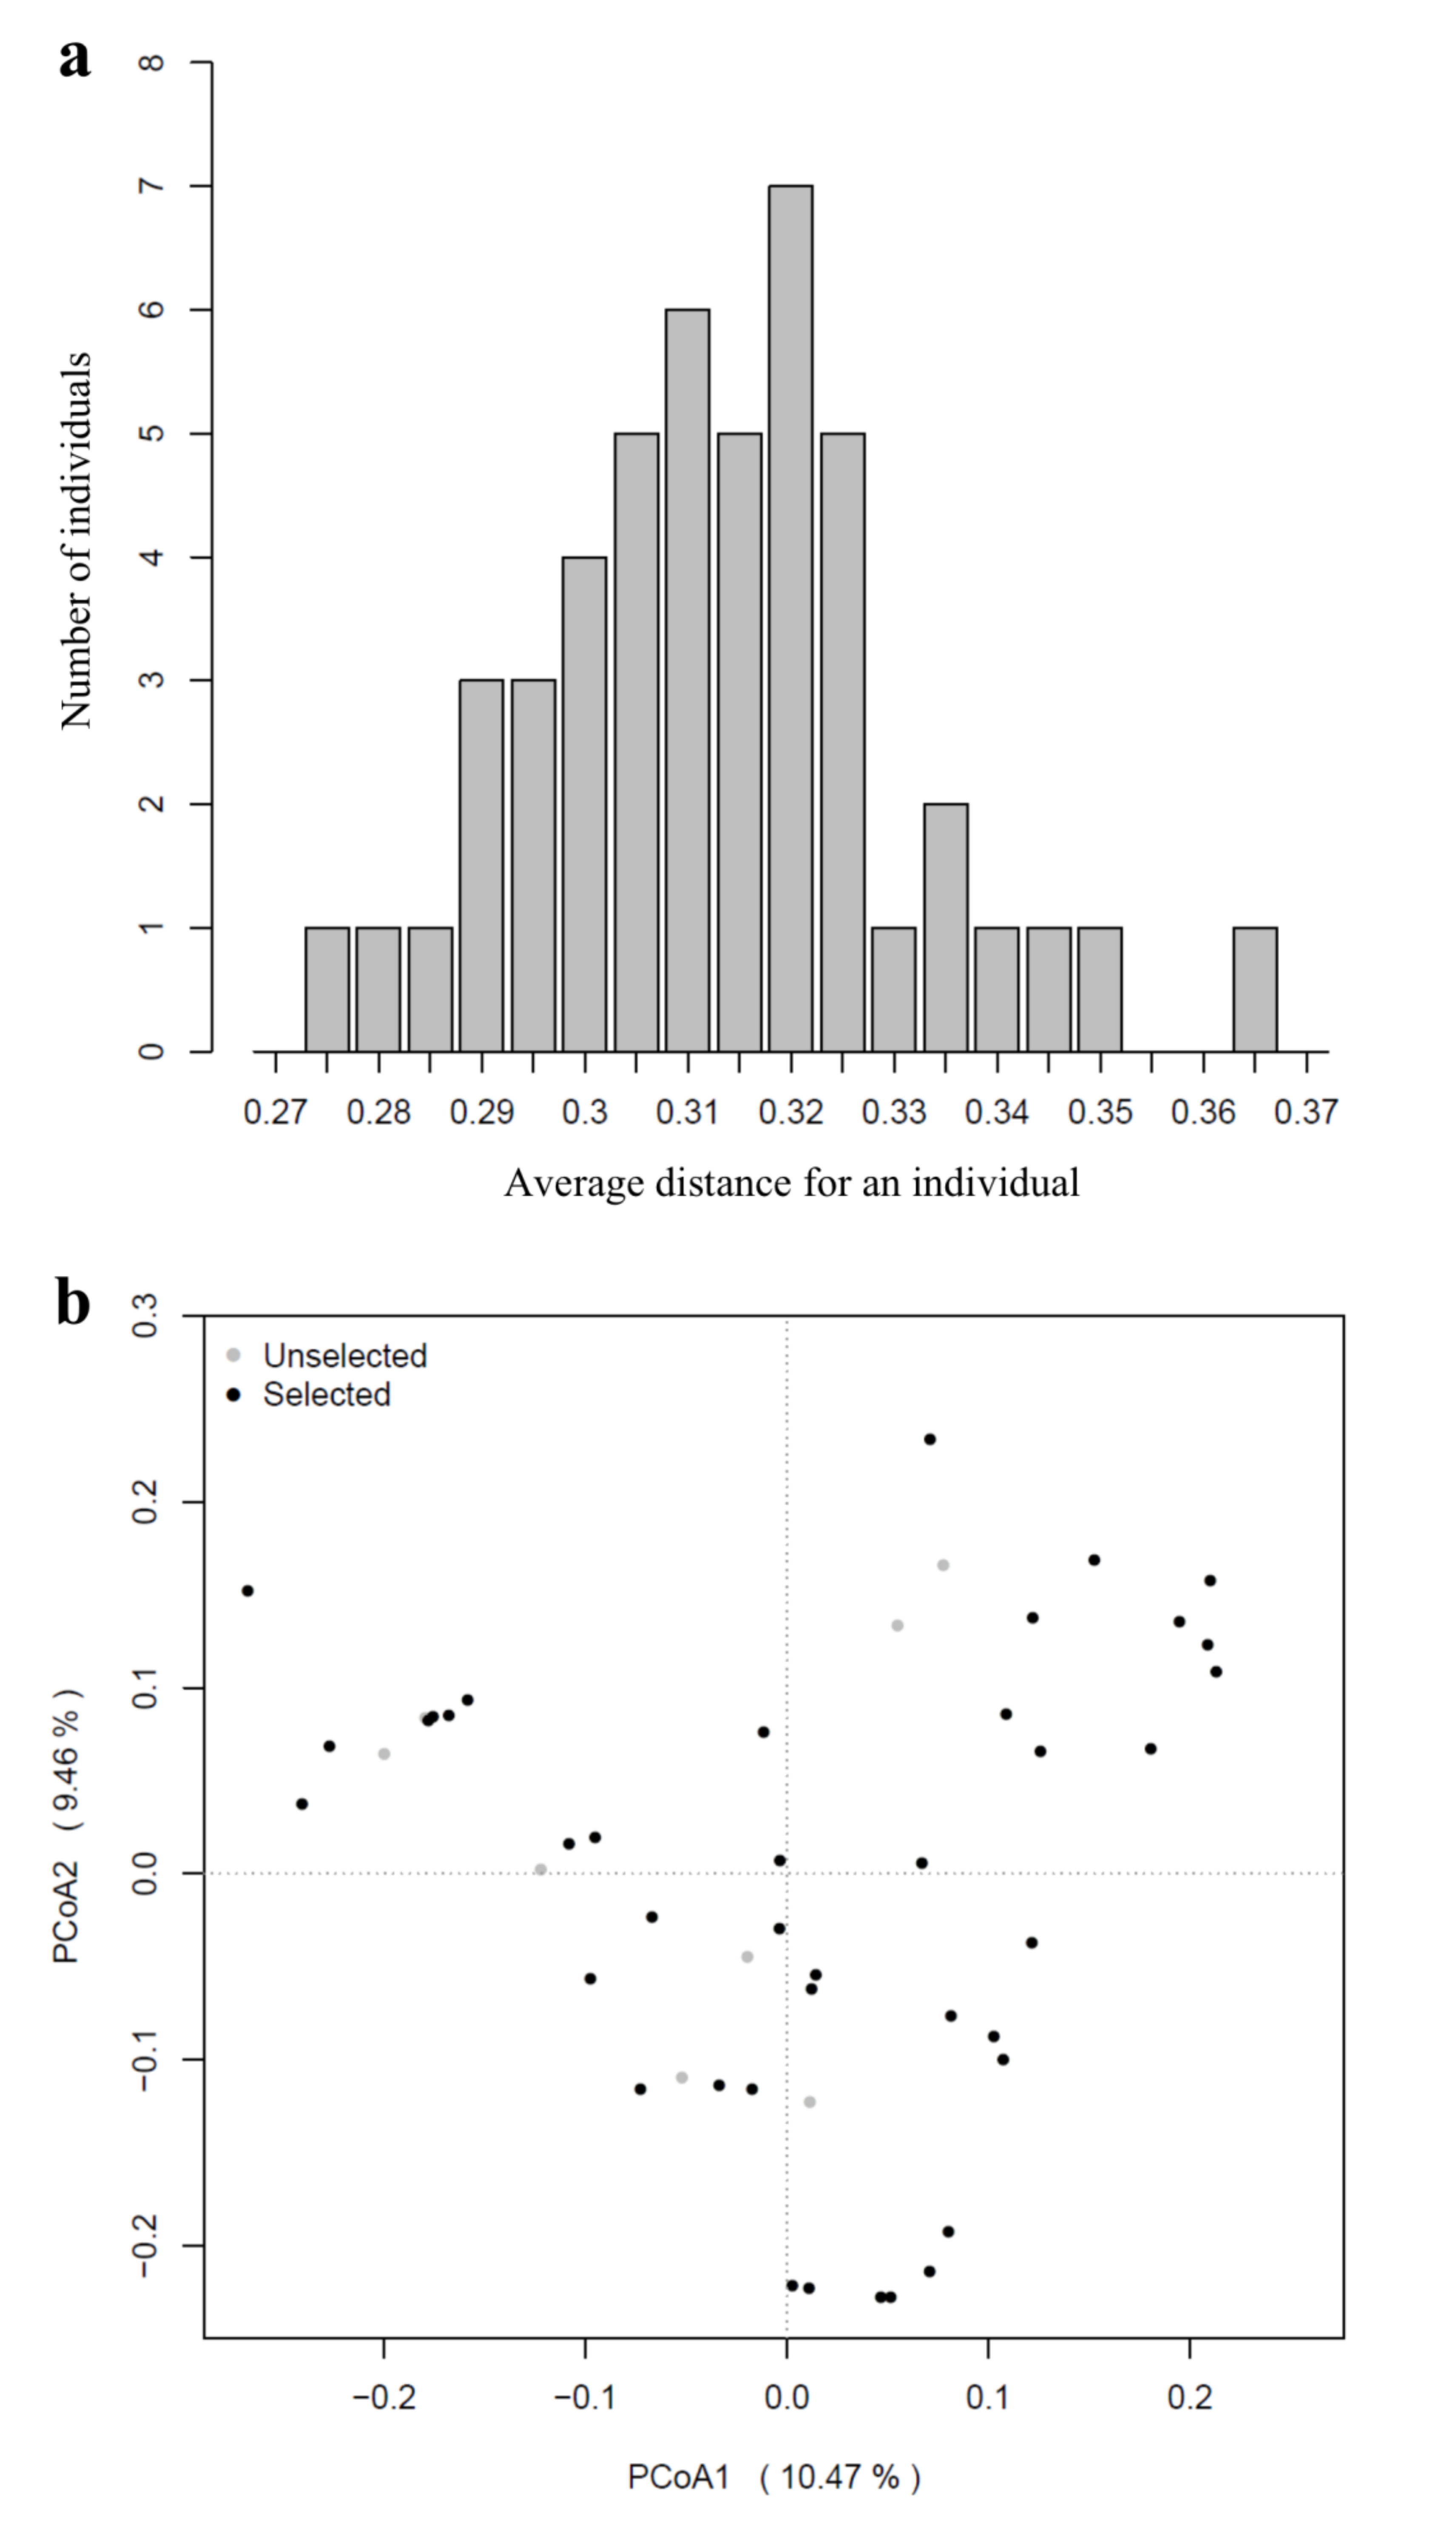
4.4. Conservation and Breeding Strategy

Four points have been illustrated by present study in relation to the conservation and breeding of K. latifolia. (1) High genetic diversity was observed at the species level, which indicated that K. latifolia could adapt to environmental changes and would thus function as a valuable resource for breeding for adaptability to different environmental conditions. (2) In general, decreased levels of genetic diversity within populations might affect population viability in short term by reducing individual fitness, and could also influence long-term persistence by reducing adaptability to changing environmental conditions [39]. The low genetic diversity within populations (HS = 0.1912) observed on K. latifolia in the eastern U.S. indicated the potential risk of population declines, which illuminated the importance of collecting and conserving its wild genetic resources. (3) A low-to-moderate level of among-population differentiation of K. latifolia revealed by Nei’s genetic differentiation (38.09%) and AMOVA analysis (29.54%) (Table 4 and Table 6) elucidated that collecting individuals from populations across wide geographic ranges might not further increase genetic diversity in its conservation and breeding program, while the individuals that tended to genetically diverge, which could be identified via STRUCTURE analysis (Figure 2c), need to be conserved and utilized for maximizing genetic diversity [17]. (4) The most genetically redundant individuals were revealed according to their lowest average genetic distance values, and removing them from sampled individuals did not show any large changes from the original genetic differentiation (Figure 4). This information could aid in identification and exclusion of redundant resources, and thus improve the efficiency of collecting, conserving, and utilizing K. latifolia genetic resources.

5. Conclusions

Genetic diversity and population structure information is essential for both conservation and breeding program of K. latifolia. ISSR markers exhibited a high level of efficiency in assessing genetic diversity and structure of K. latifolia populations in the eastern U.S. The observed high genetic diversity at the species level indicated that K. latifolia could adapt to environmental changes; wild K. latifolia would thus function as a valuable genetic resource for breeding for adaptability to various environmental conditions. In terms of genetic differentiation, a low-to-moderate proportion of diversity was observed among populations due to factors related to breeding system and geographic distribution pattern, which elucidated that collecting individuals from populations across wide geographic ranges might not further increase genetic diversity in K. latifolia conservation and breeding programs. The low average diversity within K. latifolia populations indicated the potential risk of losing genetic variation due to the small size of most populations, illuminating the significance of collecting and conserving their wild genetic resources. K. latifolia in the eastern U.S. exhibited a population structure that was correlated with its geographic distribution, which might be attributed to insect pollination, small population size, and environmental conditions in different habitats. These results would function as an essential step toward better collecting, conserving, and utilizing wild K. latifolia resources, thus promoting the breeding of K. latifolia plants that have adaptability to southeastern environmental conditions.

Author Contributions

H.L.: Conceptualization, Methodology, Formal analysis, Investigation, Writing—Original draft, Visualization; M.C.: Resources, Writing—Review and Editing; D.Z.: Supervision, Experimental design, Investigation, Writing, Editing, and Funding acquisition. All authors have read and agreed to the published version of the manuscript.

Funding

This research was funded by the University of Georgia Research Foundation and Georgia Seed Development Commission.

Acknowledgments

We would like to thank Ron Miller (Pensacola, FL, USA), Ron Hooper (Aiken, SC, USA), Jack Johnston (Lakemont, GA, USA), and Connor Ryan (Athens, GA, USA) for exploring wild populations and collecting plant materials for this study.

Conflicts of Interest

The authors declare no conflict of interest.

References

  1. Jaynes, R.A. Kalmia: The Laurel Book; Timber Press: Portland, OR, USA, 1988. [Google Scholar]
  2. Dirr, M.A. Manual of Woody Landscape Plants, 6th ed.; Stipes Publishing: Champaign, IL, USA, 2009. [Google Scholar]
  3. Li, H.; Chappell, M.; Zhang, D. Evaluation of twenty-one mountain laurel cultivars for container and landscape performance in the southeastern United States. HortTechnology 2018, 28, 867–874. [Google Scholar] [CrossRef] [Green Version]
  4. Engels, J.M.M.; Arora, R.K.; Guarino, L. An introduction to plant germplasm exploration and collecting: Planning, methods, and procedures, follow-up. In Collecting Plant Genetic Diversity: Technical Guidelines; Guarino, L., Rao, V.R., Reid, R., Eds.; CABI: Oxfordshire, UK, 1995; pp. 21–63. [Google Scholar]
  5. Li, H.; Zhang, D.; Chappell, M. Utilization of Kalmia latifolia L. germplasm as ornamentals. Acta Hort. 2017, 1185, 241–246. [Google Scholar] [CrossRef]
  6. Brown, A.H.D. Core collections: A practical approach to genetic resource management. Genome 1989, 31, 818–824. [Google Scholar] [CrossRef]
  7. Jaynes, R.A. Self-incompatibility and inbreeding depression in three laurel species. Proc. Am. Soc. Hort. Sci. 1968, 93, 618–622. [Google Scholar]
  8. Chappell, M.; Robacker, C.; Jenkins, T.M. Genetic diversity of seven deciduous azalea species (Rhododendron spp. section Pentanthera) native to the eastern United States. J. Am. Soc. Hort. Sci. 2008, 133, 374–382. [Google Scholar] [CrossRef] [Green Version]
  9. De Keyser, E.; Scariot, V.; Kobayashi, N.; Handa, T.; De Riek, J. Azalea phylogeny reconstructed by means of molecular techniques. In Protocols for In Vitro Propagation of Ornamental Plants. Methods in Molecular Biology (Methods and Protocols); Jain, S., Ochatt, S., Eds.; Humana Press: New York, NY, USA, 2010; pp. 349–364. [Google Scholar] [CrossRef]
  10. Liu, Y.; Xing, M.; Zhao, W.; Fan, R.; Luo, S.; Chen, X. Genetic diversity analysis of Rhododendron aureum Georgi (Ericaceae) located on Changbai Mountain using ISSR and RAPD markers. Plant Syst. Evol. 2012, 298, 921–930. [Google Scholar] [CrossRef]
  11. Boraks, A.; Broders, K.D. Population genetic diversity of the rare hardwood butternut (Juglans cinerea) in the northeastern USA. Tree Genet. Genomes 2016, 12, 43. [Google Scholar] [CrossRef]
  12. Cardoso, R.; Ruas, C.F.; Giacomin, R.M.; Ruas, P.M.; Ruas, E.A.; Barbieri, R.L.; Rodrigues, R.; Goncalves, L.S.A. Genetic variability in Brazilian Capsicum baccatum germplasm collection assessed by morphological fruit traits and AFLP markers. PLoS ONE 2018, 13, e0196468. [Google Scholar] [CrossRef] [PubMed] [Green Version]
  13. Long, X.; Weng, Y.; Liu, S.; Hao, Z.; Sheng, Y.; Guan, L.; Shi, J.; Chen, J. Genetic diversity and differentiation of relict plant Liriodendron populations based on 29 novel EST-SSR markers. Forests 2019, 10, 334. [Google Scholar] [CrossRef] [Green Version]
  14. Pereira-Lorenzo, S.; Ramos-Cabrer, A.M.; Barreneche, T.; Mattioni, C.; Villani, F.; Diaz-Hernandez, M.B.; Martin, L.M.; Martin, A. Database of European chestnut cultivars and definition of a core collection using simple sequence repeats. Tree Genet. Genomes 2017, 13, 114. [Google Scholar] [CrossRef]
  15. Nagaoka, T.; Ogihara, Y. Applicability of inter-simple sequence repeat polymorphisms in wheat for use as DNA markers in comparison to RFLP and RAPD markers. Theor. Appl. Genet. 1997, 94, 597–602. [Google Scholar] [CrossRef]
  16. Chen, Y.; Peng, Z.; Wu, C.; Ding, G.; Cao, G.; Ruan, S.; Lin, S. Genetic diversity and variation of Chinese fir from Fujian province and Taiwan, China, based on ISSR markers. PLoS ONE 2017, 12, e0175571. [Google Scholar] [CrossRef] [PubMed] [Green Version]
  17. Wu, W.; Chen, F.; Yeh, K.; Chen, J. ISSR analysis of genetic diversity and structure of plum varieties cultivated in southern China. Biology 2019, 8, 2. [Google Scholar] [CrossRef] [PubMed] [Green Version]
  18. Laakili, A.; Belkadi, B.; Medraoui, L.; Alami, M.; Yatrib, C.; Pakhrou, Q.; Makhloufi, M.; El Antry, S.; Laamarti, A.; Filali-Maltouf, A. Diversity and spatial genetic structure of natural Moroccan Quercus susber L. assessed by ISSR markers for conservation. Physiol. Mol. Biol. Plants 2018, 24, 643–654. [Google Scholar] [CrossRef] [PubMed]
  19. Al Salameen, F.; Habibi, M.; Kumar, V.; Al Amad, S.; Dashti, J.; Talebi, L.; Al Doaij, B. Genetic diversity and population structure of Haloxylon salicornicum moq. in Kuwait by ISSR markers. PLoS ONE 2018, 13, e0207369. [Google Scholar] [CrossRef] [PubMed] [Green Version]
  20. Liu, X.; Shen, X.; Zhang, Y. Genetic relationship of nine hardy Rhododendrons by ISSR markers. Acta Agric. Bor-Occidentalis Sin. 2010, 19, 89–92. [Google Scholar]
  21. Zheng, Y.; He, T.; Chen, L.; Chen, L.; Rong, J.; Zheng, Y. ISSR analysis on the cultivars of Rhododendron hybridum. J. Fujian Coll. For. 2011, 40, 271–275. [Google Scholar]
  22. POPGENE Version 1.32; the user-friendly shareware for population genetic analysis, Molecular Biology and Biotechnology Centre, University of Alberta, Edmonton, Canada. Available online: https://sites.ualberta.ca/~fyeh/popgene.html (accessed on 23 November 2017).
  23. Nei, M. Estimation of average heterozygosity and genetic distance from a small number of individuals. Genetics 1978, 89, 583–590. [Google Scholar]
  24. Nei, M. Genetic distance between populations. Am. Nat. 1972, 106, 283–292. [Google Scholar] [CrossRef]
  25. Excoffier, L.; Lischer, H.E.L. Arlequin suite ver 3.5: A new series of programs to perform population genetics analyses under Linux and Windows. Mol. Ecol. Resour. 2010, 10, 564–567. [Google Scholar] [CrossRef]
  26. Yang, M.; Fu, Y. AveDissR: An R function for assessing genetic distinctness and genetic redundancy. Appl. Plant Sci. 2017, 5, apps.1700018. [Google Scholar] [CrossRef] [PubMed] [Green Version]
  27. Pritchard, J.K.; Stephens, M.; Donnelly, P. Inference of population structure using multilocus genotype data. Genetics 2000, 155, 945–959. [Google Scholar] [PubMed]
  28. Earl, D.A.; von Holdt, B.M. STRUCTURE HARVESTER: A website and program for visualizing STRUCTURE output and implementing the Evanno method. Conserv. Genet. Resour. 2012, 4, 359–361. [Google Scholar] [CrossRef]
  29. Kopelman, N.M.; Mayzel, J.; Jakobsson, M.; Rosenberg, N.A.; Mayrose, I. Clumpak: A program for identifying clustering modes and packaging population structure inferences across K. Mol. Ecol. Resour. 2015, 15, 1179–1191. [Google Scholar] [CrossRef] [PubMed] [Green Version]
  30. Liu, F.; Hong, Z.; Xu, D.; Jia, H.; Zhang, N.; Liu, X.; Yang, Z.; Lu, M. Genetic diversity of the endangered Dalbergia odorifera revealed by SSR markers. Forests 2019, 10, 225. [Google Scholar] [CrossRef] [Green Version]
  31. Rohlf, F.J. NTSYS-pc: Microcomputer Programs for Numerical Taxonomy and Multivariate Analysis. Am. Stat. 1987, 41, 330. [Google Scholar] [CrossRef]
  32. Garriga, M.; Parra, P.A.; Caligari, P.D.S.; Retamales, J.B.; Carrasco, B.A.; Lobos, G.A.; García-Gonzáles, R. Application of inter-simple sequence repeats relative to simple sequence repeats as a molecular marker system for indexing blueberry cultivars. Can. J. Plant Sci. 2013, 93, 913–921. [Google Scholar] [CrossRef]
  33. Hamrick, J.L.; Godt, M.J.W.; Sherman-Broyles, S.L. Factors influencing levels of genetic diversity in woody plant species. New Forests 1992, 6, 95–124. [Google Scholar] [CrossRef]
  34. Nagy, E.S.; Strong, L.; Galloway, L.F. Contribution of delayed autonomous selfing to reproductive success in mountain laurel, Kalmia latifolia (Ericaceae). Am. Midl. Nat. 1999, 142, 39–46. [Google Scholar] [CrossRef]
  35. Hamrick, J.L.; Godt, M.J.W. Effects of life history traits on genetic diversity in plant species. Phil. Trans. R. Soc. Lond B 1996, 351, 1291–1298. [Google Scholar] [CrossRef]
  36. Nybom, H. Comparison of different nuclear DNA markers for estimating intraspecific genetic diversity in plants. Mol. Ecol. 2004, 13, 1143–1155. [Google Scholar] [CrossRef] [PubMed]
  37. Bao, W.; Wuyun, T.; Li, T.; Liu, H.; Jiang, Z.; Zhu, X.; Du, H.; Bai, Y. Genetic diversity and population structure of Prunus mira (Koehne) from the Tibet plateau in China and recommended conservation strategies. PLoS ONE 2017, 12, e0188685. [Google Scholar] [CrossRef] [PubMed] [Green Version]
  38. Falk, D.A.; Knapp, E.E.; Guerrant, E.O. An Introduction to Restoration Genetics. Available online: ttps://cdn.ymaws.com/www.ser.org/resource/resmgr/custompages/publications/ser_publications/ser_restoration_genetics.pdf (accessed on 21 July 2020).
  39. Godt, M.J.W.; Johnson, B.R.; Hamrick, J.L. Genetic diversity and population size in four rare southern Appalachian plant species. Conserv. Biol. 1996, 10, 796–805. [Google Scholar] [CrossRef]
  40. Ling, X.; Li, X.; Wang, X.; Yang, J.; Lv, K.; Xiong, Z.; Chen, F.; Huang, C. Genetic diversity and population structure of Distylium chinense revealed by ISSR and SRAP analysis in the Three Gorges Reservoir Region of the Yangtze River, China. Glob. Ecol. Conserv. 2020, 21, e00805. [Google Scholar] [CrossRef]
Figure 1. Natural distribution of K. latifolia and geographic location of eight investigated populations in the eastern United States.
Sustainability 12 08284 g001
Figure 2. Population structure of 48 K. latifolia samples based on ISSR data. (a) Estimation of population structure using mean of estimated log probability of data (LnP(K)) with cluster value (K) ranging from 2–10. (b) Estimation of population using delta K with cluster value (K) ranging from 2–10. (c) Four estimated clusters (K = 4) of 48 K. latifolia samples are presented in different colors inferred by STRUCTURE analysis. Four clusters are presented by blue, orange, green, and purple, respectively. Each sample (represented by a vertical bar) is partitioned into colored segments representing the estimated membership coefficients (Q values).
Sustainability 12 08284 g002aSustainability 12 08284 g002b
Figure 3. Unweighted pair group method with arithmetic mean (UPGMA) dendrogram of 48 K. latifolia individuals (six individuals sampled from each of eight populations) constructed based on Nei’s unbiased genetic distance matrix. Six individuals within the population were clustered together. Meanwhile, populations located in a geographic region were grouped into a cluster and four clusters correlated with four geographic regions were observed.
Sustainability 12 08284 g003
Figure 4. Genetic distinctness of 48 K. latifolia individuals assessed using AveDissR. (a) Average distance (AD) frequency distribution in 48 individuals. (b) PCA plot for the genetic association of 40 individuals selected based on the highest AD values and original 48 individuals.
Sustainability 12 08284 g004
Figure 5. Mantel tests between the matrices of geographic distance and pairwise Gst (a), geographic distance and Nei’s unbiased genetic distance (b), and Nei’s unbiased genetic distance and pairwise Gst (c) for eight K. latifolia populations.
Sustainability 12 08284 g005
Table 1. Geographic information on eight investigated populations of K. latifolia.
PopulationLocationLatitudeLongitudeSample nos.
Middlesex Fells (MF)Middlesex, Massachusetts42°26′51″ N71°5′26″ WMA1-6
Blue Hills (BH)Norfolk, Massachusetts42°12′55″ N71°3′3″ WMA7-12
Peachtree Rock (PR)Lexington, South Carolina33°49′47″ N81°11′57″ WSC1-6
Hitchcock Woods (HW)Aiken, South Carolina33°33′9″ N81°44′33″ WSC7-12
Red Hill (RH)Monroe, Alabama31°44′17″ N87°21′30″ WAL1-6
Blackwater Forest (BF)Santa Rosa, Florida30°47′23″ N86°47′33″ WFL1-6
Piedmont College (PC)Rabun, Georgia34°51′50″ N83°23′16″ WGA1-6
Sandy Creek (SC)Clarke, Georgia34°0′58″ N83°22′32″ WGA7-12
Table 2. Total number of bands, number of polymorphic bands, and percentage of polymorphic bands (PPB) generated by eight inter simple sequence repeat (ISSR) primers across 48 sampled K. latifolia individuals.
ISSR PrimersSequence (5’ – 3’)Total Number of
Bands
Number of
Polymorphic Bands
PPB
UBC808(AG)8C141392.86%
UBC814(CT)8A10880%
UBC835(AG)8YC131292.31%
UBC836(AG)8YA161381.25%
UBC841(GA)8YC131184.62%
UBC856(AC)8YA151493.33%
UBC864(ATG)61919100%
UBC873(GACA)4161593.75%
Total 11610590.52%
Table 3. Genetic diversity of K. latifolia populations analyzed using ISSR primers.
PopulationNaNoaNeahIPPB
MF811.45691.31300.18010.264845.69
BH781.40521.24850.14850.222440.52
PR891.55171.38120.21740.319455.17
HW901.50861.33620.19490.288450.86
RH871.50861.32390.19060.283750.86
BF941.54311.33570.20070.300054.31
PC971.56031.38810.22130.324956.03
SC901.47411.29810.17620.262947.41
Total1161.90521.51910.30890.465490.52
Na = total number of observed alleles, Noa = mean observed number of alleles, Nea = mean effective number of alleles, h = Nei’s gene diversity, I = Shannon’s information index, and PPB = percentage of polymorphic bands.
Table 4. Analysis of Nei’s genetic differentiation among eight K. latifolia populations.
PopulationHTHSGST
Massachusetts group (MF and BH)0.20590.16430.2023
South Carolina group (PR and HW)0.25230.20620.1827
Southernmost group (RH and BF)0.23910.19560.1818
Georgia group (PC and SC)0.24740.19880.1965
Total0.30890.19120.3809
HT = total genetic diversity, HS = mean genetic diversity within populations, and GST = coefficient of genetic differentiation.
Table 5. Pairwise Gst for eight K. latifolia populations.
PopulationMFBHPRHWRHBFPCSC
MF
BH0.2023
PR0.20950.2554
HW0.26990.32520.1827
RH0.29250.34260.24200.2452
BF0.26560.31770.23920.27610.1818
PC0.20490.24310.20830.23470.26750.2356
SC0.31550.35860.25410.27330.31420.30390.1965
Table 6. Analysis of molecular variation (AMOVA) for eight K. latifolia populations.
Source of
Variation
d.f.Sum of SquaresVariance ComponentPercentage of
Variance
P
Among populations7327.5425.5829.54<0.001
Within populations40532.33313.3170.46<0.001
Total47859.87518.89
Table 7. Nei’s unbiased genetic distance (below diagonal) and geographic distance (km) (above diagonal) between K. latifolia populations.
PopulationMFBHPRHWRHBFPCSC
MF 29.451533.701594.862158.122203.191593.251667.28
BH0.0868 1528.871590.032153.302198.361588.421662.45
PR0.11780.1451 64.86708.11711.33271.98238.18
HW0.16590.20330.0994 645.35646.95251.06191.51
RH0.18750.22010.15500.1466 147.74597.07534.30
BF0.16470.19930.15740.18570.0920 626.03550.39
PC0.11510.13540.13410.15140.18590.1554 114.91
SC0.20310.22630.15970.16700.20980.21170.1061

