Supporting Resilient Urban Planning through Walkability Assessment


Abstract
1. Introduction
Let’s think about how our cognitive ability and our experience will diminish, for example looking at the use of Google Maps: well, people have no idea where it is interesting to walk because they are glued to the phone to get in the most efficient way from A to B. More an experience is smooth, without clutches, more we stop learning[1] (p. 36).
2. The Case Study Research Method
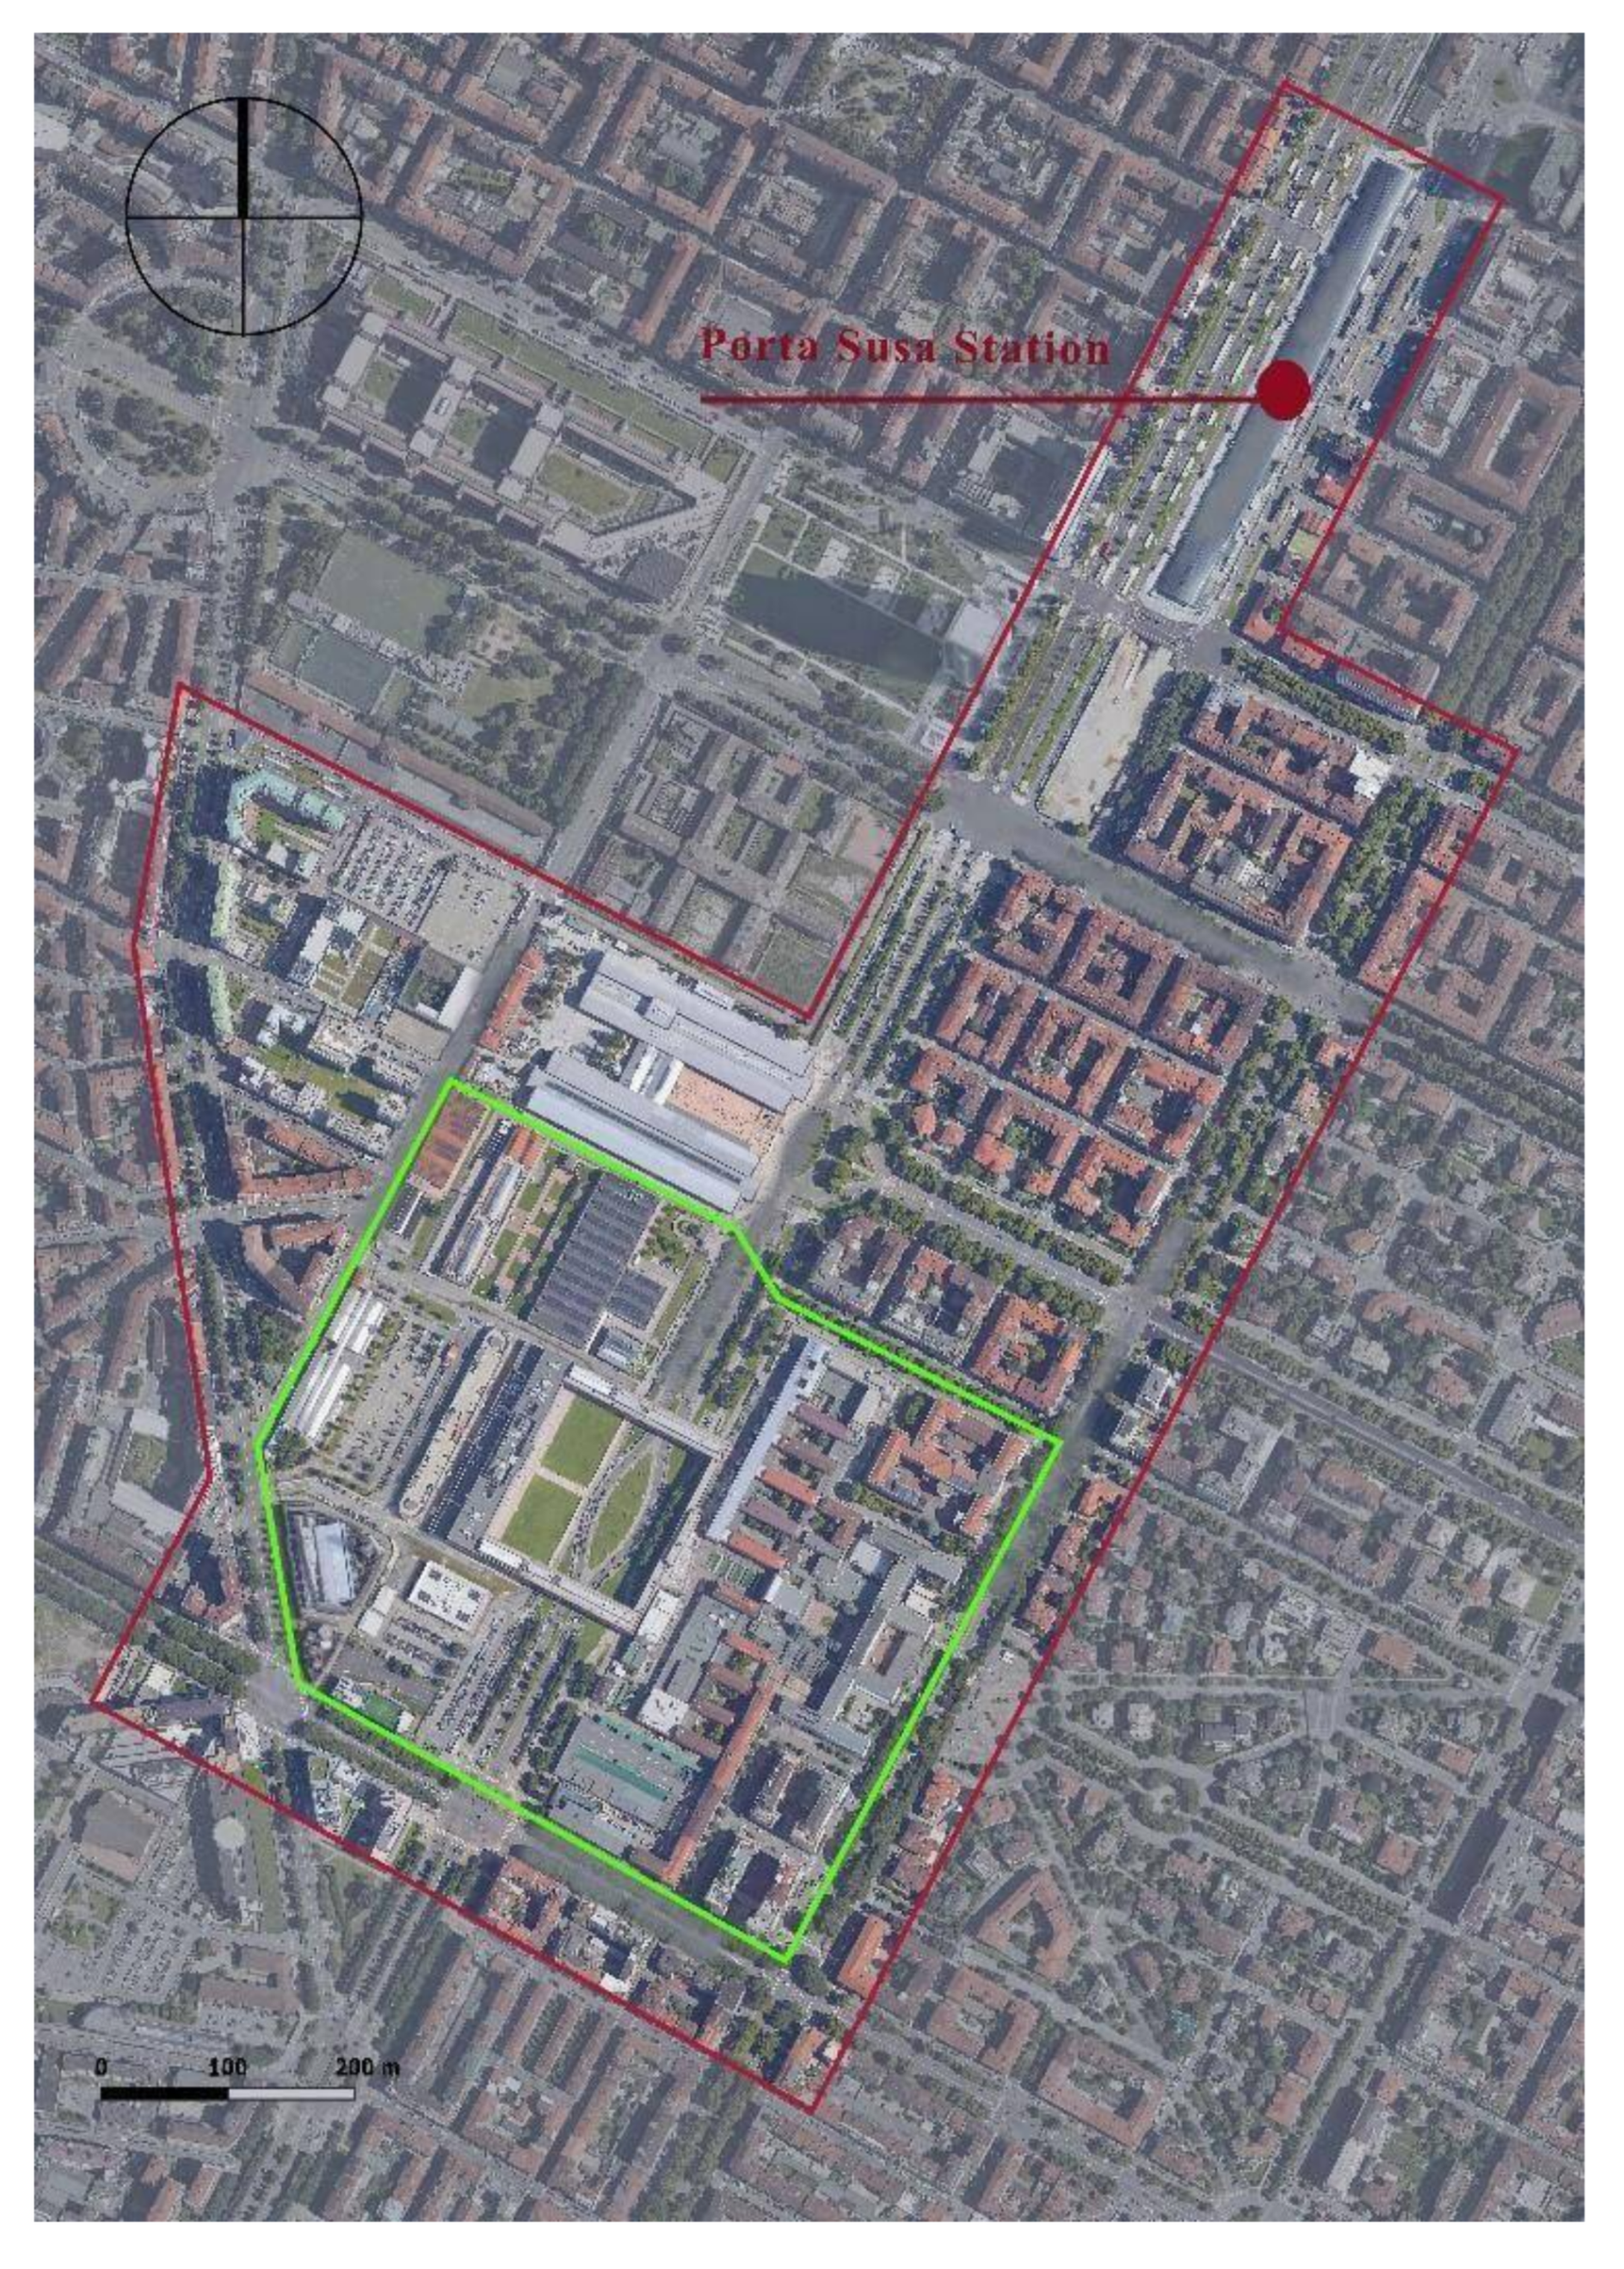
The Case Study: Main Campus of the Politecnico di Torino
3. Research Design and Data Analysis
- (1)
- Able to consider objective and subjective elements of walkability;
- (2)
- Able to quantify and measure subjective elements;
- (3)
- Mathematically robust and sensible;
- (4)
- Flexible and adaptable. e.g., usable at different territorial scales;
- (5)
- Able to support the urban planning design decision-making processes.
- (a)
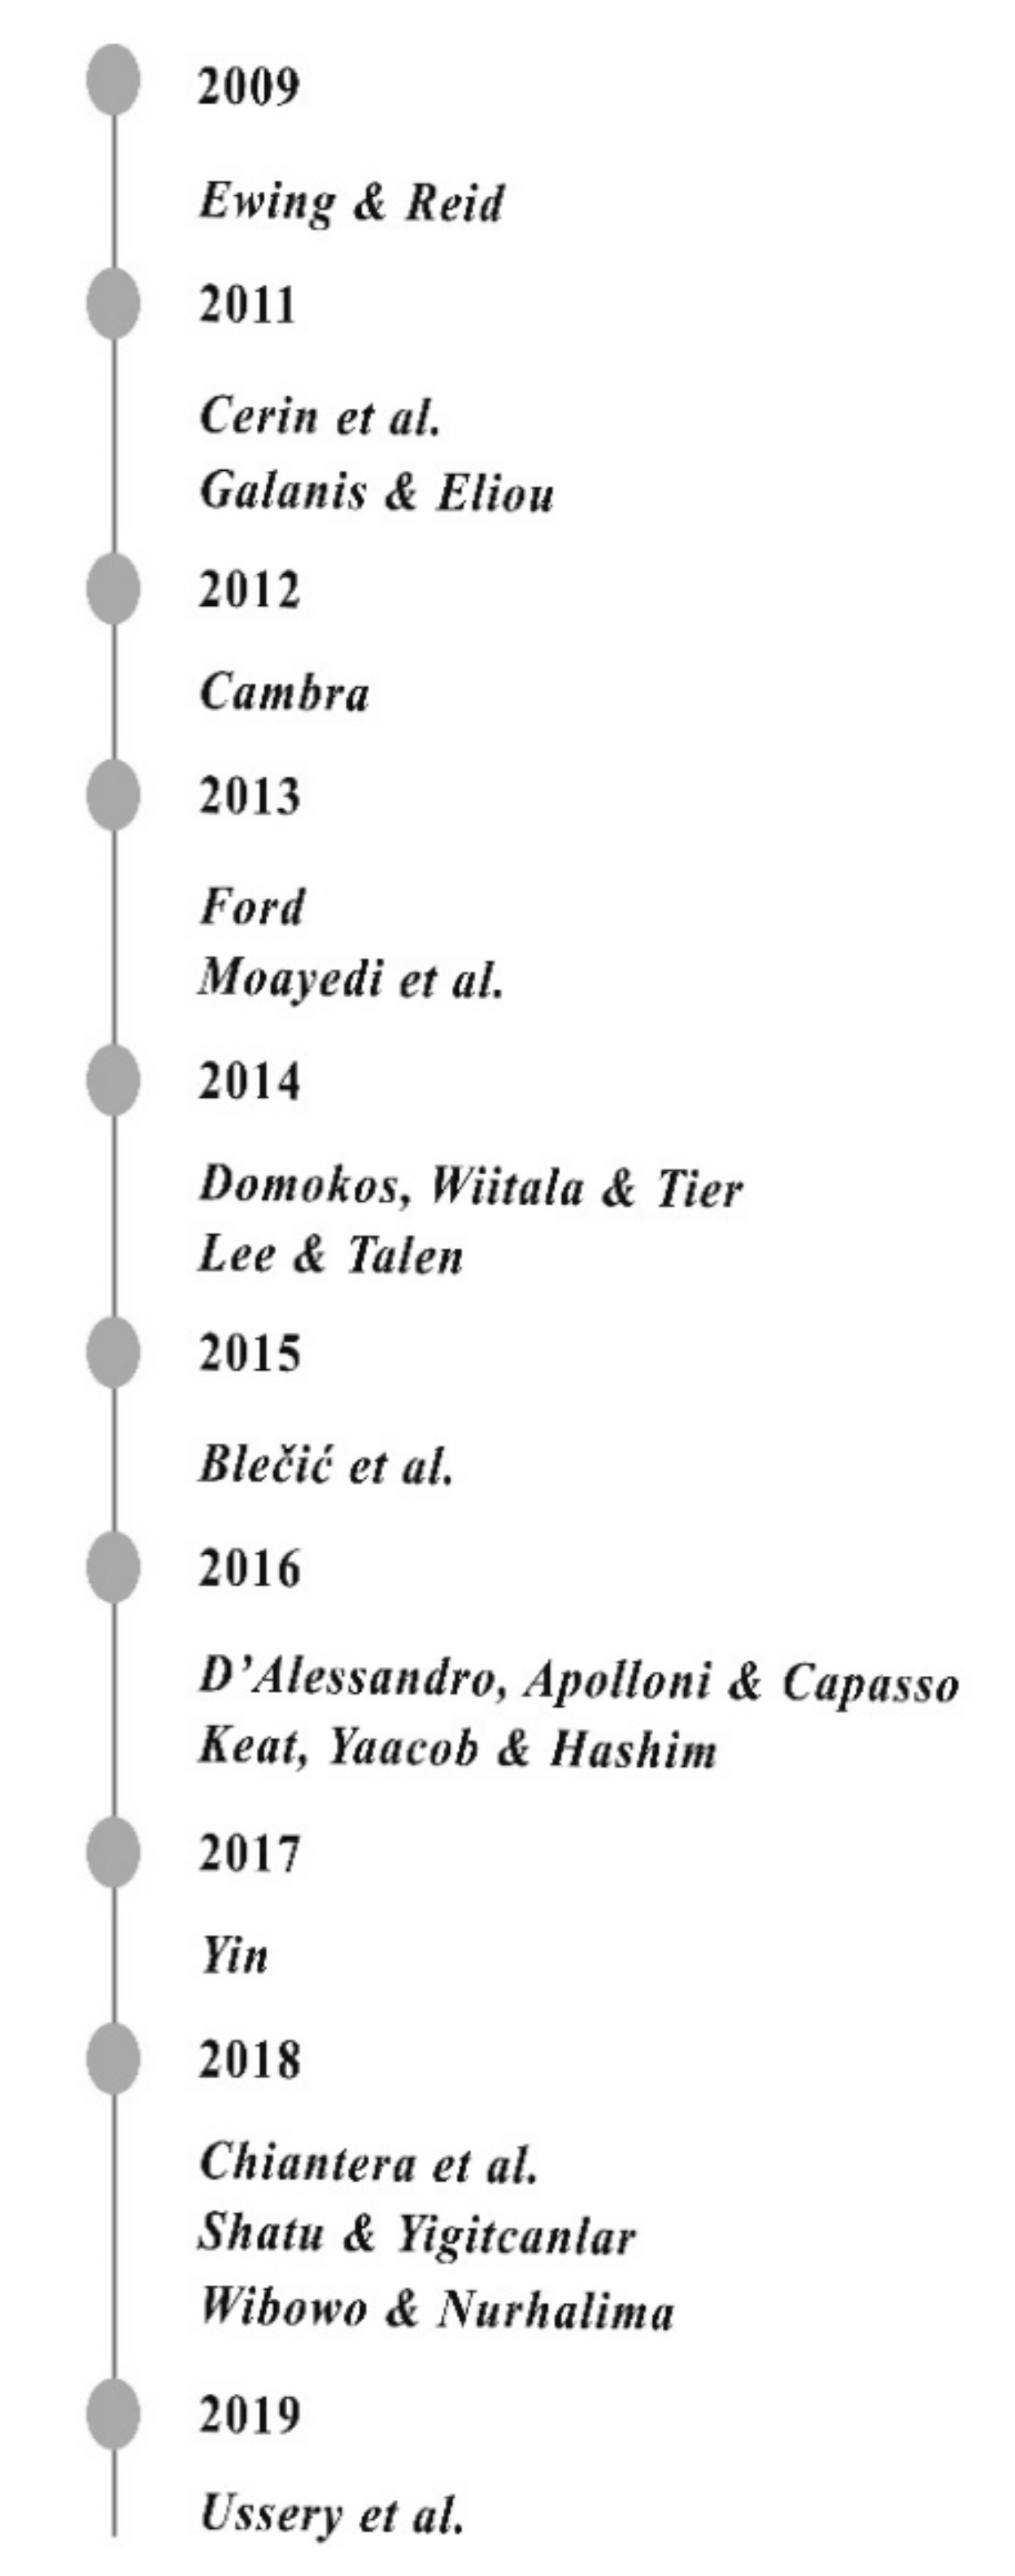
- Choice phase, where indexes and indicators were preliminary chosen through an in-depth analysis of the literature. First, we selected three keywords to compose the string search viz., walkability + walkability measure + walkability indicators. Second, the string has been inserted in both Scopus and Google Scholar databases to identify scientific papers in the timespan 2000–2019 (Figure 4). This research has given rise to numerous papers. Third, basing on abstract and keywords, we selected only the papers that appeared in both databases and simultaneously related to the 3 subject areas of interest: urban planning, urban planning measure and qualitative/and quantitative assessment methods). This systematic literature review provided 16 (Table 2).
- (1)
- Weighting indexes and indicators to produce a global index. Indexes and indicators are chosen by researchers on the basis of the literature or empirical analyses. The method is very flexible and can be applied at several territorial scales [39];
- (2)
- Statistical analyses, which provide a robust evaluation by using highly objective analytical attributes such as averages, maximum and minimum values, correlation, and agreement coefficients and standard deviation [49];
- (b)
- Analysis phase, consisting of an empirical investigation of the case study area and a survey administered to the main categories of PoliTO campus users. In order to verify the reliability of the survey, a preliminary test was made on a sample of 40 students. Subsequently, survey data were analyzed using different statistical techniques. Through the survey, the results of the Choice phase were tested, making changes and enriching it with data, thus making the model more robust and objective;
- (c)
- Evaluation phase, where the current status of the PoliTO campus was assessed. This phase employed a GIS software application called Quantum-Geographic Information System (QGIS) [53] to assess potential associations between a number of built environment characteristics and walking [54] and to have a visual representation of the evaluation problem [55]. Among the many available visualization tools [39,50,56], we decided to use QGIS [53] since it is an open-source software system that does not require a license, uses readily consulted open data, and georeferences objects to be assessed on any geographic scale (city, neighborhood, or single street), providing easy-to-read output. Moreover, it is widely used, making the method presented here easily replicable.
4. Findings
4.1. Choice Phase
4.2. Analysis Phase
4.3. Evaluation Phase: QGIS Measure
5. Discussion
6. Conclusions and Future Developments
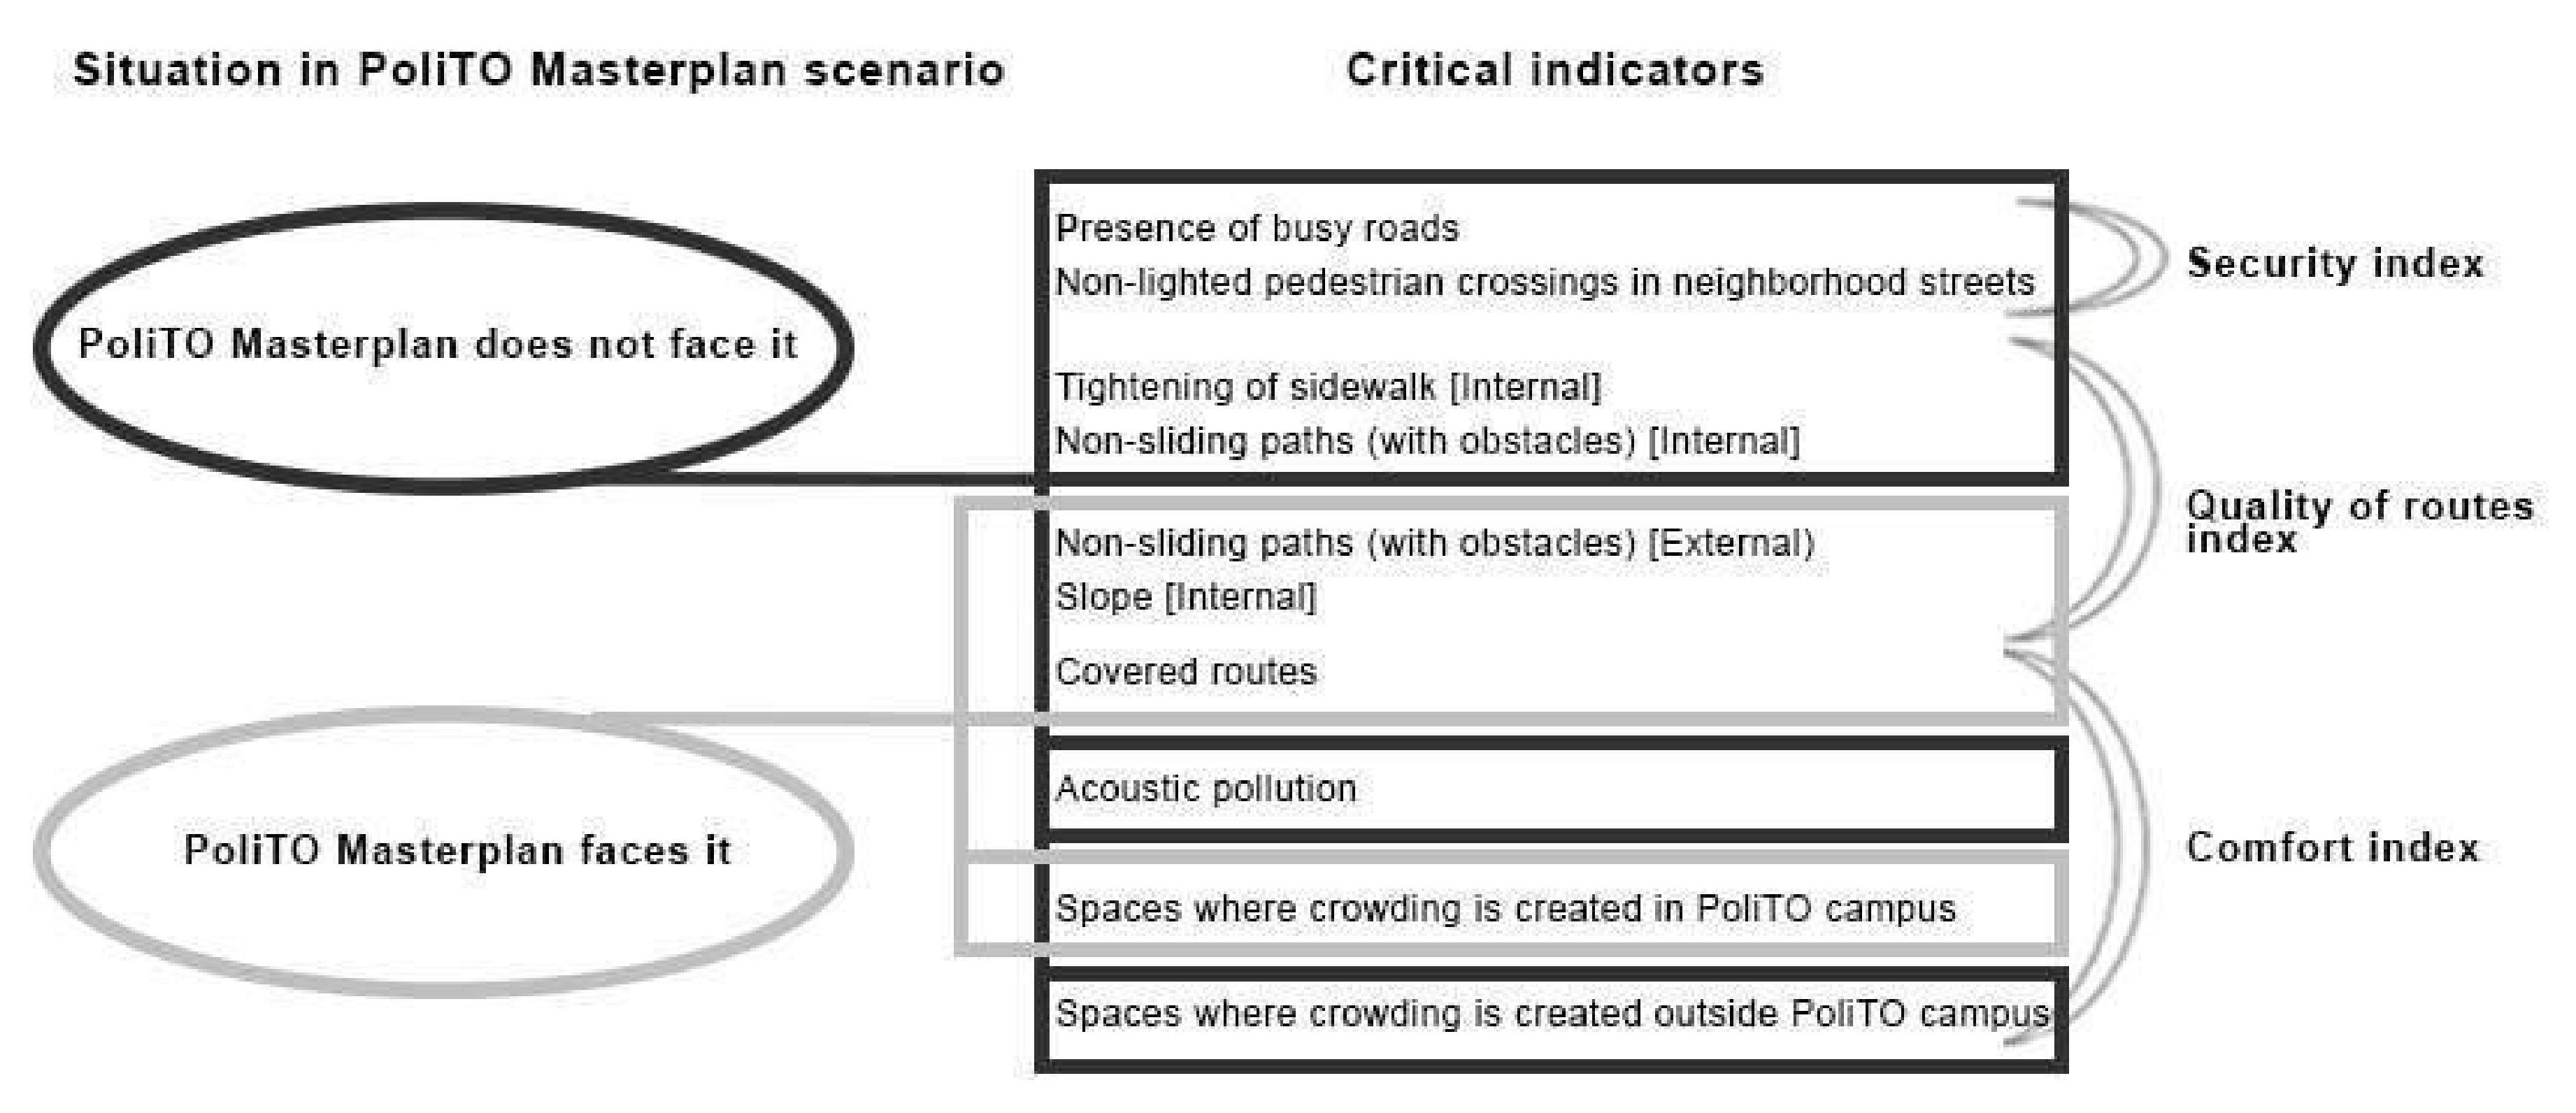
- The Masterplan addresses the issue of walkability indirectly, namely it is not explicitly mentioned in the documents;
- Among the 10 critical indicators identified by our framework, the Masterplan projects address 4 of them (“non-sliding paths,” “slopes,” “covered routes,” and “spaces where crowding is created in PoliTO campus”), showing particular attention to the morphology of the pedestrian streets, an attitude quite consistent with the training of the experts who drafted the Masterplan;
- The PoliTO Masterplan Team is determining whether the Masterplan’s scope can be broadened to reflect the findings that emerged from applying the multi-methodological assessment framework presented here. The idea is to be able to include roads and sidewalks around the PoliTO campus since they have a significant impact on its accessibility and walkability.
Supplementary Materials
Author Contributions
Funding
Acknowledgments
Conflicts of Interest
References
- Sennett, R. Building and Dwelling: Ethics for the City; Farrar, Straus and Giroux: New York, NY, USA, 2018. [Google Scholar]
- Holling, C.S. Resilience and stability of ecological systems. Annu. Rev. Ecol. Syst. 1973, 4, 1–23. [Google Scholar] [CrossRef]
- Ahern, J. From fail-safe to safe-to-fail: Sustainability and resilience in the new urban world. Landsc. Urban Plan. 2011, 100, 341–343. [Google Scholar] [CrossRef]
- Wilkinson, C. Social-ecological resilience: Insights and issues for planning theory. Plan. Theory 2012, 11, 148–169. [Google Scholar] [CrossRef]
- Feldmeyer, D.; Wilden, D.; Kind, C.; Kaiser, T.; Goldschmidt, R.; Diller, C.; Birkmann, J. Indicators for monitoring urban climate change resilience and adaptation. Sustainability 2019, 11, 2931. [Google Scholar] [CrossRef]
- Desouza, K.C.; Flanery, T.H. Designing, planning, and managing resilient cities: A conceptual framework. Cities 2013, 35, 89–99. [Google Scholar] [CrossRef]
- Cavalli, L.; Lizzi, G.; Vergalli, S. Economia circolare: Una sfida che parte dalle città. Equilibri 2019, 23, 69–78. [Google Scholar]
- Wackernagel, M.; Rees, W.E. Our Ecological Footprint: Reducing Human Impact on the Earth; New Society Publishers: Philadelphia, PA, USA, 1996. [Google Scholar]
- Alberti, M. Cities That Think Like Planets; University of Washington Press: Seattle, WA, USA, 2016. [Google Scholar]
- Brunetta, G.; Caldarice, O. Cambiamento climatico e pianificazione urbanistica. Il ruolo delle aree urbane nella costruzione di strategie adattive resilienti. In Un Futuro Affidabile per La Città. Apertura Al Cambiamento e Rischio Accettabile nel Governo del Territorio; Planum Publisher: Milan/Rome, Italy, 2017; pp. 135–140. [Google Scholar]
- Porębska, A.; Rizzi, P.; Otsuki, S.; Shirotsuki, M. Walkability and Resilience: A Qualitative Approach to Design for Risk Reduction. Sustainability 2019, 11, 2878. [Google Scholar] [CrossRef]
- Brunetta, G.; Caldarice, O. Putting Resilience into Practice. The Spatial Planning Response to Urban Risks. In Urban Resilience for Risk and Adaptation Governance; Springer: Cham, Switzerland, 2019; pp. 27–41. [Google Scholar]
- Gehl, J. Cities for People; Island Press: Washington, DC, USA, 2010; ISBN 9781597265737. [Google Scholar]
- Gao, Y.; Shahab, S.; Ahmadpoor, N. Morphology of Urban Villages in China: A Case Study of Dayuan Village in Guangzhou. Urban Sci. 2020, 4, 23. [Google Scholar] [CrossRef]
- Boeing, G. The morphology and circuity of walkable and drivable street networks. In The Mathematics of Urban Morphology; Springer: Berlin/Heidelberg, Germany, 2019; pp. 271–287. [Google Scholar]
- Urry, J. Mobilities: New Perspectives on Transport and Society; Routledge: London, UK, 2016. [Google Scholar]
- Bosco, D.L.; Giunta, M.; Scopelliti, F. Metodologia di approccio integrato sostenibilita’-resilienza nella riabilitazione delle infrastrutture viarie dopo eventi estremi. LaborEst 2019, 18, 49–55. [Google Scholar]
- Robertson, N.; Hachem-Vermette, C. Walkability as an Indicator of Neighbourhood Resilience (breakout presentation). J. Transp. Health 2017, 7, S85. [Google Scholar] [CrossRef]
- La Rocca, R.A. Soft mobility and urban transformation. TEMA J. Land Use Mobil. Environ. 2010, 2, 85–90. [Google Scholar] [CrossRef]
- Rogers, S.H.; Gardner, K.H.; Carlson, C.H. Social capital and walkability as social aspects of sustainability. Sustainability 2013, 5, 3473–3483. [Google Scholar] [CrossRef]
- Moayedi, F.; Zakaria, R.; Bigah, Y.; Mustafar, M.; Puan, O.C.; Zin, I.S.; Klufallah, M.M. Conceptualising the indicators of walkability for sustainable transportation. J. Teknol. 2013, 65. [Google Scholar] [CrossRef]
- Lo, R.H. Walkability: What is it? J. Urban. 2009, 2, 145–166. [Google Scholar] [CrossRef]
- Zhou, H.; He, S.; Cai, Y.; Wang, M.; Su, S. Social inequalities in neighborhood visual walkability: Using street view imagery and deep learning technologies to facilitate healthy city planning. Sustain. Cities Soc. 2019, 50, 101605. [Google Scholar] [CrossRef]
- Krambeck, H.V. The Global Walkability Index. Ph.D. Thesis, Massachusetts Institute of Technology, Cambridge, MA, USA, 2016. Available online: http://hdl.handle.net/1721.1/34409 (accessed on 9 July 2020).
- Bradshaw, C. Creating—And Using—A Rating System for Neighborhood Walkability Towards an Agenda for “Local Heroes”. In Proceedings of the The School of Cooperative Individualism, XIV International Pedestrian Conference, Boulder, CO, USA, 1 October 1993. [Google Scholar]
- Solnit, R. Wanderlust: A History of Walking; University of Chigago Press: Chicago, IL, USA, 2000. [Google Scholar]
- Chiantera, G.; Cittadino, A.; Del Carlo, G.; Fiermonte, F.; Garnero, G.; Guerreschi, P.; La Riccia, L.; Pirrello, G.; Vico, F. Walkability della città: Analisi raster per supportarne la progettazione e il suo incremento. In Proceedings of the Conferenza Nazionale ASITA, Trieste, Italy, 21–24 October 2018; pp. 1–8. [Google Scholar]
- Shatu, F.; Yigitcanlar, T. Development and validity of a virtual street walkability audit tool for pedestrian route choice analysis—SWATCH. J. Transp. Geogr. 2018, 70, 148–160. [Google Scholar] [CrossRef]
- Ewing, R.; Handy, S. Measuring the unmeasurable: Urban design qualities related to walkability. J. Urban Des. 2009, 14, 65–84. [Google Scholar] [CrossRef]
- Dörrzapf, L.; Kovács-Győri, A.; Resch, B.; Zeile, P. Defining and assessing walkability: A concept for an integrated approach using surveys, biosensors and geospatial analysis. Urban Dev. Issues 2019, 62, 5–15. [Google Scholar] [CrossRef]
- Cambra, P.J.M.D. Pedestrian Accessibility and attractiveness Indicators for Walkability Assessment. Lisbon: Department of Civil Engineering and Architecture, Instituto Superior Técnico, Universidade Técnica de Lisboa. 2012. Available online: https://www.semanticscholar.org/paper/Pedestrian-Accessibility-and-Attractiveness-for-Cambra-Ordenamento/ee089f66f347e662905d92ef1bbe16d7d74a9aa1?p2df (accessed on 20 January 2020).
- Cerasoli, M. Qualità urbana, mobilità, qualità della vita: Una “grammatica” per il Rinascimento della città. Urbanistica Inf. 2015, 7, 16–19. [Google Scholar]
- Cerin, E.; Chan, K.W.; Macfarlane, D.J.; Lee, K.Y.; Lai, P.C. Objective assessment of walking environments in ultra-dense cities: Development and reliability of the Environment in Asia Scan Tool—Hong Kong version (EAST-HK). Health Place 2011, 17, 937–945. [Google Scholar] [CrossRef]
- Galanis, A.; Eliou, N. Evaluation of the pedestrian infrastructure using walkability indicators. WSEAS Trans. Environ. Dev. 2011, 7, 385–394. [Google Scholar]
- Stake, R.E. The Art of Case Study Research; Sage Publications: Thousand Oaks, CA, USA, 1995. [Google Scholar]
- Abastante, F.; Gaballo, M. How to assess walkability as a measure of pedestrian use: First step of a multi-methodological approach. In New Metropolitan Perspectives, Knowledge Dynamics and Innovation-Driven Policies Towards Urban and Regional Transition, Proceedings of the International Symposium on New Metropolitan Perspectives, Reggio Calabria, Italy, 22–25 May 2020; Bevilaqua, C., Calabrò, F., Della Spina, L., Eds.; Springer: Berlin/Heidelberg, Germany, 2020; Volume 2, pp. 254–263. [Google Scholar]
- Domokos, S.; Tier, A.; Wiitala, C. Walkability on University Avenue. 2014. Available online: https://dalspace.library.dal.ca/bitstream/handle/10222/76790/Final%20Walkability%20Report.pdf?sequence=1&isAllowed=y (accessed on 9 July 2020).
- Taleai, M.; Amiri, E.T. Spatial multi-criteria and multi-scale evaluation of walkability potential at street segment level: A case study of Tehran. Sustain. Cities Soc. 2017, 31, 37–50. [Google Scholar] [CrossRef]
- La Riccia, L.; Cittadino, A.; Fiermonte, F.; Garnero, G.; Guerreschi, P.; Vico, F. The Walkability of the Cities: Improving It through the Reuse of Available Data and Raster Analyses. In Spatial Planning in the Big Data Revolution; Voghera, A., La Riccia, L., Eds.; IGI Global: Hershey, PA, USA, 2019; pp. 113–137. [Google Scholar] [CrossRef]
- Gerring, J. Case Study Research: Principles and Practices; Cambridge University Press: Cambridge, UK, 2006. [Google Scholar]
- Harrison, H.; Birks, M.; Franklin, R.; Mills, J. Case study research: Foundations and methodological orientations. In Forum Qualitative Sozialforschung/Forum: Qualitative Social Research; Freie University: Berlin, Germany, 2017; Volume 18. [Google Scholar] [CrossRef]
- Yin, R.K. Applications of Case Study Research; Sage Publications: Thousand Oaks, CA, USA, 2011. [Google Scholar]
- De Carlo, G.; De Rosa, L.; Mancuso, F.; Semerano, P.; Viti, G. Pianificazione E Disegno Delle Università; Edizioni Universitarie: Milan, Italy, 1968. [Google Scholar]
- Favaro, S.; Genta, C. PoliGround. La Valutazione Dell’impronta Ecologica E Possibili Scenari per Un Campus Post-Carbon. Ph.D. Thesis, Politecnico di Torino, Torino, Italy, 2017. [Google Scholar]
- Politecnico di Torino Project Team. Masterplan Processo per Lo Sviluppo Strategico Degli Spazi Di Ateneo. 2017. Available online: http://www.masterplan.polito.it/ (accessed on 9 July 2020).
- Soman, D. The Last Mile: Creating Social and Economic Value from Behavioral Insights; University of Toronto Press: Toronto, ON, Canada, 2015. [Google Scholar]
- Lami, I.M.; Abastante, F.; Bottero, M.; Masala, E.; Pensa, S. Integrating multicriteria evaluation and data visualization as a problem structuring approach to support territorial transformation projects. EURO J. Decis. Process. 2014, 2, 281–312. [Google Scholar] [CrossRef]
- Abastante, F.; Lami, I.M. An integrated assessment framework for the requalification of districts facing urban and social decline. In Seminar of the Italian Society of Property Evaluation and Investment Decision; Springer: Cham, Switzerland, 2016; pp. 535–545. [Google Scholar] [CrossRef]
- Ussery, E.N.; Omura, J.D.; Paul, P.; Orr, J.; Spoon, C.; Geremia, C.; Carlson, S.A. Sampling methodology and reliability of a representative walkability audit. J. Transp. Health 2019, 12, 75–85. [Google Scholar] [CrossRef]
- Yin, L. Street level urban design qualities for walkability: Combining 2D and 3D GIS measures. Comput. Environ. Urban Syst. 2017, 64, 288–296. [Google Scholar] [CrossRef]
- Congiu, T.; Fancello, G. Misurare la camminabilità. Urbanistica Inf. 2015; 7, 2–4. [Google Scholar]
- D’Alessandro, D.; Appolloni, L.; Capasso, L. How walkable is the city? Application of the Walking Suitability Index of the Territory (T-WSI) to the city of Rieti (Lazio Region, Central Italy). Epidemiol. Prev. 2016, 40, 237–242. [Google Scholar] [CrossRef]
- Lovelace, R. Integrating Geographic Analysis in Transport Planning OSF Preprints. 2019. Available online: https://www.researchgate.net/publication/335706023_Integrating_geographic_analysis_in_transport_planning (accessed on 29 September 2020).
- Batty, M. Cities as Complex Systems. Scaling, Interactions, Networks, Dynamics and Urban Morphologies. In Encyclopedia of Complexity and Systems Science; Springer: Berlin/Heidelberg, Germany, 2008. [Google Scholar] [CrossRef]
- Abastante, F.; Lami, I.M.; Lombardi, P. An integrated participative spatial decision support system for smart energy urban scenarios: A financial and economic approach. Buildings 2017, 7, 103. [Google Scholar] [CrossRef]
- Blečić, I.; Cecchini, A.; Congiu, T.; Fancello, G.; Trunfio, G.A. Evaluating walkability: A capability-wise planning and design support system. Int. J. Geogr. Inf. Sci. 2015, 29, 1350–1374. [Google Scholar] [CrossRef]
- Andrienko, G.; Andrienko, N.; Jankowski, P.; Keim, D.; Kraak, M.; MacEachren, A.; Wrobel, S. Geovisual analytics for spatial decision support: Setting the research agenda. Int. J. Geogr. Inf. Sci. 2017, 21, 839–857. [Google Scholar] [CrossRef]
- MacEachren, A.M.; Gahegan, M.; Pike, W.; Brewer, I.; Cai, G.; Lengerich, E.; Hardistry, F. Geovisualization for knowledge construction and decision support. IEEE Comput. Graph. Appl. 2004, 24, 13–17. [Google Scholar] [CrossRef]
- Pensa, S.; Masala, E.; Lami, I.M. Supporting planning processes by the use of dynamic visualization. In Planning Support Systems for Sustainable Urban Development; Geertman, S., Toppen, F., Stillwell, J., Eds.; Springer: Heidelberg/Berlin, Germany, 2013; pp. 451–467. [Google Scholar] [CrossRef]
- Pensa, S.; Masala, E.; Lami, I.M.; Rosa, A. Seeing is knowing: Data exploration as a support to planning. In Civil Engineering; Thomas Telford Ltd.: London, UK, 2015; Special Issue on Visualisation. [Google Scholar] [CrossRef]
- Vennix, J. Group Model Building: Facilitating Team Learning Using Systems Dynamics; Wiley: London, UK, 1996. [Google Scholar]
- Andersen, D.F.; Richardson, G.P. Scripts for group model building. Syst. Dyn. Interview 1997, 13, 107–129. [Google Scholar] [CrossRef]
- Ford, A.M. Walkability of Campus Communities Surrounding Wright State University; Wright State University: Dayton, OH, USA, 2013. [Google Scholar]
- Lee, S.; Talen, E. Measuring walkability: A note on auditing methods. J. Urban Des. 2014, 19, 368–388. [Google Scholar] [CrossRef]
- Wibowo, S.S.; Nurhalima, D.R. Pedestrian facilities evaluation using Pedestrian Level of Service (PLOS) for university area: Case of Bandung Institute of Technology. MATEC Web Conf. 2018, 181, 02005. Available online: https://www.matec-conferences.org/articles/matecconf/pdf/2018/40/matecconf_istsdc2017_02005.pdf (accessed on 20 January 2020).
- Keat, L.K.; Yaacob, N.M.; Hashim, N.R. Campus walkability in Malaysian public universities: A case-study of Universiti Malaya. Plan. Malays. 2016, 14, 101–114. [Google Scholar] [CrossRef]
- Amaturo, E.; Aragona, B. La valutazione sociale delle occupazioni: Questioni di metodo. Quad. Sociol. 2013, 62, 25–38. [Google Scholar] [CrossRef]
- Likert, R. A technique for the measurement of attitudes. Arch. Psychol. 1932, 140, 1932. [Google Scholar]
- Barua, A. Methods for decision-making in survey questionnaires based on Likert scale. J. Asian Sci. Res. 2013, 3, 35–38. [Google Scholar]
- Westfall, L. Sampling methods. In The Certified Quality Engineer Handbook; Quality Press: Nottingham, UK, 2009. [Google Scholar]
- Ross, S.M. Introduzione Alla Statistica; Maggioli Editore: Rimini, Italy, 2014; ISBN 8891602671. [Google Scholar]
- Sustainable Urban Mobility Plan (PUMS) of Turin. 2011. Available online: http://geoportale.comune.torino.it/web/ (accessed on 27 June 2020).
- Balaga, P.; Landman, P. Composition of Raster and Vector Graphics in Geographic Information Systems. U.S. Patent US7792331B2, 7 September 2010. [Google Scholar]
- Forsyth, A. What is a Walkable Place? The Walkability Debate in Urban Design. Urban Des. Int. 2015, 20, 274–292. [Google Scholar] [CrossRef]
- Won, J.; Lee, C.; Li, W. Are Walkable Neighborhoods More Resilient to the Foreclosure Spillover Effects? J. Plan. Educ. Res. 2018, 38, 463–476. [Google Scholar] [CrossRef]
- Nijkamp, P.; Blaas, E.W. Impact Assessment and Evaluation in Transportation Planning; Springer Science and Business Media: Dordrecht, Germany, 2012. [Google Scholar]
- Scheiner, J.; Holz-Rau, C. Travel mode choice: Affected by objective or subjective determinants? Transportation 2007, 34, 487–511. [Google Scholar] [CrossRef]
- Hamers, D.; Piek, M. Mapping the future urbanization patterns on the urban fringe in the Netherlands. Urban Res. Pract. 2012, 5, 129–156. [Google Scholar] [CrossRef]
- Masoumzadeh, S.; Pendar, H. Walking as a medium of comprehending contextual assets of historical urban fabrics. Urban Res. Pract. 2019, 1–23. [Google Scholar] [CrossRef]
- Zoppi, C. Governance, Pianificazione E Valutazione Strategica: Sviluppo Sostenibile E Governance Nella Pianificazione Urbanistica; Gangemi Editore: Roma, Italy, 2012. [Google Scholar]


| Phases | Steps | Activities | Results |
|---|---|---|---|
| Choice | Literature review | Definition of the keywords/search parameters | Selection of 16 papers containing qualitative/quantitative assessment methods to measure walkability |
| Definition of the time span | |||
| Database search | |||
| Analysis of the 16 papers selected | Identification of the most used indexes and indicators (4 indexes and 18 indicators) | ||
| Analysis | Empirical investigation | Validation of the results of the Choice phase | Elaboration of a survey test |
| Selection of a preliminary sample to deliver the survey test | 40 students of the PoliTO campus + PoliTO masterplan | ||
| Validation of the reliability of the survey on the preliminary sample | Changing the indexes and the indicators selected in the Choice phase 4 indexes and 28 indicators) | ||
| Choice of a final sample to deliver the survey | 100 PoliTO users | ||
| Delivery of the survey to the final sample | Definition of the weights to be attributed to the indexes and the indicators | ||
| Statistical analysis | |||
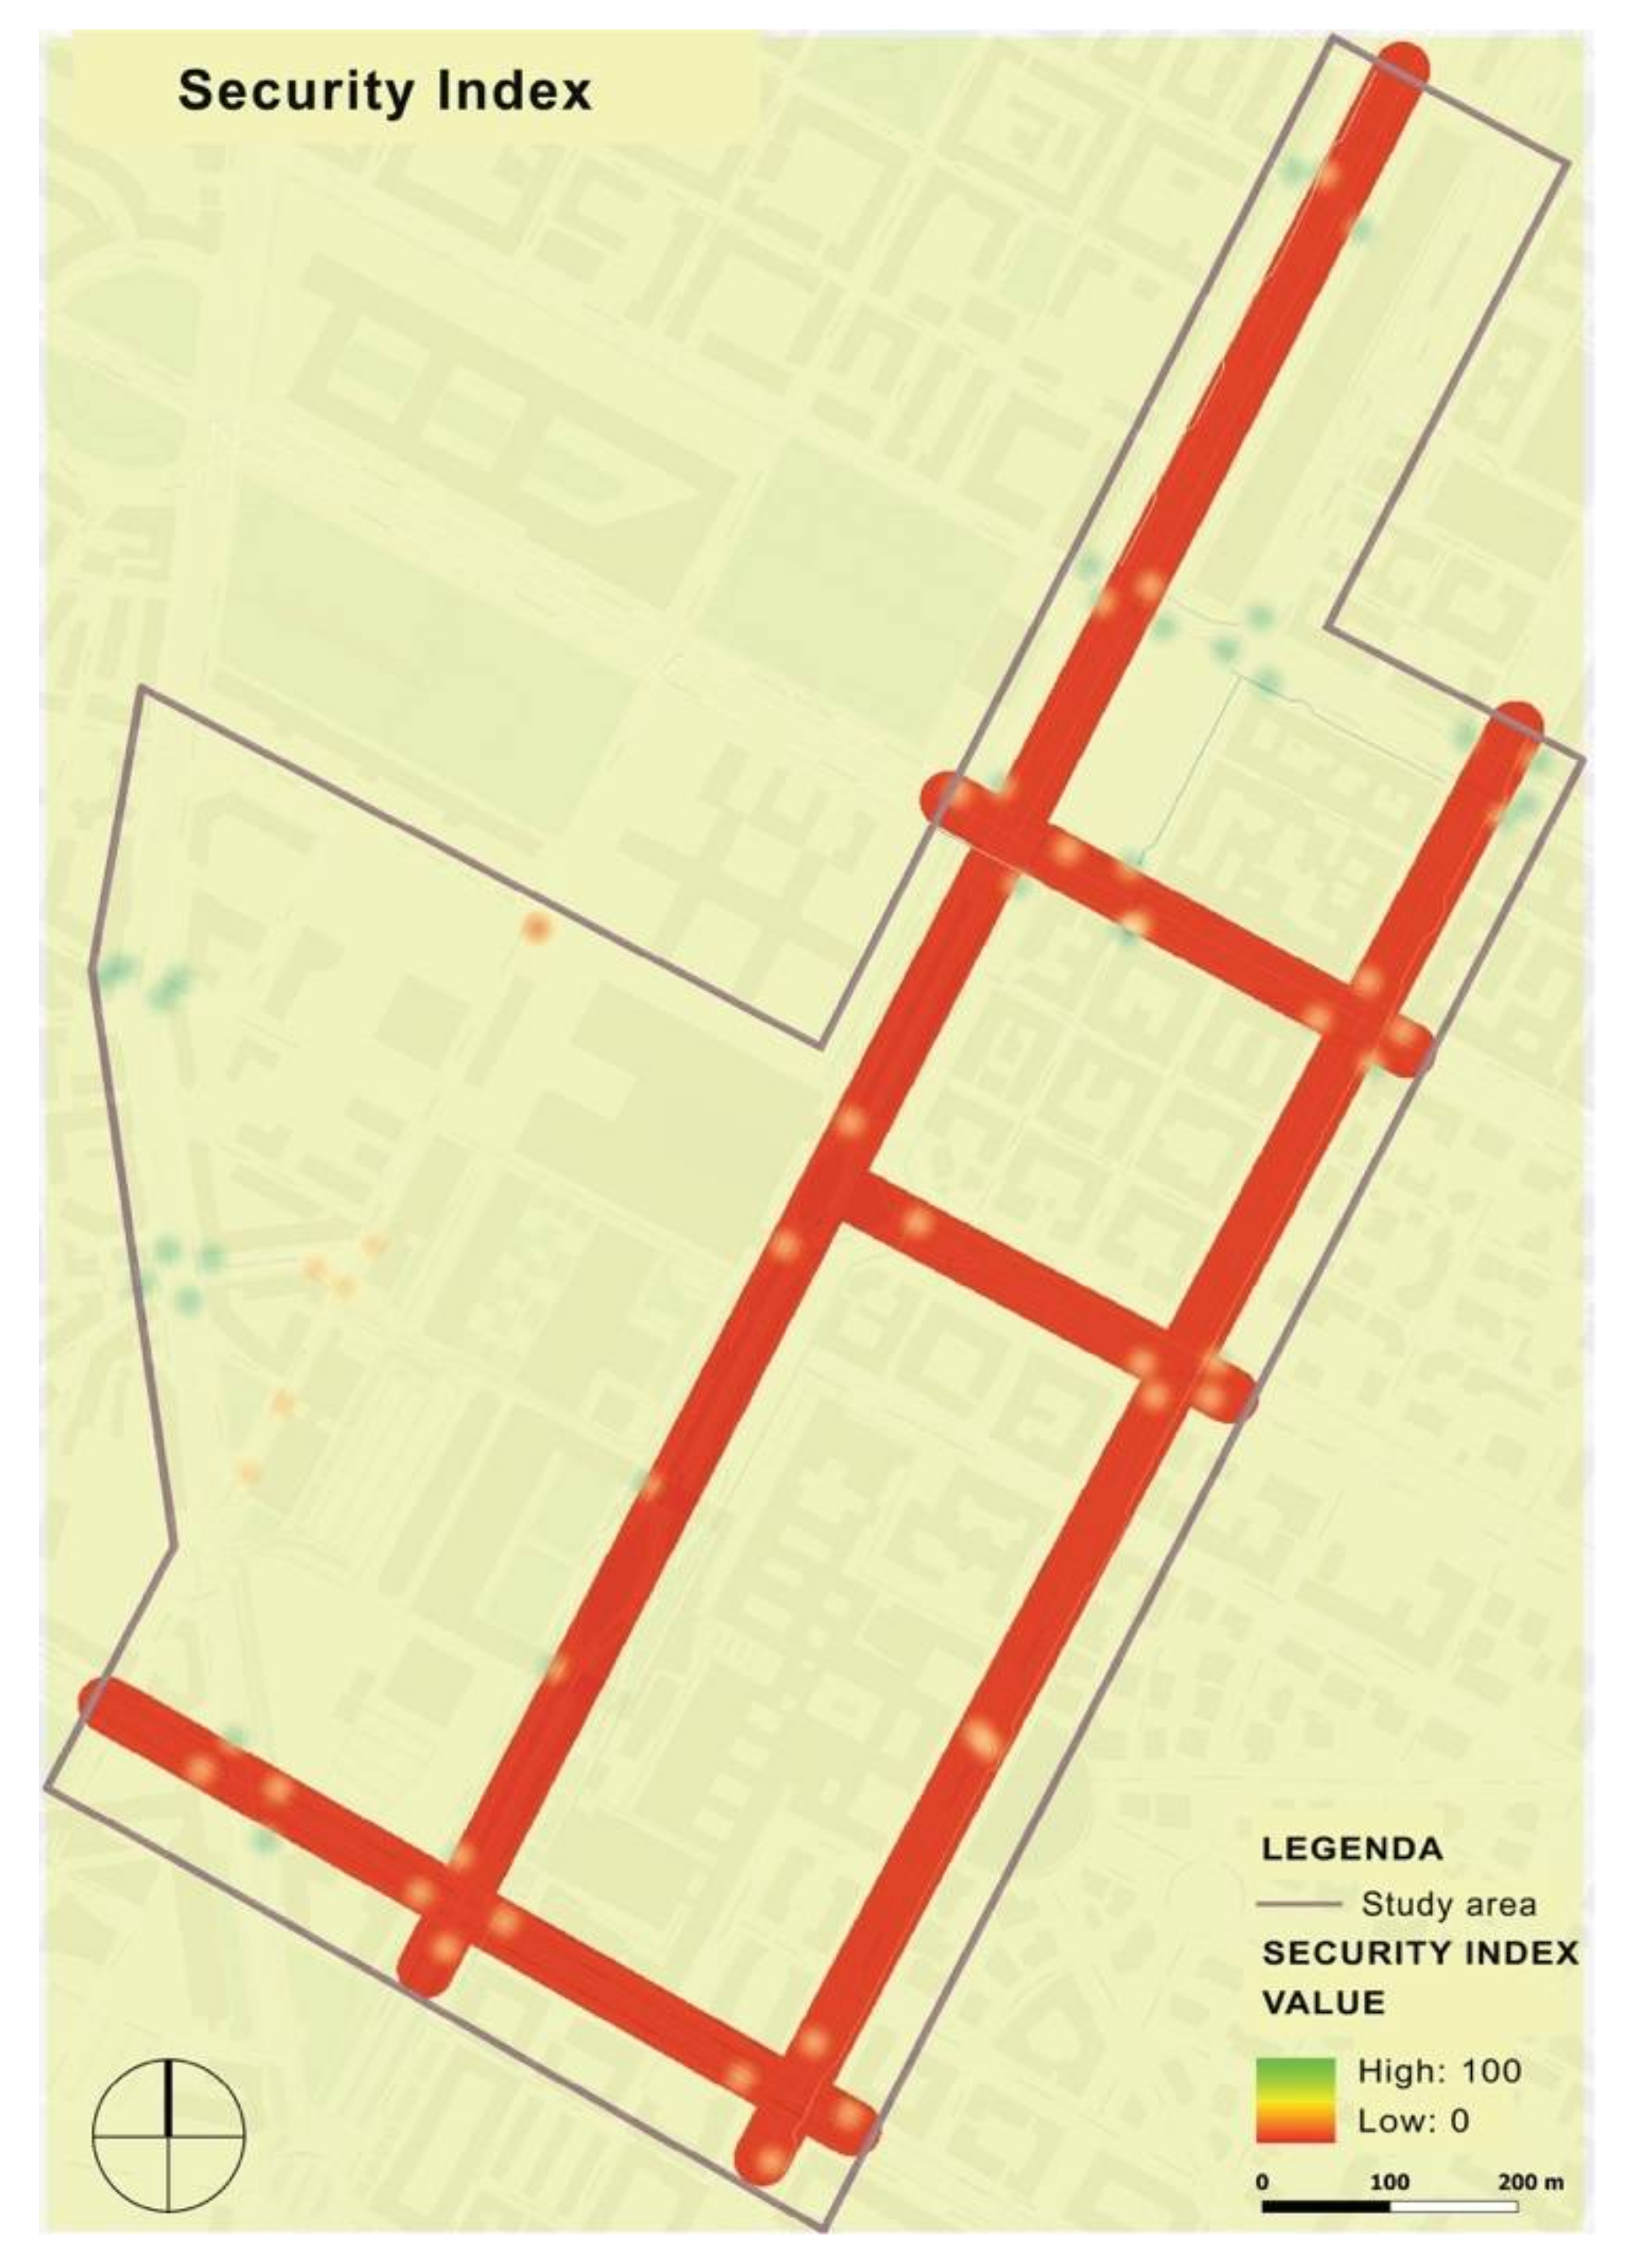
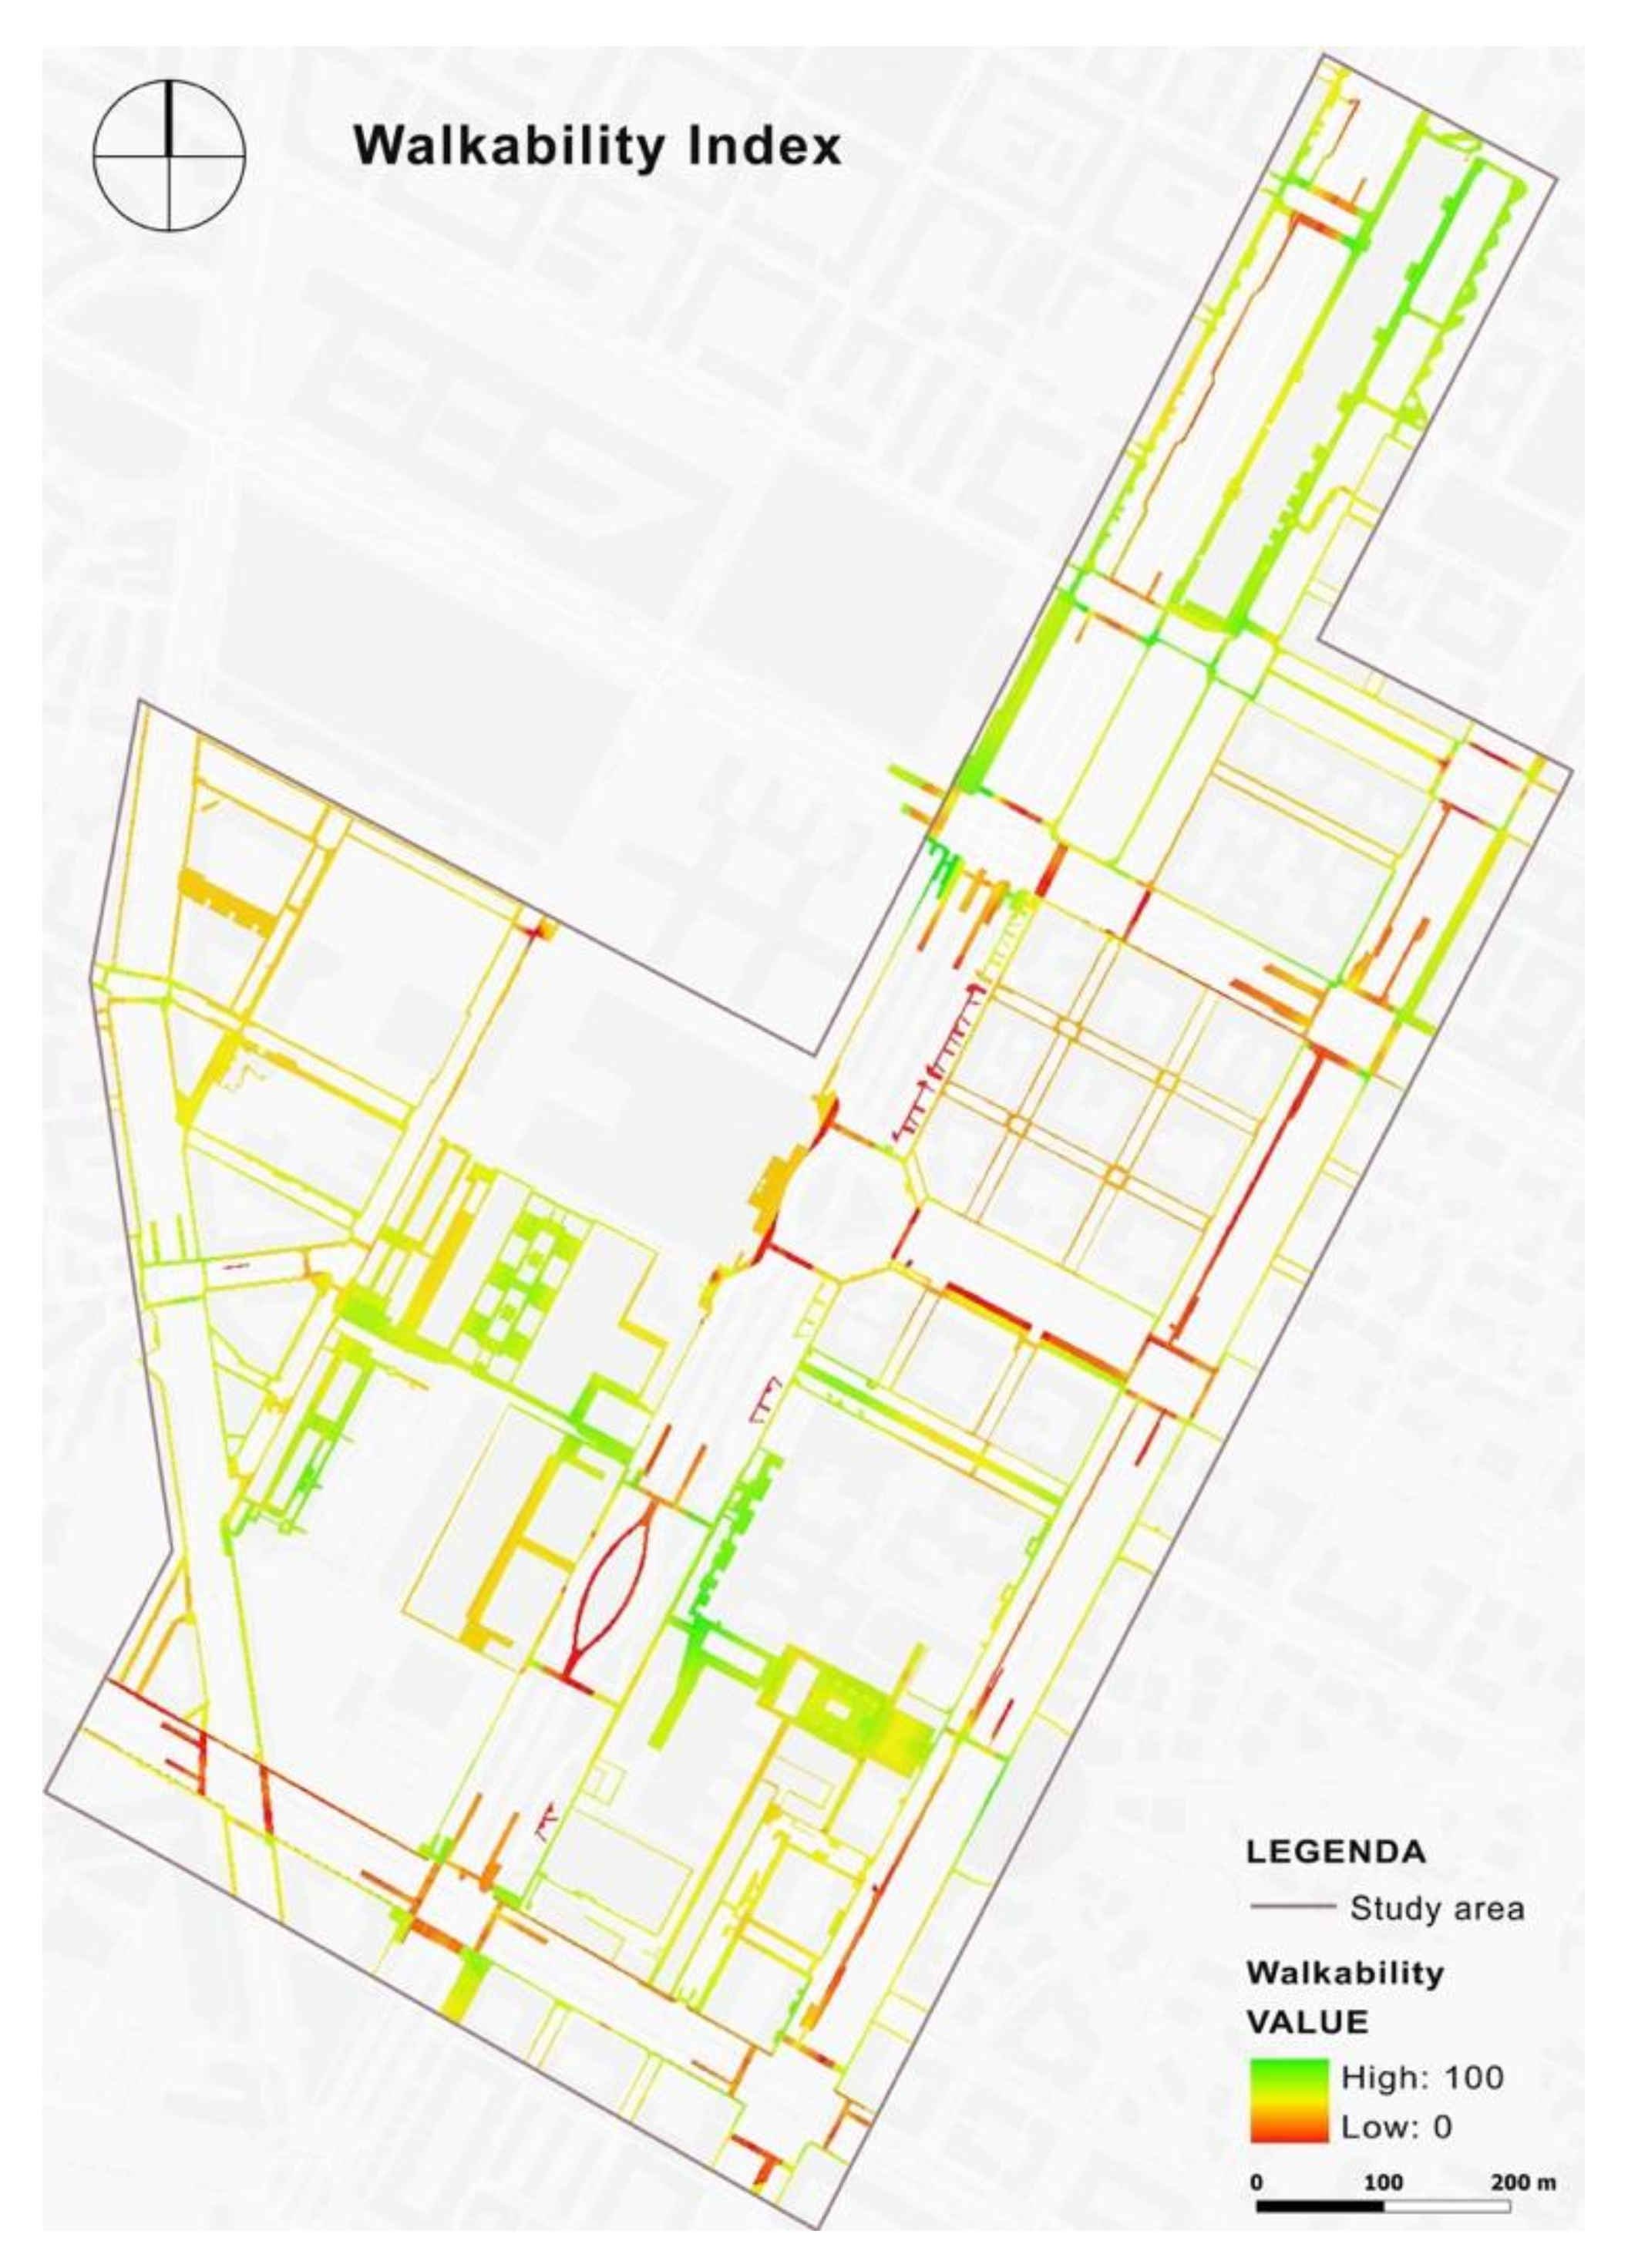
| Evaluation | Spatial evaluation | Use of Geographic Information Systems (GIS) measures to spatialize the indexes and indicators | Spatialization of the indexes and the indicators |
| Identification of the problem areas from a walkability perspective in the study area | Suggestions for improvement in terms of walkability to support the PoliTO Masterplan |
| Papers | Quantitative Methods | Qualitative Methods | |||
|---|---|---|---|---|---|
| Weighting of Indexes and Indicators | Statistical Analysis | Empirical Investigation | Assessment Survey | Visualization through GIS and CAD (Computer-Aided Drafting) Tools | |
| Ewing and Handy, 2009 | ✔ | ✔ | |||
| Cerin et al., 2011 | ✔ | ✔ | |||
| Galanis and Eliou, 2011 | ✔ | ✔ | |||
| Cambra, 2012 | ✔ | ✔ | |||
| Ford, 2013 | ✔ | ||||
| Moayedi et al., 2013 | ✔ | ||||
| Domokos, Wiitala and Tier, 2014 | ✔ | ✔ | |||
| Lee and Talen, 2014 | ✔ | ✔ | ✔ | ||
| Blečić et al., 2014 | ✔ | ✔ | |||
| D’Alessandro, Apolloni and Capasso, 2016 | ✔ | ||||
| Keat, Yaacob and Hashim, 2016 | ✔ | ✔ | |||
| Yin, 2017 | ✔ | ✔ | |||
| Chiantera et al., 2018 | ✔ | ✔ | |||
| Shatu and Yigitcanlar, 2018 | ✔ | ✔ | |||
| Wibowo and Nurhalima, 2018 | ✔ | ||||
| Ussery et al., 2019 | ✔ | ||||
| Indexes | Indicators | References |
|---|---|---|
| Security | Presence of intersections | [33,39,52,63,64,65,66] |
| Drivable speed | ||
| Existence of conflict area between pedestrian and vehicular traffic | ||
| Types of roads | ||
| Quality of routes | Sidewalk’s length | [21,28,29,31,33,34,39,52,63,64,65,66] |
| Condition of the pavement | ||
| Non-sliding paths (with obstacles) | ||
| Well connected | ||
| Slope | ||
| Intermodality | Presence and coverage of public transport stops | [31,63] |
| Cycling | ||
| Comfort | Presence of trees/meadows | [21,29,31,33,37,39,49,50,52,63,64,65,66] |
| Adequate lighting | ||
| Possibility of stopping due to benches | ||
| Architectural variety | ||
| Buildings with monotonous colors | ||
| Possibility to see the continuity of the route | ||
| Presence of commercial activity |
| Indexes | Indicators | |
|---|---|---|
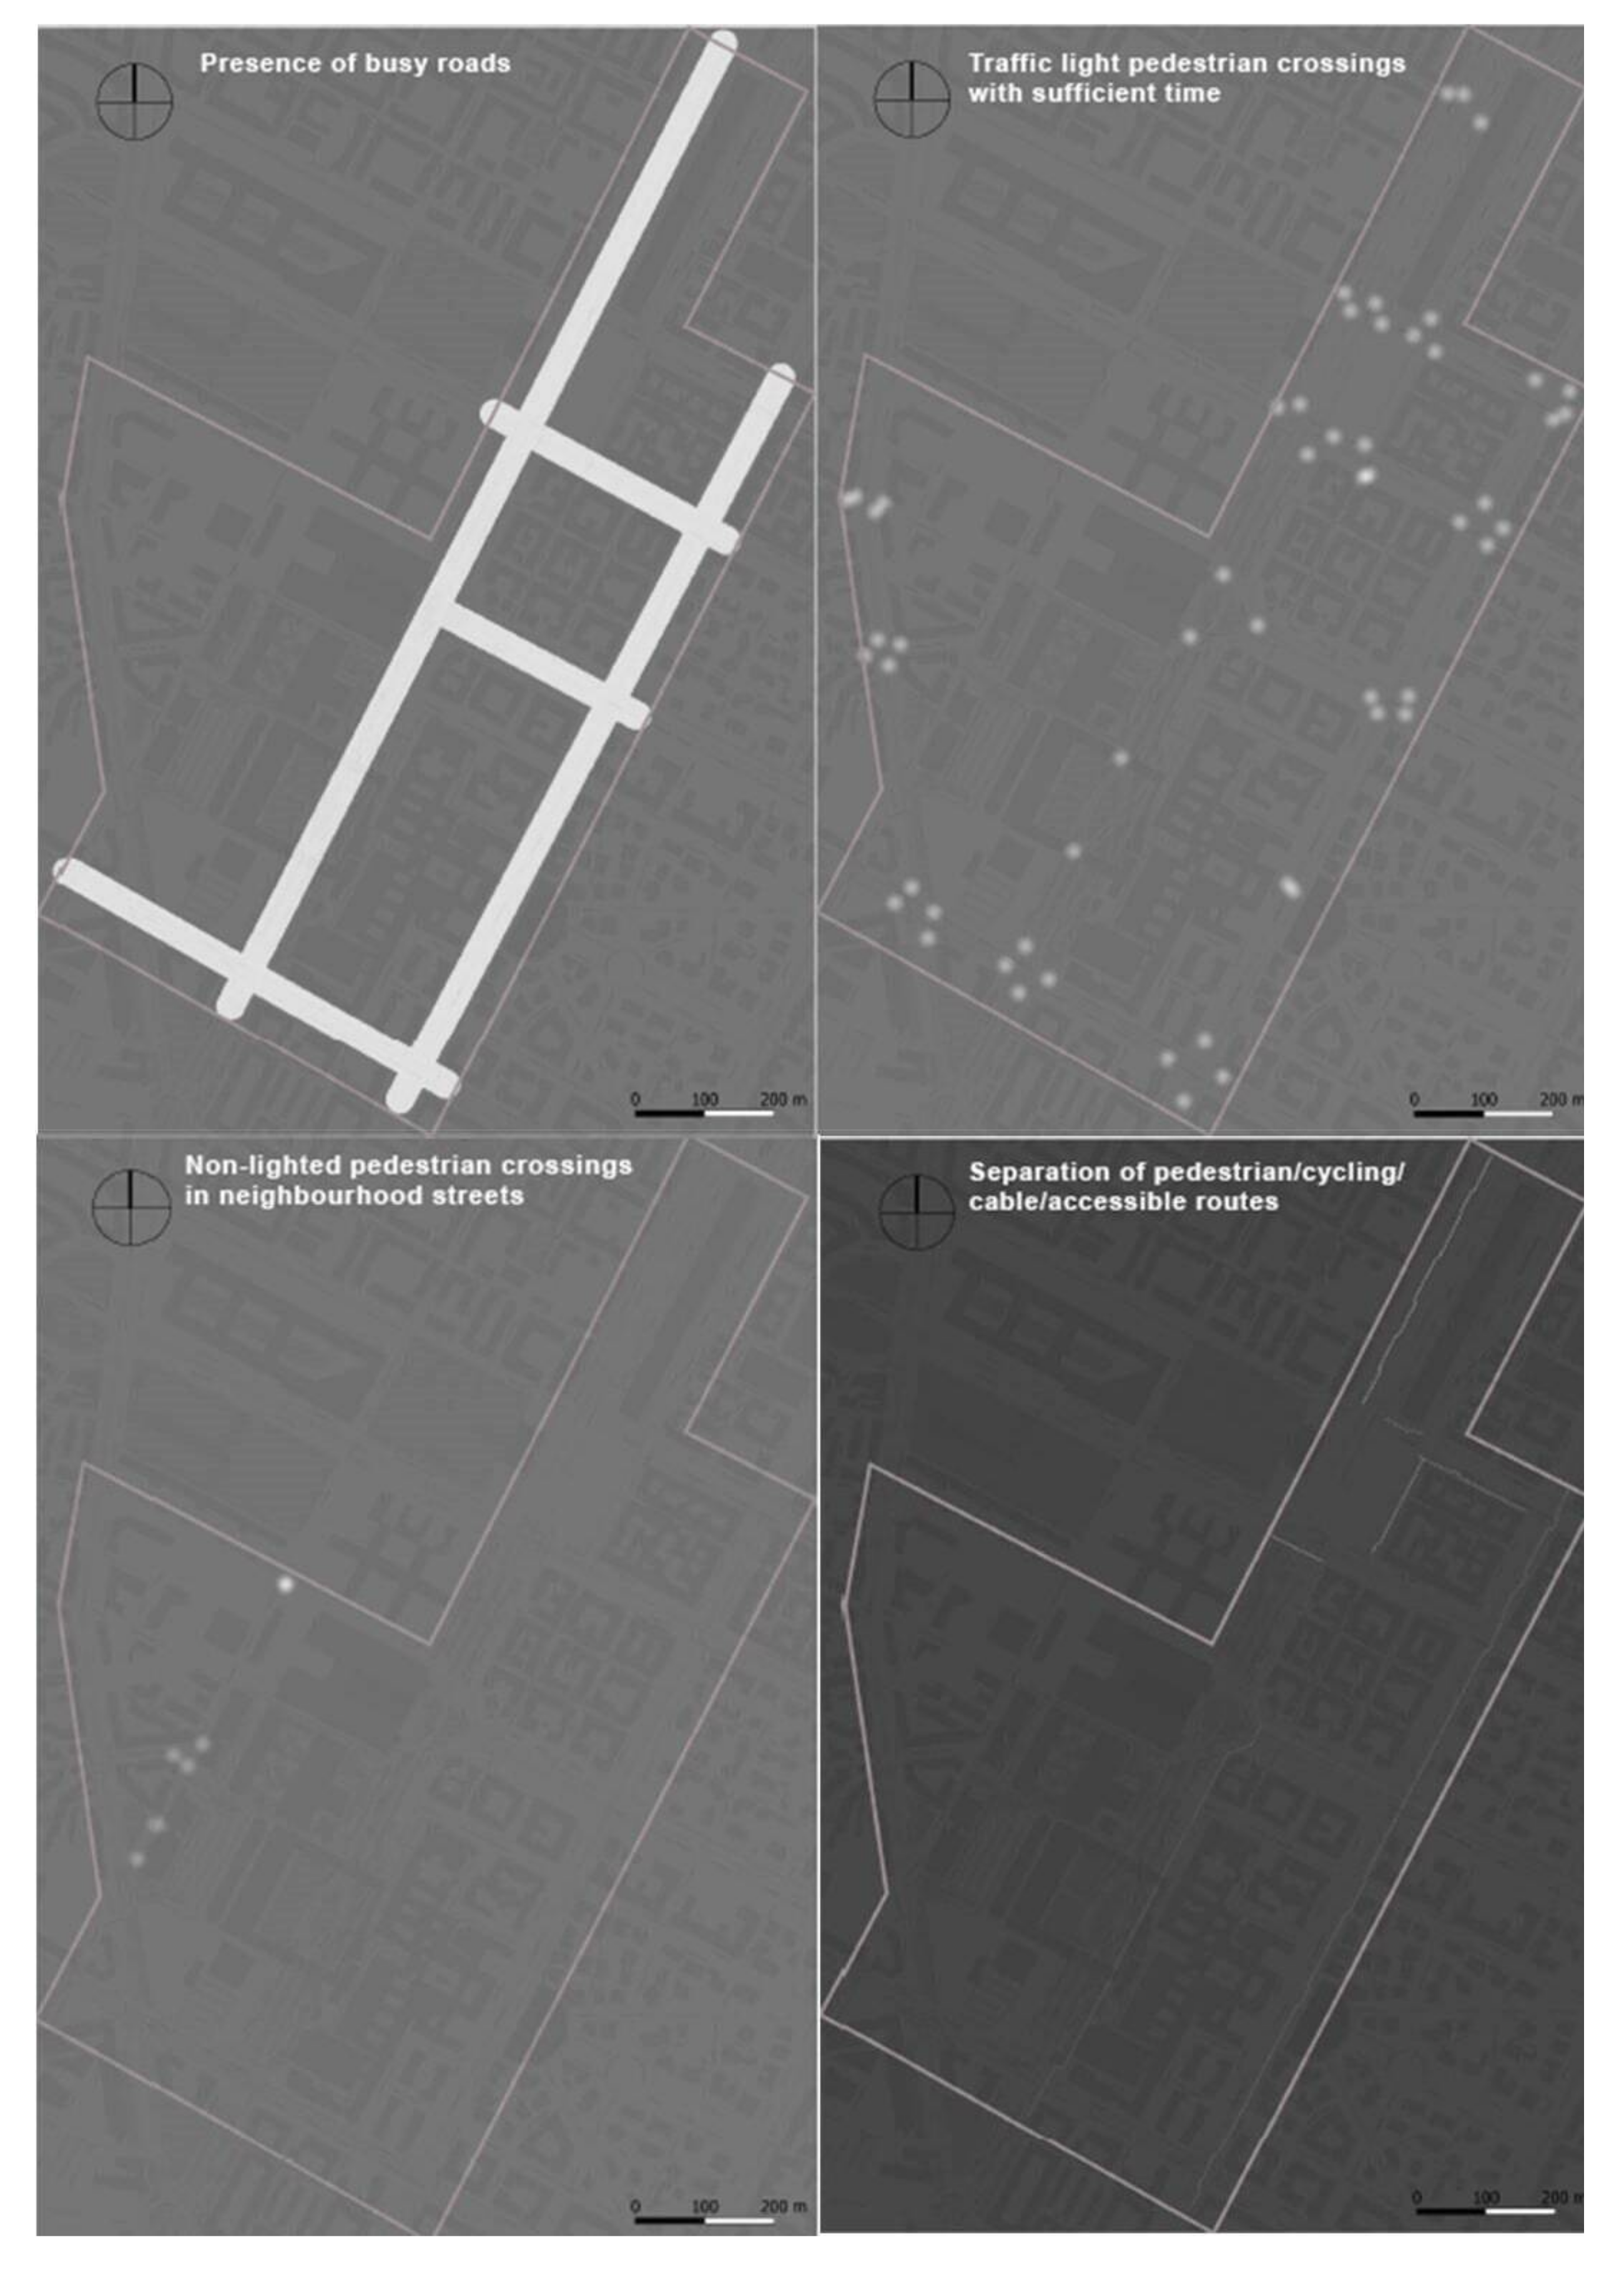
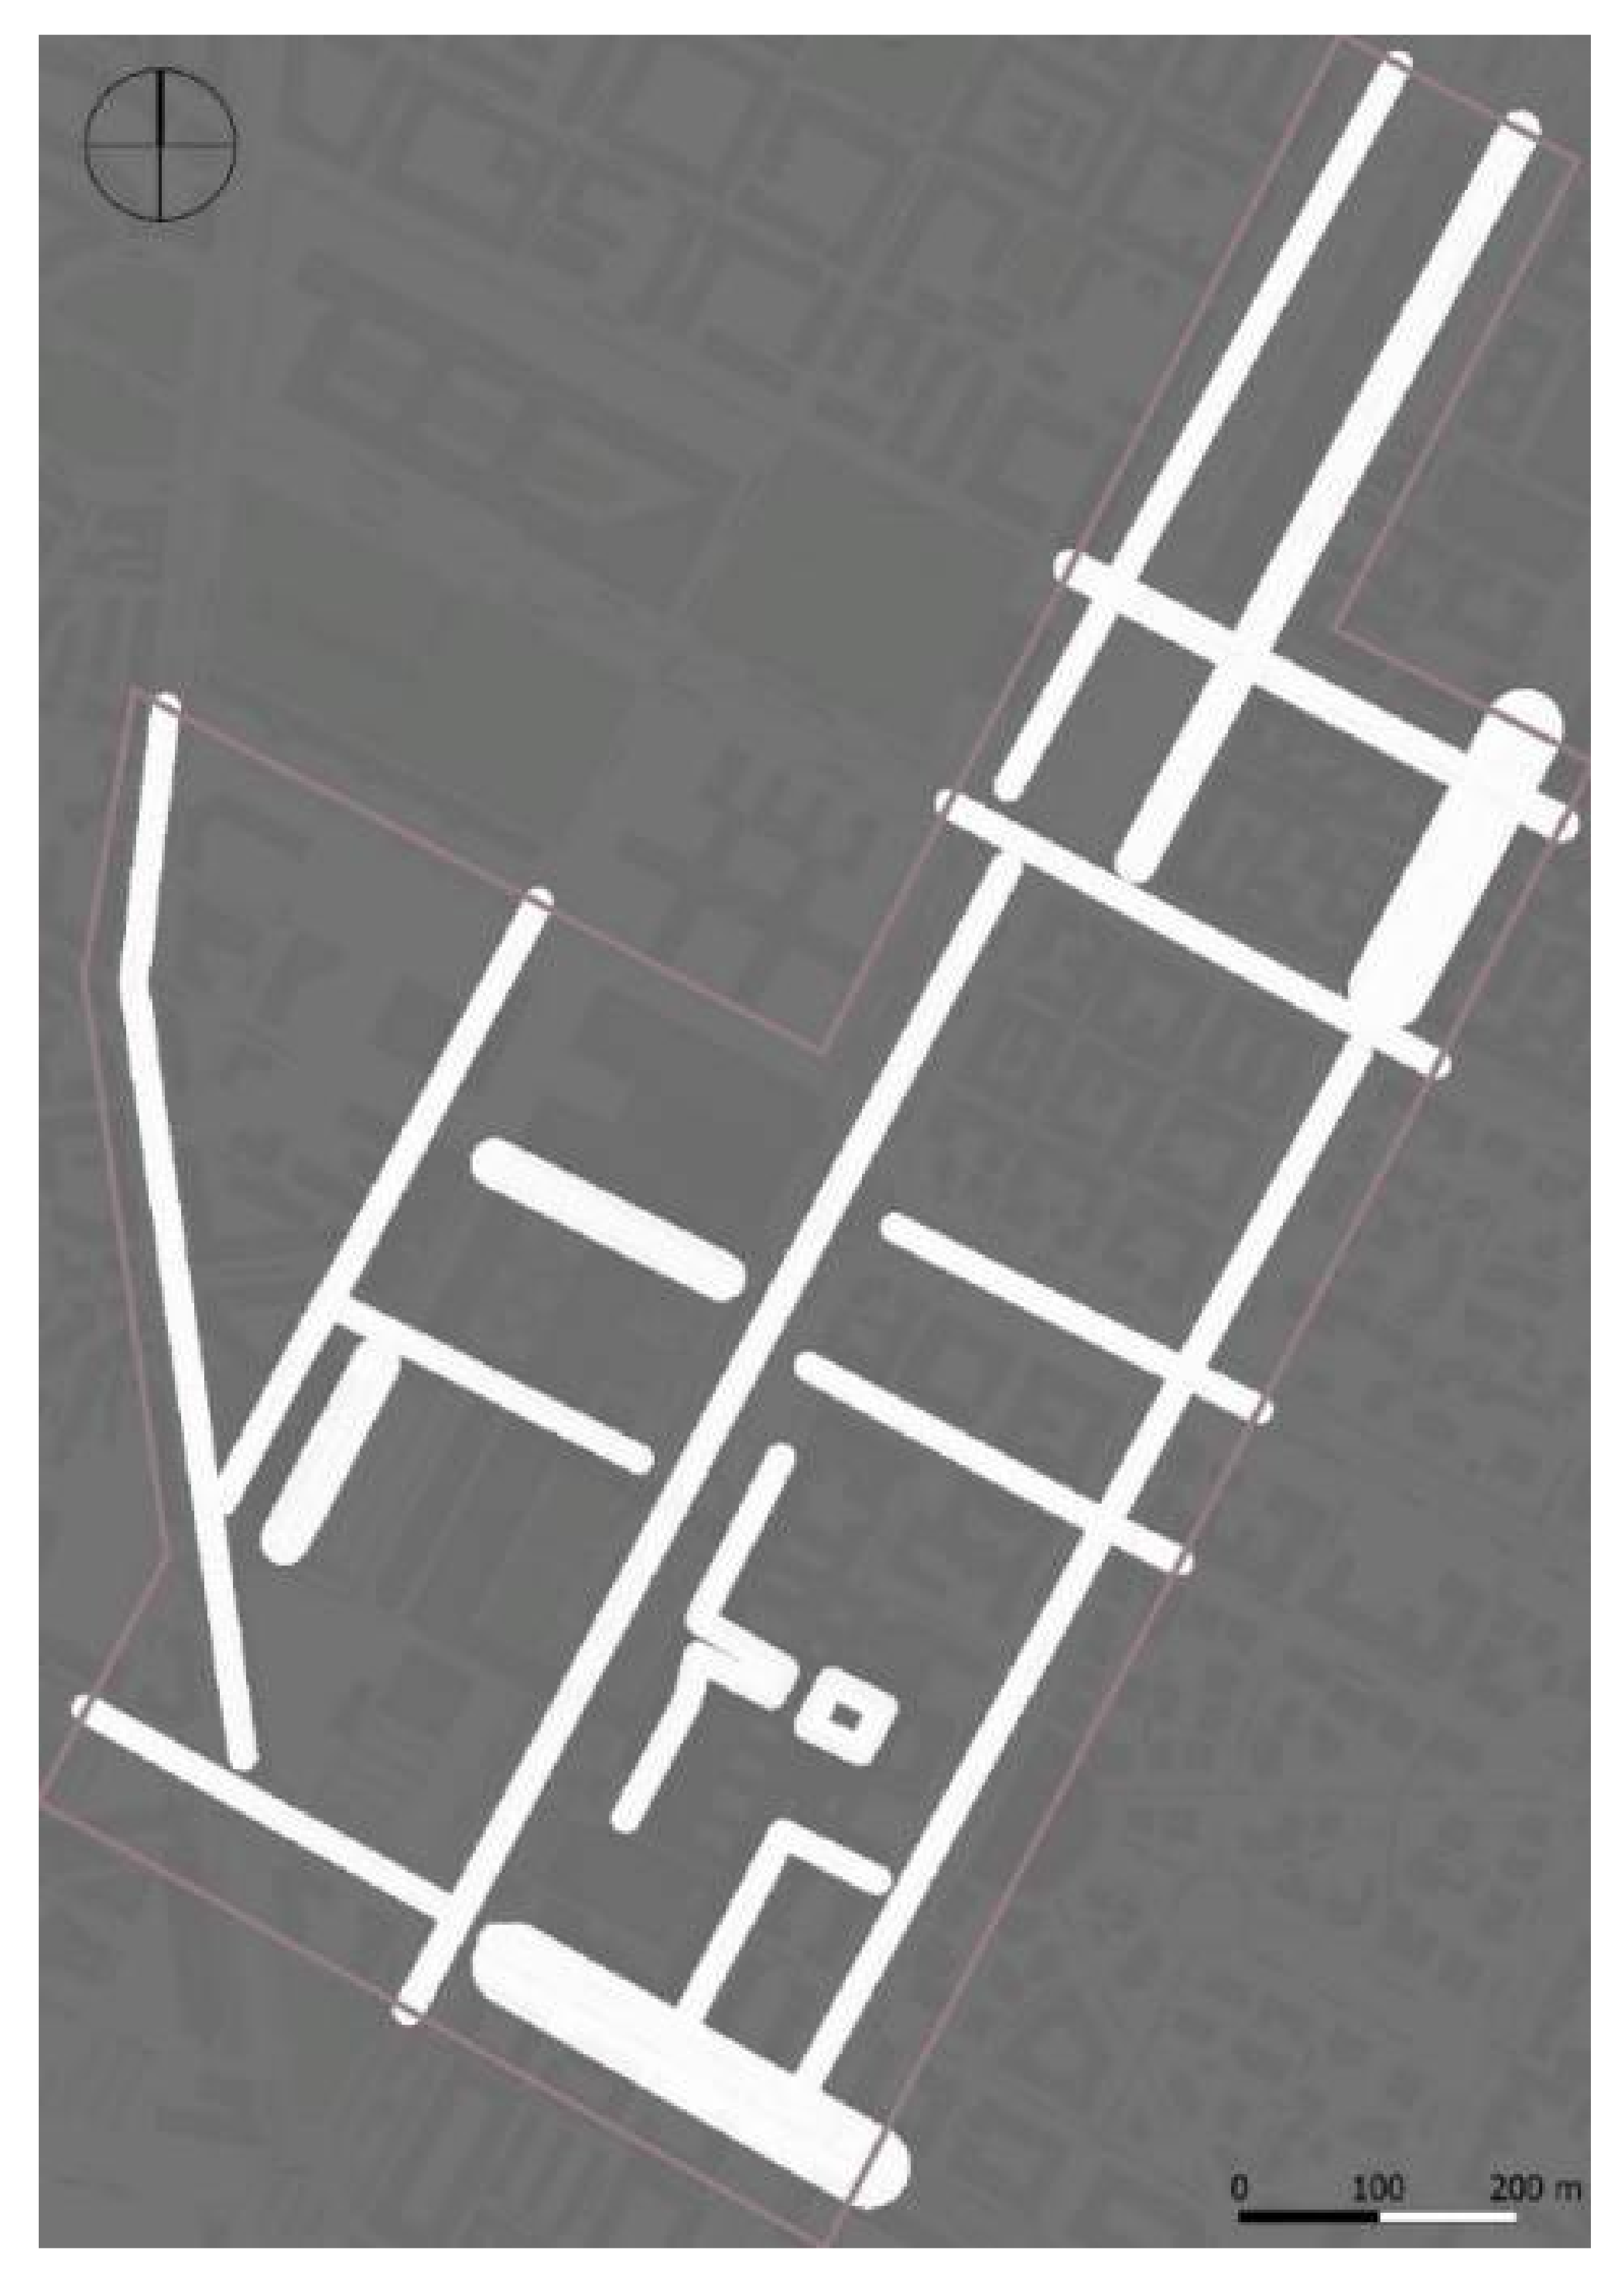
| Security | Presence of busy roads | |
| Traffic light pedestrian crossings with sufficient time | ||
| Non-lighted pedestrian crossings in neighborhood streets | ||
| Separation of pedestrian/cycling/cable/accessible routes | ||
| Quality of routes | Internal | Tightening of sidewalk |
| Condition of the pavement | ||
| Non-sliding paths (with obstacles) | ||
| Well connected with the outside | ||
| Slope | ||
| External | Tightening of sidewalk | |
| Condition of the pavement | ||
| Non-sliding paths (with obstacles) | ||
| Intermodality | Parking spaces for own bike | |
| Easy accessibility by public transport | ||
| Own car parks | ||
| Bike sharing stations | ||
| Car sharing stations | ||
| Comfort | Acoustic pollution | |
| Covered routes | ||
| Presence of trees/meadows | ||
| Presence of baskets | ||
| Adequate lighting during night/evening hours | ||
| Possibility of stopping due to the presence of benches | ||
| Presence of water points | ||
| Presence of tall buildings | ||
| Buildings with monotonous colors | ||
| Possibility to see the continuity of the route | ||
| Refreshment points of the PoliTO campus | ||
| Study points in the PoliTO campus | ||
| Spaces where crowding is created in PoliTO campus | ||
| Spaces where crowding is created outside PoliTO campus | ||
| There are many busy roads in the area inside the PoliTO campus with heavy vehicular traffic. | ||||||
|---|---|---|---|---|---|---|
| Strongly Disagree | 1 | 2 | 3 | 4 | 5 | Strongly Agree |
| Indexes | Weights of Indexes | Indicators | Weights of Indicators | ||
|---|---|---|---|---|---|
| Security | 29% | Presence of busy roads | 31% | Minimize | |
| Traffic light pedestrian crossings with sufficient time | 23% | Maximize | |||
| Non-lighted pedestrian crossings in neighborhood streets | 19% | Minimize | |||
| Separation of pedestrian/cycling/cable/accessible routes | 26% | Maximize | |||
| Quality of routes | 28% | Internal | Tightening of sidewalk | 12% | Minimize |
| Condition of the pavement | 13% | Maximize | |||
| Non-sliding paths (with obstacles) | 15% | Minimize | |||
| Well connected with the outside | 12% | Maximize | |||
| Slope | 11% | Minimize | |||
| External | Tightening of sidewalk | 13% | Minimize | ||
| Condition of the pavement | 12% | Maximize | |||
| Non-sliding paths (with obstacles) | 12% | Maximize | |||
| Intermodality | 22% | Parking spaces for own bike | 20% | Maximize | |
| Easy accessibility by public transport | 23% | Maximize | |||
| Own car parks | 17% | Maximize | |||
| Bike sharing stations | 21% | Maximize | |||
| Car sharing stations | 19% | Maximize | |||
| Comfort | 21% | Acoustic pollution | 8% | Minimize | |
| Covered routes | 5% | Maximize | |||
| Presence of trees/meadows | 6% | Maximize | |||
| Presence of baskets | 7% | Maximize | |||
| Adequate lighting during night/evening hours | 7% | Maximize | |||
| Possibility of stopping due to the presence of benches | 6% | Maximize | |||
| Presence of water points | 6% | Maximize | |||
| Presence of tall buildings | 8% | Maximize | |||
| Buildings with monotonous colors | 8% | Minimize | |||
| Possibility to see the continuity of the route | 7% | Maximize | |||
| Refreshment points of the PoliTO campus | 8% | Maximize | |||
| Study points in the PoliTO campus | 7% | Maximize | |||
| Spaces where crowding is created in PoliTO campus | 10% | Minimize | |||
| Spaces where crowding is created outside PoliTO campus | 8% | Minimize | |||
© 2020 by the authors. Licensee MDPI, Basel, Switzerland. This article is an open access article distributed under the terms and conditions of the Creative Commons Attribution (CC BY) license (http://creativecommons.org/licenses/by/4.0/).
Share and Cite
Abastante, F.; Lami, I.M.; La Riccia, L.; Gaballo, M. Supporting Resilient Urban Planning through Walkability Assessment. Sustainability 2020, 12, 8131. https://doi.org/10.3390/su12198131
Abastante F, Lami IM, La Riccia L, Gaballo M. Supporting Resilient Urban Planning through Walkability Assessment. Sustainability. 2020; 12(19):8131. https://doi.org/10.3390/su12198131
Chicago/Turabian StyleAbastante, Francesca, Isabella M. Lami, Luigi La Riccia, and Marika Gaballo. 2020. "Supporting Resilient Urban Planning through Walkability Assessment" Sustainability 12, no. 19: 8131. https://doi.org/10.3390/su12198131
APA StyleAbastante, F., Lami, I. M., La Riccia, L., & Gaballo, M. (2020). Supporting Resilient Urban Planning through Walkability Assessment. Sustainability, 12(19), 8131. https://doi.org/10.3390/su12198131