Modelling, Measuring, and Visualising Community Resilience: A Systematic Review

Abstract
1. Introduction
2. Background
3. Methodological Approach
3.1. Research Question
- 1.
- What resilience studies, projects, and tools at community-based levels already exist?
- 2.
- What types of threats, hazards, shocks, disasters, etc. do they face?
- 3.
- What and how many resilience components and properties do they define?
- 4.
- How do they measure community resilience—i.e., using more qualitative evidence, quantitative indicators, or a combination of the two?
- 5.
- What are the appropriate visualisation techniques to express community resilience information?
3.2. Search Strategy
3.3. Eligibility Criteria and Selection Process
- Focusing on modelling, measuring, or visualising community, urban, or rural resilience.
- Having full-text publications or descriptions.
- Publishing in the English language.
- The literature is a letter, thesis, dissertation, or conference abstract.
- The literature is not related to defined research questions.
4. Modelling Community Resilience
4.1. Defining Key Components
4.1.1. Less than Five Components
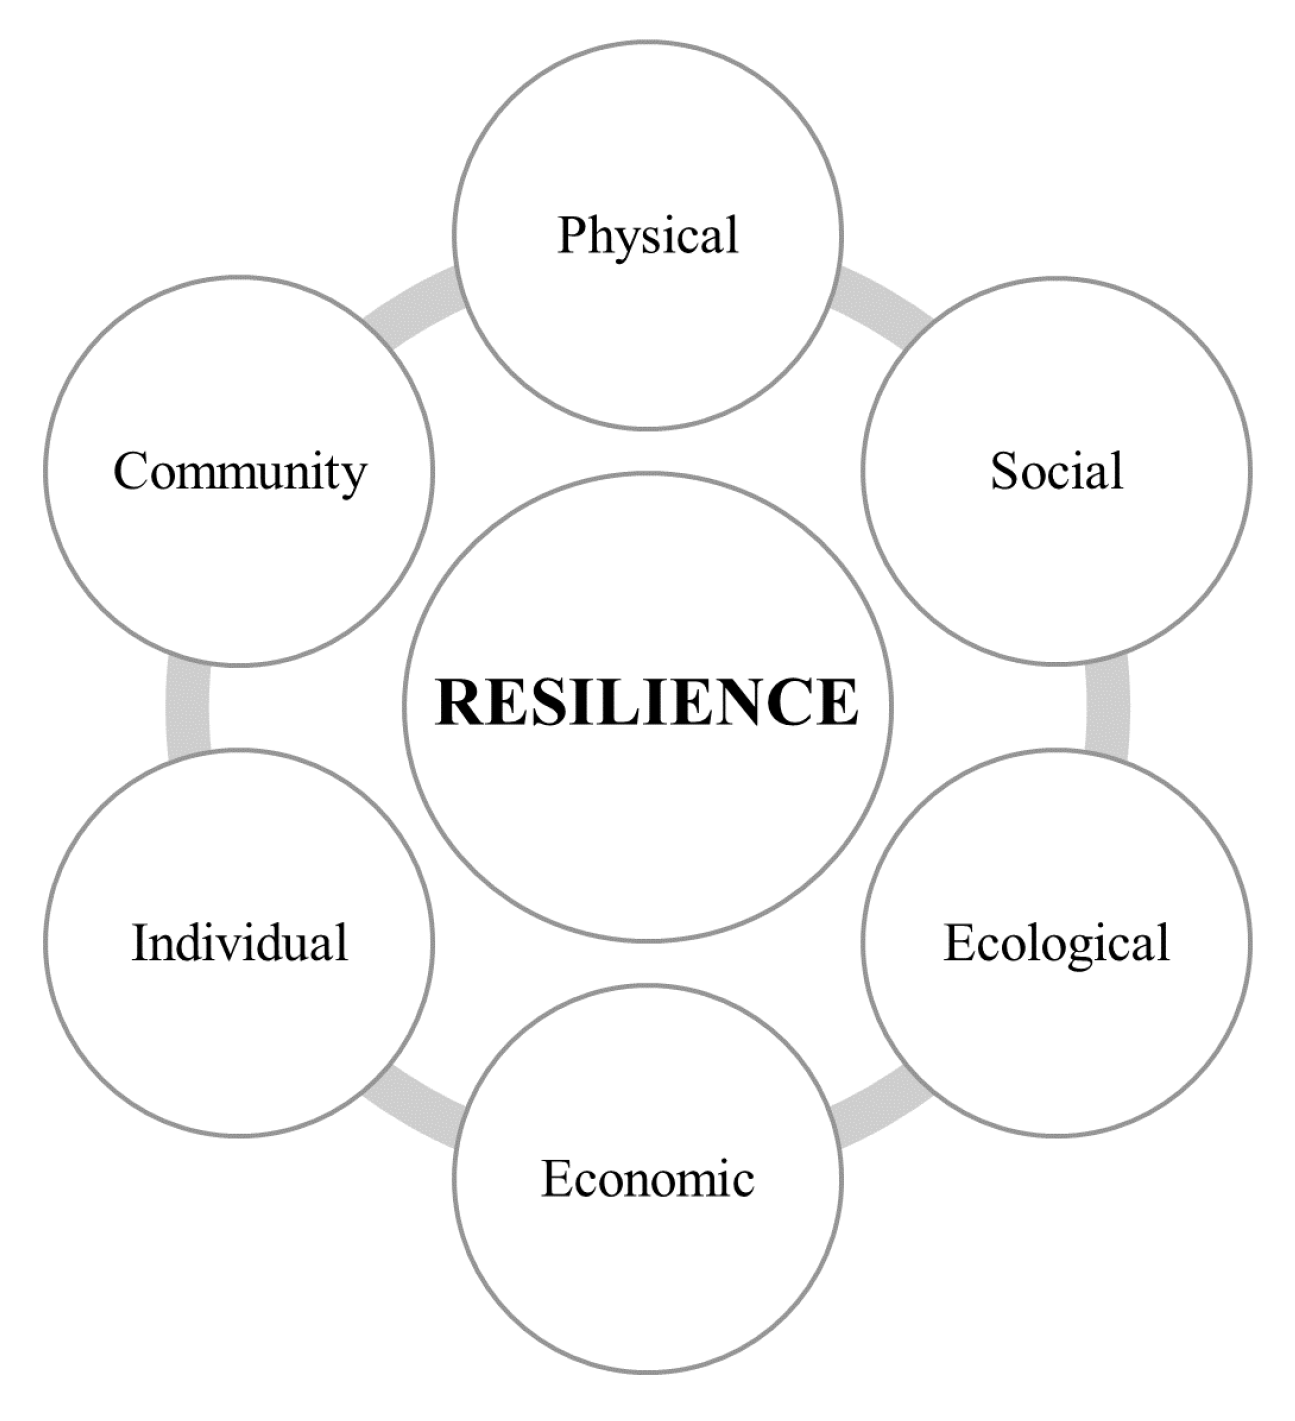
4.1.2. From Five to Seven Components
4.1.3. More than Seven Components
4.2. Determining Community Resilience Properties
5. Measuring Community Resilience
5.1. Qualitative Approaches
5.1.1. Framework Level
5.1.2. Component Level
5.2. Quantitative Approaches
5.3. Hybrid Approaches
6. Visualising Community Resilience
6.1. Geospatial Information Visualisation
6.2. Multidimensional Information Visualisation
6.3. Dashboard
7. Discussion and Conclusions
- The number of components defined in the modelling step is diverse depending on a particular community at a specific time point for certain risks/targets. Nevertheless, we should not define too many components since they can be overlapping and difficult to break down into lower-level elements. Besides, end-users and stakeholders may find it difficult to understand and monitor a large number of components for giving precise actions, especially in the time of adversity.
- Various terminologies are available for modelling community resilience, some of which are, but not limited to, index, dimension, capital, capacity, and domain. The selection of the term highly relies on our practical use. For example, the resilience index, which is usually a combination of indicators, is appropriate for a quantitative assessment. On the other hand, resilience dimension/domain is more descriptive and suitable for qualitative approaches. In addition, resilience capital/capacity well expresses the potential and abilities of a community to achieve something.
- To measure community resilience, we can leverage not only static (e.g., vulnerabilities, hazards, and exposed values) but also dynamic information (e.g., dynamic risk perception extracted by analysing social media data) at different scales. Information collected at the community level regularly tends to be more informal, undocumented, and implicitly understood than higher scales. It is necessary for us first to determine the goals of our community, target potential end-users, and then stick into them before deciding on any particular approaches to measure resilience.
- This paper presented many studies that aimed at visualising correlation, hierarchy, and geospatial information; however, we should pay more attention to understanding and representing temporal information. Temporal information visualisation can capture common patterns and search for specific sequences, such as the dynamic of community resilience value by time. Area chart and polar area diagram are practical and efficient techniques [126] to portray temporal information of community resilience.
Author Contributions
Funding
Conflicts of Interest
References
- Alexander, D.E. Resilience and Disaster Risk Reduction: An Etymological Journey. Nat. Hazards Earth Syst. Sci. 2013, 13, 2707–2716. [Google Scholar] [CrossRef]
- Bodin, P.; Wiman, B. Resilience and Other Stability Concepts in Ecology: Notes on Their Origin, Validity, and Usefulness. ESS Bull. 2004, 2, 33–43. [Google Scholar]
- Gordon, J.E. Structures: Or Why Things Don’t Fall Down; Da Capo Press: Cambridge, MA, USA, 2009. [Google Scholar]
- Adger, W.N. Social and Ecological Resilience: Are They Related? Prog. Hum. Geogr. 2000, 24, 347–364. [Google Scholar] [CrossRef]
- Kofinas, G. Resilience of Human-Rangifer Systems: Frames off Resilience Help to Inform Studies of Human Dimensions of Change and Regional Sustainability. IHDP Update 2003, 2, 6–7. [Google Scholar]
- Waller, M.A. Resilience in Ecosystemic Context: Evolution of the Concept. Am. J. Orthopsychiatry 2001, 71, 290–297. [Google Scholar] [CrossRef] [PubMed]
- Klein, R.J.; Nicholls, R.J.; Thomalla, F. Resilience to Natural Hazards: How Useful Is This Concept? Glob. Environ. Chang. Part B Environ. Hazards 2003, 5, 35–45. [Google Scholar] [CrossRef]
- Longstaff, P.H. Security, Resilience, and Communication in Unpredictable Environments Such as Terrorism, Natural Disasters, and Complex Technology; Center for Information Policy Research, Harvard University: Cambridge, MA, USA, 2005. [Google Scholar]
- Rose, A. Economic Resilience to Natural and Man-Made Disasters: Multidisciplinary Origins and Contextual Dimensions. Environ. Hazards 2007, 7, 383–398. [Google Scholar] [CrossRef]
- Egeland, B.; Carlson, E.; Sroufe, L.A. Resilience as Process. Dev. Psychopathol. 1993, 5, 517–528. [Google Scholar] [CrossRef]
- Butler, L.; Morland, L.; Leskin, G. Psychological Resilience in the Face of Terrorism. In Psychology of Terrorism; Bongar, B., Brown, L.M., Beutler, L.E., Breckenridge, J.N., Zimbardo, P.G., Eds.; Oxford University Press: New York, NY, USA, 2006; pp. 400–417. [Google Scholar]
- Coles, E.; Buckle, P. Developing Community Resilience as a Foundation for Effective Disaster Recovery. Aust. J. Emerg. Manag. 2004, 19, 6–15. [Google Scholar]
- Kimhi, S.; Shamai, M. Community Resilience and the Impact of Stress: Adult Response to Israel’s Withdrawal From Lebanon. J. Community Psychol. 2004, 32, 439–451. [Google Scholar] [CrossRef]
- Hosseini, S.; Barker, K.; Ramirez-Marquez, J.E. A Review of Definitions and Measures of System Resilience. Reliab. Eng. Syst. Saf. 2016, 145, 47–61. [Google Scholar] [CrossRef]
- United Nations Office for Disaster Risk Reduction (UNDRR). Resilience. Available online: https://www.preventionweb.net/terminology/view/501 (accessed on 11 May 2020).
- Nguyen, H.L.; Akerkar, R. Leveraging Big Data Technologies for Community Resilience. In Proceedings of the 2019 Norwegian Conference for Organizations’ Use of Information Technology (NOKOBIT 2019), Narvik, Norway, 25–27 November 2019; pp. 1–2. [Google Scholar]
- Cheer, J.M.; Milano, C.; Novelli, M. Tourism and Community Resilience in the Anthropocene: Accentuating Temporal Overtourism. J. Sustain. Tour. 2019, 27, 554–572. [Google Scholar] [CrossRef]
- Kuhlicke, C. Embracing Community Resilience in Ecosystem Management and Research. In Atlas of Ecosystem Services; Schröter, M., Bonn, A., Klotz, S., Seppelt, R., Baessler, C., Eds.; Springer: Cham, Switzerland, 2019; pp. 17–20. [Google Scholar]
- Mohabat Doost, D.; Buffa, A.; Brunetta, G.; Salata, S.; Mutani, G. Mainstreaming Energetic Resilience by Morphological Assessment in Ordinary Land Use Planning. The Case Study of Moncalieri, Turin (Italy). Sustainability 2020, 12, 4443. [Google Scholar] [CrossRef]
- Masson, T.; Bamberg, S.; Stricker, M.; Heidenreich, A. “We Can Help Ourselves”: Does Community Resilience Buffer Against the Negative Impact of Flooding on Mental Health? Nat. Hazards Earth Syst. Sci. 2019, 19, 2371–2384. [Google Scholar] [CrossRef]
- United Nations International Strategy for Disaster Reduction (UN/ISDR). Indicators of Progress. Guidance on Measuring the Reduction of Disaster Risks and the Implementation of the Hyogo Framework for Action; United Nations International Strategy for Disaster Reduction: Geneva, Switzerland, 2008. [Google Scholar]
- Leite, M.; Ross, H.; Berkes, F. Interactions between individual, household, and fishing community resilience in southeast Brazil. Ecol. Soc. 2019, 24, 2. [Google Scholar] [CrossRef]
- Apostolopoulos, N.; Newbery, R.; Gkartzios, M. Social Enterprise and Community Resilience: Examining a Greek Response to Turbulent Times. J. Rural. Stud. 2019, 70, 215–224. [Google Scholar] [CrossRef]
- Ntontis, E.; Drury, J.; Amlôt, R.; Rubin, G.J.; Williams, R. Community Resilience and Flooding in UK Guidance: A Critical Review of Concepts, Definitions, and Their Implications. J. Contingencies Crisis Manag. 2019, 27, 2–13. [Google Scholar] [CrossRef]
- Sharifi, A. A Critical Review of Selected Tools for Assessing Community Resilience. Ecol. Indic. 2016, 69, 629–647. [Google Scholar] [CrossRef]
- Kameshwar, S.; Cox, D.T.; Barbosa, A.R.; Farokhnia, K.; Park, H.; Alam, M.S.; van de Lindt, J.W. Probabilistic Decision-Support Framework for Community Resilience: Incorporating Multi-Hazards, Infrastructure Interdependencies, and Resilience Goals in a Bayesian Network. Reliab. Eng. Syst. Saf. 2019, 191, 106568. [Google Scholar] [CrossRef]
- De Rolt, C.; Da Silva, D.; García, F. Network Analysis as a Management Tool for Inter-Organizational Projects. Gestão Produção 2017, 24, 266–278. [Google Scholar] [CrossRef]
- Ungar, M. Qualitative Contributions to Resilience Research. Qual. Soc. Work 2003, 2, 85–102. [Google Scholar]
- Somasundaram, D.; Sivayokan, S. Rebuilding Community Resilience in a Post-War Context: Developing Insight and Recommendations—A Qualitative Study in Northern Sri Lanka. Int. J. Ment. Health Syst. 2013, 7, 3. [Google Scholar] [PubMed]
- Bruneau, M.; Chang, S.E.; Eguchi, R.T.; Lee, G.C.; O’Rourke, T.D.; Reinhorn, A.M.; Shinozuka, M.; Tierney, K.; Wallace, W.A.; Von Winterfeldt, D. A Framework to Quantitatively Assess and Enhance the Seismic Resilience of Communities. Earthq. Spectra 2003, 19, 733–752. [Google Scholar]
- Fayyad, U.; Grinstein, G.G.; Wierse, A. Information Visualization in Data Mining and Knowledge Discovery; Morgan Kaufmann: San Francisco, CA, USA, 2001. [Google Scholar]
- Jung, J.E.; Hong, M.; Nguyen, H.L. Serendipity-Based Storification: From Lifelogging to Storytelling. Multimed. Tools Appl. 2017, 76, 10345–10356. [Google Scholar]
- Nguyen, H.L.; Jung, J.E. SocioScope: A Framework for Understanding Internet of Social Knowledge. Future Gener. Comput. Syst. 2018, 83, 358–365. [Google Scholar]
- Rapaport, C.; Hornik-Lurie, T.; Cohen, O.; Lahad, M.; Leykin, D.; Aharonson-Daniel, L. The Relationship Between Community Type and Community Resilience. Int. J. Disaster Risk Reduct. 2018, 31, 470–477. [Google Scholar]
- Campanella, T.J. Urban Resilience and the Recovery of New Orleans. J. Am. Plan. Assoc. 2006, 72, 141–146. [Google Scholar]
- Heijman, W.; Hagelaar, G.; van der Heide, M. Rural Resilience as a New Development Concept. In EU Bioeconomy Economics and Policies: Volume II; Dries, L., Heijman, W., Jongeneel, R., Purnhagen, K., Wesseler, J., Eds.; Palgrave Macmillan: Cham, Switzerland, 2019; pp. 195–211. [Google Scholar]
- Centre for Community Enterprise. The Community Resilience Manual: A Resource for Rural Recovery & Renewal. Available online: https://ccednet-rcdec.ca/en/toolbox/community-resilience-manual-resource-rural-recovery-renewal (accessed on 28 July 2020).
- International Fund for Agricultural Development (IFAD). INSURED—Insurance for Rural Resilience and Economic Development. Available online: https://www.ifad.org/en/web/knowledge/publication/asset/41406104 (accessed on 8 July 2020).
- Schneider, A.H.; Mort, A.; Kindness, P.; Mellish, C.; Reiter, E.; Wilson, P. Using Technology to Enhance Rural Resilience in Pre-Hospital Emergencies. Scott. Geogr. J. 2015, 131, 194–200. [Google Scholar]
- McManus, P.; Walmsley, J.; Argent, N.; Baum, S.; Bourke, L.; Martin, J.; Pritchard, B.; Sorensen, T. Rural Community and Rural Resilience: What Is Important to Farmers in Keeping Their Country Towns Alive? J. Rural. Stud. 2012, 28, 20–29. [Google Scholar]
- Ross, A.; Clay, L.A. Capital Assets and Rural Resilience: An Analysis of Texas Communities Impacted by Hurricane Harvey. J. Nat. Resour. Policy Res. 2018, 8, 154–186. [Google Scholar]
- Jurjonas, M.; Seekamp, E. Rural Coastal Community Resilience: Assessing a Framework in Eastern North Carolina. Ocean Coast. Manag. 2018, 162, 137–150. [Google Scholar] [CrossRef]
- Quaranta, G.; Salvia, R. An Index to Measure Rural Diversity in the Light of Rural Resilience and Rural Development Debate. Eur. Countrys. 2014, 6, 161–178. [Google Scholar] [CrossRef]
- Ristino, L. Surviving Climate Change in America: Toward a Rural Resilience Framework. West. N. Engl. Law Rev. 2019, 41, 521–542. [Google Scholar]
- Food and Agriculture Organization (FAO). The What and How of Rural Development and Resilience. Available online: http://www.fao.org/documents/card/en/c/ca8775en (accessed on 18 May 2020).
- Steiner, A.; Atterton, J. Exploring the Contribution of Rural Enterprises to Local Resilience. J. Rural. Stud. 2015, 40, 30–45. [Google Scholar] [CrossRef]
- Huang, X.; Li, H.; Zhang, X.; Zhang, X. Land Use Policy as an Instrument of Rural Resilience—The Case of Land Withdrawal Mechanism for Rural Homesteads in China. Ecol. Indic. 2018, 87, 47–55. [Google Scholar] [CrossRef]
- Woolvin, M. Family Estates and Rural Resilience. Available online: https://www.sruc.ac.uk/downloads/file/1669/family_estates_and_rural_resilience (accessed on 20 July 2020).
- The Rockefeller Foundation. City Resilience Framework. Available online: https://www.rockefellerfoundation.org/report/city-resilience-framework (accessed on 22 June 2020).
- Labaka, L.; Maraña, P.; Giménez, R.; Hernantes, J. Defining the Roadmap Towards City Resilience. Technol. Forecast. Soc. Chang. 2019, 146, 281–296. [Google Scholar] [CrossRef]
- Simonovic, S.P.; Peck, A. Dynamic Resilience to Climate Change Caused Natural Disasters in Coastal Megacities Quantification Framework. Br. J. Environ. Clim. Chang. 2013, 3, 378–401. [Google Scholar] [CrossRef]
- Moghadas, M.; Asadzadeh, A.; Vafeidis, A.; Fekete, A.; Kötter, T. A Multi-Criteria Approach for Assessing Urban Flood Resilience in Tehran, Iran. Int. J. Disaster Risk Reduct. 2019, 35, 101069. [Google Scholar] [CrossRef]
- Cutter, S.L.; Burton, C.G.; Emrich, C.T. Disaster Resilience Indicators for Benchmarking Baseline Conditions. J. Homel. Secur. Emerg. Manag. 2010, 7, 51. [Google Scholar]
- United Nations Office for Disaster Risk Reduction (UNDRR). Disaster Resilience Scorecard for Cities. Available online: https://www.unisdr.org/campaign/resilientcities/toolkit/article/disaster-resilience-scorecard-for-cities (accessed on 20 July 2020).
- Forrester, J.M.; Kruse, S.; Abeling, T.; Deeming, H.; Fordham, M.; Jülich, S.; Karanci, N.; Kuhlicke, C. Conceptualizing Community Resilience to Natural Hazards—The emBRACE Framework. Nat. Hazards Earth Syst. Sci. 2017, 2321–2333. [Google Scholar]
- Marana, P.; Eden, C.; Eriksson, H.; Grimes, C.; Hernantes, J.; Howick, S.; Labaka, L.; Latinos, V.; Lindner, R.; Majchrzak, T.A.; et al. Towards a Resilience Management Guideline—Cities as a Starting Point for Societal Resilience. Sustain. Cities Soc. 2019, 48, 101531. [Google Scholar] [CrossRef]
- Schlör, H.; Venghaus, S.; Hake, J.F. The FEW-Nexus City Index—Measuring Urban Resilience. Appl. Energy 2018, 210, 382–392. [Google Scholar] [CrossRef]
- Kotzee, I.; Reyers, B. Piloting a Social-Ecological Index for Measuring Flood Resilience: A Composite Index Approach. Ecol. Indic. 2016, 60, 45–53. [Google Scholar] [CrossRef]
- Reiner, M.; McElvaney, L. Foundational Infrastructure Framework for City Resilience. Sustain. Resilient Infrastruct. 2017, 2, 1–7. [Google Scholar] [CrossRef]
- Barkham, R.J.; Brown, K.; Parpa, C.; Breen, C.; Carver, S.; Hooton, C. Resilient Cities: A Grosvenor Research Report. Available online: http://www.alnap.org/resource/19862 (accessed on 17 July 2020).
- Gawler, S.; Tiwari, S. ICLEI ACCCRN PROCESS Building Urban Climate Change Resilience: A Toolkit for Local Governments. Available online: https://www.preventionweb.net/publications/view/43683 (accessed on 18 July 2020).
- Gimenez, R.; Labaka, L.; Hernantes, J. A Maturity Model for the Involvement of Stakeholders in the City Resilience Building Process. Technol. Forecast. Soc. Chang. 2017, 121, 7–16. [Google Scholar] [CrossRef]
- Porębska, A.; Rizzi, P.; Otsuki, S.; Shirotsuki, M. Walkability and Resilience: A Qualitative Approach to Design for Risk Reduction. Sustainability 2019, 11, 2878. [Google Scholar] [CrossRef]
- RESCCUE Project. Resilience to Cope With Climate Change in Urban Areas. Available online: http://www.resccue.eu (accessed on 12 July 2020).
- Jabareen, Y. Planning the Resilient City: Concepts and Strategies for Coping with Climate Change and Environmental Risk. Cities 2013, 31, 220–229. [Google Scholar] [CrossRef]
- Wardekker, A.; Wilk, B.; Brown, V.; Uittenbroek, C.; Mees, H.; Driessen, P.; Wassen, M.; Molenaar, A.; Walda, J.; Runhaar, H. A Diagnostic Tool for Supporting Policymaking on Urban Resilience. Cities 2020, 101, 102691. [Google Scholar] [CrossRef]
- Chavoshy, A.; Hosseini, K.A.; Hosseini, M. Resiliency Cube: A New Approach for Parametric Analysis of Earthquake Resiliency in Urban Road Networks. Int. J. Disaster Resil. Built Environ. 2018, 9, 317–332. [Google Scholar] [CrossRef]
- Carreño, M.L.; Cardona, O.D.; Barbat, A.H. A Disaster Risk Management Performance Index. Nat. Hazards 2007, 41, 1–20. [Google Scholar] [CrossRef]
- Crowe, P.R.; Foley, K.; Collier, M.J. Operationalizing Urban Resilience Through a Framework for Adaptive Co-Management and Design: Five Experiments in Urban Planning Practice and Policy. Environ. Sci. Policy 2016, 62, 112–119. [Google Scholar] [CrossRef]
- Gawler, S.; Tiwari, S. Urban Resilience: A Concept for Co-Creating Cities of the Future. Available online: https://urbact.eu/sites/default/files/resilient_europe_baseline_study.pdf (accessed on 22 July 2020).
- Suárez, M.; Gómez-Baggethun, E.; Benayas, J.; Tilbury, D. Towards an Urban Resilience Index: A Case Study in 50 Spanish Cities. Sustainability 2016, 8, 774. [Google Scholar] [CrossRef]
- Galderisi, A. Urban Resilience: A Framework for Empowering Cities in Face of Heterogeneous Risk Factors. A|Z ITU J. Fac. Archit. 2014, 11, 36–58. [Google Scholar]
- Clark-Ginsberg, A.; McCaul, B.; Bremaud, I.; Caceres, G.; Mpanje, D.; Patel, S.; Patel, R. Practitioner Approaches to Measuring Community Resilience: The Analysis of the Resilience of Communities to Disasters Toolkit. Int. J. Disaster Risk Reduct. 2020, 50, 101714. [Google Scholar] [CrossRef] [PubMed]
- Parsons, M.; Morley, P.; Marshall, G.; Hastings, P.; Glavac, S.; Stayner, R.; McNeill, J.; McGregor, J.; Reeve, I. The Australian Natural Disaster Resilience Index: Conceptual Framework and Indicator Approach. Available online: https://www.bnhcrc.com.au/publications/biblio/bnh-2585 (accessed on 21 July 2020).
- Cutter, S.L.; Ash, K.D.; Emrich, C.T. The Geographies of Community Disaster Resilience. Glob. Environ. Chang. 2014, 29, 65–77. [Google Scholar]
- Bay Localize. Community Resilience Toolkit: A Workshop Guide for Community Resilience Planning. Available online: http://www.baylocalize.org/files/Community_Resilience_Toolkit_v1.0.pdf (accessed on 16 July 2020).
- Chandra, A.; Acosta, J.; Howard, S.; Uscher-Pines, L.; Williams, M.; Yeung, D.; Garnett, J.; Meredith, L.S. Building Community Resilience to Disasters: A Way Forward to Enhance National Health Security; RAND Corporation: Santa Monica, CA, USA, 2011. [Google Scholar]
- Joerin, J.; Shaw, R.; Takeuchi, Y.; Krishnamurthy, R. Assessing Community Resilience to Climate-Related Disasters in Chennai, India. Int. J. Disaster Risk Reduct. 2012, 1, 44–54. [Google Scholar]
- Pfefferbaum, R.L.; Pfefferbaum, B.; Van Horn, R.L.; Klomp, R.W.; Norris, F.H.; Reissman, D.B. The Communities Advancing Resilience Toolkit (CART): An Intervention to Build Community Resilience to Disasters. J. Public Health Manag. Pract. 2013, 19, 250–258. [Google Scholar] [CrossRef]
- Cutter, S.L.; Barnes, L.; Berry, M.; Burton, C.; Evans, E.; Tate, E.; Webb, J. Community and Regional Resilience: Perspectives From Hazards, Disasters, and Emergency Management. Geography 2008, 1, 2301–2306. [Google Scholar]
- United Nations Development Programme (UNDP). Understanding Community Resilience. Available online: https://www.undp.org/content/undp/en/home/librarypage/environment-energy/sustainable_land_management/CoBRA/CoBRA_assessment.html (accessed on 22 May 2020).
- Peacock, W.G.; Brody, S.D.; Seitz, W.A.; Merrell, W.J.; Vedlitz, A.; Zahran, S.; Harriss, R.C.; Stickney, R. Advancing Resilience of Coastal Localities: Developing, Implementing, and Sustaining the Use of Coastal Resilience Indicators: A Final Report. Available online: https://hrrc.arch.tamu.edu/_common/documents/10-02R.pdf (accessed on 21 July 2020).
- Yoon, D.K.; Kang, J.E.; Brody, S.D. A Measurement of Community Disaster Resilience in Korea. J. Environ. Plan. Manag. 2016, 59, 436–460. [Google Scholar] [CrossRef]
- Arbon, P. Developing a Model and Tool to Measure Community Disaster Resilience. Aust. J. Emerg. Manag. 2014, 29, 12–16. [Google Scholar]
- Alshehri, S.A.; Rezgui, Y.; Li, H. Delphi-Based Consensus Study Into a Framework of Community Resilience to Disaster. Nat. Hazards 2015, 75, 2221–2245. [Google Scholar] [CrossRef]
- Alshehri, S.A.; Rezgui, Y.; Li, H. Disaster Community Resilience Assessment Method: A Consensus-Based Delphi and AHP Approach. Nat. Hazards 2015, 78, 395–416. [Google Scholar] [CrossRef]
- Scherzer, S.; Lujala, P.; Rød, J.K. A Community Resilience Index for Norway: An Adaptation of the Baseline Resilience Indicators for Communities (BRIC). Int. J. Disaster Risk Reduct. 2019, 36, 101107. [Google Scholar] [CrossRef]
- White, R.K.; Edwards, W.C.; Farrar, A.; Plodinec, M.J. A Practical Approach to Building Resilience in America’s Communities. Am. Behav. Sci. 2015, 59, 200–219. [Google Scholar] [CrossRef]
- Community and Regional Resilience Institute (CARRI). Building Resilience in America’s Communities: Observations and Implications of the CRS Pilots Report. Available online: http://community.resilienceguild.org/system/files/CRS-Final-Report.pdf (accessed on 14 June 2020).
- Sempier, T.; Swann, D.; Emmer, R.; Sempier, S.; Schneider, M. Coastal Community Resilience Index: A Community Self-Assessment. Available online: http://masgc.org/assets/uploads/publications/662/coastal_community_resilience_index.pdf (accessed on 5 July 2020).
- Cohen, O.; Leykin, D.; Lahad, M.; Goldberg, A.; Aharonson-Daniel, L. The Conjoint Community Resiliency Assessment Measure as a Baseline for Profiling and Predicting Community Resilience for Emergencies. Technol. Forecast. Soc. Chang. 2013, 80, 1732–1741. [Google Scholar] [CrossRef]
- Osman, I.H.; Anouze, A.L.; Irani, Z.; Al-Ayoubi, B.; Lee, H.; Balcı, A.; Medeni, T.D.; Weerakkody, V. COBRA Framework to Evaluate E-Government Services: A Citizen-Centric Perspective. Gov. Inf. Q. 2014, 31, 243–256. [Google Scholar] [CrossRef]
- Cutter, S.L.; Barnes, L.; Berry, M.; Burton, C.; Evans, E.; Tate, E.; Webb, J. A Place-Based Model for Understanding Community Resilience to Natural Disasters. Glob. Environ. Chang. 2008, 18, 598–606. [Google Scholar] [CrossRef]
- Zurich Flood Resilience Alliance (ZFRA). The Flood Resilience Measurement for Communities (FRMC). Available online: https://floodresilience.net/resources/item/the-flood-resilience-measurement-for-communities-frmc (accessed on 29 May 2020).
- International Federation of Red Cross and Red Crescent Societies (IFRC). IFRC Framework for Community Resilience. Available online: https://media.ifrc.org/ifrc/document/ifrc-framework-community-resilience (accessed on 24 May 2020).
- IMPROVER Project. Improved Risk Evaluation and Implementation of Resilience Concepts to Critical Infrastructure. Available online: http://improverproject.eu (accessed on 14 May 2020).
- Jordan, E.; Javernick-Will, A. Indicators of Community Recovery: Content Analysis and Delphi Approach. Nat. Hazards Rev. 2013, 14, 21–28. [Google Scholar] [CrossRef]
- Orencio, P.M.; Fujii, M. A Localized Disaster-Resilience Index to Assess Coastal Communities Based on an Analytic Hierarchy Process (AHP). Int. J. Disaster Risk Reduct. 2013, 3, 62–75. [Google Scholar] [CrossRef]
- Moreno, J.; Lara, A.; Torres, M. Community Resilience in Response to the 2010 Tsunami in Chile: The Survival of a Small-Scale Fishing Community. Int. J. Disaster Risk Reduct. 2019, 33, 376–384. [Google Scholar] [CrossRef]
- Summers, J.K.; Harwell, L.C.; Smith, L.M.; Buck, K.D. Measuring Community Resilience to Natural Hazards: The Natural Hazard Resilience Screening Index (NaHRSI)—Development and Application to the United States. GeoHealth 2018, 2, 372–394. [Google Scholar] [CrossRef] [PubMed]
- Pilquimán-Vera, M.; Cabrera-Campos, G.; Tenorio-Pangui, P. Experiences of Resilience and Mapuche Community Based Tourism in the Pre-Cordilleran Territories of Panguipulli, Southern Chile. Sustainability 2020, 12, 817. [Google Scholar] [CrossRef]
- Cimellaro, G.P.; Renschler, C.; Reinhorn, A.M.; Arendt, L. PEOPLES: A Framework for Evaluating Resilience. J. Struct. Eng. 2016, 142, 04016063. [Google Scholar] [CrossRef]
- POP-ALERT Project. Population Alerting: Linking Emergencies, Resilience and Training. Available online: http://www.eos-eu.com/pop-alert (accessed on 2 July 2020).
- Rabinovich, A.; Kelly, C.; Wilson, G.; Nasseri, M.; Ngondya, I.; Patrick, A.; Blake, W.H.; Mtei, K.; Munishi, L.; Ndakidemi, P. “We Will Change Whether We Want It or Not”: Soil Erosion in Maasai Land as a Social Dilemma and a Challenge to Community Resilience. J. Environ. Psychol. 2019, 66, 101365. [Google Scholar] [CrossRef]
- Rahman, M.S.; Kausel, T. Coastal Community Resilience to Tsunami: A Study on Planning Capacity and Social Capacity, Dichato, Chile. IOSR J. Humanit. Soc. Sci. 2013, 12, 55–63. [Google Scholar] [CrossRef]
- C3 Living Design Project. Resilient Design for a Changing World. Available online: http://c3livingdesign.org/?page_id=5110 (accessed on 7 May 2020).
- Fox-Lent, C.; Bates, M.E.; Linkov, I. A Matrix Approach to Community Resilience Assessment: An Illustrative Case at Rockaway Peninsula. Environ. Syst. Decis. 2015, 35, 209–218. [Google Scholar] [CrossRef]
- The Resilience Index. The Modelling Tool to Measure and Improve Community Resilience to Natural Hazards. Available online: https://theresilienceindex.weebly.com (accessed on 28 May 2020).
- Oktari, R.S.; Shiwaku, K.; Munadi, K.; Shaw, R. A Conceptual Model of a School—Community Collaborative Network in Enhancing Coastal Community Resilience in Banda Aceh, Indonesia. Int. J. Disaster Risk Reduct. 2015, 12, 300–310. [Google Scholar] [CrossRef]
- Sherrieb, K.; Norris, F.H.; Galea, S. Measuring Capacities for Community Resilience. Soc. Indic. Res. 2010, 99, 227–247. [Google Scholar] [CrossRef]
- Kafle, S.K. Measuring Disaster-Resilient Communities: A Case Study of Coastal Communities in Indonesia. J. Bus. Contin. Emerg. Plan. 2012, 5, 316–326. [Google Scholar]
- Prevention Institute. THRIVE: Tool for Health & Resilience In Vulnerable Environments. Available online: https://www.preventioninstitute.org/tools/thrive-tool-health-resilience-vulnerable-environments (accessed on 1 June 2020).
- Uddin, M.S.; Haque, C.E.; Walker, D. Community Resilience to Cyclone and Storm Surge Disasters: Evidence From Coastal Communities of Bangladesh. J. Environ. Manag. 2020, 264, 110457. [Google Scholar] [CrossRef]
- Simon, H.A. How Big Is a Chunk?: By Combining Data From Several Experiments, a Basic Human Memory Unit Can Be Identified and Measured. Science 1974, 183, 482–488. [Google Scholar] [CrossRef] [PubMed]
- Arbon, P.; Steenkamp, M.; Cornell, V.; Cusack, L.; Gebbie, K. Measuring Disaster Resilience in Communities and Households: Pragmatic Tools Developed in Australia. Int. J. Disaster Resil. Built Environ. 2016, 7, 201–215. [Google Scholar]
- Rose, A. Defining and Measuring Economic Resilience to Disasters. Disaster Prev. Manag. 2004, 13, 307–314. [Google Scholar]
- Norris, F.H.; Stevens, S.P.; Pfefferbaum, B.; Wyche, K.F.; Pfefferbaum, R.L. Community Resilience as a Metaphor, Theory, Set of Capacities, and Strategy for Disaster Readiness. Am. J. Community Psychol. 2008, 41, 127–150. [Google Scholar]
- Twigg, J. Characteristics of a Disaster-Resilient Community: A Guidance Note; DFID Disaster Risk Reduction Interagency Coordination Group: London, UK, 2007. [Google Scholar]
- Mahmoud, H.; Chulahwat, A. Spatial and Temporal Quantification of Community Resilience: Gotham City Under Attack. Comput.-Aided Civ. Infrastruct. Eng. 2018, 33, 353–372. [Google Scholar]
- Steiner, A.; Woolvin, M.; Skerratt, S. Measuring Community Resilience: Developing and Applying a ‘Hybrid Evaluation’ Approach. Community Dev. J. 2018, 53, 99–118. [Google Scholar]
- Zhou, J.; He, P.; Qin, Y.; Ren, D. A Selection Model Based on SWOT Analysis for Determining a Suitable Strategy of Prefabrication Implementation in Rural Areas. Sustain. Cities Soc. 2019, 50, 101715. [Google Scholar]
- Jovanović, A.; Auerkari, P. EU Project SmartResilience: The Concept and Its Application on Critical Energy Infrastructure in Finland. In Proceedings of the 2016 International Conference on Life Management and Maintenance for Power Plants (BALTICA X), Helsinki, Finaland, 7–9 June 2016; pp. 16–26. [Google Scholar]
- Jovanović, A.; Klimek, P.; Renn, O.; Schneider, R.; Øien, K.; Brown, J.; DiGennaro, M.; Liu, Y.; Pfau, V.; Jelić, M.; et al. Assessing Resilience of Healthcare Infrastructure Exposed to COVID-19: Emerging Risks, Resilience Indicators, Interdependencies and International Standards. Environ. Syst. Decis. 2020, 40, 252–286. [Google Scholar]
- Prior, T.; Hagmann, J. Measuring Resilience: Methodological and Political Challenges of a Trend Security Concept. J. Risk Res. 2014, 17, 281–298. [Google Scholar]
- Akerkar, R. Processing Big Data for Emergency Management. In Smart Technologies for Emergency Response and Disaster Management; Liu, Z., Ota, K., Eds.; IGI Global: Hershey, PA, USA, 2018; pp. 144–166. [Google Scholar]
- Nguyen, H.L.; Akerkar, R. Emergency Information Visualisation. In Big Data in Emergency Management: Exploitation Techniques for Social and Mobile Data; Akerkar, R., Ed.; Springer Nature: Cham, Switzerland, 2020; pp. 149–183. [Google Scholar]
- Keim, M.E.; Noji, E. Emergent Use of Social Media: A New Age of Opportunity for Disaster Resilience. Am. J. Disaster Med. 2011, 6, 47–54. [Google Scholar]
- Zou, L.; Lam, N.S.; Cai, H.; Qiang, Y. Mining Twitter Data for Improved Understanding of Disaster Resilience. Ann. Am. Assoc. Geogr. 2018, 108, 1422–1441. [Google Scholar] [CrossRef]
- Hoang Long, N.; Jung, J.J. Privacy-Aware Framework for Matching Online Social Identities in Multiple Social Networking Services. Cybern. Syst. 2015, 46, 69–83. [Google Scholar] [CrossRef]
- Taylor, M.; Wells, G.; Howell, G.; Raphael, B. The Role of Social Media as Psychological First Aid as a Support to Community Resilience Building. Aust. J. Emerg. Manag. 2012, 27, 20. [Google Scholar]
- Dufty, N. Using Social Media to Build Community Disaster Resilience. Aust. J. Emerg. Manag. 2012, 27, 40–45. [Google Scholar]
- Zhang, Y.; Burton, H.V.; Sun, H.; Shokrabadi, M. A Machine Learning Framework for Assessing Post-Earthquake Structural Safety. Struct. Saf. 2018, 72, 1–16. [Google Scholar] [CrossRef]


| Level | Study/Project/Tool | Focus |
|---|---|---|
| Rural | Community Resilience Manual [37] | Community resources |
| Insurance for Rural Resilience and Economic Development | Climate risks | |
| (INSURED) [38] | ||
| MIME Project [39] | Pre-hospital emergencies | |
| McManus et al. [40] | Local economy, job, and environment | |
| Ross and Clay [41] | Capital assets | |
| Rural Coastal Community Resilience (RCCR) Framework [42] | Sea level rise and saltwater intrusion | |
| Rural Diversity Index (RDI) [43] | Rural diversity | |
| Rural Resilience Framework [44] | Climate change | |
| Rural Social Protection [45] | Risks and threats | |
| Steiner and Atterton [46] | Private sector enterprises | |
| Withdrawal Mechanism for Rural Homesteads (WMRH) [47] | Land use policies | |
| Woolvin [48] | Family estates | |
| Urban | City Resilience Framework [49] | Stresses accumulate and sudden shocks |
| City Resilience Roadmap [50] | Acute shocks and long-term stresses | |
| Coastal Megacity Resilience Simulator (CMRS) [51] | Climate change | |
| Disaster Resilience Index (DRI) [52] | Urban flood | |
| Disaster Resilience Indicators [53] | Disasters | |
| Disaster Resilience Scorecard for Cities [54] | Acute shocks (natural and man-made) | |
| emBRACE Framework [55] | Disasters | |
| European Resilience Management Guideline (ERMG) [56] | Climate change and social dynamics | |
| FEW-Nexus City Index [57] | Food, energy, and water | |
| Flood Resilience Index (FRI) [58] | Flood | |
| Foundational Infrastructure Framework (FIF) [59] | Infrastructure sectors | |
| Grosvenor Research [60] | Shocks and adverse events | |
| ICLEI ACCCRN Process (IAP) [61] | Climate risks | |
| Maturity Model (MM) [62] | City stakeholders | |
| Porębska et al. [63] | Evacuation route planning and design | |
| RESCCUE Project [64] | Multihazard threats and climate change | |
| Resilience City Planning Framework (RCPF) [65] | Climate change and environmental risk | |
| Resilience Diagnostic Tool [66] | Urban planning | |
| Resiliency Cube [67] | Transportation network in earthquake | |
| Risk Management Index (RMI) [68] | Urban disasters | |
| TURaS Project [69] | Urban planning and policy | |
| Urban Resilience Concept Note [70] | Shocks and stresses | |
| Urban Resilience Index [71] | Urban social-ecological systems | |
| Urban Resilience Framework [72] | Heterogeneous risk factors | |
| Community | Analysis of Resilience of Communities to Disasters (ARC-D) Toolkit [73] | Disasters |
| Australian Natural Disaster Resilience Index [74] | Hot-spots of high or low disasters | |
| Baseline Resilience Indicators for Communities (BRIC) [75] | Disasters | |
| Bay Localize Community Resilience Toolkit [76] | Community assets | |
| Chandra et al. [77] | National health security | |
| Climate-related Disaster Community Resilience Framework | Climate-related disasters | |
| (CDCRF) [78] | ||
| Community Advancing Resilience Toolkit (CART) [79] | All-hazards environment | |
| Community And Regional Resilience Initiative (CARRI) Research | Natural and human-made disasters | |
| Report [80] | ||
| Community Based Resilience Analysis (CoBRA) [81] | Crises and disasters | |
| Community Disaster Resilience Index (CDRI) [82,83] | Disasters | |
| Community Disaster Resilience Toolkit [84] | Disasters | |
| Community Resilience Framework (CRDSA) [85,86] | Disasters | |
| Community Resilience Index [87] | Natural hazards | |
| Community Resilience System (CRS) [88,89] | Man-made and natural disasters | |
| Community Self-Assessment [90] | Disasters | |
| Conjoint Community Resilience Assessment Measurement | Emergencies | |
| (CCRAM) [91] | ||
| Costs, Opportunities, Benefits, and Risks Analysis (COBRA) | E-government services | |
| Framework [92] | ||
| Disaster Resilience of Place (DROP) Model [93] | Natural disasters | |
| Flood Resilience Measurement for Communities (FRMC) [94] | Flood | |
| Framework for Community Resilience (FCR) [95] | Disasters, crises, shocks and stresses | |
| IMPROVER Project [96] | Critical infrastructure | |
| Jordan and Javernick-Will [97] | Disasters | |
| Localized Disaster-Resilience Index [98] | Disasters | |
| Moreno et al. [99] | Tsunami | |
| Natural Hazard Resilience Screening Index (NaHRSI) [100] | Natural hazard events | |
| Pilquimán-Vera et al. [101] | Community based tourism | |
| PEOPLES Resilience Framework [102] | Extreme events or disasters | |
| POP-ALERT Project [103] | Crises and cross-border disasters | |
| Rabinovich et al. [104] | Soil erosion | |
| Rahman and Kausel [105] | Tsunami | |
| RELi Resilience Action List & Credit Catalog [106] | Next generation community | |
| Resilience Matrix (RM) [107] | Disruptive events in coastal areas | |
| Resilience Modelling Tool [108] | Natural hazards | |
| School-Community Collaborative Network (SCCN) Conceptual | Disaster education | |
| Model [109] | ||
| Sherrieb et al. [110] | Economic development and social capital | |
| Shesh Kanta Kafle [111] | Disasters | |
| Tool for Health and Resilience in Vulnerable Environments | Health, safety, and health equity | |
| (THRIVE) [112] | ||
| Uddin et al. [113] | Cyclone and storm surge disasters |
| Number of Components | Focus | Year | Reference |
|---|---|---|---|
| Three components | Acute shocks (natural and man-made) | 2017 | [54] |
| Climate-related disasters | 2012 | [78] | |
| Community based tourism | 2020 | [101] | |
| Disasters | 2017 | [55] | |
| Economic development and social capital | 2010 | [110] | |
| Food, energy, and water | 2018 | [57] | |
| Health, safety, and health equity | 2004 | [112] | |
| Local economy, job, and environment | 2012 | [40] | |
| Private sector enterprises | 2015 | [46] | |
| Risks and threats | 2020 | [45] | |
| Urban planning and policy | 2016 | [69] | |
| Four components | Acute shocks and long-term stresses | 2019 | [50] |
| All-hazards environment | 2013 | [79] | |
| Community resources | 2000 | [37] | |
| Disasters | 2010 | [82] | |
| 2013 | [97] | ||
| 2014 | [84] | ||
| Family estates | 2013 | [48] | |
| Land use policies | 2018 | [47] | |
| Man-made and natural disasters | 2014 | [88] | |
| Natural hazards | 2015 | [108] | |
| Next generation community | 2014 | [106] | |
| Rural diversity | 2014 | [43] | |
| Stresses accumulate and sudden shocks | 2015 | [49] | |
| Five components | Climate change | 2013 | [51] |
| Disasters | 2010 | [53] | |
| Flood | 2016 | [58] | |
| 2019 | [94] | ||
| Sea level rise and saltwater intrusion | 2017 | [42] | |
| Soil erosion | 2019 | [104] | |
| Six components | Community assets | 2009 | [76] |
| Critical infrastructure | 2018 | [96] | |
| Disasters | 2014 | [75] | |
| 2015 | [85,86] | ||
| 2016 | [83] | ||
| Disasters, crises, shocks and stresses | 2014 | [95] | |
| Emergencies | 2013 | [91] | |
| Natural disasters | 2008 | [93] | |
| Urban flood | 2019 | [52] | |
| Seven components | Disasters | 2010 | [90] |
| 2013 | [98] | ||
| Extreme events or disasters | 2016 | [102] | |
| More than seven components | Cyclone and storm surge disasters | 2020 | [113] |
| Disasters | 2020 | [73] | |
| Hot-spots of high or low disasters | 2016 | [74] | |
| Infrastructure sectors | 2017 | [59] | |
| Man-made and natural disasters | 2013 | [89] | |
| National health security | 2011 | [77] | |
| Shocks and adverse events | 2014 | [60] | |
| Tsunami | 2013 | [105] |
| Property | Description |
|---|---|
| Adaptation | The ability of a community in overcoming regular evaluation and alteration to adjust,update, and acclimate to resilience standards over time |
| Attribute | The concept of community resilience should be comprehended in not only as an internalresident but also as a general entity |
| Continuity | The requirement of having inherent, dynamic, and persistent characteristic to guaranteecommunity resilience |
| Dependency | The interaction and integration with a wide range of related models and frameworks tobuild community resilience |
| Dynamic | The effective utilisation and enhancement of resources to repair, reconstruct, and recoverfrom surprising events quickly |
| Equity | The quality of being fair and impartial for all community members towards basic humanneeds, no matter who they are, regardless of origin, race, gender, or whatever |
| Orientation | The utilisations of predicate assumptions to guarantee that the model will follow defineddirections strictly |
| Ownership | The acts, states, and rights of communities in owning resources collectively and securely |
| Rapidity | The capability of a community to prepare, respond, adapt, and recover from disruptiveevents promptly |
| Redundancy | The diversity in giving solutions or strategies in a particular situation |
| Resourcefulness | The latent qualities or potentiality to mobilise in menacing circumstances |
| Robustness | The capacity of a community in withstanding the actions or effects of adverse shocks |
| Simplicity | The ability to transform important and complicated factors into a simple model thatallow measuring community resilience easily |
| Sustainability | The potentiality to maintain resources good enough for producing in the future |
| Trajectory | The accomplishment of positive outcomes that is relative to “after” state of entities |
| Quality | The crucial goods and services used to evaluate whether a community achieves goodstandards, some of which are purified air, healthy food, and safe transportation |
| Approach | Focus | Outcome | Reference |
|---|---|---|---|
| Qualitative | All-hazards environment | 4-stage process for identifying issues, solving problems, and planning activities | [79] |
| Climate risks | 6-phase process (4 phases for preparation and 2 phases for implementation and monitoring) | [61] | |
| Community based tourism | Relationship between tourism experiences with community resilience processes | [101] | |
| Evacuation route planning and design | Limits of punctual treatments and impacts on dimensions of urban walkability | [63] | |
| Man-made and natural disasters | 6-stage process with detailed guidance, tools, and resources identified for each module | [89] | |
| National health security | Roadmap used as a starting point to develop local community resilience strategy | [77] | |
| Soil erosion | Impacts on soil erosion based on social, psychological, and cultural parameters | [104] | |
| Stresses accumulate and sudden shocks | 4 categories, 12 goals, 52 indicators, and 156 variables for city resilience | [49] | |
| Tsunami | Strength and weakness of tsunami preparedness based on eight resilience elements | [105] | |
| Analysis of resilience capacities and resources activated to cope with disaster | [99] | ||
| Quantitative | Acute shocks (natural and man-made) | Resilience scores for preliminary (from 0 to 30) and detailed assessment (from 0 to 180) | [54] |
| Climate change | Space time dynamic resilience measure (ST-DRM) | [51] | |
| Disasters | Disaster resilience score ranging between 22 and 110 | [84] | |
| Community disaster resilience index for 4 capital indices across 4 management phases | [82] | ||
| A single, scalar measure combined from six multidimensional components | [83] | ||
| Resilience index based on the percentage of check marks and the number of Yes answers | [90] | ||
| Disaster-resilience index score based on process- and outcome-indicator scores | [98] | ||
| Economic development and social capital | Composite scores of economic development, social capital and community resilience | [110] | |
| Health, safety, and health equity | Top three priorities to increase health and safety and reduce health inequities | [112] | |
| Natural hazards | Composite resilience index ranging between 0 and 100 | [108] | |
| Rural diversity | Rural diversity index ranging between 0 and 1 | [43] | |
| Shocks and adverse events | Overall rank along with vulnerability, adaptive capacity, and resilience scores | [60] | |
| Hybrid | Community resources | Community portrait involving community perceptions, attitudes, feelings, and others | [37] |
| Community assets | Toolkit for specific resources and action ideas in six key sectors | [76] | |
| Disasters | 19 indicators of recovery along with rating of the importance of each indicator | [97] | |
| Resilience framework involving 7 to 14 criteria in each of six defined dimensions | [85] | ||
| Disaster education | Conceptual model for collaborative network and knowledge management | [109] | |
| Disruptive events in coastal areas | Resilience Matrix (RM) framework with performance score for each cell ranging from 0 to 1 | [107] | |
| Land use policies | Rural resilience assessment index ranging between 0 and 1 | [47] | |
| Natural and human-made disasters | Resilience baseline and its schematic representation based on GIS methodology | [80] | |
| Urban disasters | Risk management index ranging between 0 and 100 | [68] |
| Reference | Step/Stage/Phase | Description |
|---|---|---|
| [61] | 1. Engagement | Determine key stakeholders, set up coordination and reporting structures,and conduct a preliminary measurement of the city’s progress to tackleclimate change |
| 2. Climate research and impacts assessment | Analyse climate change data, build a projection of likely climate changes,and evaluate the impact on critical urban systems and resultant risks | |
| 3. Vulnerabilities assessment | Produce maps of high priority climate risks, measure the impact on themost vulnerable groups of people, and inspect the adaptive capability | |
| 4. Resilience strategy | Construct a list of feasible adaptation activities, prioritise interventions,link to existing city plans, and aggregate all the essential information | |
| 5. Implementation | Determine funding options, distribute responsibilities and resources, andput the initiatives into effect | |
| 6. Monitoring and review | Set up performance indicators and reporting systems, monitor and reportagainst defined indicators, and initiate review phase | |
| [77] | 1. Wellness and access | Promote pre- and post-incident population health and guarantee access tosocial services, high-quality and behavioural health |
| 2. Education | Make certain that information is available to public concerning risks,preparedness, and resources before, during, and after a disaster | |
| 3. Engagement and self-sufficiency | Encourage participatory decision-making in planning, response andrecovery activities and support individuals/communities in assumingresponsibility for their preparedness | |
| 4. Partnership | Grow evolving, reliable, and strong partnerships within and betweengovernment and nongovernmental organisations | |
| 5. Quality and efficiency | Collect, analyse, and make use of data to build community resilience andleverage resources for multiple use and maximal helpfulness | |
| [79] | 1. Generation | Create an initial community profile through local demographics, CARTsurvey data, and key informant interviews |
| 2. Refinement | Determine and analyse assets and needs through CART communityconversations, infrastructure mapping, ecological mapping of localrelationships, stakeholder analysis, and other group processes | |
| 3. Development | Build a strategic plan to construct targets and objectives by interacting ingroups with the involvement of formal and informal community leaders | |
| 4. Implementation | Adopt and implement the strategic plan by spreading the plan amongcommunity members, organisations, and leaders | |
| [89] | 1. Engagement | Seek for resilience champions, organise them into a logical and consistentleadership team, and build well-established and trusted communitynetworks |
| 2. Assessment | Derive self awareness by comprehending its interdependencies andvulnerabilities, categorise its accessible resources, and discover whichresources are at risk | |
| 3. Visioning | Give a summary of the importance of possessing a resilience-focusedvision and explain how community can include resilience into an existingvision or generate a new vision | |
| 4. Planning | Link present state of community and determine a series of activities thatare particular, assessable, and supportive of improved daily communityfunction | |
| 5. Implementing | Ensure an organisational home for community resilience program eitherthrough establishing a new organisational entity or by integrating intoexisting public or private organisations | |
| 6. Monitoring and maintenance | Monitor and assess the progress of individual projects and entirecommunity resilience program, making adjustments and alterations asrequired |
| Type of Visualisation | Technique | Focus | Reference |
|---|---|---|---|
| Geospatial information | Density map | Disasters | [53,75,83] |
| Economic development and social capital | [110] | ||
| Flood | [58] | ||
| Hot-spots of high or low disasters | [74] | ||
| Natural hazards | [87,108] | ||
| Urban social-ecological systems | [71] | ||
| Multidimensional information | Stacked bar chart | Crises and disasters | [81] |
| Shocks and adverse events | [60] | ||
| Spider chart | Crises and disasters | [81] | |
| Disasters | [73] | ||
| Soil erosion | [104] | ||
| Tsunami | [105] | ||
| Urban planning | [66] | ||
| Radial stacked bar chart | Natural hazard events | [100] | |
| Stresses accumulate and sudden shocks | [49] | ||
| Urban planning and policy | [69] | ||
| Hypercube | Cyclone and storm surge disasters | [113] | |
| Transportation network in earthquake | [67] | ||
| Others | Bar chart | Food, energy, and water | [57] |
| Urban flood | [52] |
© 2020 by the authors. Licensee MDPI, Basel, Switzerland. This article is an open access article distributed under the terms and conditions of the Creative Commons Attribution (CC BY) license (http://creativecommons.org/licenses/by/4.0/).
Share and Cite
Nguyen, H.L.; Akerkar, R. Modelling, Measuring, and Visualising Community Resilience: A Systematic Review. Sustainability 2020, 12, 7896. https://doi.org/10.3390/su12197896
Nguyen HL, Akerkar R. Modelling, Measuring, and Visualising Community Resilience: A Systematic Review. Sustainability. 2020; 12(19):7896. https://doi.org/10.3390/su12197896
Chicago/Turabian StyleNguyen, Hoang Long, and Rajendra Akerkar. 2020. "Modelling, Measuring, and Visualising Community Resilience: A Systematic Review" Sustainability 12, no. 19: 7896. https://doi.org/10.3390/su12197896
APA StyleNguyen, H. L., & Akerkar, R. (2020). Modelling, Measuring, and Visualising Community Resilience: A Systematic Review. Sustainability, 12(19), 7896. https://doi.org/10.3390/su12197896