Article

Factors Influencing the Tourist’s Future Intentions in Small-Scale Sports Events

by
José Miguel Vegara-Ferri
1,
José María López-Gullón
1,
Irena Valantine
2,
Arturo Díaz Suárez
1 and
Salvador Angosto
1,*
1
Department of Physical Activity and Sport, Faculty of Sport Sciences, University of Murcia, 30720 Santiago de la Ribera, Spain
2
Department of Sport and Tourism Management, Lithuanian Sports University, LT- 44221 Kaunas, Lithuania
*
Author to whom correspondence should be addressed.
Sustainability 2020, 12(19), 8103; https://doi.org/10.3390/su12198103
Submission received: 6 September 2020 / Revised: 23 September 2020 / Accepted: 26 September 2020 / Published: 1 October 2020
(This article belongs to the Special Issue Strategic Planning of Sports Systems)

Abstract

:
Small-scale sports events are a good strategy for communities seeking to attract visitors and are one of the major attractions of sustainable sports tourism. The aim of this study to determine which factors influence the future intentions of the tourist involved in small-scale sports events. The sample was composed of 236 subjects who participated in a half-marathon in Spain. The results of the Exploratory Factor Analysis (EFA) and Confirmatory Factor Analysis (CFA) provide support for the applicability of the tourists’ perception questionnaire in the context of sports events. The results of both validity (convergent and discriminant) and reliability (internal consistency) analyses were satisfactory. The results indicated that this scale had 18 items distributed in six factors (communication, staff, electronic wordofmouth, destination image, satisfaction and future intentions). The proposal model revealed that satisfaction is a mediated factor between staff and destination image with future intentions of repeating the event. Electronic word of mouth and satisfaction were influencing factors that predicted the tourists’ future intentions. This finding suggests that this questionnaire can be a useful tool in measuring tourist perception on a small-scale sports events scale, allowing a better understanding of the reasons that lead a tourist to select a certain destination and sports event.

1. Introduction

In recent years, the number of trips to attend leisure and entertainment events, especially sports events, has increased. Tourism has evolved constantly to become a mass phenomenon, being one of the largest sectors worldwide [1], as it has a great impact on the economy of different countries. Attendance at sports events is one of the main options for occupying the population’s free time and leisure [2]. An increasing percentage of the population takes advantage of sports to plan two or three short holidays instead of long sun and beach holidays [3].
The World Travel and Tourism Council (WTTC) estimated, in 2017, a total of 1326 million tourists who made at least one trip around the world. Spain is a country where tourism represents 14.3% of the GDP [4], being the second country with the highest number of tourist arrivals in 2018, with 83.7 million visitors [5]. Sports events are associated with the tourism-sports binomial, due to the high number of people who tend to travel outside their usual residence to attend a sports event and, in addition, be able to perform other activities such as cultural visits, going to restaurants, or other leisure activities in the municipality [6].
The sports events sector had a turnover of around €4 billion in 2019, representing an increase of 30.6% compared to five years ago, and the number of participants in foot races increased by 20% from 2014 to 2018 [7]. The National Institute of Statistics [8], through the tourist expenditure survey (EGATUR), states that in 2019 in Spain the average daily expenditure of the national sports tourist was 88.96 euros with an average trip duration of 2.86 days, while the international sports tourist who comes to Spain has a daily expenditure of 155 euros with an average trip duration of 6.11 days. Therefore, both public administrations and private enterprises organising events should consider these data to organise sports events, carrying out impact evaluation studies that allow more effectively knowing the aspects that are more attractive to tourists in order to improve and make the events better, and attract a greater number of people through the development of appropriate strategies.
Sports tourism, taking advantage of these changes, in trends has become one of the most demanded alternatives during the 21st century [9], growing rapidly throughout the world [10,11]. Two types of behaviour can be identified in sports tourists: on the one hand, tourists who engage in active sports tourism, going to participate in an activity or event; on the other hand, those tourists who engage in passive sports tourism, attending as simple spectators [12,13]. Therefore, when analysing sports tourism it is important to know the main motivation for the trip, since two people attending the same activity may have different objectives. Sports events are a sporting activity that encompasses these two types of behaviour.
Delpy [14] defined sports events as “those sports activities or competitions capable of attracting a considerable number of visitors for the purpose of participating or attending as spectators” (p. 8), with the sports activity itself being the main motivation for tourists to travel [15]. Wilson [16], based on the classification of sporting events proposed by Gratton, Dobson, and Shibli [17] includes small-scale events, defining them as those events in which the number of participants usually outnumbers spectators, are held recurrently each year, do not receive much attention from the national media and have a limited economic activity. The experience at a sports event can vary between active and passive sports tourists because of the difference in the type of event, the venue or the people involved [18]. Active sports tourists are those who are associated with sports participation, mainly during the holiday period, such as sports events or outdoor sports activities, while passive sports tourists refer to the presence of the individual as a spectator at sports events or leagues [19].
Based on this type of experience, Hallman, Kaplanidou, and Breuer [20] found differences between active and passive sports tourists, also according to the type of destination. These authors observed that active sports tourists focus more on the relationship of organisational, emotional and physical images. In contrast, passive sports tourists centre more on relationships associated with social and historical images. In this way, sports events are an effective marketing resource to make a community visible, being able to enhance the tourist attractiveness and its image, and thus contribute to stimulating the economic growth of the host community [16,21]. Public and private organisations have realised that sports tourism is a potential market in continuous growth, so the organisation of these sports events is being used by the tourism sector [22].
Despite the tourism potential of sports events, the viability and sustainability of mega sports events such as the Olympic Games have been questioned due to the high economic and material resources or the expense of building facilities that are not subsequently used [23]. However, sports tourism at small-scale events makes it possible to generate more stable flows of visitors who come to the event every year, adapting to the community, usually using an existing infrastructure and not requiring a large public investment [24].
Sustainable tourism can be understood as covering the different forms of tourism that are compatible with and contribute to sustainable development [25]. Tourism is present in the goals of sustainable development objectives No. 8 “Decent work and economic growth”, No. 12 “Responsible consumption and production”, and No. 14 “Life bellow water” [26]. Gibson et al. state that a portfolio in a small tourism event is compatible and can contribute to the economic, social and environmental pillars of sustainable tourism [23]. Research on sustainable tourism has generated a great deal of attention in recent years, with the emergence of numerous studies that attempt to look at the most important aspects of sports events for sustainability [27].
Given the potential of small-scale sports event tourism and the benefits it can bring to the host city, it is necessary to evaluate the impact that these sports events have on the venue of the event [28]. Different instruments can be found in the current literature that try to measure different dimensions of sports event tourism [29,30,31,32,33,34,35]. However, when analysing these instruments, most of them are ah-hoc questionnaires, designed for the specific event, and they focus on measuring only two or three dimensions, and no complete questionnaire can be found that evaluates sports tourism in Spanish. This study contributes to the literature on the understanding of sports tourist behaviour, which is relevant due to the evolution of the business of sports events and trends in Spain that lead to a significant increase in the number of events and participation. Therefore, the aim of this study is to determine which factors influence the future intentions of the tourist involved in small-scale sports events.

1.1. Literature Review

Different authors propose theories that try to explain the behaviour of the sports tourist [36,37,38,39]. The Theory of Planned Behaviour (TPB) is a theoretical model proposed by Ajzen [40] derived from the Theory of Reasoned Action (TRA) within the field of social psychology [41]. The TPB suggests that people act according to their intentions and perceptions of control over their behaviour [42]. The TPB considers volitional dimensions as non-volitional to explain the decision-making process and individuals’ own behaviour [43]. Ajzen [41] bases the volitional aspect on concepts such as beliefs, attitudes or norms, while the non-volitional aspects focus on the control of perceived behaviour. The TPB has been successfully and effectively applied in the hospitality and tourism field [42,44,45].
Another theory is the Stimulus-Organism-Response (S-O-R) Model set out by Mehrabian and Russell [39]. These authors propose that the sensory variables of the environment, the level of uncertainty generated in the environment and the differences that exist between individuals in their emotional experience are all aspects that influence emotional responses to the environment itself. The S-O-R model is based on the exposure of individuals to an objective, social or psychological stimulus, “S”, creating a cognitive or emotional state within individuals, “O”, and driving them to seek or avoid certain experiences, “R” [39]. Viera [46] argues that the S-O-R paradigm attempts to explain and present evidence on how environmental signals such as music, crowding and lighting, among others, affect individuals’ internal states and their external responses. In the case of this study, the perceived quality of the event or the destination image are the stimuli that motivate the individual to participate in the event, the participant’s satisfaction with the quality of the event, and the destination image refers to the organism, and the organism itself will mediate the effect of the stimuli on the individual’s response to his or her behavioural intention to return to the event or location. This theory has been previously applied in the sporting context both in sporting events and in models related to the quality of service in outdoor sporting events [47,48].

1.1.1. Perceived Quality

Individuals use their previous experiences to compare how well the organisation of the sports event meets their needs [49,50,51]. The quality of a sports event is constituted by the personal reactions and feelings that tourists perceive when participating in a sports event [31]. Grönroos [52] defines perceived service quality (PSQ) as “the result of a comparison between the perceived service and the expected service, where the client compares his expectations with his perception of the service received” (p. 38). Perceived quality is the customer’s impression of a service provider and its services and reflects the general attitude towards the company [53,54].
From the tourist’s point of view, communication (COM) and staff relations (STF) are key elements to be taken into account in any sports and tourism service [10,32,55,56,57]. Communication is an essential aspect of the event’s strategic plan for the promotion and dissemination of the sports event in order to reach a wide range of stakeholders and attract the public [56,58,59,60,61]. The staff, formed by the organisation’s employees and volunteers, is also an essential aspect when developing any service [49], so much so that human capital plays a major role in the future decision to repeat the experience and achieve success for the organisation [10,62]. Perceived quality is a factor that significantly influences consumer opinion [63], satisfaction [64,65] and the future intentions of sports tourists [10,57,66,67].
Hypothesis 1 (H1).
The staff factor has a positive and significant influence on Communication.
Hypothesis 2 (H2).
Staff has a positive and significant influence on electronic Worth of Mouth.
Hypothesis 3 (H3).
Staff has a positive and significant influence on the Destination Image.
Hypothesis 4 (H4).
Staff has a positive and significant influence on Satisfaction.
Hypothesis 5 (H5).
Communication has a positive and significant influence on electronic Worth of Mouth.
Hypothesis 6 (H6).
Communication has a positive and significant influence on the Destination Image.
Hypothesis 7 (H7).
Communication has a positive and significant influence on Satisfaction.

1.1.2. Electronic Word of Mouth

With the development of new technologies, new forms of online communication have appeared, where tourists share opinions and experiences through chats, blogs, social networks (SNS), even specialised forums. Therefore, the tourism industry is strongly affected by the well-known electronic WOM (eWOM) generated by the Internet and the SNS [68]. eWOM [69] can be defined as “any positive or negative opinion made by current, potential or past consumers about a product or a company, which is accessible to a multitude of people and organisations through the Internet” (p. 39). WOM plays a very important role in the daily life of any person, especially in the tourism industry [70].
Some authors consider eWOM as the main way by which tourists obtain information about the quality of products and services in their travels [71], being a source of profitability for the organisers of sports events to share the positive word of mouth of the destination and the event. Various studies have found evidence that eWOM is an influential factor in decisionmaking regarding the choice of a destination [72,73,74] and in the tourist’s behaviour or attitudes [30,75], and is also related to the destination image [76] and future intentions [30,77].
Hypothesis 8 (H8).
eWOM has a positive and significant influence on Destination Image.
Hypothesis 9 (H9).
eWOM has a positive and significant influence on Satisfaction.
Hypothesis 10 (H10).
eWOM has a positive and significant influence on Future Intentions.

1.1.3. Destination Image

Destination image (DIM) is considered one of the factors that can influence tourists’ decisions to choose a holiday option [78,79,80]. Crompton [81] (p. 18) defines DIM as “the sum of beliefs, ideas and impressions a person has of a destination”. DIM can also be considered to be a mental representation of a destination [82,83]. The image of a tourist destination is a subjective concept, as it is conceived as an internalisation of perceptions [84] that can change even depending on the popularity of sport in the country [85]. Macinnis and Price [86] highlight the importance of DIM and its link to planning and management, even before the visit, with previous image. Sports events have a great impact on DIM, being able to create a favourable opinion on the place and event [87,88,89]. DIM has been studied by several authors as an indicator of future behavioural intentions in sports events [32,57,79,80,90], winter sports destinations [91], and tourists visiting information centers or sun and beach tourism regions [76,92,93].
Hypothesis 11 (H11).
Destination Image has a positive and significant influence on Satisfaction.

1.1.4. Satisfaction

Satisfaction (SAT) is a construct that is formed based on the individual’s assessment of the characteristics and expectations of the event [94]. The importance of a sports tourist’s satisfaction resides in the creation of a connection that causes him/her to return to the destination. Customer satisfaction is recognised as a key construct for managers and researchers interested in service relationships [49].
Satisfaction can be defined as “the affective, cognitive and behavioural evaluation both at the time of consumption of a product or service, and in the period before and after” [95]. Bodet and Bernache-Assollant [96] state that satisfaction assessment can be limited in time, for example, to a specific sports season, or can be unlimited. Maccinis and Price [86] explain that during the visit a tourist, taking into account the image of the destination, can add value to the event and increase its satisfaction. Satisfaction can be different in each individual, due to the dissimilitude and the reason for attending the event. Therefore, organisers must recognise and understand this distinction in order to improve their marketing and positioning strategy for the event [97]. Some studies have found that the image of the destination directly influences satisfaction [67,92], and future intentions [35,94,98,99].
Hypothesis 12 (H12).
Satisfaction has a positive and significant influence on Future Intentions.

1.1.5. Future Intentions

Future intentions (FI) are for the tourist/traveller to revisit the destination in the future, as well as to recommend it to others [90]. In sports tourism, success is achieved when tourists intend to return to both the sport event and the destination. Therefore, understanding future intentions is a key research topic that is being analysed extensively within the sports tourism sector with a view to identifying the most important aspects for tourists. Numerous studies focus on analysing the main predictors of future intentions, the last factor of a model commonly used in the field of event management. Researchers in the area are looking for the relationship between this factor and PQ [32,57,64,66,98,100], DIM, eWOM and satisfaction [35,86,101,102,103]. Figure 1 shows the path diagram of the proposal model.

2. Materials and Methods

2.1. Sample

The event evaluated was the 20th Half Marathon of 2017 in Santoña (Cantabria, Spain), a seaside town in the north of Spain. The sample was composed of a total of 236 active tourists of a total population of 1156, representing 20.4% of the total number of non-local registrants. 78.4% were male (n = 185) and 21.6% female (n = 51), with an average age of 42.3 ± 8.2 years. Table 1 shows the descriptive statistics of the sample. In general, the Spanish tourists who participated came from more than ten different regions. A total of 37.3% had a university education level (37.3%), an active work occupation (89.4%) and were married or living with a partner (73.7%). About 23.0% of the participants were attending the event for the first time.

2.2. Instrument

The questionnaire used was developed by Vegara-Ferri et al. [67] and consisted of 18 items distributed in six factors: (i) Communication measures the related perceived quality of information transmitted from the event if it is adequate, reliable and easy to locate; (ii) Staff evaluates the perceived quality of the level of competence, friendliness and effort of the human resources related to the event; (iii) eWOM emphasises the influence of existing information on the Internet when choosing the event and the location as a destination; (iv) Destination image addresses aspects of leisure and entertainment in the locality, tourist areas and the quality-price ratio of the place; (v) Satisfaction shows the degree of enjoyment, fun and sensations related to the event and the locality; and (vi) Future intentions measures the intention of tourists to return in the next few years and/or to recommend attending this event or place to their friends or family. The final structure of the instrument was composed of 18 items divided into six factors, evaluated by a 7-point Likert scale (1 “Strongly Disagree”—7 “Strongly Agree”).

2.3. Procedure

The procedure carried out was to establish contact with the event’s organising staff through e-mail, a letter of introduction and the survey to be done being sent. Once a positive response was obtained from the event’s organisers, the survey was prepared online using the “Surveys” tool developed by the University of Murcia. In order to comply with the data protection legislation, the online survey was sent to the organisers, who sent the link to access the survey to the participants’ e-mails, together with an introductory header. The survey was sent to the e-mails of the participants who were not resident in the city of the event, using the lists that the organisers of the sports event had when they registered for the event, and the acceptance of the conditions that allowed the participants to provide their personal data to a third party for this purpose. The survey was open from the conclusion of the event until two weeks after the end of the sporting event, during which time the participants could voluntarily access the online survey and complete it anonymously. The data was recorded in an Excel sheet, preventing possible recording errors or omission of responses because the system did not allow the submission of the survey unless all the items were answered. This research was approved by the Bioethics Committee of the University of Murcia (ID: 2492/2019).

2.4. Data Analysis

The EFA was used to verify the latent factors of the set of items using the SPSS v.22.0 statistical programme (IBM, Armonk, NY, USA). The CFA was then applied to verify the underlying factor structure derived from the EFA using the SPSS AMOS v22.0 statistical programme (IBM, Armonk, NY, USA) and a structural equation model (SEM) analysis. Descriptive statistics and correlation analysis of the different items and C-α index were calculated. Composite reliability (CR) and Average Variance Extracted (AVE) were estimated to ensure reliability through the results of the CFA following the indications of Hair, Black, Balin, and Anderson [104]. SEM analysis was used to test the hypothesis by examining the possible direct and indirect relationships between the factors in the proposed conceptual model. In order to carry out the analyses, the two-step process set out by Anderson and Gerbing [105] was followed. The first step consisted of the process of validating the questionnaire and the second step was to analyse the possible relationships.
Finally, to measure the scale’s fit, this study evaluated the model using chi-square statistics, the chi-square ratio and the degrees of freedom (χ2/df), the comparative fit index (CFI), the non-normalised fit index (NNFI), the incremental fit index (IFI), the Tucker-Lewis index, the parsimonious normalised fit index (PNFI), the root mean square error of approximation (RMSEA), and the root mean square residue (RMR). Bollen [106] states that χ2/df ratios having values between 2.0 and 3.0 are considered a suitable fit, as are values even up to 0.5. Values of the TLI, NNFI and IFI above 0.90 [107], values of the CFI above 0.95 and the NNFI above 0.6 [108], and values of the RMSEA and the RMR below 0.08 would indicate an acceptable model fit [109].

3. Results

3.1. Descriptive Results

The descriptive results of the variables and their items (Table 2) indicated that the sports tourists generally had a good perception of the locality, emphasising high scores in FI (M = 6.45 ± 0.9) and the SAT (M = 6.38 ± 0.7). STF was also valued above six points (M = 6.05 ± 0.9), COM and DIM quality obtained the same valuation with 5.84 points, while eWOM was the factor with the lowest score (M = 4.03 ± 1.2).

3.2. Exploratory Factor Analysis

The EFA results (Table 2) showed that the KMO index had an acceptable value of 0.867, while Bartlett’s Sphericity test was significant (χ2 = 4423.92(253); p ≤ 0.000). The communalities of all the items obtained adequate values above 0.4 [110]. Regarding the explained variance, it was observed that the items of the scale explained 78.02% of the variance with a solution of six factors, 37.48% belonged to the eWOM, 13.71% to STF, 8.8% to SAT, 7.57% to DIN, 6.37% to FI and 4.13% to the COM factor. The internal structure of the items in the scale showed high factorial weights, ranging from a minimum of 0.607 in item 1 to a maximum of 0.946 in item 7, with values above 0.60 considered representative. The internal consistency of each factor in the scale was evaluated by estimating Cronbach’s reliability alpha. According to the criterion of a C-α index equal to or greater than 0.70 [111], the internal consistency was acceptable for all the factors in this scale, with Cronbach’s alphas between 0.827 of COM and 0.975 of DIM.

3.3. Confirmatory Factor Analysis
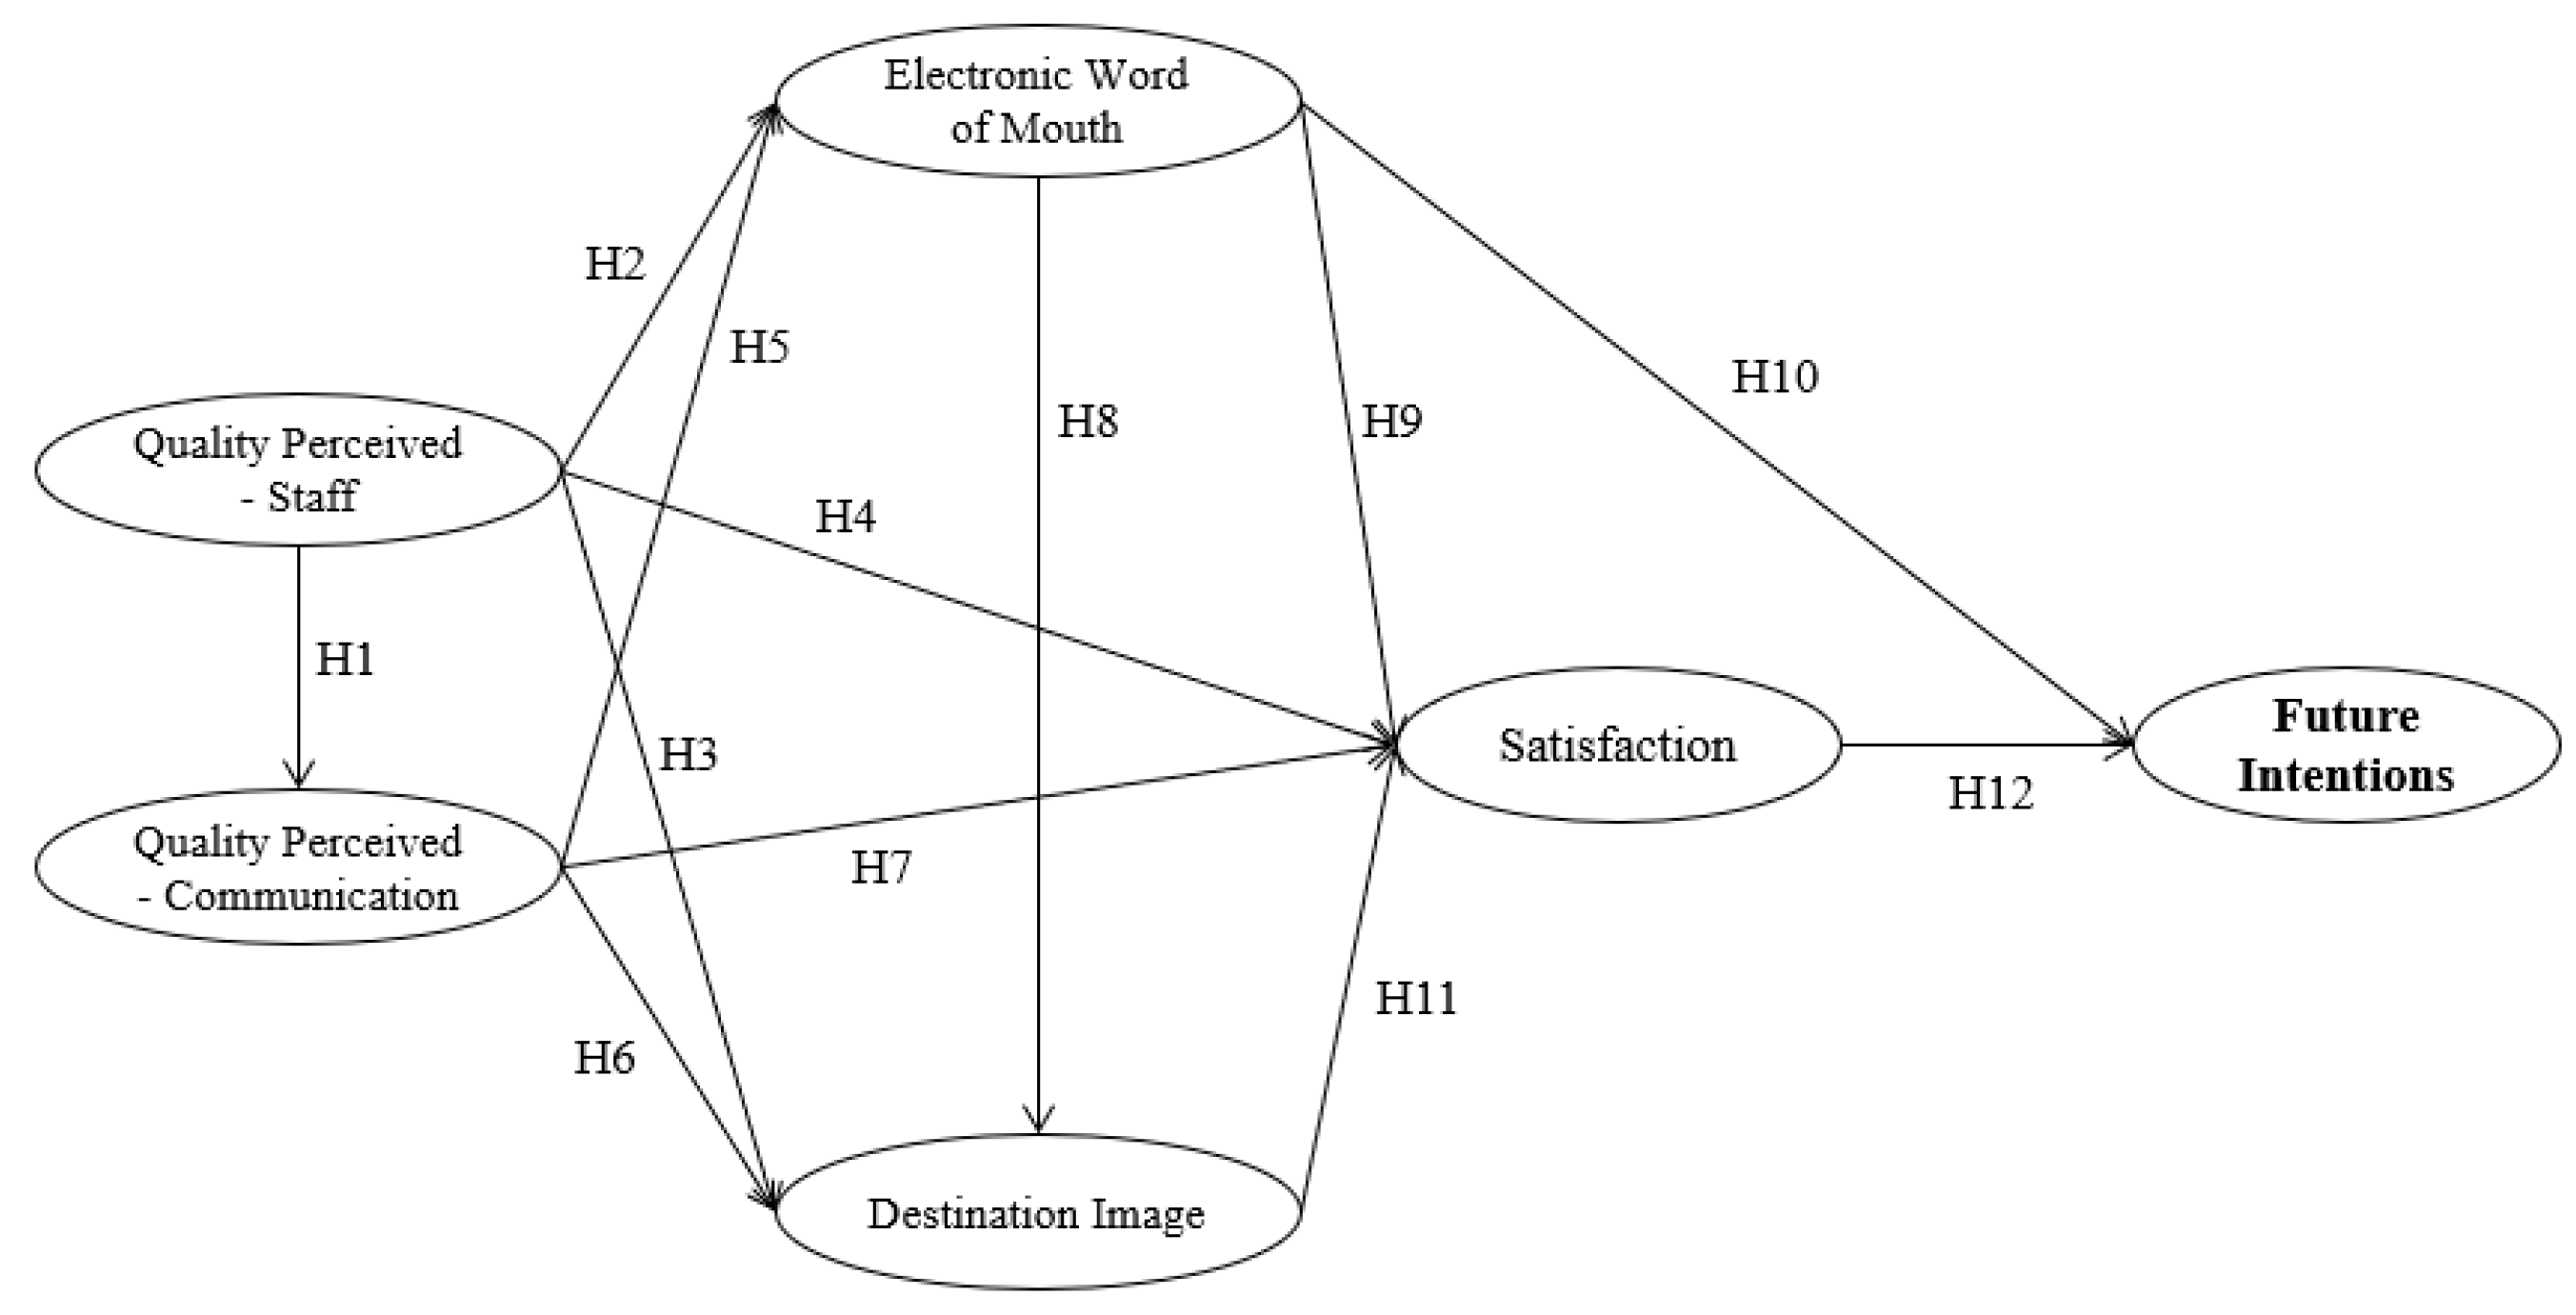
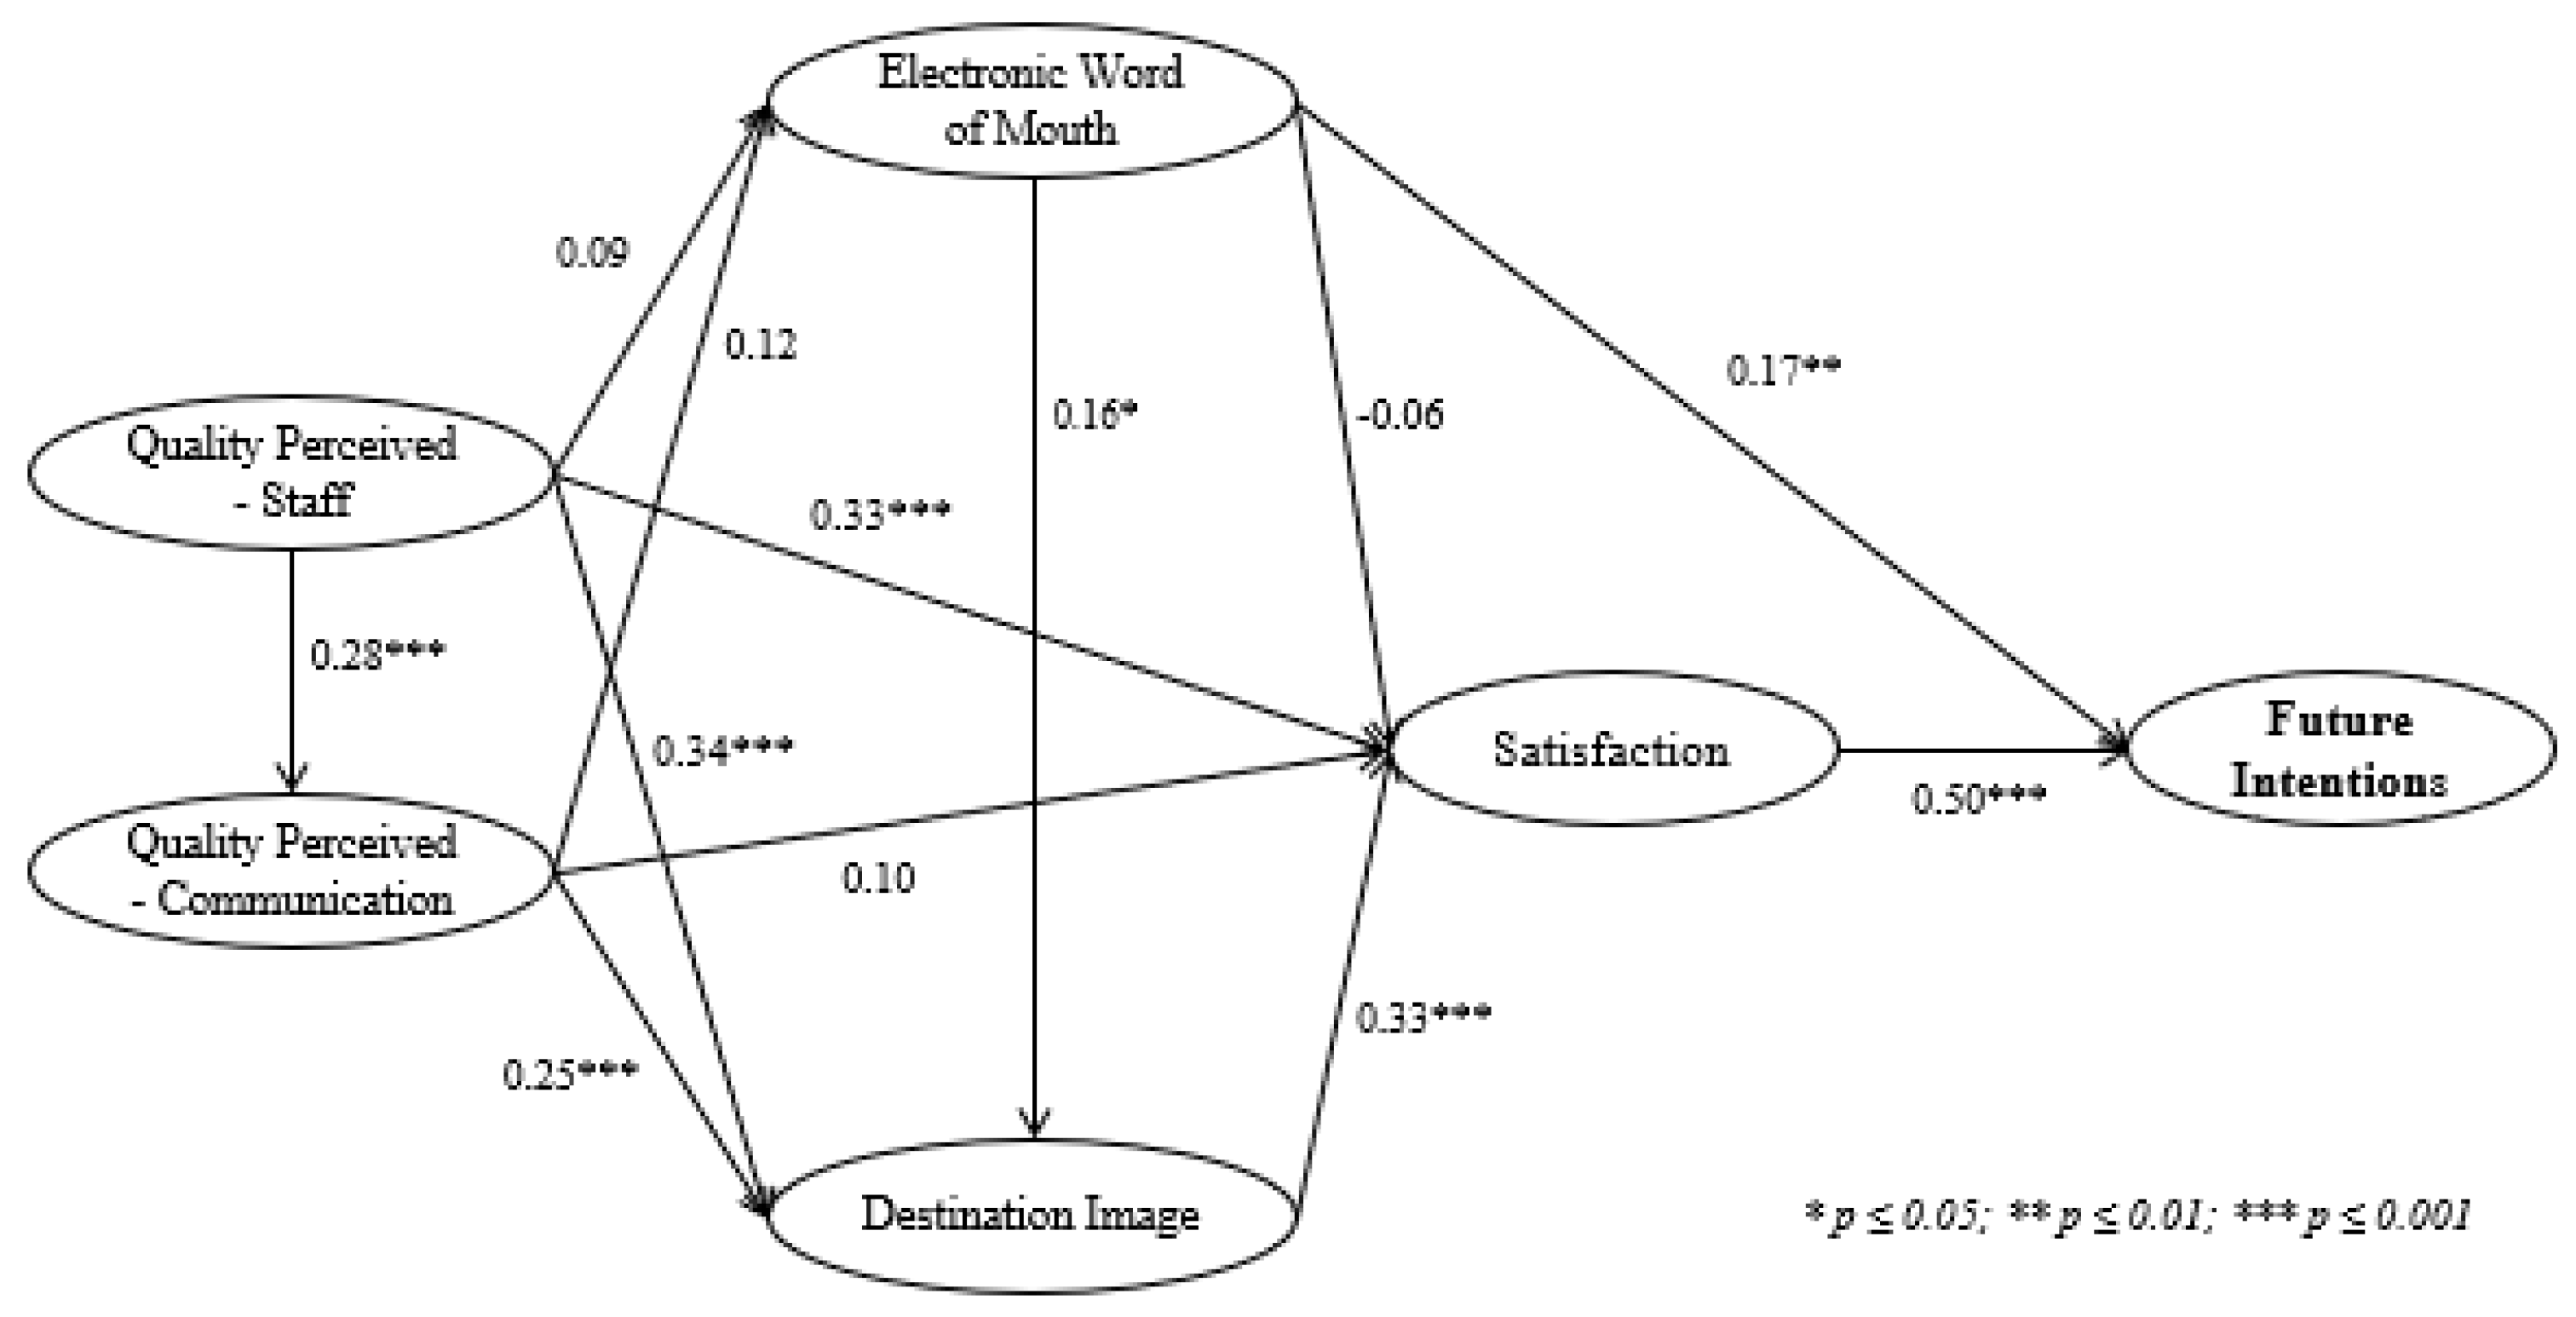
The CFA was used to examine the extent to which the six latent factors extracted from EFAs could be validly replicated. The model was tested using the maximum likelihood parameter estimation method. The results of the CFA showed that the model was adjusted appropriately (χ2 = 242.137, df = 118, p ≤ 0.001). Kline [107] also recommends the standardised chi-square (χ2/df) as a measure of fit. A value of 2.052 was obtained, meeting the ideal range between 2.0 and 3.0 proposed by Bollen [106]. The CFI index showed a value of 0.963 while the PNFI had a value of 0.718, meeting the minimum values indicated by Hu and Bentler [108]. The NFI, IFI and TLI values also had an acceptable adjustment with all the values being above 0.90 [107]; NFI = 0.931; IFI = 0.964; TLI = 0.952). The other adjustment indices used were the RMSEA, which had a value of 0.067, and the RMR, with a value of 0.053, with indices below 0.08 being acceptable [109].
As shown in Table 3, the factorial loads of all the items adequately reproduce the initial structure, all complying with the minimum recommended values (>0.5), with a minimum factorial load of 0.663 of item 9 of the eWOM factor and a maximum load of 0.982 of the STF factor. Secondly, for convergent validity the CR and AVE indices were also calculated, with adequate CR values above 0.70 and 0.50 in the AVE [104]. The CR values ranged from 0.84 to 0.95, while the AVE values were between 0.65 and 0.87, all of which were higher than the scale’s minimum values and demonstrated adequate convergent validity. Discriminant validity was also determined following the advice of Fornell and Larcker [112], who suggested that the AVE of each factor should be greater than the squared correlation between that factor and any other. Table 4 shows the analysis of correlations and R2 of each of the factors, all of them being significant except the eWOM factor with the STF and SAT. The AVE values were higher than the squared correlations and the discriminant validity was acceptable.

3.4. Proposal Model

Figure 2 shows the path diagram of the factors relations. The fit of the proposed model was good (χ2 = 321.852; gl = 122; χ2/gl = 2.638; p ≤ 0.001; CFI = 0.941, NFI = 0.909, TLI = 0.926; RMR = 0.097, RMSEA = 0.083), meeting the criteria set by Hair et al. [95]. Table 5 presents the results obtained from the hypotheses’ relationships between the different factors. The results showed that the STF factor significantly influences COM (H1: β = 0.271; t = 3.803; p ≤ 0.001), DIM (H3: β = 0.343; t = 4.993; p ≤ 0. 001) and SAT (H4: β = 0.334; t = 4.731; p ≤ 0.001), but it was not a determining factor on eWOM (H2: β = 0.088; t = 1.283; p ≥ 0.05). For its part, COM only had an effect on DIM (H6: β = 0.245; t = 3.500; p ≤ 0.001), not on eWOM (H5: β = 0.120; t = 1.652; p ≥ 0.05) and SAT (H7: β = 0.100; t = 1.491; p ≥ 0.05). The eWOM factor had an effect on the DIM factors (H8: β = 0.157; t = 2.473; p ≤ 0.05) and FI (H10: β = 0.170; t = 2.622; p ≤ 0.01). However, eWOM obtained a negative and non-significant estimate regarding SAT (H9: β = −0.063; t = −1.046; p ≥ 0.05). DIM was a factor that influenced SAT (H11: β = 0.329; t = 4.176; p ≤ 0.001) and, finally, SAT had an influence on FI (H12: β = 0.499; t = 6.763; p ≤ 0.001).

4. Discussion

The aim of this study was to determine which factors influence the future intentions of tourists involved in small-scale sports events. The EFA results showed that the KMO index obtained acceptable values of 0.867, those of 0.70 being considered acceptable [113]. In relation to the explained variance, it was observed that the result of the extraction of six factors was very related to the theoretically defined construct, explaining 78.0% of the variance. The factorial loads were all representative and located above 0.6, with a minimum load of 0.607 from item 1 related to the reliability of the service with respect to the information provided, and a maximum load of 0.946 from item 7 related to the influence of advertising when selecting the destination.
Research on sports tourism has increased in recent years, due to the importance of tourism in the economies of many countries. eWOM was the factor that explained the greatest variance with 37.48%. This factor has been contemplated outside the electronic context in different previous studies, such as tourist attractions to visit a city [30], a holiday resort [114], and in the sports context about the intention to attend an F1 Grand Prix [32]. Several studies have considered eWOM as the main way by which tourists obtain information about the quality of products and services in their trips [71], and the intention to do so after a trip [70], being a source of profitability for sports events organisers to share a positive eWOM of the destination [115].
The second factor with the highest variance explained was STF with 13.71%, while COM was the last factor extracted, explaining 4.13% of the variance. Both STF and COM have been quite evaluated within the context of quality of service, and their inclusion is considered appropriate because the sports tourist is usually treated by staff of the organisation, and for the success of the event it is necessary for there to be an adequate communication of the event. In the context of sporting events, only a few studies that have dealt with them, such as Angosto et al. [55,56] who evaluated these two factors specifically in the context of popular races. Jin et al. [31] and Kim et al. [32] also analysed these factors in a World Athletics Championship and an F1 Grand Prix, respectively. DIM explained 7.57%, an important aspect in assessing the importance and suitability of the location as an interesting tourist destination. Several studies have addressed this factor by considering the attractiveness of a city as a sports tourism destination [22,91], to attend a non-mega sports event [31], and even to identify which aspects are attractive to attend a mega sports event [34,116].
SAT has been a highly evaluated factor in the literature in different sports contexts and events from the point of view of the spectator [31,57,98,117], as well as the participating tourist [67], and in other non-sporting contexts related to tourist attraction [118,119,120]. SAT is a key element for a tourist to adopt a certain attitude towards the event, significantly influencing FI [121], according to the degree of compliance with expectations prior to the consumption of the service. Finally, FI is a factor that is treated as a dependent variable, since an indication of success is having a high predisposition to continue attending the event [34,35,122]. FI is usually evaluated from two different perspectives, either as the intention to repeat the service or a return to the destination and, on the other hand, the intention to speak positively about the experience at the event and the attractiveness of the venue by generating interest in third parties.
A CFA was carried out to corroborate the factor structure obtained after the EFA of the scale. The results indicated the existence of adequate values, higher than 0.90 in the CFI, NFI, IFI and TLI indices [107], as well as values between 0.05 and 0.08 in RMSEA and RMR [108]. With respect to the χ2/gl ratio, a value of 2.052 was obtained, considered a very good value as it was less than three points [106]. Although Hu and Bentler [108] consider a value of 1.0 as a perfect model, while those below 2.0 are deemed to be indicators of a very good model fit, values below 5.0 are considered as acceptable. The internal consistency of the scale was excellent, with C-a values between 0.827 of COM and 0.975 of DIM, with all factors having values above 0.8 [123]. To reaffirm the internal consistency, the CR of all the factors was higher than 0.8, exceeding the minimum values stipulated by Hair et al. [104], who set the value of the statistic at 0.7. For the AVE, all the values exceeded the minimum requirement of 0.5 [112].
The proposed model revealed that Hypotheses 1, 3, 4, 6, 8, 10, 11 and 12 were accepted while Hypotheses 2, 5, 7, and 9 were rejected. STF has proven to be a key element in a sports event in informing and communicating to tourists, as well as its influence on the destination’s image and the satisfaction of tourists. However, it had no influence on the tourists’ subsequent eWOM. Previous studies have found an influence of perceived quality on SAT [64,65]. For its part, the COM can be an important aspect in the DIM, since an adequate promotion and dissemination of the event and the locality as a destination of interest for the event can generate great expectations in sports tourists. Despite the influence on DIM, the COM factor had no effect on eWOM and SAT, i.e., adequate promotion of the event does not imply that tourists will subsequently make positive comments about the community and be satisfied with the experience.
eWOM is an essential element when looking for a tourist destination, having a great influence on the tourist’s image through the opinions and comments of other, previous tourists on the web and in social networks. Other earlier studies also found a positive influence of eWOM when selecting a destination [72,73,74,76]. In turn, this factor has also significantly influenced FI in terms of providing positive feedback on the community and the event, coinciding as in previous studies by [77] and [30]. eWOM had no effect on SAT, a negative influence being found. DIM influenced SAT, a pleasant and positive experience that exceeded the initial expectations of the tourist will generate a satisfaction and well-being that in turn will influence the generation of a positive attitude towards the destination’s image [87,88,89]. Other previous studies have found that DIM is also an important factor in determining FI in the context of sports tourism at events [32,57,79,80,90].
SAT has been demonstrated to be a very important and necessary factor that must be evaluated since it directly influences FI, being the greatest relationship of influence. These results were similar to those of previous studies [35,94,98,99]. SAT is also a mediator between FI with other elements such as STF and DIM, agreement being found in other previous studies that observed SAT as a mediator of DIM [67,92]. FI has been treated in numerous studies as the dependent factor of the rest of the variables and it has been shown that it has been related to the perceived quality [31,32,57,64,66,97,100], DIM, eWOM and SAT [35,86,101,102,103].
Finally, the results of this study show that, based on the S-O-R model, the model proposed determines how the stimuli focused on the perceived quality of communication and staff, as well as the destination image, significantly influence the satisfaction of the active sports tourist (organism), which significantly influences the response of the participants to a future behaviour of returning to the sport event or destination. In turn, the organism reflected in the satisfaction acts as a mediating factor between the stimuli (perceived quality and destination image) and the response (future behaviour). Among the limitations present in this study was the representativeness of the sample, only 20% of the tourists who came to participate in the event responded to the survey. This fact makes it necessary to search for strategies that encourage participation, such as the inclusion of some kind of draw for sports material related to the event or free registration for the next edition. Another limitation may be the size of the event that had a little more than 1000 participants. It is necessary to replicate this instrument in sports events with a higher participation, as well as to evaluate the tourist impact considering the characteristics and size of the celebration location. These results should be different in events of medium-sized localities to those of large cities, where the impact associated with these events does not have as much an effect on the economy as in smaller-sized localities. Other future research proposals could be the development of sustainability studies in sports events in a longitudinal rather than a cross-sectional way, as most studies do. These studies could also include indicators for the evaluation of social and environmental impacts in small-scale sports events.

5. Conclusions

In summary, the main conclusions of the study are that this instrument obtained a fit in all the validity and reliability indices considered, all of them being above the minimum recommended values. This scale allows us to evaluate the perception of the tourist impact in sports events, being a useful tool for the management by the organisers and sports entities as well as for research in different studies. Finally, the scale is made up of six factors: perceived quality (communication and staff), eWOM, destination image, satisfaction and future intentions, gathered in 18 items, being a reduced and quickly implemented scale. The proposed model has demonstrated that the STF, DIM and SAT factors are essential when measuring the impact of tourism on sports events. These findings indicate a great influence of eWOM and SAT on the tourist’s FI, in addition to being a mediating factor between FI and STF and DIM.
Despite the fact that the COVID-19 pandemic has paralysed the world of sport, especially sporting events, holding events is a key factor in reviving a country’s economy. For example, after the financial crisis in 2008, Spain managed to activate tourism by attracting major sports events such as the World Championships in Athletics, Swimming, Basketball and Handball, among others, which enabled foreign tourists to take advantage of the opportunity to engage in other types of tourism for sporting reasons. Another strategy to be considered by governments is the role of domestic tourism in this period of the COVID-19 pandemic when international travel is very limited, since promoting this type of tourism associated with small-scale sports events can be a very important mechanism in the recovery of the tourism sector by those which do not generate as much income as international tourism [124]. It can also have an impact on long-term transformation in the most resilient destinations, while responding to the demand for short and long-term tourist behaviour [125].
In addition, local governments must consider other associated impacts, such as the sport impact, the social impact and above all the economic impact attributed to holding the event. This implies the need to close the gap between the host communities’ tourism promotion objective and the actual income derived, whether tangible or intangible, by them. Sports tourism at small-scale events could be considered a viable way to develop tourism in the community in a sustainable manner [23]. In addition, considering the evaluation of the economic, socio-cultural and environmental impacts before and after the development of the small-scale sports event will enable a better view of the true impact [126]. Jimenez-Garcia et al. [27] emphasise the importance of sustainability assessment, not only externally but also internally within the organisation. This is particularly relevant in the formulation of organisational strategies. Finally, professionals in the tourism sector must consider, understand and integrate economic, social and environmental aspects into the development of sustainability and the decision-making process that helps to mitigate negative impacts [127].

Author Contributions

Conceptualisation, J.M.V.-F., S.A. and I.V.; Data curation, I.V.; Formal analysis, S.A.; Investigation, J.M.V.-F., J.M.L.-G. and A.D.S.; Methodology, S.A.; Project administration, J.M.V.-F. and S.A.; Supervision, J.M.L.-G. and A.D.S.; Writing—original draft, J.M.V.-F. and S.A.; Writing—review & editing, J.M.L.-G. and I.V. All authors have read and agreed to the published version of the manuscript.

Funding

This research received no external funding.

Conflicts of Interest

The authors declare no conflict of interest.

References

  1. Sancho, A.; Buhalis, D.; Gallego, J.; Mata, J. Introduction to Tourism; WTO: Madrid, Spain, 1998. [Google Scholar]
  2. Theodorakis, N.D.; Kaplanidou, K.; Karabaxoglou, I. Effect of event service quality and satisfaction on happiness among runners of a recurring sport event. Leis. Sci. 2015, 37, 87–107. [Google Scholar] [CrossRef]
  3. Neira-García, M. Análisis del Impacto Turístico de los Eventos. Estudio de Caso: VI Media Maratón de Gijón. Master’s thesis, University of Oviedo, Oviedo, Spain, 2016. [Google Scholar]
  4. World Travel and Tourism Council. Economic Impact Reports: Travel and Tourism Regional Performance, 2019; WTTC: London, UK, 2019.
  5. World Tourism Organization. UNWTO Tourism Highlights 2019 Edition, 2019; UNWTO: Madrid, Spain, 2018. [Google Scholar] [CrossRef]
  6. Latiesa, M. Evolución y tendencias de la conexión entre turismo y deporte. In Deporte y Cambio Social en el Umbral del Siglo XXI; Latiesa, M., Fernández, P., Prados, J., Eds.; Librerías Deportivas Esteban Sanz: Madrid, Spain, 2001; pp. 83–100. ISBN 84-85977-78-5. [Google Scholar]
  7. Andersen, J.J. The State of Running 2019|RunRepeat. Available online: https://runrepeat.com/state-ofrunning (accessed on 27 June 2020).
  8. National Institute of Statistics. Encuesta de Gasto Turístico (EGATUR). Available online: https://www.ine.es/dynt3/inebase/es/index.htm?padre=3620&capsel=3621 (accessed on 16 June 2020).
  9. Brown, C.; Busser, J.; Baloglu, S. Sport tourists in a gaming destination: Predicting gaming and nongaming expenditure. UNLV Gaming Res. Rev. J. 2010, 14, 59–68. Available online: https://digitalscholarship.unlv.edu/grrj/vol14/iss2/5 (accessed on 24 June 2020).
  10. Moon, K.; Kim, M.; Ko, Y.; Connaughton, D.; Lee, J. The influence of consumer’s event quality perception on destination image. Manag. Serv. Qual. 2011, 21, 287–303. [Google Scholar] [CrossRef]
  11. DeSarbo, W.S.; Madrigal, R. Examining the behavioral manifestations of fan avidity in sports marketing. J. Model. Manag. 2011, 6, 79–99. [Google Scholar] [CrossRef]
  12. Gammon, S.; Robinson, T. Sport and tourism: A conceptual framework. J. Sport Tour. 1997, 11–18. [Google Scholar] [CrossRef]
  13. Gibson, H. Active sport tourism: Who participates? Leis. Stud. 1998, 17, 155–170. [Google Scholar] [CrossRef]
  14. Delpy, L. An introduction to sport and adventure tourism. In Sport and Adventure Tourism; Hudson, S., Ed.; Haworth Hospitality Press: New York, NY, USA, 2003; pp. 1–25. ISBN 0-7890-1275-8. [Google Scholar]
  15. Deery, M.; Jago, L.; Fredline, L. Sport tourism or event tourism: Are they one and the same? J. Sport Tour. 2004, 9, 235–245. [Google Scholar] [CrossRef]
  16. Wilson, R. The economic impact of local sport events: Significant, limited or otherwise? A case study of four swimming events. Manag. Leis. 2006, 11, 57–70. [Google Scholar] [CrossRef]
  17. Gratton, C.; Dobson, N.; Shibli, S. The economic importance of major sports events: A case study of six events. Manag. Leis. 2000, 5, 17–28. [Google Scholar] [CrossRef]
  18. Shamir, B.; Ruskin, H. Sport participation vs. Sport spectatorship: Two modes of leisure behavior. J. Leis. Res. 1984, 16, 9–21. [Google Scholar] [CrossRef]
  19. Gibson, H.J.; Lamont, M.; Kennelly, M.; Buning, R.J. Introduction to the special issue active sport tourism. J. Sport Tour. 2018. [Google Scholar] [CrossRef]
  20. Hallmann, K.; Kaplanidou, K.; Breuer, C. Event image perceptions among active and passive sports tourists at marathon races. Int. J. Sports Mark. Spons. 2010, 12, 32–47. [Google Scholar] [CrossRef]
  21. Nishio, T. The impact of sports events on inbound tourism in New Zealand. Asia Pac. J. Tour. Res. 2013, 18, 934–946. [Google Scholar] [CrossRef]
  22. Allameh, S.; Khazaei, J.; Jaberi, A.; Salehzadeh, R.; Asadi, H. Factors influencing sport tourists’ revisit intentions: The role and effect of destination image, perceived quality, perceived value and satisfaction. Asia Pac. J. Mark. Logist. 2015, 27, 191–207. [Google Scholar] [CrossRef]
  23. Gibson, H.J.; Kaplanidou, K.; Kang, S.J. Small-scale event sport tourism: A case study in sustainable tourism. Sport Manag. Rev. 2012, 15, 160–170. [Google Scholar] [CrossRef]
  24. Higham, J. Commentary-sport as an avenue of tourism development: An analysis of the positive and negative impacts of sport tourism. Curr. Issues Tour. 1999, 2, 82–90. [Google Scholar] [CrossRef]
  25. Liu, Z. Sustainable tourism development: A critique. J. Sustain. Tour. 2003, 11, 459–475. [Google Scholar] [CrossRef] [Green Version]
  26. United Nations. Sustainable Development Goals. Available online: https://www.un.org/sustainabledevelopment/ (accessed on 29 June 2020).
  27. Jiménez-García, M.; Ruiz-Chico, J.; Peña-Sánchez, A.R.; López-Sánchez, J.A. A Bibliometric analysis of sports tourism and sustainability (2002–2019). Sustainability 2020, 12, 2840. [Google Scholar] [CrossRef] [Green Version]
  28. Getz, D.; Page, S.J. Progress and prospects for event tourism research. Tour. Manag. 2016, 52, 593–631. [Google Scholar] [CrossRef] [Green Version]
  29. Gallarza, M.; Saura, I. Value dimensions, perceived value, satisfaction and loyalty: An investigation of university students’ travel behaviour. Tour. Manag. 2006, 27, 437–452. [Google Scholar] [CrossRef]
  30. Jalilvand, M.; Samiei, N.; Dini, B.; Manzari, P.Y. Examining the structural relationships of electronic word of mouth, destination image, tourist attitude toward destination and travel intention: An integrated approach. J. Destin. Mark. Manag. 2012, 1, 134–143. [Google Scholar] [CrossRef]
  31. Jin, N.; Lee, H.; Lee, S. Event quality, perceived value, destination image, and behavioral intention of sports events: The case of the IAAF World Championship, Daegu, 2011. Asia Pac. J. Tour. Res. 2013, 18, 849–864. [Google Scholar] [CrossRef]
  32. Kim, S.; Park, J.; Kim, W. The mediating effect of destination image on the relationship between spectator satisfaction and behavioral intentions at an international sporting event. Asia Pac. J. Tour. Res. 2016, 21, 273–292. [Google Scholar] [CrossRef]
  33. Liu, D. The image impact of mega-sporting events perceived by international students and their behaviour intentions. Int. J. Sports Mark. Spons. 2015, 16, 22–36. [Google Scholar] [CrossRef]
  34. Salina, A.; Spring-Han, H. Sports centric tourism: Who travels to mega sports events? Int. J. Tour. Sci. 2014, 14, 81–110. [Google Scholar] [CrossRef]
  35. Walker, M.; Kaplanidou, K.; Gibson, H.; Thapa, B.; Geldenhuys, S.; Coetzee, W. Win in africa, with africa: Social responsibility, event image, and destination benefits. The case of the 2010 FIFA World Cup in South Africa. Tour. Manag. 2013, 34, 80–90. [Google Scholar] [CrossRef]
  36. Heetae, C.; Er Chin, K.; Hyun-Woo, L. Nostalgia, motivation, and intention for international football stadium tourism. Asia Pac. J. Tour. Res. 2019, 24, 912–923. [Google Scholar] [CrossRef]
  37. Melnick, M.J. Searching for sociability in the stands: A theory of sports spectating. J. Sport Manag. 1993, 7, 44–60. [Google Scholar] [CrossRef]
  38. Morgan, P. Towards a developmental theory of place attachment. J. Environ. Psychol. 2010, 30, 11–22. [Google Scholar] [CrossRef]
  39. Mehrabian, A.; Russell, J.A. An Approach to Environmental Psychology; MIT Press: Cambridge, MA, USA, 1974; ISBN 978-02-6213-090-5. [Google Scholar]
  40. Ajzen, I. From intentions to actions: A theory of planned behavior. In Action-Control: From Cognition to Behaviour; Kulh, J., Beckmann, J., Eds.; Springer: Berlin/Heidelberg, Germany, 1985; pp. 11–39. ISBN 978-3-642-69746-3. [Google Scholar]
  41. Ajzen, I. The theory of planned behavior. Organ. Behav. Hum. Decis. Process. 1991, 50, 179–211. [Google Scholar] [CrossRef]
  42. Shonk, D.J.; Chelladurai, P. Service quality, satisfaction, and intent to return in event sport tourism. J. Sport Manag. 2008, 22, 587–602. [Google Scholar] [CrossRef]
  43. Armitage, C.J.; Conner, M. Efficacy of the theory of planned behavior: A meta-analytic review. Br. J. Soc. Psychol. 2001, 40, 471–499. [Google Scholar] [CrossRef] [PubMed] [Green Version]
  44. Rajesh, R. Impact of tourist perceptions, destination image and tourist satisfaction on destination loyalty: A conceptual model. PASOS. Rev. Tur. Patrim. Cult. 2013, 11, 67–78. [Google Scholar] [CrossRef]
  45. Han, H.; Meng, B.; Kim, W. Emerging bicycle tourism and the theory of planned behavior. J. Sustain. Tour. 2017, 25, 292–309. [Google Scholar] [CrossRef]
  46. Vieira, V.A. Stimuli–organism-response framework: A meta-analytic review in the store environment. J. Bus. Res. 2013, 66, 1420–1426. [Google Scholar] [CrossRef]
  47. Cho, H.; Joo, D.; Moore, D.; Norman, W.C. Sport tourists’ nostalgia and its effect on attitude and intentions: A multilevel approach. Tour. Manag. Perspect. 2019, 32. [Google Scholar] [CrossRef]
  48. Yeoh, S.C.; Goh, Y.N. Participants’ behavioral intention to re-attend outdoor sports events (penang, malaysia). J. Tour. Hosp. Culin. Arts 2017, 9, 14–27. Available online: http://ir.uitm.edu.my/id/eprint/19461/ (accessed on 3 July 2020).
  49. Bodet, G. Investigating customer satisfaction in a health club context by an application of the tetraclasse model. Eur. Sport Manag. Q. 2006, 6, 149–165. [Google Scholar] [CrossRef]
  50. Murray, D.; Howat, G. The relationships among service quality, value, satisfaction, and future intentions of customers at an Australian sports and leisure centre. Sport Manag. Rev. 2002, 5, 25–43. [Google Scholar] [CrossRef]
  51. Rial, J.; Varela, J.; Rial, A.; Real, E. Modelización y medida de la Calidad Percibida en centros deportivos: La escala QSport-10. Rev. Int. Cienc. Deporte 2010, 18, 57–73. [Google Scholar] [CrossRef]
  52. Grönroos, C. Marketing y Gestión de Servicios. La Gestión de Los Momentos de la Verdad y la Competencia en Los Servicios; Díaz de Santos: Madrid, Spain, 1994; ISBN 84-7978-146-7. [Google Scholar]
  53. Bitner, M. Evaluating service encounters: The effects of physical surroundings and employee responses. J. Mark. 1990, 54, 69–82. [Google Scholar] [CrossRef]
  54. Zeithaml, V. Consumer perceptions of price, quality and value: A means-end model and synthesis of evidence. J. Mark. 1988, 52, 2–22. [Google Scholar] [CrossRef]
  55. Angosto, S.; López-Gullón, J.M.; Díaz, A. Participants’ perceived quality in two editions of a popular race. Intang. Cap. 2016, 12, 789–804. [Google Scholar] [CrossRef] [Green Version]
  56. Angosto, S.; López-Gullón, J.M.; Díaz, A. Una escala para la evaluación de la calidad percibida por participantes en eventos deportivos populares (CAPPEP V2. 0). J. Sports Econ. Manag. 2016, 6, 69–84. [Google Scholar]
  57. Kaplanidou, K.; Vogt, C. The interrelationship between sport event and destination image and sport tourists behaviours. J. Sport Tour. 2007, 12, 183–206. [Google Scholar] [CrossRef]
  58. Arcos, R. Public relations strategic intelligence: Intelligence analysis, communication and influence. Public Relat. Rev. 2016, 42, 264–270. [Google Scholar] [CrossRef]
  59. Horne, J. Assessing the sociology of sport: On sports mega-events and capitalist modernity. Int. Rev. Sociol. Sport 2015, 50, 466–471. [Google Scholar] [CrossRef]
  60. Real, M. Reflections on communication and sport: On spectacle and megaevents. Commun. Sport 2013, 1, 30–42. [Google Scholar] [CrossRef]
  61. Roche, M. Mega-Events, time and modernity on time structures in global society. Time Soc. 2003, 12, 99–126. [Google Scholar] [CrossRef]
  62. Godoy, J. El capital humano en la atención al cliente y la calidad de servicio. Obs. Lab. Rev. Venezol. 2011, 4, 23–35. [Google Scholar]
  63. Morales, V.; Gálvez, P.; Ruiz, A. Aportaciones psicométricas en el desarrollo de un cuestionario para evaluar la calidad percibida de servicios deportivos. Rev. Iberoam. Psicol. Ejerc. Deporte 2013, 8, 71–86. [Google Scholar] [CrossRef]
  64. Calabuig, F.; Burillo, P.; Crespo, J.; Mundina, J.; Gallardo, L. Satisfacción, calidad y valor percibido en espectadores de atletismo. Rev. Int. Med. Cienc. Act. Física Deporte 2010, 10, 577–593. [Google Scholar]
  65. Pérez-Campos, C.; Dos-Santos, M.A. La importancia de los atributos del servicio y el valor percibido en la predicción de la satisfacción de los espectadores de balonmano. J. Sports Econ. Manag. 2013, 3, 33–46. [Google Scholar]
  66. Ma, S.C.; Kaplanidou, K. Effects of event service quality on the quality of life and behavioral intentions of recreational runners. Leis. Sci. 2018, 1–21. [Google Scholar] [CrossRef]
  67. Vegara-Ferri, J.M.; Montesinos, E.; López-Gullón, J.M.; Sánchez, G.F.; Angosto, S. The touristic impact of a sporting event attending to the future intentions of the participants. J. Phys. Educ. Sport 2018, 18, 1356–1362. [Google Scholar] [CrossRef]
  68. Fernández-Carús, L. El Comportamiento del Consumidor Online. Factores que Aumentan la Actividad de Búsqueda de eWOM en el Sector Turístico. Master’s Thesis, University of Oviedo, Oviedo, Spain, 2014. [Google Scholar]
  69. Hennig-Thurau, T.; Gwinner, K.P.; Walsh, G.; Gremler, D.D. Electronic word-of-mouth via consumer-opinion platforms: What motivates consumers to articulate themselves on the internet? J. Interact. Mark. 2004, 18, 38–52. [Google Scholar] [CrossRef]
  70. Miao, Y. The influence of electronic-WOM on tourists’ behavioral intention to choose a destination: A case of Chinese tourists visiting Thailand. AU-GSB e-J. 2015, 8, 13–31. [Google Scholar]
  71. Chevalier, J.; Mayzlin, D. The effect of word of mouth on sales: Online book reviews. J. Mark. Res. 2006, 43, 345–354. [Google Scholar] [CrossRef] [Green Version]
  72. Córdova-Morán, J.; Freixa, P. Turismo, web 2.0 y comunicación interactiva en américa latina. Buenas prácticas y tendencias. Int. J. Inf. Syst. Tour. 2017, 2, 17–34. [Google Scholar]
  73. Gretzel, U.; Yoo, K.H. Use and impact of online travel reviews. Inf. Commun. Tech. Tour. 2008, 1, 35–46. [Google Scholar] [CrossRef]
  74. Jalilvand, M.; Samiei, N. The effect of word of mouth on inbound tourists’ decision for traveling to Islamic destinations (the case of Isfahan as a tourist destination in Iran). J. Islam. Mark. 2012, 3, 12–21. [Google Scholar] [CrossRef]
  75. Jalilvand, M.; Samiei, N. The impact of electronic word of mouth on a tourism destination choice: Testing the theory of planned behavior (TBP). Internet Res. 2012, 22, 591–612. [Google Scholar] [CrossRef]
  76. Papadimitriou, D.; Kaplanidou, K.; Apostolopoulou, A. Destination image components and word-of-mouth intentions in urban tourism: A multigroup approach. J. Hosp. Tour. Res. 2015, 5, 1–21. [Google Scholar] [CrossRef]
  77. Balakrishnan, M.S.; Nekhili, R.; Lewis, C. Destination brand components. Int. J. Cult. Tour. Hosp. Res. 2011, 5, 4–25. [Google Scholar] [CrossRef] [Green Version]
  78. Beerli, A.; Martin, J. Tourists’ characteristics and the perceived image of tourist destinations: A quantitative analysis—a case study of Lanzarote, Spain. Tour. Manag. 2004, 25, 623–636. [Google Scholar] [CrossRef]
  79. Byon, K.; Zhang, J. Development of a scale measuring destination image. Mark. Intell. Plan. 2010, 28, 508–532. [Google Scholar] [CrossRef]
  80. Lai, K. Influence of event image on destination image: The case of the 2008 Beijing Olympic Games. J. Destin. Mark. Manag. 2018, 7, 153–163. [Google Scholar] [CrossRef]
  81. Crompton, J.L. Measuring the Economic Impact of Visitors to Sports Tournaments and Special Events; National Recreation and Park Association; Division of Professional Services: Ashburn, VA, USA, 1999; ISBN 978-09-2958-139-2. [Google Scholar]
  82. Alhemoud, A.; Armstrong, G. Image of tourism attractions in Kuwait. J. Travel Res. 1996, 34, 76–80. [Google Scholar] [CrossRef]
  83. Femenía, O. La Imagen de un Destino Turístico Como Herramienta de Marketing; Grupo Eumednet: Málaga, Spain, 2011; ISBN 978-84-694-4681-2. [Google Scholar]
  84. Gallarza, M.; Gil, I.; Calderon, H. Destination image: Towards a conceptual framework. Ann. Tour. Res. 2002, 29, 56–78. [Google Scholar] [CrossRef]
  85. Heere, B.; Wear, H.; Jones, A.; Breitbarth, T.; Xing, X.; Paramio, J.L.; Yoshida, M.; Derom, I. Inducing destination images among international audiences: The differing effects of promoting sport events on the destination image of a city around the world. J. Sport Manag. 2019, 33, 506–517. [Google Scholar] [CrossRef] [Green Version]
  86. Macinnis, D.; Price, L. The role of imagery in information processing: Review and extension. J. Consum. Res. 1978, 13, 473–491. [Google Scholar] [CrossRef]
  87. Arnegger, J.; Herz, M. Economic and destination image impacts of mega-events in emerging tourist destinations. J. Destin. Mark. Manag. 2016, 5, 76–85. [Google Scholar] [CrossRef]
  88. Konecke, T.; Kwiatkowski, G. Why do people attend sport events at mature tourist destinations? An analysis of visitors’ motivation to attend the Windsurf World Cup on Sylt. Sport Tour. 2016, 23, 104–112. [Google Scholar] [CrossRef]
  89. Malchrowicz-Mosko, E.; Poczta, J. A small-scale event and a big impact-is this relationship possible in the world of sport? The meaning of heritage sport events for sustainable development of tourism-experiences from Poland. Sustainability 2018, 10, 4289. [Google Scholar] [CrossRef] [Green Version]
  90. Kaplanidou, K.; Gibson, H.J. Predicting behavioral intentions of active event sport tourists: The case of a small-scale recurring sports event. J. Sport Tour. 2010, 15, 163–179. [Google Scholar] [CrossRef]
  91. Hallmann, K.; Zehrer, A.; Müller, S. Perceived destination image: An image model for a winter sports destination and its effect on intention to revisit. J. Travel Res. 2015, 54, 94–106. [Google Scholar] [CrossRef]
  92. Chen, C.F.; Tsai, D. How destination image and evaluative factors affect behavioral intentions? Tour. Manag. 2007, 28, 1115–1122. [Google Scholar] [CrossRef]
  93. Qu, H.; Kim, L.; Im, H. A model of destination branding: Integrating the concepts of the branding and destination image. Tour. Manag. 2011, 32, 465–476. [Google Scholar] [CrossRef]
  94. Guntoro, B.; Hui, T.K. Travel satisfaction and revisit intention of chinese visitors: The case of singapore. Adv. Hosp. Leis. 2013, 9, 29–47. [Google Scholar] [CrossRef]
  95. Luna-Arocas, R.; Mundina, J. El marketing estratégico del deporte: Satisfacción, motivación y expectativas. Rev. Psicol. Deport. 1998, 13, 169–174. Available online: https://www.rpd-online.com/article/view/94/94 (accessed on 29 June 2020).
  96. Bodet, G.; Bernache-Assollant, I. Consumer loyalty in sport spectatorship services: The relationships with consumer satisfaction and team identification. Psychol. Mark. 2011, 28, 781–802. [Google Scholar] [CrossRef]
  97. Wafi, A.A.; Chiu, L.K.; Kayat, K. Understanding sport event visitors’ motivation and satisfaction of small-scale sport event. J. Tour. Hosp. Environ. 2017, 2, 13–24. [Google Scholar] [CrossRef]
  98. Calabuig, F.; Prado, V.; Hervás, J.; Núñez-Pomar, J.; Añó, V. Spectator emotions: Effects on quality, satisfaction, value, and future intentions. J. Bus. Res. 2015, 68, 1445–1449. [Google Scholar] [CrossRef]
  99. Prayag, G.; Grivel, E. Antecedents of sport event satisfaction and behavioral intentions: The role of sport identification, motivation, and place dependence. Event Manag. 2018, 22, 423–439. [Google Scholar] [CrossRef]
  100. Hightower, R.; Brady, M.K.; Baker, T.L. Investigating the role of the physical environment in hedonic service consumption: An Exploratory study of sporting events. J. Bus. Res. 2002, 55, 697–707. [Google Scholar] [CrossRef]
  101. Brown, G.; Assaker, G.; Reis, A. Visiting fortaleza: Motivation, satisfaction and revisit intentions of spectators at the Brazil 2014 FIFA World Cup. J. Sport Tour. 2018, 22, 1–19. [Google Scholar] [CrossRef]
  102. Plunkett, D.; Brooks, T.J. Examining the relationship between satisfaction, intentions, and post-trip communication behaviour of active event sport tourists. J. Sport Tour. 2018, 22, 303–313. [Google Scholar] [CrossRef]
  103. Waller, S.; Trendafilava, S.; Daniell, R. Did the 2012 World Series positively impact the image of Detroit? Sport as a transformative agent in changing images of tourism destination. J. Sport Tour. 2014, 19, 79–100. [Google Scholar] [CrossRef]
  104. Hair, J.F.; Black, W.C.; Babin, B.J.; Anderson, R.E.; Tatham, R.L. Multivariate Data Analysis, 7th ed.; Prentice Hall: Upper Saddle River, NJ, USA, 2014; ISBN 978-1-292-02190-4. [Google Scholar]
  105. Anderson, J.C.; Gerbing, D.W. Structural equation modeling in practice: A review and recommended two-step approach. Psychol. Bull. 1988, 103, 411–423. [Google Scholar] [CrossRef]
  106. Bollen, K. Structural Equations with Latent Variables; John Wiley & Sons: Hoboken, NJ, USA, 1989; ISBN 978-04-7101-171-2. [Google Scholar]
  107. Kline, R. Principles and Practice of Structural Equation Modeling, 2nd ed.; The Guilford Press: New York, NY, USA, 2005; ISBN 978-1-57230-690-5. [Google Scholar]
  108. Hu, L.; Bentler, P. Cutoff criteria for fit indexes in covariance structure analysis: Conventional criteria versus new alternatives. Struct. Equ. Model. 1999, 6, 1–55. [Google Scholar] [CrossRef]
  109. Browne, M.W.; Cudeck, R. Alternative ways of assessing model fit. In Testing Structural Equation Models; SAGE: Newbury Park, CA, USA, 1993; pp. 136–162. ISBN 978-08-0394-507-4. [Google Scholar]
  110. Costello, A.; Osborne, J. Best practices in exploratory factor analysis: Four recommendations for getting the most from your analysis. Pract. Assess. Res. Eval. 2005, 10, 1–9. [Google Scholar] [CrossRef]
  111. Nunnally, J.C.; Bernstein, I.H. Validity. Psychol. Theory 1994, 3, 99–132. [Google Scholar]
  112. Fornell, C.; Larcker, D. Structural equation models with unobservable variables and measurement error: Algebra and statistics. J. Mark. Res. 1981, 18, 382–388. [Google Scholar] [CrossRef]
  113. Visauta, B.; Martori, I.; Cañas, J. Análisis Estadístico con SPSS Para Windows, 2nd ed.; McGraw-Hill: Madrid, Spain, 2005; ISBN 978-84-4813-993-3. [Google Scholar]
  114. Alcaniz, E.; García, I.; Blas, S. The functional-psychological continuum in the cognitive image of a destination: A confirmatory analysis. Tour. Manag. 2009, 30, 715–723. [Google Scholar] [CrossRef]
  115. Marinkovic, V.; Senic, V.; Ivkov, D.; Dimitrovski, D.; Bjelic, M. The antecedents of satisfaction and revisit intentions for full-service restaurants. Mark. Intell. Plan. 2014, 32, 311–327. [Google Scholar] [CrossRef]
  116. Pratt, S.; Chan, W. Destination image and intention to visit the Tokyo 2020 Olympics among Hong Kong generation, Y. J. China Tour. Res. 2016, 12, 355–373. [Google Scholar] [CrossRef]
  117. Crespo, J.; Pérez-Campos, C. La influencia de la satisfacción con la programación de partidos en la intención de asistir de los espectadores. J. Sports Econ. Manag. 2011, 1, 48–54. [Google Scholar]
  118. Bigné, J.; Sánchez, M.; Sánchez, J. Tourism image, evaluation variables and after purchase behaviour: Inter-relationship. Tour. Manag. 2001, 22, 607–616. [Google Scholar] [CrossRef]
  119. Kim, Y.; Kim, M.; Goh, B. An examination of food tourist’s behavior: Using the modified theory of reasoned action. Tour. Manag. 2010, 32, 1.159–1.165. [Google Scholar] [CrossRef]
  120. Quintal, V.A.; Polczynski, A. Factors influencing tourists’ revisit intentions. Asia Pac. J. Mark. Logist. 2010, 22, 554–578. [Google Scholar] [CrossRef]
  121. Yoon, Y.; Uysal, M. An examination of the effects of motivation and satisfaction on destination loyalty: A structural model. Tour. Manag. 2005, 26, 45–56. [Google Scholar] [CrossRef]
  122. Gibson, H.J.; Qi, C.; Zhang, J. Destination image and intent to visit China, and the 2008 Beijing Olympic Games. J. Sport Manag. 2008, 22, 427–450. [Google Scholar] [CrossRef]
  123. Lowenthal, K.M.; Lewis, C.A. An Introduction to Psychological Tests and Scales, 2nd ed.; Psychology Press: Philadelphia, PA, USA, 2001; ISBN 978-13-1578-298-0. [Google Scholar]
  124. Monirul, M.; Fatema, F. Covid-19 and sustainable tourism: Macroeconomic effect and policy comparison among Europe, the USA and China. Asian Bus. Rev. 2020, 10, 53–60. [Google Scholar] [CrossRef]
  125. Gössling, S.; Scott, D.; Hall, C.M. Pandemics, tourism and global change: A rapid assessment of COVID-19. J. Sustain. Tour. 2020, 1–20. [Google Scholar] [CrossRef]
  126. Andersson, T.D.; Lundberg, E. Commensurability and sustainability: Triple impact assessments of a tourism event. Tour. Manag. 2013, 37, 99–109. [Google Scholar] [CrossRef]
  127. Niñerola, A.; Sánchez-Rebull, M.V.; Hernández-Lara, A.B. Tourism research on sustainability: A bibliometric analysis. Sustainability 2019, 11, 1377. [Google Scholar] [CrossRef] [Green Version]
Figure 1. Proposal model.
Sustainability 12 08103 g001
Figure 2. Relationships between the factors of proposal model.
Sustainability 12 08103 g002
Table 1. Descriptive of socio-demographic variables of sample.
VariablesN%
Education level
High School229.3
Senior High School/Professional Education8937.7
Graduate8837.3
Post-graduate3715.7
Occupation
Employed or Self-employed21189.4
Student41.7
Unemployed93.8
Retired/Pensioner52.1
Homemaker73.0
Marital status
Single4820.3
Married or cohabiting17473.7
Separated and/or divorced135.6
Widowed10.4
Table 2. Descriptive of factors and results of EFA.
ItemsMS.D.Factor LoadingCommunalities
Perceived Quality—Communication (eigenvalue: 1.02; %variance: 4.13; C-α: 0.827)5.840.8
Item 1. The organisation of the event provided me with a reliable, consistent and dependent service.5.821.00.6070.535
Item 2. I had updated information about the event/participants/teams.5.900.90.9120.867
Item 3. The information about this event was easy to get.5.801.20.7660.609
Quality Perceived—Staff (eigenvalue: 3.15; %variance: 13.71; C-α: 0.947)6.050.9
Item 4. The event staff and volunteers were competent.6.081.20.8680.879
Item 5. Staff behaviour was pleasant.6.181.00.9450.999
Item 6. The staff linked to the event made an effort to understand my needs and helped me with the questions I asked.5.911.20.8040.741
Electronic Word of Mouth (eigenvalue: 8.62; %variance: 37.48; C-α: 0.929)4.031.2
Item 7. Advertising of this event online was the key to choose this destination.4.381.60.9460.911
Item 8. I consulted and valued the comments and opinions I have read online when it came to choosing this destination.4.191.70.9710.961
Item 9. Reading negative comments on the internet influences my decision to attend the event.3.721.90.6870.488
Item 10. I search or I will search for publications by other attendees of this event on social networks.3.811.80.8820.796
Destination Image (eigenvalue: 1.74; %variance: 7.57; C-α: 0.875)5.841.0
Item 11. There are good opportunities to enjoy free time and entertainment in the destination.5.571.40.7650.730
Item 12. The destination offers interesting places to visit.6.061.00.8340.850
Item 13. As a tourist destination, the place offers good value for money.5.871.00.6170.564
Satisfaction (eigenvalue: 2.02; %variance: 8.77; C-α: 0.869)6.380.7
Item 14. I am having a good time attending this event.6.301.10.8720.856
Item 15. I really enjoy attending sports events.6.440.70.8290.732
Item 16. I think having free time and fun are important when it comes to choosing a destination.6.410.80.6180.632
Future Intentions (eigenvalue: 1.46; %variance: 6.35; C-α: 0.835)6.450.9
Item 17. I am going to recommend this destination to my friends and relatives.6.421.10.7980.868
Item 18. If I had the opportunity to attend a similar sports event, I would repeat the experience.6.471.00.6610.620
Table 3. CFA results and reliability.
ItemsFactor loadingComposite ReliabilityAVE
Perceived Quality—Communication 0.840.65
Item 1. The organisation of the event provided me with a reliable, consistent and dependent service.0.682
Item 2. I had updated information about the event/participants/teams.0.929
Item 3. The information about this event was easy to get.0.779
Perceived Quality—Staff 0.950.87
Item 4. The event staff and volunteers were competent.0.910
Item 5. Staff behaviour was pleasant.0.982
Item 6. The staff linked to the event made an effort to understand my needs and helped me with the questions I asked.0.872
Electronic Word of Mouth 0.930.78
Item 7. Advertising of this event online was the key to choosing this destination.0.959
Item 8. I consulted and valued the comments and opinions I have read online when it came to choosing this destination.0.970
Item 9. Reading negative comments on the internet influences my decision to attend the event.0.663
Item 10. I search or I will search for publications by other attendees of this event on social networks.0.893
Destination Image 0.880.71
Item 14. I am having a good time attending this event.0.861
Item 15. I really enjoy attending sports events.0.906
Item 16. I think having free time and fun are important when it comes to choosing a destination.0.751
Satisfaction 0.880.71
Item 14. I am having a good time attending this event.0.937
Item 15. I really enjoy attending sports events.0.838
Item 16. I think having free time and fun are important when it comes to choosing a destination.0.731
Future Intentions 0.840.73
Item 17. I am going to recommend this destination to my friends and relatives.0.782
Item 18. If I had the opportunity to attend a similar sports event, I would repeat the experience.0.919
Table 4. Correlation matrix.
F1 (R2)F2(R2)F3(R2)F4(R2)F5(R2)F6(R2)
F1: Communication(0.65)-----
F2: Staff0.271 ** (0.073)(0.87)----
F3: eWOM0.143 * (0.020)0.120 (0.014)(0.78)---
F4: Destination Image0.362 ** (0.131)0.425 ** (0.181)0.225 ** (0.051)(0.71)--
F5: Satisfaction0.287 ** (0.082)0.477 ** (0.228)0.065 (0.004)0.457 ** (0.208)(0.71)-
F6: Future Intentions0.293 ** (0.086)0.406 ** (0.165)0.201 ** (0.040)0.460 ** (0.211)0.722 ** (0.521)(0.73)
* Correlation is significant at the 0.05 level. ** Correlation is significant at the 0.01 level. Diagonal: AVE.
Table 5. Results of hypothesis relationships between the different factors.
Standardised EstimatesStandard Errortp
H1: STF → COM0.2710.0883.803***Accepted
H2: STF → eWOM0.0880.1801.2830.199Rejected
H3: STF → DIM0.3430.0934.993***Accepted
H4: STF → SAT0.3340.0614.731***Accepted
H5: COM → eWOM0.1200.1541.6520.099Rejected
H6: COM → DIM0.2450.0763.500***Accepted
H7: COM → SAT0.1000.0471.4910.136Rejected
H8: eWOM → DIM0.1570.0332.4730.013 *Accepted
H9: eWOM → SAT−0.0630.020−1.0460.296Rejected
H10: eWOM → FI0.1700.0462.6220.009 **Accepted
H11: DIM → SAT0.3290.0514.176***Accepted
H12: SAT → FI0.4990.1576.763***Accepted
Note: STF = Staff; COM = Communication; eWOM = electronic Word of Mouth; DIM = Destination Image; SAT = Satisfaction; FI = Future Intentions. * p ≤ 0.05; ** p ≤ 0.01; *** p ≤ 0.001.

