Article

The Influence of Economic Barriers and Drivers on Energy Efficiency Investments in Maritime Shipping, from the Perspective of the Principal-Agent Problem

by
Ángeles Longarela-Ares
1,*,
Anxo Calvo-Silvosa
1 and
José-Benito Pérez-López
2
1
Research Group on Regulation Economy and Finance (GREFIN), Faculty of Economics and Business, Universidade da Coruña, Elviña, 15071 A Coruña, Spain
2
Group of Railways and Transportation Engineering, Faculty of Economics and Business, Universidade da Coruña, Elviña, 15071 A Coruña, Spain
*
Author to whom correspondence should be addressed.
Sustainability 2020, 12(19), 7943; https://doi.org/10.3390/su12197943
Submission received: 11 August 2020 / Revised: 8 September 2020 / Accepted: 15 September 2020 / Published: 25 September 2020
(This article belongs to the Special Issue Sustainable Investment and Finance)

Abstract

:
Maritime transport stands out as a strategic sector; the increasing trend in maritime traffic makes it essential to reduce energy consumption and emissions through investment in energy efficiency. However, investments can be hindered by barriers, and drivers are necessary to reduce or overcome them and promote investment. Consequently, the purpose of this study is to analyze what factors influence investment decisions—and how they do so—when there are principal-agent problems in the shipowner–charterer relationship. The methodology is based on the following process: model and hypotheses formulation, variable definition, the creation of a study sample and statistical treatment through a descriptive analysis of variables and a binomial logistic regression model, all based on a state-of-the-art application. The results corroborate the hypotheses and indicate that principal-agent problems and split incentives, especially in time charter contracts, and a lack of verified information make the shipowners less likely to invest. Moreover, energy efficiency measures are less likely to be implemented in older vessels, possibly due to the difficulty associated with recovering the investment; they are more likely in larger and newer vessels, and regulation encourage their adoption. Furthermore, investment is more likely in vessels with verified information and high levels of both activity and harmful emissions. Improved knowledge in this field could help businesses and governments to act in a more sustainable manner, without detriment to an innovative and competitive sector.

1. Introduction

Maritime shipping is a key sector in the economy, accounting for 90% of global economic trade [1,2,3]. Despite being one of the most environmentally-friendly modes of transport [2,4], the progressive increase in seaborne trade also implies higher emissions and greater energy consumption. Forecasts point to an increase in emissions of up to 250% by 2050 [5], and energy costs represent a high percentage of the operating costs of vessels, accounting for between 60% and 70% [6]. Thus, the need arises to ensure more efficient and environmentally-friendly maritime activity.
This positions the promotion of energy efficiency (EE) as one of the main objectives in services such as transport [7,8]. Investing in energy efficiency measures (EEMs) can play an important role, as they will help to manage and reduce energy consumption and harmful emissions [9,10,11], and therefore, it is a highly relevant issue that becomes a key point for business and political decisions, oriented towards environmental protection and greater energy savings.
Nevertheless, there are several obstacles that hinder EE investment decisions and slow down the dissemination of innovation [12,13]. To overcome or reduce these barriers, it is important to also focus on the driving forces that encourage investment [14,15,16]. Consequently, studies on EE investment are vital to ensure sustainable, competitive and innovative business and to contribute to improving knowledge about the adoption and implementation of EEMs. Nevertheless, most studies have focused on elaborate taxonomies and categorizing barriers and drivers [17,18,19,20,21,22,23,24], as opposed to empirically studying their influence on EE investment [25,26,27,28,29,30,31,32,33,34]; therefore, empirical evidence in this field is scarce.
The main objective of this work is to analyze which factors (barriers and drivers) influence EE investments when there are agency or principal–agent problems in the shipowner–charterer relationship, and how those factors influence investment decision. The main contributions consist of: (i) transferring the study of economic barriers and drivers of EE investment from the residential, commercial and/or industrial fields to the maritime shipping sector, as this is a more widely studied topic in dwellings and industry, but one that is nonetheless transferable to other sectors once the proper adaptations have been made; (ii) determining how the considered factors influence investment decisions by observing their real impact and, to this end, we employ data of actual (rather than intended) investments and examine investment decisions over a range of years; and, although various economic barriers and drivers are dealt with, (iii) another contribution consists of approaching the study from an economic-financial perspective, supported by the conceptual framework of Agency Theory [6,30,31,35,36].
This paper allows us to identify the type of vessels in which EE investments are most likely to be made. Principal–agent problems, especially in vessels with time charter contracts, make shipowners less likely to invest due to conflicts of interest (split incentives in the energy efficiency field) and a lack of verified information. Moreover, EEMs are less likely to be implemented on older vessels, perhaps due to the difficulty of recovering the investment, although legislation and regulation encourage their adoption. Furthermore, investment is more likely in larger vessels with higher levels of activity and harmful emissions, possibly to compensate for their negative impact on the environment. Improving knowledge in this field can help the relevant parties to act in a more sustainable manner and contribute to creating a broader and more contrasting vision of the subject. This allows organizations, politicians and business decision-makers to learn from the past, understand the present and formulate government policies and decisions in order to develop more sustainable actions to guarantee prosperous, competitive and innovative activity in the shipping sector and allow the sector for develop in a way that is as respectful as possible to the environment. We will use the terms “ship” and “vessel” interchangeably, as well as the terms “maritime shipping” and “shipping” or “drivers” and “driving forces”
This paper has the following structure: Section 2 presents the state of current research, reviewing some of the most relevant works in the literature on economic barriers, especially those related to agency theory, drivers and previous empirical EE investment studies. Section 3 explains the methodology followed to carry out the empirical study, i.e., the model and the hypotheses formulated, the variables defined, the study sample created, as well as presenting, the statistical treatment, namely the descriptive analysis of variables and the binomial logistic regression model. Section 4 presents the results of the study and discusses them. Finally, Section 5 presents the conclusions of the work, the limitations of the research and lines of future research.

2. The State of Current Research

Since the 1980s, energy efficiency investments and related issues have been studied most comprehensively in the field of residential housing [18,19,20,37]; however, in the 2000s, a growing interest emerged in other sectors [14,16,17,34,38,39,40]. Nevertheless, studies focused on shipping are relatively few in number and recent [6,30,31,41,42,43,44,45]. Relevant issues have been the barriers that inhibit EE investment and give rise to the energy efficiency gap, and drivers that can help reduce or overcome a barrier and encourage investment. Nevertheless, most studies have focused on elaborate taxonomies and categorizing barriers and drivers [17,18,19,20,21,22,23], as opposed to empirically studying their influence on EE investment [24,25,26,27,28,29,30,31,32,33]. Below is a review of some of the most relevant studies in the literature, in which we first comment on papers related to barriers and their classification, focusing in particular on the principal–agent problem; secondly, papers related to drivers and their classification are discussed, and thirdly, empirical papers related to the influence of barriers and drivers on investment are considered.

2.1. Barriers to Energy Efficiency Investments

A barrier can be defined as a mechanism that inhibits investment in measures that are efficient in both energy and economic terms [23]. The study of barriers has mainly focused on the identification, categorization and compression of the factors that may explain the low level of implementation of cost-efficient measures [17,19,20,23,37,39,46]. Blumstein et al. [37] were the first to systematically analyze the causes of the energy efficiency gap, and Jaffe and Stavins [19,20], Levine et al. [47] and Golove and Eto [18] considered barriers similar to those established by Blumstein et al. [37] and introduced the concept of market failure. Sorrell et al. [22,23,24] also made relevant contributions to the classification of barriers, taking important elements from Jaffe and Stavins [19,20] and Golove and Eto [18], and proposing a new categorization built on the theoretical background of the barrier in economic, behavioral and organizational terms and including market barriers and market failures within economic barriers. Their taxonomy is derived from different branches of economic theory, orthodox and agency perspectives combined with transaction cost economics and behavioral economics; theirs was one of the first empirical studies to do this. Cagno et al. [39] considered a taxonomy which identified the various origins of the barriers with respect to the firm and the actors affected by the barriers. Although there is a wide range of classifications, depending on the authors and the scope of their topic, most have considered the same aspects: economic-financial, organizational, technical, legal or institutional and behavioral aspects; and most agreed that, in general, there are three large groups of barriers (Table 1): behavioral, organizational and economic [6,7,11,12,17,30,31,43,44,48,49,50,51].
Some studies have focused on commercial and industrial firms [14,16,17,27,39,52,53], while others have concentrated on residential sector [28,29,32,54,55,56], finding barriers that inhibited EE investments. Nevertheless, maritime shipping has been the subject of few studies in this regard. One of the first studies to specifically discuss barriers to low carbon technologies in shipping was that by Hobson et al. [57], who classified barriers as technical, economic, social and legislative. Kollamthodi et al. [58] reviewed the literature on barriers and analyzed them; they included risks, hidden costs, informational problems, technical and operational measures and the principal–agent problem. Some authors classify these barriers as technological, institutional and financial [43,44,45]. Maddox Consulting [50] distinguishes among technological, operational and physical barriers, regulatory, economic, market failures and administrative barriers. Jafarzadeh and Utne [49] identified informational, economic, inter-organizational, technological, political, geographic and intraorganizational barriers, while Rehmatulla and Smith [6,31] considered behavioral, organizational and economic barriers (market barriers and market failures). Therefore, an analogous taxonomy to other sectors was defined for shipping, which is no different from that of other sectors, in terms of the principal–agent problem and the share of energy costs as compared to the total operating costs, such as in the industrial sector [30]. Economic barriers are most commonly dealt with in the shipping sector [6,31,42,43,50] and, generally, the factors that affect organizations the most, while behavioral barriers, for instance, have a greater effect on individuals [59,60]. Economic barriers are classified into nonmarket failures and market failures. It is important to distinguish between them, due to the possibility of political intervention regarding the latter.

2.1.1. Economic Barriers: Market Barriers

A market barrier is a factor that inhibits EE investments, contributes to the slow diffusion and adoption of innovations and explains why even though an energy efficiency measure (EEM) seems to be economically efficient, the decision-maker does not implement it [6,12,14,19,20,23,31,53,61]. Among the market barriers included in the reviewed literature (Table 1), those related to capital constraints and factors that influence the magnitude of the energy efficiency gap stand out.
The high cost required for the adoption of EEMs during the shipbuilding process or the retrofitting of existing vessels sometimes requires external financing [8]. However, capital constraints, influenced by the economic crisis, the high cost of capital and the solvency of companies [6,18,61] can make it difficult for EEMs to be adopted unless they produce a return above the minimum expected by the investor [62]. Asymmetric information and a lack of knowledge by the lenders about EE investments, the potential return on investment and the financial risk of the potential borrower may contribute to creating capital constraints [12,59,63]. As a result, shipping companies are forced to turn to lenders that are more willing to invest in these conditions, such as equity firms or third-party financing [8]. Investment decision-makers may prefer to keep payments low as opposed to minimizing operational costs [59]; therefore, if improving EE means giving up other more profitable investment alternatives, EE investment will be given a low priority, even when a project is economically viable and the company has access to capital [11,12,38,64]. In the past, when fuel was relatively cheap, investment was even prioritized in favor of crew costs, as companies lacked sufficient knowledge to evaluate EEMs [44].
Regarding the factors that influence the EE gap magnitude, these can include heterogeneity, hidden costs, risk and uncertainty. Heterogeneity refers to the fact that the same technology can have a different profitability and potential to reduce harmful emissions for each type of vessel, depending on its characteristics, route and merchandise. This is because while a measure may be cost-efficient, it may not be considered as such, and it may be implemented in one company but not in another [18,19]. Some technologies may even be mutually exclusive and only applicable to a specific type of ship [44,45]. Likewise, vessel age may be of interest when considering an investment, since an older ship will tend to have a lower margin of recovery of investments [22], which hinders EE investment.
Hidden costs act as a barrier when they outweigh the benefits of adopting a measure and are represented by life-cycle costs, transaction costs [13,18,23,63], start-up or interruption costs outside the dry-dock or inspection periods [43] and the loss or reduction of benefits [6,41,43,44,49,50]. This classification applies to both the maritime shipping sector and also to others. The risk, uncertainty and irreversibility of an investment may imply the rejection or delay of a viable project, due to the numerous uncertainties that these types of investments entail. As a result of skepticism about the proper functioning of innovative technologies, the shipowner may not always choose to invest in the most efficient measures or, if he/she does so, it may require a premium to recoup the investment and to cover risks [6,43]. Risk-related aspects can lead to strict investment criteria, such as the demand for high levels of profitability and short payback periods [22]. Among these risks are business and financing risks, technical risks or the unreliability of the EEMs and the external risk related to uncertainty regarding fuel price fluctuations, economic and political trends and new regulations that may discourage shipowners from investing [6,22,23,30,65]. Nevertheless, some authors consider legislation as a regulatory failure [11,12,43,44,49,50].

2.1.2. Economic Barriers: Market Failures

A market failure occurs when the neoclassical assumptions that define an ideal market are violated, the conditions for Pareto efficiency are not met, and therefore, the market does not function properly. These issues lead to a situation of imperfect competition and asymmetric information [12,22,23,59], and potential difficulties can arise, which lead to a conflict of interest (namely, split incentives in the EE field) between the parties to a contract. A market failure may justify policy intervention, as long as the benefits of an intervention exceed the implementation costs [12]. In addition to informational failures and split incentives, there are regulatory failures [12,43,44,45,49,50], interorganizational barriers, environmental and energy security externalities (unpriced costs) [11,12,18,63] and the inability of some companies to capture the benefits of their research (unpriced public goods) [11,12,63].
The most important market failures are informational failures and conflicts of interest, both of which lead to a principal–agent problem, as agency theory states, so this section will focus particularly on them. An agency relationship is a contract established between two cooperating parties in the performance of an activity. A person or entity (principal) delegates to another person or entity (agent) the performance of a task (investment decision) for the benefit of the former, in exchange for remuneration (rent or freight rate) and granting the agent broad decision-making capacity as the representative of the principal [22,23,30,35,36].
Informational failures include inaccurate or a lack of information and transaction costs [13,18,22,63,66], resulting in informational asymmetries. The parties to a contract often act under the influence of informational asymmetries, due to the fact that one party, usually the agent, can have more information than the other, but is unwilling or has difficulties in transmitting it [20]. The agent can act in an opportunistic way, which can lead to a situation of limited rationality [67] and increased risk aversion [68], or can prompt investment decision-makers to prioritize other types of projects [12,18,59]. The worse-informed party may refuse to perform the transaction [69], causing the parties not to reach an agreement if they do not receive the same data or sufficient guarantees in terms of the energy and environmental performance of the vessels [8,11,31,70,71]. To a large extent, the lack of information stems from the lack of adequate measurement and verification methods for the operation of the implemented EEMs or the environmental performance of vessels. This can be due to the meteorological conditions, and other operational factors can cause the monitoring of data on the savings provided by the same technology to vary from one type of vessel to another [6,8,31].
Agency theory also assumes that the agents are autonomous and tend to maximize their own interests at the expense of the principal [72], a condition that gives rise to conflicts of interest or split incentives. The shipowner decides the level of EE to implement on his/her property, and the objective is to assume the lowest possible cost of investment, due to the fact that it may not be able to appropriate the energy savings or ensure the recovery of the investment through them [42]. The charterer assumes the role of the principal, as is affected by the decisions of the shipowner (agent); his/her objective is for the shipowner to maximize EE in order to benefit from greater energy savings and innovations, but the charterer will not assume the cost of investment, since he/she does not own the vessel [12,19,35,36,73,74]. Since each party has different objectives and there are few incentives to adopt EEMs, split incentives arise and make it difficult for the level of real investment in EE to reach a socially optimal level [6,8,31].
Consequently, split incentives and asymmetric information lead to a moral hazard and adverse selection, and the principal–agent problem arises as a market failure, since verifying the agent’s actions can be too difficult or extremely expensive [6,31,70]. Even if the charterer consumes fuel in a responsible manner, it is difficult to discern what part of the energy savings is due to technological factors, what part owes to exogenous factors and what part can be attributed to the charterer’s energy management. The shipowner could hide behind this argument to justify the low savings obtained by the charterer after the agreement. Not revealing the hidden characteristics before signing the contract may be an adverse selection problem, and in turn, a situation of moral hazard arises, given that the shipowner excuses his/her behavior after the contract, which can give rise to postcontractual opportunism [6,31,75,76,77]. In cases in which the shipowner pays the energy costs or energy bill, the charterer could also act opportunistically, not adequately managing energy consumption, as the shipowner pays the energy costs.

2.1.3. Agency Theory and Principal–Agent Problem

Agency relationships may or not result in a principal–agent problem, depending on the type of contract signed between the parties, the informational failures and the split incentives (previously mentioned in Section 2.1.2). Based on pioneering studies by Ross [36] and Jensen and Meckling [35], the principal–agent problem in EE has been studied in different sectors, with the most common example being the landlord–tenant relationship in the residential sector. The principal–agent problem was first suggested by Blumstein et al. [37], who studied the possibility of split incentives between owners and occupants of dwellings. Starting with the landlord–tenant relationship, Murtishaw and Sathaye [29], Meier and Eide [78] and the International Energy Agency (IEA) [11] classified principal–agent relationships into four general cases, based on the responsibilities assumed by each party. This classification can be extrapolated to other sectors, such as shipping [30], depending on the type of contract under which the vessel operates and its ownership [6,11,31,42,44,50], and has been applied also to other modes of transport, such as roads [34,79].
Murtishaw and Sathaye [29] identified the party that selects the efficient technology to invest in, who uses said technology and who pays the energy costs derived from it, and they developed a framework to categorize the principal–agent problems in the residential sector. Meier and Eide [78] and the IEA [11] observed how decision-making responsibilities are shared between the parties, who makes the necessary initial outlay, who owns it, who operates the technology and who pays the energy costs, applying their analysis to case studies. In all cases, the owner, as the agent, generally decides the level of EE to implement, the technologies in which to invest and assumes the investment and vessel costs. The charterer usually delegates investment decision-making to the shipowner and pays a freight rate to it for the maritime transport service or for the available ship [6,31,43,44]. The main differences can be in who owns the vessel, who is the principal and who bears the energy costs (included within the travel costs in shipping). Depending on these aspects, there are four basic principal–agent relationship cases in the shipowner–charterer relationship, which are described below and are related to a specific type of contract (Table 2).
  • Case 1: the shipowner agrees to transport a specific cargo within a given time, owns and operates his/her own ships, selects the technology to implement, and assumes the vessel and travel costs. The shipowner and charterer are the same entity and, therefore, there is no agency problem between them [31], or, if they are different entities, the costs are internalized [11,34].
  • Case 2: associated with the Time Charter (TC) contract, in which the shipowner makes a vessel available to the charterer for a specified period of time. The shipowner and charterer are separate entities. The shipowner, as the agent, assumes the outlay of the investment, the capital and the vessel costs. The charterer assumes the travel costs, which will be influenced by the shipowner’s decision. Since the shipowner assumes the investment, while the charterer benefits from energy savings, the former will have no incentive to select efficient technologies, the agency and efficiency problems arise and the agent can act opportunistically [6,31,34,42,43,45].
  • Case 3: the principal and the agent are separate entities. The end-consumer can influence the investment decision but does not assume the energy costs, is not the owner and does not make the capital outlay necessary for the investment. The owner will have to cope with the possibility of poor energy management by the end-consumer, which can mean an increase in the freight that it demands. There will be efficiency and usage problems. In this case, it is not clear who acts as the agent and who is the principal. IEA [11] considers the agent to be the one who pays the energy costs and the principal is the one who selects and operates the technology; however, Vernon and Meier [34] reason that the roles change in the trucking industry. In any case, this relationship has not been identified with a specific contract in shipping [30,31].
  • Case 4: this is associated with the Voyage Charter (VY) contract. The shipowner and charterer are separate entities. The charterer hires a shipowner to transport a specific shipment of goods. The shipowner is responsible for all costs (capital, vessel and travel costs), decides the level of EE to implement and selects the technology in which it will invest. The shipowner can compensate for the nonpayment of travel costs by the charterer with a higher freight rate, so it pays it only indirectly. The charterer, as the principal, assumes the freight rate based on the quantity of goods transported and, since it does not pay the travel costs, it can engage in opportunistic energy consumption, triggering agency and usage problems [21,31,34,80].
The shipowner–charterer relationship established under a TC contract (Case 2) is the clearest case of the principal–agent problem [81]. The agent’s objective is to reduce the cost of the investment, since he/she cannot appropriate the energy savings or recover the investment through them, unless she/she has long-term agreements with the charterer. The principal’s objective is to maximize energy efficiency in the vessel provided by the agent to benefit from greater energy savings and not assume losses caused by the poor efficiency of the vessel; however, the principal will not assume the initial outlay, as he/she is not the owner [12,20,35,36,67,73,74]. When the shipowner considers assuming the investment in EEMs but cannot recover his/her investment, he/she will tend not to invest, due to the fact that, in general, the economic benefit that the charterer perceives is not reflected in the freight rates or in the second-hand market [43], or if only a small percentage of fuel savings are recovered through higher freight rates [42,81]. The charterer will also have no incentive to invest, as he/she will not consider it to be commercially attractive if the duration of the contract and his/her relationship with the shipowner are shorter than the return on investment [30,31,43].

2.2. Drivers of Energy Efficiency Investments

A driver is a factor that can help reduce or overcome a barrier or promote EE investment [14,16,59]. The classification of drivers in the residential and industrial sectors could be applied to maritime shipping and, in spite of the existence of different denominations for each type of factor, most authors have identified similar drivers that can be grouped into four general categories: economic-financial drivers, regulation and policies, informational drivers and professional training drivers (Table 3). Their study promotes a broader vision to help policymakers, businesses and decision-makers to understand these drivers and enhance their positive effect on EE investment.
Thollander and Ottosson [16] classified drivers into three groups related to the market, energy policies and organizational and behavioral aspects. Their study was one of the first to provide a classification of the drivers, taking into account previous studies on how they influence investments in clean technologies. Hrovatin et al. [27] used their classification and added regulation. Cagno et al. [17] differentiated between external and internal factors, considering the same categories and Cagno et al. [39] stablished four categories: economic, regulatory, informational and vocational training. Reddy and Painuly [59] distinguished among six drivers: awareness raising, declining technology prices, rising energy prices, attractiveness of technology, nonenergy benefits and environmental regulations. Other classifications identified economic, regulatory, informational and vocational training drivers [39,82,83]; financial, informational, organizational and external factors [84]; and economic factors, legal requirements and consumer requirements [85].

2.2.1. Economic-Financial Drivers

Financing mechanisms are drivers that could help to reduce or overcome barriers such as the lack of access to capital, split incentives, informational failures and, in consequence, principal–agent problems [8,31,39,84]. This can occur through private financing [39] or third-party financing [8] and public financing or subsidies [16,17,39,86].
The third-party financing concept was introduced in the renewable energy sector in 2003, with Sun Edison’s Power Purchase Agreements (PPAs) and, lastly, in the residential building sector through Energy Services Companies (ESCOs) [8,50]. The original models can be adapted to the maritime shipping sector, with methods such as Self-Financing Fuel-Saving Mechanism (SFFSM), for long-term contracts or vessels operated by the shipowner, and Save as You Sail (SAYS), for short-term contracts [8,14,31,71,82,87]. In these financial models, a third party contributes the initial capital of the investment and obtains a return on the fuel cost savings generated by the efficiency gains derived from the implemented technology [8]. The other parties involved do not have to bear the initial costs and the cost savings generated are shared among the third party, the shipowner and the charterer (depending on who is paying for the fuel) under a tripartite contractual arrangement [8,50].
Public funding and financial incentives by policy makers can serve to lower the risk and cost of capital and can have a catalytic effect on private investments. Jointly to the creation of a low carbon maritime technology fund (Multidonor Trust Fund, (MDTF)) by the International Maritime Organization (IMO) [2,8] these initiatives could also provide the type of capital that would allow companies to test new technologies [37,39,41,49,52,71,88,89].
A multidonor trust fund for GHG-MEPC 74 (May 2019) agreed to establish a voluntary MDTF or GHG TC-Trust Fund to provide a dedicated source of financial support for technical cooperation and capacity-building activities to support the implementation of the Initial IMO Strategy for reduction of GHG emissions from ships [90,91].
Adequate energy management, greater access to information on real costs and better budget management relies on sensitivity analyses to reduce risks and verify the effects of possible future variations on externalities, which are also important for reducing costs from lower energy use [16,39,49,52,83,88,89]. To promote corporate energy efficiency investments, improving the return on investment (through subsidies or low interest loans) will not be sufficient, and information on investment return will not be of much help either. It is necessary to ascertain—and communicate—the impact of energy efficiency investments on the competitive advantage of firms, or in other words, to highlight the strategic character of these investments [92].

2.2.2. Regulation and Policies

Environmental impacts attract the attention of legislators and political organizations, which put pressure on shipping companies to find new ways to reduce their harmful influence on the environment [27,37,41,52,71,83,89]. International shipping was responsible for a large percentage of the increase in Greenhouse Gas (GHG) emissions over 1990 levels (+32%) as compared to road transport (+23%), in spite of the fact that both were lower than international aviation (+129%). Furthermore, global transport is responsible for 14% of the total GHG emissions [93], and in 2017, road transport generated almost 72% of total GHG emissions from global transport, while maritime shipping generated 13.3% [94]. The GHG emissions from road transport are ever increasing [95], accompanied by other gases and air pollutants, such as nitrogen oxides (NOx), carbon monoxide (CO), sulfur dioxide (SO2) from the burning of fuel and reactants producing particulate matter (PM) through chemical reactions in the atmosphere [96].
Regarding maritime shipping, the IMO indicated that international seaborne trade has grown by 500% over the last 40 years, with a commensurate rise in the amount of air pollutants and GHG emissions from shipping [97]. Forecasts point to an increase in emissions of up to 250% by 2050 in shipping [5]. Thus, the need arises to ensure more efficient and environmentally-friendly maritime activity. The IMO could be an important institution in terms of diminishing the negative impact of these emissions [2,8,86], as determined by the role of environmental regulation as a driver [27].
In fact, guidelines in the Emission Control Areas (ECAs) have been created for the control and reduction of emissions in vessels built since 2013 and weighing more than 400 Gross Tonnage (GT), to implement the Energy Efficiency Design Index (EEDI) and increase the efficiency of ships through Ship Energy Efficiency Management Plan (SEEMP). This was carried out under the auspices of the IMO Marine Environment Protection Committee (MEPC) 62nd session (July 2011) with the adoption of amendments to Marine Pollution (MARPOL) Annex VI [98], hereafter referred to as the IMO guidelines. Despite the significant contribution by shipping to climate change, for the sector, this was the first legally binding climate change treaty adopted since the Kyoto Protocol; it came into force as of 1 January 2013 [98,99] and the EEDI and SEEMP were the first mandatory measures that took into consideration the implementation of energy-efficient equipment in vessels, along with the utilization of operational advances. These guidelines are an incentive for EE investment as a result of their mandatory compliance. They also tackle the lack of transparency, reducing barriers related to informational failures, although these initiatives do not yet have the influence to evaluate efficiency throughout the entire sector [8,31,39,82,85,86,100,101]. Therefore, informational aspects must be considered in order to develop an adequate calculation of EEDI or another similar index, as we will comment on Section 2.2.4. External energy audit/submetering may be a relevant driver to consider in this sense.
Furthermore, some global projects executed by IMO to reduce carbon intensity and GHG emissions from international shipping and to support the uptake and implementation of EEMs are: the Global Maritime Energy Efficiency Partnerships Project (GloMEEP Project), the Global Industry Alliance to Support Low Carbon Shipping (GIA), the Global maritime technology network project (GMN project), GreenVoyage-2050 project and multidonor trust fund for GHG (GHG TC-Trust Fund) [90].
The increase in energy prices and their fluctuations are considered drivers because they make it necessary to look for alternative energies or to improve the measures adopted to reduce energy costs [2,14,16,17,31,53,82,89,102]. These variables are considered by Trianni et al. [83] as regulatory factors, and by Thollander et al. [84] as financial factors. These factors are associated with a company’s need to increase or guarantee future dividends [14,16,89,102]; nevertheless, some authors have considered that subsidies may be more effective than energy price increases in promoting energy-efficient technologies [68]. Furthermore, pressure from shareholders and stakeholders can act as a driver to increase the responsible image of companies concerned with Corporate Social Responsibility [2,39,52,82,83,85], as can managers who are committed to energy efficiency, management vision based on activity performance and support for the long-term energy strategies of firms that improve their competitiveness [27,39,103] and also the characteristics of firms and buildings [14,17,37,39,40,62,67,82,89,104,105,106].

2.2.3. Market Based-Mechanisms

Market-based mechanisms, measures or instruments are specified separately [2,6]. In addition to being regulatory or political factors, these would give rise to the generation of funds for the adaptation and transfer of technologies. They are flexible measures that use prices or other economic variables to provide monetary incentives for polluters to reduce emissions [99] or have a political-regulatory nature, as indirect, market-based regulations. Some examples are environmental taxes, the provision of subsidies, various offsetting mechanisms and Emissions Trading System (ETS) usually applied in transport sector. They consist of placing a price on GHG emissions or introducing rates based on the consumption of energy resources, thus increasing the costs of fuel consumption to reduce emissions and promote the adoption of cost-efficient technologies [2]. The carbon emission trading mechanism includes a cap and trade system in which firms or national governments can trade emission allowances under an overall cap (or limit) set by a governmental authority, based on the total amount of carbon emissions [107]. These mechanisms internalize the negative external environmental cost of the emissions by forcing the polluter to compensate for that cost [99]. The cap buyer will pay a charge for emissions, whereas the seller will be rewarded for emissions reductions. Consequently, overall emissions are reduced by rewarding the most efficient companies and less efficient companies are provided with incentives to work toward greater efficiency over time [107]. Carbon emissions would begin to decrease only when the price of carbon exceeds a certain threshold, and the variations in the total costs depend on the carbon cap, as concluded in a road transport study by Li et al. [107]. The European Commission considers the European Union ETS (EU ETS) as an essential regulatory tool for reducing emissions; nevertheless, the shipping industry opposes their inclusion in the system, as previous experience from the aviation industry revealed that regional rules cannot adequately regulate international sectors [99]. Various stakeholders are also concerned that the EU ETS will distort competition and will result in carbon leakage, as well as create a high administrative burden for the industry. ETS in shipping is experiencing growing interest, focusing on investigating the establishment of a global Maritime Emissions Trading Scheme (METS) which could be useful to reduce emissions [99,108,109]. Nevertheless, a global METS without certainty in terms of the price of allowances will result in companies simply offsetting emissions rather than reducing them [99].

2.2.4. Informational and Training Drivers

The lack of confidence data can be considered as an obstacle [44]; having more information would reduce the costs associated with research and risk aversion [6,31]. Accessibility to information reduces the cost of obtaining it, and also favors the dissemination of knowledge about EEMs, harmful emissions or investment characteristics. Consequently, it can also improve communication in an organization, facilitating decision-making by bringing about greater knowledge [17,37], which, together with greater environmental awareness and top management’s commitment to energy efficiency, can promote investment [14,16,39,49,52,59,82,83,85,88,89].
Fuel combustion in industry, transportation and households is an important source of primary pollution (directly emitted into the atmosphere) and secondary pollution (from chemical reactions among the pollutants), and is responsible for climate change [110]. These emissions are challenging to measure, and consequently, the calculation and verification of information about emissions are important aspects to consider in investment decisions [95].
Numerous methods and approaches are used to estimate emissions at different levels (global, national, regional, street, vehicle or vessel level, etc.). Two main approaches are used to calculate emissions from road transport: the approach based on monitoring traffic flows and the approach that uses vehicle registries [111]. Most countries use the Computer Programme to Calculate Emissions from Road Transport (COPERT) model developed for the European Environment Agency (EEA), which requires a number of activity data inputs, including the number of vehicles segmented by vehicle type, fuel and emission standard. Since COPERT requires a difficult process, some authors have suggested other methods, for example socio-economic information for emission estimates [112]. Data from existing registries often cannot be used directly, since it does not accurately reflect the distribution by type and emission class of the vehicles [113,114]. Other forms to calculate emissions are the fuel-based approach [95], Travelling Salesman Problem (TSP) model [107] and bottom-up and top-down estimation. Bottom-up and top-down estimation methodologies are also used to determine emissions in both maritime and road transport [115,116,117,118]. The bottom-up method estimates emissions from statistical analyses of activity data and country-specific emission factors, while the top-down method estimates emissions based on observations [119].
In maritime shipping, EEDI regulations have made the verified calculation of technical energy efficiency for new ships compulsory since 1 January, 2013 [98]. Nevertheless, there is no definitive database with the vessel’s EE and emissions information for existing fleets. Consequently, shipowners and charterers have to work with estimates of EE computed from the key ship parameters. Fleet estimates are even used to form the baseline curves stipulated by IMO guidelines [42,98]. A similar approach is taken in the formation of the Existing Vessel Design Index (EVDI) [120,121]. The EVDI measures each ship’s theoretical carbon dioxide (CO2) emissions per nautical mile travelled [121], and can be applied to existing vessels as well as new builds (where EEDI is not available/applicable). It generally yields a somewhat higher value than the EEDI (referencing the aim for vessels of emitting less CO2 per tonne transport than their peers) and the median difference between the EVDI and EEDI is 5% (thus making the EVDI more conservative) [120,121,122]. EVDI information can be even verified to guarantee the quality of information about vessel emissions and EE [121,123]. Rehmatulla et al. [31] believe that increased public funding, which would incentivize ship owners to test new technologies, would also bring about the collection of useful information on their operation.
Obtaining energy efficiency or saving certificates [14,104,124], the initiatives of the EU to improve the ease with which verified and reliable information on the operation of vessels (Monitoring Reporting and Verification (MRV)) [85] may be obtained, the adoption of international standards, such as ISO 50001, which may favor the implementation of operational measures [49,85] and energy audits that identify aspects which require improvement [83] are all drivers related to regulation and policies and, at the same time, informational drivers that can help to reduce informational failures. Internal training factors, related to the promotion of professional training programs, and external factors, related to technical support for companies in the sector by technology providers, ESCOs, EEMs installers, etc., can also contribute to promoting EE investments [2,16,39,53,82,83,85].

2.3. Previous Empirical Studies on Barriers, Drivers and their Influence on Energy Efficiency Investments

Blumstein et al. [37] suggested decades ago that barriers are interconnected, and the factors causing the energy efficiency gap may affect investment decisions [11]. They were among the first authors to consider split incentives between owners and occupants of residential dwellings and to conducted a semistructured interview and case study suggesting a landlord–tenant issue. Weber [125] indicated that it is difficult, empirically speaking, to determine why investment projects in energy efficiency with a good cost-effectiveness ratio are not materializing, due to the intangibility of the barriers. Furthermore, the literature has focused more on elaborate taxonomies and the categorization of barriers and drivers than on empirically studying their influence on EE investment; therefore, empirical evidence in this field is scarce, especially as it pertains to maritime shipping.
Empirical studies have obtained data and analyzed barriers, drivers and EE investment through various research methods, such as the mixed method approach or a combination of qualitative and quantitative methods, that can combine surveys, questionnaires, interviews and/or focus groups; and econometric and statistical studies using discrete choice models, Probit, Logit or Tobit regressions. Consequently, this section will firstly comment on empirical papers based on the mixed method approach (also considering some reports and case studies with similar approaches in this section), and secondly, on those based on econometric and statistical analyses, considering that decisions to invest in different firms and sectors are impacted by similar, yet not identical factors [27]. The general studies will be considered first, followed by shipping studies.

2.3.1. Mixed Method Approach Studies

Blumstein et al. [37] were the first to systematically analyze the causes of the energy efficiency gap; one of the first empirical studies was the work by Velthuijsen [106], who used a mixed method approach (interviews and a self-administered questionnaires) to compare the perceived and calculated potential of adopting EEMs and the actual level of implementation. He identified the barriers and their effect on the basis of a survey of Dutch firms, examining the decision-making process for the adoption and the price elasticity of energy. He states that in order to introduce incentives for investment, the government may take additional actions, alongside energy taxes, such as the increased availability of information and subsidies.
Other authors also used the mixed method approach in different sectors to analyze the factors which influence EE investment decisions, how they operate and the extent to which public policy or organizational change may help to overcome them. Some conclusions from their studies are that the main barriers and drivers fall within the economic and organizational categories [88,126], barriers within group-owned companies are more closely related to organizational problems, and barriers within private industries are more closely related to informational problems [38,53].
Ownership, split incentives, the principal–agent problem and informational aspects were also considered important. Few papers have verified the split incentive problem, in terms of its very existence or quantification. Murtishaw and Sathaye [29] conducted the first research that attempted to do this for US residential energy use, providing a methodology and a matrix that assigned households to various principal–agent cases. They assessed the potential size of the split incentive problem and estimated that as much as 35% of residential energy use in the U.S. is potentially affected by it, based on the number of dwellings affected by misaligned incentives. The IEA [11] compiled quantification studies from different sectors that show that the pervasiveness of the principal–agent problem ranges widely by sector and country. Based on different types of leases for rental offices or landlord–tenant relationships, it has been seen that renters are not willing to pay more rent for energy-efficient spaces, or there is a lack of energy efficiency premiums; thus, landlords are unable to recoup their investment and are less likely to invest [22,23,24,52].
Vernon and Meier [34] investigated principal–agent problems in the trucking sector, in which the contracts and stakeholders are very similar to those of the shipping sector, using Murtishaw and Sathaye’s [29] principal–agent matrix. There is little empirical literature exploring evidence of this issue in road transport; nevertheless, Vernon and Meier determined that there is an usage problem in 91% of the trucking fuel consumption, because the truck driver does not pay for fuel costs, and lacks any incentive to engage in fuel-saving operations. Furthermore, they revealed that 23% of tractor trailers are affected by an efficiency problem, because owners of rental trailers do not pay for fuel, and contracts for rentals do not monetize the fuel efficiency of tractor trailers. Carbon War Room [127] also identified split incentives between truck owners and those that pay for fuel. Klemick et al. [128] explored investment decisions within the heavy-duty trucking sector pertaining to fuel-saving technologies. They relied on focus groups and interviews to gain insight into what factors might explain apparent underinvestment in fuel-saving technologies. They found that there are split incentives between owners and drivers. Other factors they found to be important were tradeoffs between fuel economy and the uncertainty and risk associated with new technologies, if decision-makers are loss averse. Graus and Worrell [79] analyzed the principal–agent problem in a company leasing cars for executives in the Netherlands through a case study. Despite the fact that the company’s cars were newer and employ diesel engines, the authors verified that their fuel efficiency was worse than that private cars, since they are larger and were driven longer distances compared to private cars. These results show that principal–agent, efficiency and usage problems can occur. The lack of awareness and the lack of credible information about new technologies and technology performance also contribute to the slow adoption of some technologies in road transport [128,129].
The payback period is a commonly used criterion by companies to evaluate investments [38,88,129,130]. This occurs in such a way that if it exceeds a certain value or if the company lacks capital, investments seem not to occur, and even if an energy-efficient technology is economically viable and the company has access to capital, they still might not be made [38].
Authors also consider that the characteristics of companies, vehicles and buildings, such as size and age, matter when investing [17,102,128,130], and investment decisions are the result of an interaction between external and internal factors of a company, conditions of potential adopters and characteristics of the technologies [102]. Other important barriers are technical risks, the cost of production, inappropriate technology, the lack of time and other priorities, a lack of access to capital and poor organization. The highest ranked drivers are associated with cost reductions resulting from lower energy use, people with real ambition, long-term energy strategies, the threat of rising energy prices and the electricity certificate system [16].
Companies need to prioritize energy management and the reduction of energy costs as a result of drivers [17,52]. Some authors have recognized that energy audits and consultants are important in overcoming barriers and ensuring profitability [38,53,130], with a high level of implementation of recommendations. Other factors to consider are regulatory aspects, such the introduction or increase in tariffs for consumed resources and polluting emissions [88], public policies and policy intervention to promote the diffusion of EEMs through regulations and public financing [38,52,102,130]. Voluntary government EE programs should be flexibly designed and implemented to accommodate the many different barriers [131].

2.3.2. Econometric and Statistical Studies

Regarding the application of econometric and statistical analyses to EE investment study, the most widely used techniques were the discrete choice model; Tobit, Probit and Logit regressions (binomial and multinomial); conditional demand model, etc., using data from databases or questionnaires that make it possible to verify the real impact of barriers and drivers. We will comment on some of the most relevant papers, applying these techniques. Authors applying these methods have studied the influence of barriers and drivers on EE investments, attitudes towards them and policy implications, considering aspects such as the sector of activity, the characteristics of firms, commercial buildings and dwellings, the type of tenure and the investment decision, the selection of different EEMs or aspects related to the EEMs adoption. Some authors have studied EE investment decision as a binomial factor, binary decision or as the possibility to invest or not [25,27,28,32,33,67,68,105,124,132,133].
One of the most important barriers to investment is related to property: the investor–user dilemma, or the landlord–tenant or principal–agent problem [6,30,31,56,74,105,134,135,136]. Furthermore, the lack of information, knowledge and awareness [26,54,62,136], with varying levels of importance in terms of barriers across different sectors, subsectors, firms and measures, presents itself as a major barrier.
Brechling and Smith [56] focused on UK households, showing small income-related effects that suggest no barriers to capital access, whereas home ownership was the only socio-economic characteristic that influenced EE investment decisions. Similar to Brechling and Smith, Scott [136] stated that owners of dwellings do not invest in energy saving items due to a lack of information, nonappropriability, small potential saving, restricted access to credit and transactions costs. Gillingham et al. [66] studied the presence of wall and attic insulation and showed that this presence is more likely in owner-occupied dwellings where the resident pays for heating or cooling, and Krishnamurthy and Kriström [135] analyzed survey data on 11 Organization for Economic Co-operation and Development (OECD) countries, finding positive effects of ownership on investment in energy-efficient appliances, due to the fact that owners are substantially more likely than renters to have access to them. Charlier [74], Dato [137] and Davis [138] observed that ownership positively affects the adoption of EEMs when a housing unit is owner-occupied. However, if a housing unit is renter-occupied, landlords are not inclined to make EE investments because they do not pay the energy bill and tenants are the ones receiving the energy savings.
Levinson and Niemman [21] found that contracts which include energy costs in rental payments have positive effects on investment, since landlords of heat-included apartments may provide more EE to minimize costs or may lease them with utilities included to signal their efficiency. Nevertheless, contracts which do not include energy costs have negative effects on investment, because, in this case, the landlord can have more difficulties to recoup his/her investment, and might not invest in EE [21,138].
Hill [139] indicated that significant regional differences exist in the determinants of residential energy expenditures, and that principal–agent problems appear to be an unimportant factor in energy efficiency in Austria if efficiency investments are the only mechanism considered. Although it was conceivable that owners and renters may have different characteristics that determine annual energy expenditure, the variable he used may fail to detect these differences; nevertheless, he confirmed that household energy expenditures per square meter were actually higher for owners than renters.
Hellman Miller et al. [140] estimated the likelihood of the adoption of EEMs in the residential sector in the US, with a focus on the principal–agent problem, and found that rental units with heat-inclusive rents were less inclined to conserve energy. Moreover, EE investment is more likely to occur during later periods of tenancy, when relations between landlords and tenants might be better established [134,135,137,141].
Tenants have high energy expenditures related to energy-inefficient building characteristics, due to the fact that they are generally poorer than landlords and they are unable to invest [74]. In the commercial office sector, Kontokoska [132] stated that the ownership type and local market do, in fact, influence retrofit decisions, providing evidence for the importance of understanding ownership type and the varying motivations of different types of owners in EE investment decisions. Schloman and Schleich [105] explored factors driving the adoption of low cost EEMs in the tertiary sector and found that the landlord–tenant dilemma holds for the adoption of all low-cost EEMs considered, complementing the existing literature about high cost EEMs in the tertiary sector [62]. Scleich and Gruber [62] suggested that the investor–user dilemma is not only a barrier to EE in private households, but also in the commercial, as well as in most private and some public services sectors and Olsthoorn et al. [134] observed that organizations that rent or lease their work spaces are less likely to adopt EEMs. Cooperative apartment buildings are significantly more energy-efficient than buildings with rental apartments. Moreover, public ownership has a negative impact on EE, as cooperative apartment buildings are owner-occupied and the usage problem of split incentives is mitigated, since the benefits from improving the EE go directly back to the users in the form of lower monthly fees and higher property values [142].
Some authors found that financial barriers may impede investments, especially for small firms [54]. Others found that high investment costs and other priorities or more attractive opportunities than EE investment [25,68,89] are relevant barriers [134]. Nevertheless, some authors have stated that they were of no relevance [26,92] and that the least relevant barriers are the technical risk to production and risk to product quality [134].
Firm or dwelling characteristics, such as age or size, environmental and efficiency characteristics, household consumption characteristics and the characteristics of residents and their relationships (socioeconomic variables, pro-environmental households, attitudes, etc.) can influence EE investment decisions [25,32,33,74,133,136,137,142,143,144] or decisions to join efficiency programs and initiatives [67]. The likelihood of investing is influenced by dwelling and industry-specific characteristics, the energy efficiency gap is less likely to exist in large and well-performing firms [27] and investments also occur more frequently in newer and larger dwellings or firms [32,33,66,137,144,145,146]. Households in urban areas, married couples, residents belonging to higher income classes or with higher educational levels are more likely to adopt EEMs, while older residents are less likely to do so [32,33,140,144].
Abadie et al. [25] focused on manufacturing enterprises and found that firms located in the states with the highest GHG emissions levels and with the most stringent environmental regulations were the most likely to invest in EE. These authors, Anderson and Newell [68] and Achtnicht and Madlener [143] confirmed that payback time and investment costs are determining factors in deciding whether to invest in EE, as adoption rates are higher for projects with shorter payback times, lower costs, greater annual savings, higher energy prices and greater energy conservation [68] and the probability of investing decreases as the payback time increases [25,143]. People who have already made such investments are more likely to be more motivated to make additional investments. Furthermore, trust in researchers, scientists and experts has a positive effect on both decisions [137]. The lack of financial support, low priority, economic loss during new technology replacement, technology uncertainty, less pressure on energy prices and a relatively high preference for short-term profitability may hinder companies in making investment decisions [147].
Investment can be encouraged by providing and strengthening financial incentives and support [27,28,105,147] through subsidies and policies related to public financing [89,103] and focusing on low-income tenants and third-party financers [74]. This is supported by the facts that landlords, who are able to afford EE investments, are more likely to invest [143], and that subsidies may be more effective in promoting energy-efficient technologies than energy price increases [68,133]. However, Schlomann and Schleich considered that higher energy prices can act as a driver [105] Favorable tax treatment for efficiency improvements [89,103] and carbon pricing policies [147] also can promote investment, although Charlier [74] believes that tax credits are ineffective in the split incentives context. The willingness of the consumer to apply for financing, noneconomic motivations and needs like comfort, convenience and belonging can also facilitate investment [124,133,148]. If applied to shipping, comfort and convenience do not seem to be directly extrapolated [124]. Kontokoska [132] commented that it is necessary to consider and account for the ownership type when designing and implementing building EE policies.
The economic potential for cost savings, cost reduction and energy savings is considered an important driver behind investment decisions [54,89,133,143,148]. Aravena et al. [124] indicated that the decision to invest in EEMs is mainly driven by economic factors, such as gains in energy savings and the private cost of the measures. Foreign ownership and managerial expectations of future demand only impact EE investments, while clean technology investments are influenced by managerial expectations of the future business conditions of the firm [27,141].
The dissemination of information [147], informing and educating the public through various information sources [27] and targeted information provision [54] may be useful to facilitate company investment in efficient measures. Schlomann and Schleich [105] suggested that knowledge transfer from the parent company to a subsidiary enhances the diffusion of low-cost EEMs, and that public-sector organizations are more likely to adopt energy management. Aravena et al. [124] suggested that the focus should be placed on providing information about the benefits of the EEMs in order to increase the adoption of EEMs by households. Furthermore, certification should be provided to inform consumers about the energy performance of a building relative to similar buildings [142]. Hrovatin and Zorić [28] showed that, in addition to professional energy audits, other information sources (constructor, public consultation, media, etc.) could also play a significant role in fostering energy-efficient retrofit decisions. Emission taxes can play an important role, but flexible standards, subsidies and information measures are also particularly important [146].

2.3.3. Maritime Shipping Sector

With regard to the shipping sector, there have been relatively few empirical studies that have investigated factors that influence EE investments and the principal–agent problem. Much of the literature consists of industry, consultancy or nongovernmental (NGO) reports, IMO paper submissions, EU research, reviews and theoretical papers. Most empirical studies are based on the mixed method approach and interviews with industry experts and providers of the technologies, or Marginal Abatement Cost Curve (MACC) and few constitute econometric and statistical studies. Nevertheless, econometric and statistical studies such as the discrete choice model, Logit or Probit used in the aforementioned previous studies in other sectors (Section 2.3.2) could be applied to the maritime shipping sector, since investment situations and the principal–agent problem are similar therein, as described in Section 2.1.3.
One of the first empirical studies by Gordon [149] identified barriers to five EEMs, using an online questionnaire with a similar framework to other works, but it lacked methodological rigor and quality [30]. Hill [150] used semistructured interviews to investigate barriers to uptake measures derived from a MACC modelling, following the established taxonomy of barriers, comparing the perception of barriers with those observed and proposing policies for the removal of these barriers. Other authors also have focused on the analysis of the probability of investment and the order in which the various existing options could be implemented using the MACC method, a graphical method that indicates the marginal cost of reducing emissions for varying amounts of emissions [43,45,50,151]. However, this method presents certain shortcomings in the field of maritime transport, due to an incomplete representation of costs and low-risk representation [6]. It also fails to show the actual rates of implementation of EEMs. Faber et al. [45] provided a comparative analysis of the MACCs that have been produced so far for the shipping industry, and Maddox Consulting [50] provided a comprehensive analysis of measures available for reducing CO2 from shipping at negative cost. The results showed that the implementation rate of measures was between 50% and 75%, and indicated the relevance of split incentives as a barrier.
The principal–agent problem, split incentives and informational asymmetries are among the most relevant causes for the energy efficiency gap and significant barriers to EE investment. Kollamthodi et al. [58] and Faber et al. [43] mentioned that vessels can be affected by the principal–agent problem, without going into great detail, providing empirical data or modelling. Bergantino and Veenstra [152] specifically investigated the principal–agent problem in shipping contracts from an economic perspective, focusing on the informational asymmetries while ignoring the split incentives branch of the theory and agency theory in the context of energy efficiency. Johnson and Andersson [153] focused on barriers related to information asymmetries and power structures within organizations; they considered principal–agent problems and power structures to be among the possible causes for energy efficiency gaps.
Agnolucci, Smith and Rehmatulla [42] focused on studying the cost savings perceived by the charterer and how they can be recovered by the shipowner to encourage him/her to invest in EEMs. The authors concluded that only 40% of the financial savings delivered by energy-efficient technology were perceived by the shipowner, due to the principal–agent problem. Rojon and Dieperink [2] concluded that the barriers could be overcome with a greater dissemination of knowledge of wind propulsion technologies, alternative financial mechanisms, market-based mechanisms, and greater political and regulatory involvement.
Authors such as Rehmatulla [30] and Rehmatulla and Smith [6,31], who considered that empirical studies on shipping field had not made full use of the mixed method research as used by empirical studies in other sectors, focused on examining how different economic barriers and investment parameters influence the adoption of EEMs, and also studied the principal–agent problem and examined effects on EE investment in shipping. They based their work on previous research [11,29,34] and applied greater methodological rigor, combining data extracted from surveys and analyzing charter contracts. The authors selected situations in which a principal–agent problem could arise, framed them within the four basic cases (commented on in Section 2.1.3) and estimated the end-users affected by the principal–agent problem and the energy consumption of vessels. Their studies showed that split incentives are also perceived as one of the most important barriers to the implementation of EEMs, followed by information failures, risk and costs. Technical factors and legal and managerial issues can also pose major obstacles to investing in EEMs on vessels [41].
To overcome barriers such as the lack of capital, conflicts of interest and informational problems, one driver to consider could be financing through third parties and financial models capable of bringing about the adoption of fuel-efficiency and alternative fuel technologies that profitably reduce fuel use and resulting GHG emissions [6,8,30,31,41]. Regulation can help overcome barriers [41], but it would require greater implementation of EE and CO2-reducing technologies than those driven by current regulations alone [154].

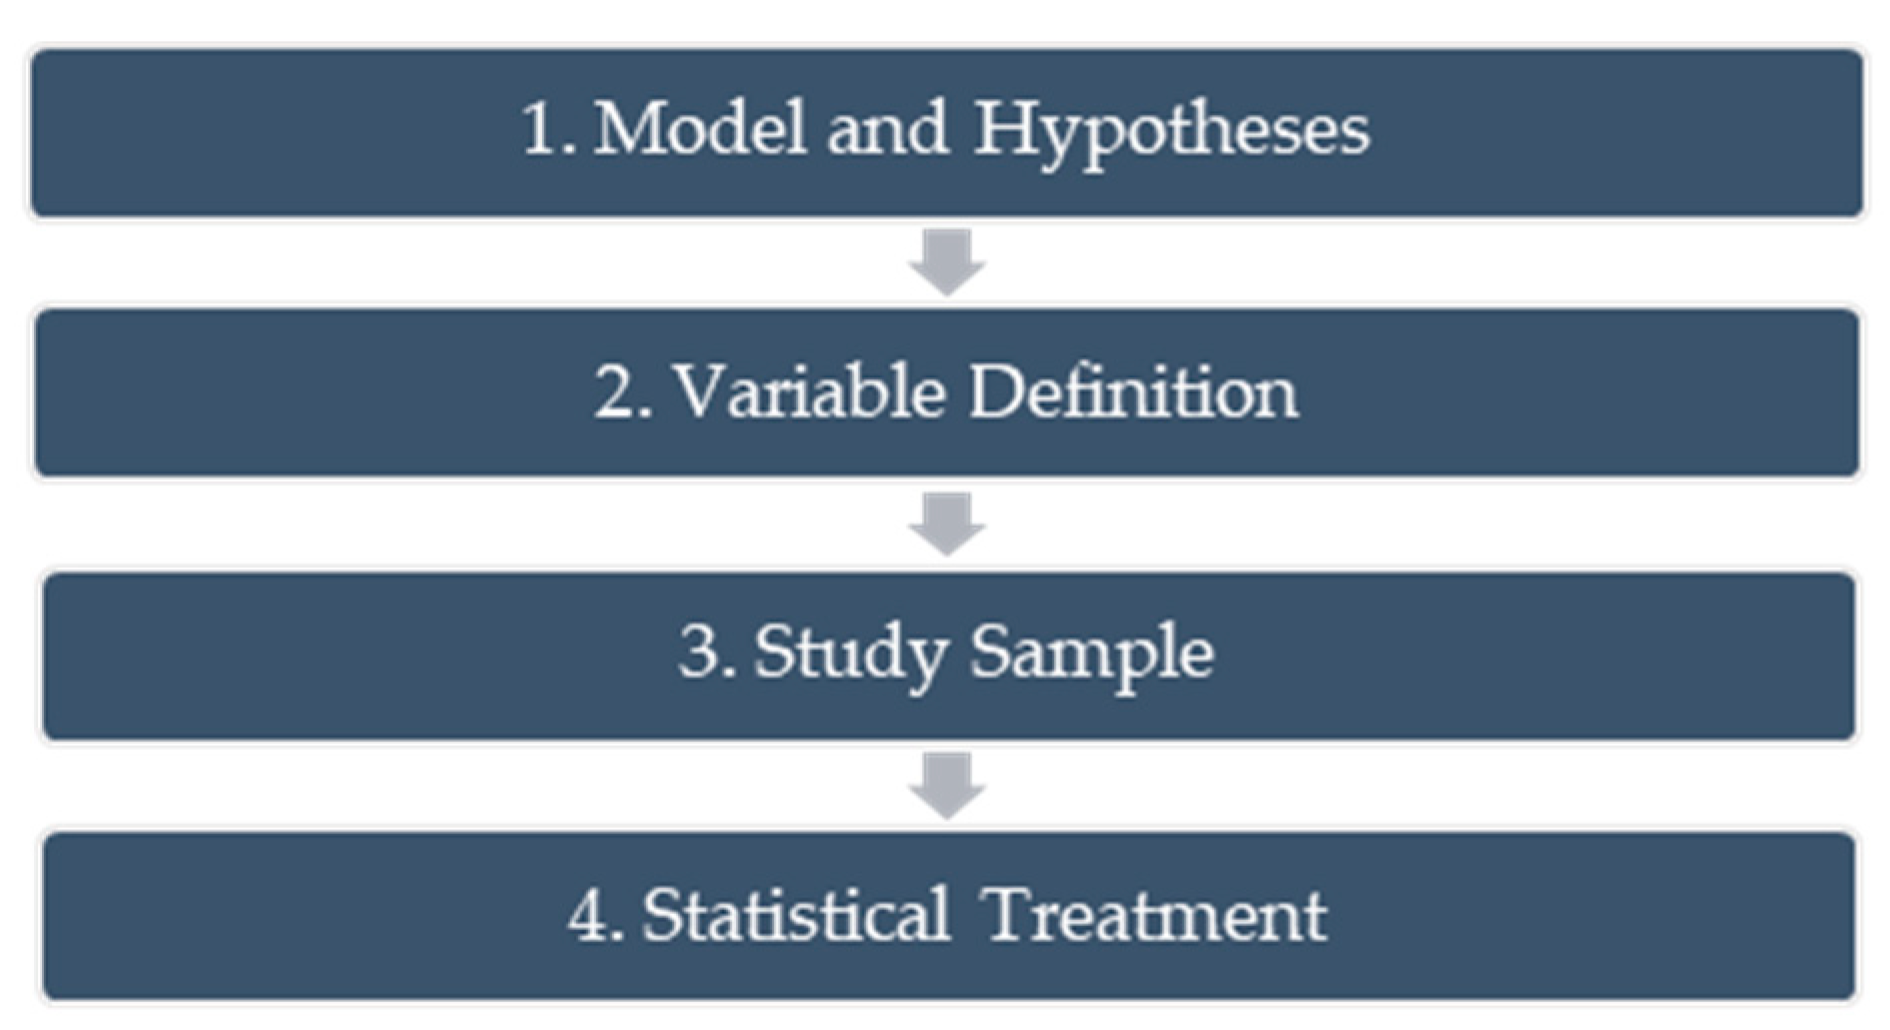
3. Methodology and Data

In our literature review, we observed that the barriers and drivers which impact EE investments have scarcely been explored from an empirical point of view, especially in shipping, or from a principal–agent perspective. Three reflections can be made when examining the literature: the general classification of barriers and drivers to EE investment can be transferred from a general field to maritime shipping, with the appropriate adaptations, since, despite the different names and particularities of each sector, most authors identify similar barriers and drivers in residential, commercial, industrial and transport sectors; EE investments can be understood from the logic of the principal–agent problem, based on different cases of agency relationships and contracts; and the econometric and statistical procedures from general field can be applied to maritime shipping to improve the quality of studies in this field.
The main points to address in order to improve the literature are: the lack of data to create adequate models and the difficulty in finding them; the lack of rigor in previous research processes; the scarce application of econometric and statistical techniques to corroborate the real impact of barriers and drivers in maritime shipping sector; the predominance of conclusions based only on theoretical frameworks, questionnaires with low response rates and authors opinions, rather than econometric and statistical models and verified data; and the adaptation of interesting empirical models from other sectors, e.g., residential, commercial and industrial sectors, to the maritime shipping sector.
The research problem addressed in this paper focuses on investments made in energy efficiency in the maritime shipping sector when there is a principal–agent problem between the shipowner and the charterer. The objective is to observe the type of factors that affect the investment decision and how they influence it, and, assuming there is a principal–agent problem, the type of principal–agent problem that arises.
The methodology applied in this empirical research consisted of a four-phase process (Figure 1). First, the state of current research (examined in Section 2) was considered to identify which barriers and drivers from the literature review could be the most interesting to study. Based on this, first, the model and the hypotheses were formulated; second, the variables were defined to allow the pertinent analyses to be carried out; third, a process of searching for, compiling, merging and filtering the data was carried out to create a study sample and obtain the defined variables; and finally, the statistical treatment was presented, consisting of a descriptive analysis of the variables and an explanation of the selected empirical method to estimate the model and test the hypotheses that had been formulated, i.e., binomial logistic regression.

3.1. Model and Hypotheses

With the objective of the study in mind, and based on economic rationality and a literature review, the hypotheses and predictable relationships for the model were formulated, indicating that a positive relationship is expected when a factor encourages investment in energy efficiency, while a negative relationship is anticipated when a factor inhibits it.
Some vessel characteristics, such as age or size, or certain factors, such as regulation or information, can act as either drivers or barriers. For example, it may be appropriate to invest in an EEM in a vessel with certain characteristics, but not in others. This can be due to the fact that heterogeneity is a barrier to investment in one type of vessel, but not in another, the characteristics of which promote investment. In the case of regulation, it may or may not favor investment, depending on its purpose. Finally, in the case of information, if it is accessible and verified, it can be a driver, and if not, information can be a barrier.
Next, the formulated hypotheses are presented (Table 4), associated with the barriers and drivers that will allow them to be analyzed. Justification is provided as to why they were considered appropriate, based on the previous literature.
The general characteristics of the vessels, such as age or size, can be important factors that allow us to determine how the particularities of each vessel influence the EE investment decision. They allow us to observe the effects of market barriers, such as heterogeneity, since the same technology can be profitable and have a given emission reduction potential for a given class of vessel, route and merchandise, but not for others [17,19,22,44,45,67], and they can act as either barriers or drivers.
The active age of the vessel is expected to have a negative effect on the probability of investing in EE, with investments in older vessels being less likely than in newer vessels (H1). This is because older vessels have exhausted more years of their useful life than younger vessels, and therefore, may not have sufficient time left before decommissioning to recover high outlays, such as those that can bring about improvements in energy efficiency [22,23]. This circumstance can result in advanced age acting as a barrier, since payback is an important element to consider in investment projects, which are usually only applied to ships whose remaining lifetime allows the investment to be fully recovered over the years included in the annuity calculation [25,43,68,143]. The longer it takes to recover the investment, the greater the risk, and if the operating time that a ship has left is less than the payback time, the capital cannot be recovered, so the investment would not be attractive.
Characteristics such as vessel size can also condition the investments. A positive effect of size is expected on the probability of investing in energy efficiency (H2) [32,33,66,133,137,142,143,144,146], given that in larger ships, energy consumption and emissions could be higher, so reducing costs and decreasing the negative impact on the environment become relevant and necessary goals.
Although older age and smaller size act as barriers to investment, younger age and larger size act as drivers, so the same type of characteristic can either inhibit or promote investment, depending on its quantity. This is consistent with heterogeneity, since it would mean that investments are more likely to be made in newer and larger vessels.
In addition to the general characteristics of vessels, knowing their activity can help us to understand why EEMs are implemented in some types of ships and not in others. A positive effect of the activity on the probability of investing in energy efficiency (H3) is expected, since the intensity of maritime traffic entails a higher negative impact on the environment and an increase in energy consumption that can be reduced with the adoption of EE investments. Consequently, the most energy intensive companies are more likely to adopt EEMs [62,105] to enhance their image in relation to Corporate Social Responsibility [2,39,52,82,83,85] as a long-term energy strategy to improve competitiveness [27,39,104].
Split incentives and principal–agent problems that arise in the shipowner–charterer relationship are relevant market failures [2,6,30,31,35,36,42,58,145,152]. Vessels can be operated under various types of freight contracts, and depending on their typology, the impact of the principal–agent relationship between the shipowner and the charterer on investment decisions can be observed. The Time Charter (TC) contract is associated with agency and efficiency problems, and the Voyage Charter (VY) contract is associated with agency and usage problems, as explained in Section 2.1.3. Based on this, a negative effect of TC contracts is expected on the probability of investing in energy efficiency (H4), because in TC, the shipowner makes the investment decision and the charterer pays the energy bill. Therefore, the shipowner will be less willing to make investments from which he/she will not be able to obtain or adequately recover energy savings. In turn, a positive effect of VY contracts is expected on the probability of investing in EE (H5), because in VY, the shipowner makes the investment decision and pays the energy costs or energy bill, and may have a greater predisposition to implement EEMs [6,21,29,30,31,34,78]. Knowing the type of contract under which each vessel operates can be useful to understand how each principal–agent relationship case affects the investment decision [6,11,26,29,30,31,32,33,34,42,54,56,62,74,105,132,134,141,150].
Another interesting area of study are environmental and efficiency characteristics. A positive effect of the level of emissions is expected on the probability of investing in energy efficiency (H6), since a very high level of emissions implies more pollution, and investment can be increased to reduce its negative impact on the environment, acting as a regulation or political driver [25,42,54,74,121,134,137]. These characteristics allow us to observe how high levels of emissions can place pressure on shipping companies to reduce their impact on the environment and improve their green and responsible image through more efficient investment and management. Uncertainty about the operation of the technologies to be installed or the environmental impact of a vessel may be a market barrier to investment, due to the lack of reliable information. This can be related to informational failures when, on the one hand, imperfect and asymmetric information helps to create a principal–agent problem and, on the other hand, the existence of verified and accessible information can boost investment [25,26,28,32,33,54,62,124,137,141]. Considering the availability and quality of information about the environmental and efficiency characteristics of the vessel and vessel emissions, this information is expected to be relevant in two ways: when the information is verified, a positive effect is expected on the probability of investing in energy efficiency (H7) and, therefore, more and better available information is more likely to act as a driver of investment. However, when the information is not verified, information asymmetries may arise, and in these cases, the lack of information and its low reliability are expected to have a negative effect on the probability of investing in energy efficiency (H8), in such a way that less and worse available information is more likely to represent a barrier to investment [25,26,28,32,33,54,62,125,141,142].
Regulation is another factor to consider when making EE investment decisions. Uncertainty about future regulations can inhibit investment, but some regulations can boost investment, acting as a driver. It is expected that the IMO guideline for the control of emissions and the reduction thereof in vessels built since 2013 and weighing more than 400 GT, the IMO MEPC 62nd session (July 2011) with the adoption of amendments to MARPOL Annex VI [98] would have a positive effect on the probability of investing in energy efficiency (H9), since, given the lack of incentives to invest, it may be necessary for a higher institution to impose rules that help solve environmental problems. Before 2013, the lack of a regulation of this nature could be considered to have slowed down or failed to incentivize investment in EEMs [25,26,27,54,74,86].

3.2. Variable Definition

In this section, the type of information needed to test the formulated hypotheses is specified and the variables are defined. Their inclusion is considered to be appropriate, based on the justification of the hypotheses and the previous literature.
Given the scarcity of empirical literature focusing on the impact of economic barriers and drivers in maritime shipping, applying econometric and statistical studies and addressing the issue from principal–agent problem, the variables used in other areas, such as the residential or industrial sectors, were applied and adapted to this study. Work with EE in the shipping sector is not straightforward [155], and considering applications in other sectors can help us provide useful insights for shipping managers and politicians. The period chosen for the study covers 2006 to 2019 inclusive, and only vessels larger than 10,000 Dead Weight Tonnage (DWT) are taken into account. Furthermore, only Bulk Carriers or vessels dedicated to the transport of bulk cargo will be considered, due to the fact that within maritime shipping, they are one of the main areas of interest, because they are responsible for a large share of the CO2 emissions in the industry [30].
First, the investment decision was considered as variable (INVDEC), and second, the general characteristics of the vessels were considered, such as the age of the vessel in active use (AGEAC) or the vessel size (SIZEM), vessel activity per year (RACT), the characteristics of the types of contract under which each vessel operates (CTC), the environmental and efficiency characteristics of the vessel (EVDI), the quality of information about its characteristics (VINFOB) and regulation (also studied with AGEAC).
INVDEC (EE Investment Decision): the investment decision was considered as variable, since the purpose of the study is to analyze the effects of barriers and drivers on shipowner’s investment decisions and the probability of investing. When an investment in EE is made for the vessel, the variable will be assigned a value of 1, while when no investment is made, a value of 0 will be assigned. Thus, this is a dichotomous variable, since there are only two options: investment or no investment in EE [25,27,28,32,33,67,68,105,124,137].
AGEAC (Age of the vessel in active use and IMO guidelines) and SIZEM (vessel size): the general characteristics of the vessels can be important factors that allow us to determine how the particularities of each vessel influence the EE investment decision. They can be measured by variables such as the age of the vessel in active use (AGEAC) and vessel size (SIZEM), which allow us to observe the effects of market barriers, such as heterogeneity, since the same technology can be profitable and have a different emission reduction potential for one class of vessel, route and merchandise, but not for another [17,19,22,44,45,67].
AGEAC, as the age of the vessel, could be measured in years; nevertheless, in our study, it will be grouped to reflect the IMO guidelines in the youngest group [98,99] and to simplify the model and give it greater flexibility (since there are more groups and more coefficients). The decision was made not to create an excessive number of groups, because the more there are, the more closely the model fits the sample. The IMO guidelines, as mandatory regulations for EE, emissions and maritime shipping, will act as a driver of investment. Incorporating this aspect into the model can help us to understand the impact of regulations on investment [25,26,27,54,74,86]. Since this regulation is based on the age of vessels and the year of a vessel’s construction, we can use the same variable to analyze the effect of vessel age and the effect of the IMO guidelines.
If the data about age of the vessels is not available, it must be considered that in order to obtain AGEAC, we can subtract the year of a vessel’s construction from 2020 to obtain the years that the vessel had been operating prior to the last year analyzed (2019). For instance, a vessel built in 2013 will have and age of 7 years. The years will be grouped into three categories: Young vessels (YV) with ages between 0 and 7 years inclusive; Medium-aged vessels (MV) aged 8 to 14 years inclusive; and Old vessels (OV), older than 14 years. This classification allows us to address the regulation with the same variable as age, since the YV group coincides with the vessels for which the IMO guidelines are mandatory, vessels built after 2013 (inclusive) or with and active age of 7 years (inclusive) and weighing more than 400 GT [98]. As only vessels larger than 10,000 DWT are taken into account, all exceed 400 GT. Consequently, AGEAC is a qualitative variable that let us test H1 and H9.
RACT (Vessel activity per year): some authors use export activity, expected demand, sales or intensity of activity in the case of firms [2,5,26,62,68,71,105,137,145]. Knowing the number of contracts that a vessel received in the analyzed period (2006–2019) can help us to determine the intensity of its activity. Nevertheless, considering that the year of build of some vessels can be later than the first year of the analyzed period, we will calculate the rate of activity by dividing the number of contracts received for vessels constructed before 2006 by the difference 2020–2006 (i.e., 14 years), and the number of contracts received for vessels constructed after 2006 by the difference 2020 - the year in which the vessel was built. RACT is a quantitative variable that allows us to test H3.
SIZEM will be measured in DWT divided by 1000 due to the variable scale will be adapted to the model. This is a quantitative variable which allows us to test H2. The scale of SIZEM must be adapted due to the huge values that can exist for the size of a vessel. Most authors included variables such as the characteristics of the dwellings, households, firms or vessels in their empirical studies on EE investments decisions [27,30,32,33,124,137,142,143,144,146] as variables, using number of employees to define the size of a firm or m2 to define the size of a dwelling. Agnolucci et al. [42] included GT in their study, rather than the more meaningful DWT, and the sign on the former variable was contrary to expectations. Since larger vessels are capable of transporting more cargo, one would expect a positive effect of this variable on charter rates. We hope to improve upon the work of Agnolucci et al. by using DWT.
CTC (type of contract under which each vessel operates): this variable can be useful to understand how the principal–agent relationship case and the principal–agent problems, associated to each type of contract, affect investment decisions [6,11,29,31,32,33,34,42,54,56,62,74,103,132,134,141,150,154]. For each operation carried out by each vessel, the type of contract can vary. We will consider the most frequent type of contract under which the vessel operates to classify it within a principal–agent problem or type of contract (Case 2 and TC or Case 4 and VY), in a similar way as chartering ratios defined in the maritime shipping literature [30]. Consequently, the number of TC and VY contracts that each vessel has will be grouped to create a variable that shows us the effects of the principal–agent problem on the probability of investment in EE. Vessels that only operate under TC contracts or that have more contracts of this type than VY will be classified as TC. Vessels that only operate under VY contracts, or have of more such contracts than TC or a similar number of contracts, will be classified as VY. The CTC variable will be created by assigning the value 0 to VY and the value 1 to TC, associating each type of contract with a type of principal–agent case: principal–agent and efficiency problems (Case 2 or TC contracts, value 1) and a principal–agent and usage problems (Case 4 or VY contracts, value 0). Consequently, with CTC, we can study the influence of principal–agent problems through the type of contract. This variable will, in turn, allow us to test H4 and H5.
EVDI (Existing Vessel Design Index): regarding the environmental and efficiency characteristics of the vessel, it is relevant to observe the amount of harmful emissions of each vessel and their efficiency. Emissions, energy consumption and energy savings in relation to energy efficiency renovations are highly pertinent factors that can influence investment decisions [74]. In spite of some EE investment studies having used CO2 emissions from states as an indicator of pollution levels in the area of study [25], or emissions savings estimations with PROMODUL software [74], in this study, we will focus on emissions at a vessel level measured in grams of CO2 per tonne nautical mile from each vessel [42,121], since it is an adequate piece of data for vessels, as we saw in the literature review. The variable was named EVDI, since this is the index that measures each ship’s theoretical CO2 emissions per nautical mile travelled, developed by RightShip [120,121]. The EVDI can be applied to existing vessels as well as new builds (where the EEDI is not available/applicable), it generally yields a somewhat higher value than the EEDI and the median difference between the EVDI and the EEDI is 5%, making EVDI more conservative [120,121,122]. EVDI can serve as a static indicator, but it is useful to obtain a general idea of the vessel efficiency level in terms of emissions, as considered by RightShip [121]. It is a quantitative variable that will allow us to test H6.
VINFOB (quality of information about emissions): environmental and efficiency characteristics can be related to informational failures and the quality of information whereby, on the one hand, imperfect and asymmetric information helps to create a principal–agent problem and, on the other, the existence of verified and accessible information can boost investment. Some authors have included variables such as information in their empirical studies [25,26,28,32,35,62,124,137,141]. The variable that we will use to indicate the quality of information is named VINFOB; this variable indicates whether the information on emissions from a vessel (EVDI) has been verified by a classification society, such as a nongovernmental organization [121,123]. It will be obtained by assigning the value 0 to vessels for which this information has not been verified and 1 to those for which it has. This is a dichotomous variable which will allow us to test H7 and H8.
Table 5 shows the variables that could be useful to measure each of the factors to be analyzed and test the hypotheses, the variable description, the unit of measurement and type of variable, as well as the studies on which their incorporation into the model has been based. While the units of measurement from our variables are not always the same as those in previous studies, they are nevertheless consistent with them, similar, adequate or justified in the variable definition, as they have been appropriately adapted to maritime shipping sector. Even in the maritime shipping sector, some units of measurement were improved, such as those pertaining to the size of the vessel, using DWT instead of GT, and some concepts have been presented as variables, based on literature review. It should be noted that each variable can help to test more than one hypothesis.

3.3. Study Sample

This section discusses the process for obtaining the data from the study sample, which consisted of two phases: search and data collection and data merging, debugging and transformation.

3.3.1. Data Collection

After having defined the variables (Table 5) that can help us to understand the decision to invest in energy efficiency, we searched for data that reflected as closely as possible the essence and characteristics of each of the items. Data collection required intensive search efforts due to the diverse nature of the variables to be analyzed (which required consulting various sources) and the paucity of public or accessible sources containing the information that was needed.
The sources consulted were Refinitiv Eikon from Thomson Reuters [156] and the Rightship organization [121,157] (Table 6). Data were collected at a vessel level.
Information was collected from 2006 to 2019 inclusive. Information on general vessel characteristics, such as size and age, and on aspects related to activity and principal–agent relationship cases, was obtained from Eikon. Data related to environmental and energy aspects, the quality of the information and related to EE investments were obtained from Rightship, after presenting the purposes of the investigation and a summary of the work to be done to the sustainability manager of the organization. Anonymous information was used at all times; in this way, the privacy and confidentiality of the data of shipowners, charterers, vessels and organizations was guaranteed. Institutional sources such as the IMO, specifically mandatory regulations on Energy Efficiency for Ships in MEPC 62 (July 2011) with the adoption of amendments to MARPOL Annex VI [98], were consulted to determine the legal factors.

3.3.2. Data Merging, Debugging and Transformation

Once the necessary information was collected, the data were merged into a single sample. R version 3.4.4 [158] was used for this task. Since the unit of measurement is the data per vessel, and each vessel is identified with a common IMO code, the data from the four databases were unified using this common code. First, all ships were selected, except those with an IMO code equal to 0. Second, a phased merger was carried out, keeping all Base 1 vessels and crossing them with matches in Bases 2, 3 and 4. We proceeded in this manner because all Base 1 vessels are bulk type and have relevant information to address principal–agent problem. The sample was made up of 112,744 microdata items. After the merger, the sample was purified by means of the following steps:
  • Vessels with incomplete data were removed.
  • Vessels with a weight of less than 10 K DWT were removed.
  • Vessels that did not have associated a shipowner and charterer in the sample were removed. Without this information, it is not possible to verify (in this case) whether or not there are split incentives, a necessary condition for a principal–agent problem to exist. If charterer = shipowner, there are no split incentives, whereas if charterer ≠ shipowner, there are split incentives.
  • Vessels for which the type of contract under which they operate is not indicated were removed, because without this information, it is not possible to know what type of principal–agent problems may exist.
  • Vessels in disrepair or decommissioned vessels were removed.
All the vessels in the sample may have a conflict of interest or split incentives, since charterer ≠ registered owner, so it is a valid sample in terms of this study, focusing on observing how the type of existing principal–agent problem influences investment in EEMs, as opposed to how the existence of an agency problem influences this same investment. This condition was assumed based upon the literature, and verified according to this data. Some vessels were reflected more than once, because the same vessel may have more than one contract and more than one EE investment in the period of time studied, so that when the bases were merged, several rows appeared for the same vessel with repeated data. To avoid duplicates, a sample with unique values per vessel was prepared, resulting in one row with an IMO code for each vessel. In turn, in order to avoid losing information on contracts and investments, a frequency table was created with this information, obtaining for each vessel the total number of contracts, the number by type of contract and whether or not it made any investments. A sample with 6750 unique vessels was obtained. The sample size is large enough to make statistical inferences and produce reliable estimates.
To reflect the variables defined in the data from the study sample, some of the study sample data were used directly as model variables (collected variables), while other data were adapted or subjected to some sort of transformation (variables based on the authors own work). INVDEC, EVDI and VINFOB was used directly as collected variables. INVDEC and VINFOB were assigned values of 0 and 1, as they were defined as dichotomous variables, and EVDI was obtained from the EVDI data or emissions measured in grams of CO2 per tonne nautical mile from each vessel, as calculated by Rightship.
AGEAC is a variable based on the authors own work, due to the fact that the study sample data about the age of a vessel was the year of build and we had to transform it. To obtain AGEAC as defined, we subtracted the year of build from 2020 to obtain the years that the vessel had been operating prior to the last year analyzed. Moreover, AGEAC were grouped into classes to simplify the model and give it greater flexibility (since there are more groups and more coefficients), and to reflect the IMO guidelines in the YV group, according to AGEAC definition provided in Section 3.2. The decision was made not to create an excessive number of groups, because the more there are, the more closely the model fits the sample. The variable scale of SIZEM was simply adapted to the model and is the result of dividing DWT by 1000.
Other variables, such as RACT and CTC, required information that the data sources did not provide. Consequently, these variables had to be obtained by other means.
RACT was obtained by preparing a frequency table of the number of contracts each vessel had in the analyzed period, reflecting the intensity of its activity. Nevertheless, considering the variable definition and that the year of build of some vessels was later than the first year of the analyzed period, we calculated a rate of activity per year by dividing the number of contracts received by vessels constructed before 2006 by 2020–2006 (14 years) and the number of contracts received by vessels constructed after 2006 by 2020—the year of build of the vessel.
Regarding to CTC, the data collected indicates the type of contract (TC or VY) for each operation carried out by each vessel and allow us to determine how the principal–agent relationship case associated with each type of contract affects the investment decision. Consequently, the CTC variable had to be obtained by preparing a frequency table of the number of contracts each vessel had in the analyzed period in each category (TC or VY) and grouping them as explained in the variable definition. As defined, vessels that only operate under TC contracts or have more contracts of this type than in VY were classified as TC, and vessels that only operate under VY contracts or have more such contracts than TC (or similar number of contracts) were classified as VY. The CTC variable was created by assigning the value 0 to VY and the value 1 to TC, associating each type of contract with a type of principal–agent case, i.e., principal–agent and efficiency problems (Case 2 or TC) and a principal–agent and usage problems (Case 4 or VY).

3.4. Statistical Treatment

After the literature review, it was found that some of the empirical studies on EE investments used Probit and Logit models to observe the factors that influence investment decisions, to see how they were related to them and/or predict the investment decision. Authors such as Bauwens and Eyre [159] and Ramos et al. [144] affirmed that the results of the Probit and Logit models are very similar, both theoretically and in their empirical application.
In this work, after a descriptive analysis of the variables indicating ranges, means and standard deviations or frequency distributions, we opted for the formulation of a binomial logistic regression, which is commonly referred to as a Logit model of dichotomous response in econometrics [160,161]. With this binomial logistic regression, we can determine the probability of making investments in energy efficiency in situations with a principal–agent problem, since a dichotomous dependent variable will be presented with two options: investment or no investment in EE. Multiple linear regressions cannot be used in this context, since the dependent variable (Yi) and perturbation (εi) of each equation cannot follow a normal distribution or have constant variance, because consistent estimators of the model coefficients cannot be obtained, nor can the hypothesis of linearity between the observed values be fulfilled [162].
This model serves to calculate the probability of investing for each vessel, which lets us classify vessels into two groups, according to their general and environmental characteristics, vessel activity, regulation, type of contracts or principal–agent problems and quality of information: vessels in which the shipowner is likely to invest in energy efficiency and those that are not. This allows us to determine which factors influence investment decision and the intensity with which they do so. In this way, we can also corroborate which factors represent a barrier or a driver for investment decisions. The relationship to be studied will be that between the dependent variable (Y) and the independent variables (or interactions between them) (Xj); the functional form of this relationship will be given by Expressions (1) and (2):
Y i =   β 0 + j = 1 n β j X j i + ε i
Y i = x β + ε i
The relationship between Y and each Xj in the binomial logistic regression model estimates the probability that Y = 1 will occur, given the values of Xj. It is expressed by the following Function (3):
Pr ( Y i = 1 ) = 1 1 + e ( β 0 + j = 1 n β j X j i ) = 1 1 + e Y i
where Pr (Yi = 1) is the probability of occurrence of Y for an individual i, and e is the base of the natural logarithm and n is the number of regressors, which, in this case, are the same as the variables. A linear relationship is thus proposed, albeit not with the study variable, but rather utilizing the logistical transformation of its probability. In the case of logistic regression, the model is estimated by minimizing the maximum-likelihood function, which is an analogous approach when evaluating how much information remains to be explained after the model has been estimated:
L L = i = 1 N [ Y i ln ( Pr ( Y i = 1 ) ) + ( 1 Y i ) ln ( 1 Pr ( Y i = 1 ) ) ]
The maximum-likelihood function takes on values close to 0 when the predicted probability is successful in classifying the case as 0 or 1. In the event of a mistake, it tends towards large values, in such a way that the estimated coefficients β will be those that minimize the maximum-likelihood function.
Regarding the structural interpretation of the model, the significance of each estimated coefficient will indicate whether the influence of its factor on the investment decision is statistically significant. The significance of the estimated coefficients was analyzed with a Wald test or likelihood ratio test of the overall significance of the model. The sign of the estimated coefficient will indicate whether it is a barrier or a driver, and how the variable influences the investment. The standardized coefficient will allow the relevant factors to be ranked according to their level of influence on the investment decision when they have different metrics, as in this case. Each predictor is measured in standard deviation units with standardized coefficients, and may therefore be compared equally. We shall define the standardized coefficient of the estimated coefficient β j of the factor X j with the formula:
β j · σ ( X j ) · π 3
where σ ( X j ) is the standard deviation of X j and π 3 is the fixed standard deviation of the logistic distribution.
INVDEC (EE Investment Decision) was established as a dependent variable (Y), while the independent variables (Xj) were general characteristics of the vessel, AGEAC (age of vessel in active use and IMO guidelines), considering YV as reference level in the regression, associated with regulation (IMO guidelines) and SIZEM (vessel size); the vessel activity represented by RACT (Vessel activity per year); the cases of principal–agent relationships and problems represented by CTC (type of contract under which each vessel operates); the amount of harmful emissions and efficiency of the vessel EVDI (Existing Vessel Design Index or emissions) and VINFOB (quality of information about emissions). When testing the hypothesis, we applied a significance level of 0.05.

4. Results and Discussion

In this section, we present a descriptive analysis of the variables included in the model (Table 7), the results of the binomial logistic regression (Table 8) used to empirically contrast and test the formulated hypothesis and, subsequently, a discussion of the results with the hypotheses validation (Table 9).

4.1. Results

Different combinations of variables were tested in the defined model, starting with a model that included only collected variables, and with a model that included variables created by the authors. Finally, it was decided to use a combination of both types of variables, as described in Section 3.2 and Section 3.3 and Table 5 and Table 7, since, due to their particularities, some variables required using the data collected, while others had to be subjected to some sort of transformation, and also because their interpretation seemed more appropriate in terms of the reviewed literature. Furthermore, a model with variables in logarithms was estimated, although it is not discussed, since taking the logarithms of the variables did not reduce the heteroscedasticity of the residuals while making the interpretation of the results less intuitive.
Once the estimation of the binomial logistic regression model was made, the results that appear in Table 8 were obtained.

4.2. Discussion

According to the previous results, our next step was to carry out the hypotheses validation and discussion in order to draw the main conclusions.
As can be seen in the significance column in Table 8, all the variables contained in the model were shown to be statistically significant using a Wald test, with significance levels of less than 0.05, and in most cases, under 0.001. This model has a goodness of fit of 0.2612194 using McFadden’s Pseudo R2. It is an acceptable result in logistic regression, according to Liao and McGee [163]. Below, we comment firstly on the influence on EE investment of each variable, and, secondly on how they influence it, that is to say, if the variables act as barriers or drivers, inhibiting or promoting the investment, respectively.
The standardized coefficient column of Table 8 shows that the most influential variable from our model is the rate of vessel activity per year (RACT), followed by the emissions (EVDI), the age of the vessels in active use and the IMO guidelines (AGEAC) and the quality of information about emissions (VINFOB), which have a similar influence on EE investment decisions in absolute terms. The size (SIZEM) and the principal–agent case or type of contract under which each vessel operates (CTC) are the factors with the least influence on investment in this model. This result may be due to the facts that both types of contracts (TC and VY) have principal–agent problems, and we studied the influence of principal–agent problems according to the type of contract, rather than the influence on the investment decision of the existence or not of principal–agent problems. In addition to the comparison of the greater or lesser influence of each factor, it is important to analyze the direction of their influence on investment to determine whether they inhibit or promote it, due to the fact that the difference among the values of some variables can be considerable, in spite of their modest influence.
All predicted hypotheses and relationships with the dependent variable were validated, as the signs observed in Table 8 for each of the variables contained in the model point in the same direction as the predictions made in the formulation of hypotheses (Table 4). The validation of the signs is shown in Table 9 and interpreted below.
The general characteristics of vessels referring to age show, with a negative sign in Table 8, that the probability of investing in EE decreases as the vessel ages, and therefore, that investment is less likely in older vessels (AGEAC_OV) than in newer vessels (with AGEAC_YV being considered as reference level in the regression) and less likely in Medium vessels (AGEAC_MV) than in newer vessels (AGEAC_YV); and therefore, H1 is met (Table 9). This may be due to the fact that the time available to recover the investment is shorter in older vessels, as they have a smaller margin of useful life. The AGEAC variable also reflects the effect of the mandatory regulation on energy efficiency for ships or guidelines by IMO [98], which drives investment in newer vessels, due the fact that we considered vessels built from 2013 as being in the AGEAC_YV group, for which minimum EEMs, EEDI and a SEEMP are required. It was verified that in vessels with this obligation, the probability of investing increases, since investment is less likely as the vessel ages (AGEAC), and therefore, it is more likely as the vessel reduces its age, as in the AGEAC_YV group, that contains vessels built from 2013. Therefore, H1 and H9 are fulfilled.
These results are in agreement with previous studies that point out that newer firms or dwellings are more likely to undergo EE investments, while older age can act as a barrier [22,25,32,38,68,130,143,144,146]. Usually, the lifetime of a vessel is between 20–25 years, so EE investments are only applied to vessels whose remaining lifetime allows the investment to be fully spread out over the years included in the annuity calculation [43,44], since the longer it takes to recover the investment, the greater is the risk, and adoption rates will be higher for projects with shorter payback times. Some authors considered regulation to be an important driver, and proposed that it can serve to introduce or increase tariffs on the resources consumed and polluting emissions [17,88] or establish policies to promote EE investment [17,38,52,102]. In this study, we saw that regulation, such as guidelines from IMO, can promote investment and help overcome barriers to adopt EEMs and implement EEDI and SEEMP [26,41,54,62,152,153,154].
Regarding vessel size (SIZEM), the estimation indicates, with a positive sign, that the larger the vessel size, the greater the probability of investment in EE; as such, H2 is met. This may be because larger vessels tend to have higher freight rates or better contracts and, therefore, could offer a better guarantee of income generation and investment recovery that encourages the implementation of EEMs. It could also be due to the fact that larger ships pollute more. According to the Odds Ratio of the SIZEM variable (Table 8), for each 0.001 DWT that the size of a vessel increases, the probability of investing versus that of not investing increases by 1.0113 (i.e., for each DWT, it increases by 1011.3). This result is consistent with previous studies in which authors verified that size influences the EE investment decision, with the energy efficiency gap being less likely to exist in large and well-performing firms and dwellings [27,32,33,66,144,146].
Regarding the activity of the vessel, the estimates for the RACT variable indicate, with a positive sign, that the greater the rate of vessel activity per year, the greater the propensity to invest in EE; thus, H3 is met. This may be due to the fact that a vessel with more contracts implies an increase in maritime traffic and, consequently, the emissions of polluting gases will be greater, as will the energy costs [1,2,3]. This situation can encourage the quest for greater EE through the implementation of EEMs for various reasons, e.g., reducing the environmental impact, reducing the energy bill or because on ships with intense activity, the return on investment may be faster [26,27,30,42,62,68,105,145]. A more energy-efficient vessel could be attractive to charterers who want to hire more efficient ships, thus making the investment decision more attractive. According to the Odds Ratio of the RACT variable, for each additional contract per year that a vessel has, the probability of investing versus that of not investing increases by 2.6790.
The type of contract under which a vessel operates (CTC) lets us observe how the principal–agent relationship between the shipowner and charterer influences on EE investments. We studied two types of principal–agent relationships in Section 2.1.3: Case 2, through TC contracts, with principal–agent and efficiency problems; and Case 4, through VY contracts, with principal–agent and usage problems. In both cases, the principal–agent problem can hinder investment; nevertheless, the results in Table 8, with a negative sign, indicate that a vessel which operates under more TC contracts than VY contracts has a decreased probability of investing in EE, as compared to vessels that operates under more (or similar) VY contracts than TC contracts, thus confirming H4 and H5. Consequently, estimates indicate that TC contracts or Case 2 of the shipowner–charterer relationship, as well as split incentives, principal–agent and the efficiency problems that it implies, are relevant barriers to EE investment, which is consistent with the literature, demonstrating that using the binomial logistic regression method, which is more commonly applied in the residential sector, can be as useful as other methods previously commented in maritime shipping to analyze principal–agent problems [6,11,22,23,29,30,31,34,35,36]. The results observed may be due to the fact that in TC contracts, the shipowner cannot recoup investment easily through freight rates, because he/she does not pay the energy costs or energy bill, but rather, the charterer pays it, and, consequently the shipowner does not benefit from energy savings from retrofits and has little incentive to invest.
According to the Odds Ratio of the CTC variable, when a ship has more TC contracts than VY, it is 0.7043 times less likely to invest in EE as compared to not investing in EE, than in a vessel with more (or similar) VY contracts than TC contracts, an interesting and considerable difference. Although it is a complicated subject and there can be principal–agent problems in both two types of contracts, the shipowner has fewer incentives to invest in EE in TC contracts [6,29,30,31,34,42]. This fact is consistent with principal–agent problems in other sectors. In residential and industrial sectors, investment is more likely when the landlord/owner/agent who own his/her home assumes the cost of investment [66,74,135,140] and tenants/renters/principals are less likely to have access to EEMs, and thus, do not invest in them [56,74,105,132,134,141]. Furthermore, contracts which include energy costs in rental payments have better effects on investment than contracts in which tenant assumes the energy bill. Nevertheless, if the landlord does not include energy costs, he/she can have more difficulties to recoup his/her investment, and might not invest in EE [21,140]. In the trucking sector, Vernon and Meier [34] presented results which are consistent with those of this paper, demonstrating that trucks are affected by an efficiency problem because owners do not pay fuel costs and rental contracts do not monetize fuel efficiency. Furthermore, in shipping, split incentives are also perceived as an important barrier to the implementation of EEMs [6,30,31]. This may be due to the fact that only 40% of the financial savings delivered by energy efficiency are passed on to shipowners, due to the principal–agent problem, and they have few incentives to invest [42].
Regarding informational failures, the VINFOB variable shows, with a positive sign, that when the information is verified, the probability of investing in EE increases, since it improves the quality of the information, and there are more guarantees that it is reliable and true. In contrast, when there is a lack of information or this information is not verified, a barrier to EE investment arises. This confirms H7 and H8, and according to the Odds Ratio of the VINFOB variable for each point that the verified information increases, the probability of investing versus that of not investing is 3.4111 times higher in vessels with verified information than in vessels with unverified information. Knowing whether the information on efficiency and level of emissions is verified is important, since certifications should serve to inform charterers about the energy performance of a vessel. This can provide shipowners with a verified indicator of the performance of their vessel in order to decide whether to invest or not, just like energy efficiency certifications inform consumers and renters of buildings by making comparisons to similar buildings [142]. Informational asymmetries and access to verified information are important barriers and drivers, respectively, as many authors have shown in their studies. They consider informational asymmetries and the lack of information, knowledge and awareness to be a cause of energy efficiency gaps and low levels of investment [26,54,62,152,153], and dissemination of knowledge about EEMs to be a driver [2,28,54,105,141], thus supporting the results from our study.
The environmental and efficiency characteristics of the vessels were analyzed by means of the EVDI variable, which shows how polluting a vessel is through its emissions. The results in Table 8 indicate that the more emissions a vessel generates, the more the probability of investing in EE increases, probably to reduce its harmful impact on the environment. According to the Odds Ratio of this variable, for each gram of CO2 per tonne nautical mile that a vessel’s emissions increase, the probability of investing in EE, as compared to not investing in EE, increases by 1.8917 times in vessels with higher emissions. This may be due to the fact that the management and reduction of energy consumption and harmful emissions are highly relevant issues that have become key points for business and political decisions, oriented towards environmental protection and greater energy savings. In addition, firms with high emission levels or located in regions with high levels of emissions are more likely to invest in EE; as such, it was expected and confirmed that vessels with high levels of emissions are more likely to invest, which is consistent with the literature [7,8,25,42,54,74,121,137].

5. Conclusions, Limitations and Future Lines of Research

The existence of barriers to EE investment in maritime shipping, especially market failures related to the principal–agent problem, makes its study of great interest regarding understanding what can be done to reduce impact and to determine the drivers that could be of help, both to public and private entities, when it comes to overcoming them. In this section, we summarize the principal conclusions of our study, we comment on research limitations and we consider some lines of future research.

5.1. Conclusions

Our model gives us evidence that supports the ideas found in the reviewed literature, in such a way that all the considered factors (barriers and drivers) are significant and the direction of their influence on EE investment decisions or the probability of investing is coherent with the hypothesis. We found that shipowners are more likely to invest in EE in vessels with a higher rate of activity or a higher number of contracts per year, since this can imply a higher level of emissions, due to the increasing trend in maritime trade; this is the most influential factor from the analyzed variables when it comes to investing or not.
Vessel emissions, the age of vessels in active use, IMO guidelines and verified information have a similar influence on the EE investment decisions. We found that shipowners are more likely to invest in vessels with higher emissions, since this implies a harmful impact on the environment, and shipowners may feel pressure from stakeholders. Nevertheless, it must be considered that the EVDI focuses on technical performance rather than operational performance, since a vessel with a low EVDI is not always a vessel with low emissions; it can also be affected by adverse weather conditions. Regarding information, we saw that the higher the quality, the more it will boost investment, since verified information acts as a driver for investment, and unverified or a lack of information act as a barrier; the difference among the influence of verified and unverified information is considerable. The age of the vessel is also relevant. The probability of investing in EE decreases as the vessel ages; therefore, investment is less likely in older vessels than in newer vessels. This may be due to the fact that the time available to recover the investment is shorter in older ships, as they have a smaller margin of useful life. The IMO guidelines act as a driver of investment due to the fact that they are mandatory in all the vessels built after 2013 (inclusive), and we confirmed that regulations can have a positive effect on EE investment. Regarding the type of contract under which a vessel operates and the size of the vessel, these parameters have less influence on investment decision than other analyzed variables; nevertheless, they are significant and allowed us to confirm the formulated hypotheses.
In this paper, we confirmed that the type of contract under which a vessel operates is a significant factor, and the shipowner is more likely to invest in EE when a vessel has more TC contracts (principal–agent and efficiency problems) than VY contracts (principal–agent and usage problems), with TC contracts serving as a barrier to EE investment. This variable in our model is significant and very useful to observe the effects of freight contracts on the probability of investing, and to validate the hypothesis. Nevertheless, as the type of contract under which the vessel operates variable has been defined, the fact that a vessel has more TC contracts than VY and, therefore, there is a principal–agent and efficiency problem between the shipowner and charterer (Case 2), does not seem as influential as other variables on the investment decision. This may be due to the fact that additional or different types of data might be needed in the study sample to reflect the influence and study the principal–agent problem and split incentives effect, since this is a complicated issue to address and a relatively novel subject. Or perhaps, since both types of contracts imply principal–agent problems, the variable used could be more adequate to analyze the influence of having an efficiency or usage problem on the investment in different EEMs (technical or operational) rather than their influence on investing or not, since the literature states that ships operating under TC contracts are more likely to carry out operational EEMs, while ships operating under a VY contract are more likely to carry out EEMs of a technical nature [30]. Consequently, a greater influence of the type of contract could perhaps be found considering different types of EEMs, as opposed to simply determining whether to invest or not.
Size acts as a driver; the larger the vessel size, the greater its influence on the probability of investment. This may be because larger vessels could offer a better guarantee of income generation and investment recovery, thereby encouraging the implementation of EEMs, or due to the fact that larger vessels pollute more, which is in line with the effect of the rate of activity and EVDI.
In general, it can be said that the findings of this study are consistent with those of the reviewed studies, and corroborate the proposed hypotheses. As there are few empirical, econometric and statistical studies on economic barriers and drivers to EE investments in maritime shipping from the perspective of the principal–agent problem, the main contributions of this work lie in: corroborating the existing general and shipping literature on EE investments; demonstrating that empirical research such as binomial logistic regressions can be extrapolated from other sectors and applied to the maritime shipping sector; and demonstrating that when investing in vessels, there are certain similarities to the principal–agent problems observed with dwellings, firms and another modes of transport, such as trucks [6,11,29,30,31,34,35,36]. Moreover, we studied the principal–agent problem from the perspective of the most frequent types of contracts under which a vessel operates, based on cases of principal–agent relationships from the literature [11,29,30,31,34], and we considered specific regulations which apply to the maritime shipping sector.
Economic growth models lead to a situation with negative impacts on the environment and high levels of energy consumption, with most energy consumption growth occurring in road and maritime transport in 2017 in the EU-13 [164]. In trying to alleviate this and solve the most serious problems of climate change and energy consumption, there is no doubt that EE has become a highly relevant issue that is closely linked to the measures that are being imposed by governments and institutions [98]. Regulation, policies and interventions by higher-level organizations are necessary, since the Sustainable Development Goals (SDGs) in the field of energy, climate change and shipping, due to their magnitude, require states to join forces and create initiatives [165]. In this way, we are witnessing an increase in legislation, mandatory regulation and guidelines and policies. Any of these initiatives that directly or indirectly helps to reduce payback time, increase funding, reduce barriers to EE investment or control emissions, such as the IMO guidelines, must initially be seen as an option worth bearing in mind and should be targeted on a priority basis by public sector policies. Instruments such as tax deductions, subsidies, public financing, facilities to access loans and taxes on pollution-causing activities can be reasonable options to encourage EE investment [25,146]. Furthermore, policies could focus on the role of shipowner–charterer market failures—especially those relating to principal–agent, efficiency and usage problems.
However, it is necessary to identify and communicate the impact of EE investments on the competitive advantage of firms, in other words, to highlight the strategic nature of these investments [92] and the environmental benefits that they can bring about, since even though it is sometimes necessary to resort to superior or governmental bodies that impose mandatory EE standards and create investment incentives, it would be also desirable for other actors in society (banks, shipowners, charterers, etc.) to get involved in this challenge. Greater implementation of EEMs is required beyond those promoted by current regulations alone [154]. To help reduce principal–agent problems and boost investment, it may be necessary to create new financing formulas such as third-party financing, proper budgetary management, and to get the involvement of shipowners and charterers [8,31,41,74].
Different actors do not only account for the negative impact upon the environment which results from poor energy and environmental management of economic activity; they can also use the information and knowledge generated on an academic level and the experience of their daily operations to act on solid and proven bases and focus on how to resolve this situation, attempting to find common goals that allow them to work for the prosperity of the maritime shipping sector and for a more sustainable future. Maximizing business profit should not be the only beacon that guides maritime shipping; it must go hand in hand with sustainability, since EE improvement and energy cost savings are not incompatible with a prosperous business. Moving forward in the study of the barriers and drivers of EE investments, analyzing shipowner–charterer relationships and unravelling the keys to implementing EEMs without harming any of the parties involved should be a priority on the agendas of shipowners, charterers and governments, since it can place a strategic sector at the forefront of innovation and sustainability.

5.2. Limitations of the Research

Difficulties and limitations were found in aspects related to data sources and the adaptation of theoretical concepts to the empirical model in a sector with scant empirical literature that could serve as a guide. Obtaining data for an empirical study of these characteristics required intensive effort dedicated to searching for, compiling and creating the study sample, as well as a great deal of thought to identify the best and most rigorous way possible to apply theoretical aspects to real quantitative and qualitative data, ensuring that all the necessary nuances and empirical aspects extrapolated from other different sectors had been accounted for. For this purpose, the literature on barriers, drivers, principal–agent problems and investments in energy efficiency, as well as those from other sectors and shipping, was used. The primary example of this pertains to the dwelling or industrial sectors, in which the principal–agent problem has been studied in greater depth to identify similar indicators that can be extrapolated to the transport and maritime fields.
The diverse nature of the indicators analyzed required consultations of different sources and working with various databases to create the study sample. Some databases were limited, private or contained confidential company information, and certain data had to be transformed, since the necessary information could not be extracted directly from the original data. It should also be noted that there was no information on the exact date on which EE investments had been implemented, although all of them belonged to the study period considered (2006–2019), and the situation of the companies involved could not be compared before and after the investment; rather, the probability of investing based on vessel characteristics and barriers and drivers information from a time range was considered. Moreover, our study considered the static efficiency of each vessel through the EVDI variable. This variable indicates the grams of CO2 per tonne nautical mile travelled that a vessel is expected to generate, taking into account, principally, design characteristics. After investment, we implicitly assume that an investment will produce the same or greater efficiency at a certain point in time. EVDI do not vary significantly if operational measures are implemented, but can vary if technological or design measures are implemented. EVDI can be applied to existing vessels as well as new builds (where EEDI is not available/applicable); in spite of being a static indicator, EVDI serves as a useful variable to obtain a general idea of the level of a vessel’s efficiency in terms of emissions, as considered by RightShip.
Focusing the study, i.e., mainly on vessel characteristics, the principal–agent problems, split incentives, the lack of information that hinders EE investments based on the type of contract under which a ship operates and on drivers, it was considered that financial information related to capital constraints was not essential; therefore, this was not included in the analysis [105]. Financial factors are important, but can represent secondary influences on investment decisions, whereas the strategic nature of an investment can be a primary influence on decision-making [92]. Some of this information is related to the amounts disbursed by shipping companies in their investments, on their economic situation and financial structures, cost, access to capital and capital constraints, the priority of EE investments over other types of investments, indebtedness and sources of financing or financial incentives. This type of data may be confidential or appear in databases with restricted access.
The observed low level of influence of the type of contract under which a vessel operates, as noted previously, may have been due to the fact that additional or different types of data might be needed in the study sample to reflect the influence of this factor, as well as to study the principal–agent problem. Before Rehmatulla [30], who applied a similar variable definition to address the principal–agent problem through the type of contract under which a vessel operates, there was no previous research on maritime shipping that suggested that this was a pertinent or stable variable. Nevertheless, he stated that research from other sectors has used similar variables based on the types of contract or tenure, such as rented dwellings, owner-occupied dwellings, rental contracts or household tenure, to measure the principal–agent problem, as noted in the variable definition [11,29,32,33,34,54,56,62,105,134,145]. Or perhaps, since both type of contracts (VY and TC) imply principal–agent problems, the variable used could be more adequate for analyses of the influence of an efficiency or usage problem on investments of different EEMs, rather than their influence on the decision to invest.
Market failures, such as environmental and energy security externalities and the inability to capture the benefits of their research, were not included, as the benefits of reducing externalities are frequently treated separately in energy efficiency analyses, and are not considered part of the energy efficiency gap [23,48]. Risks such as uncertainty regarding fuel prices are more difficult to transfer to a study such as this one, since each ship can operate with different types of fuel, buy fuel in different markets or be affected by externalities [6,43,44]; furthermore, for some of the ships in the sample, these types of data were confidential or were not available.
Other aspects that could be interesting to study are the hidden costs. It could be necessary to have information on the period of time used for the implementation of the investments made.

5.3. Futures Lines of Research

For future research, it could be interesting to reflect some of the barriers and drivers in the model that were not included in this work in order to understand the influence of this type of factor on EE investment in a more global manner, such as financial barriers related to capital constraint risks, uncertainty regarding fuel prices and hidden costs, e.g., the loss of the collection of freight rates caused by the implementation of improvements outside of the dry dock period or during periods greater than the time that the ship is out of service. Furthermore, an issue worthy of further study is to differentiate among the types of EEMs in which there would be greater propensity to invest, and the influence of factors on each type of EEM, rather than only focusing on the decision to invest, or not, in EE. Such a differentiation study could be based on existing cases of the principal–agent problem and shipowner–charterer relationships to determine whether the influence of type of contract is higher on different EEM investments, as the literature states that ships operating under TC contracts are more likely to carry out operational EEMs, while ships operating under VY contracts are more likely to carry out technical ones [30].
Perhaps additional or different types of data are needed in the study sample to obtain a greater vision of the reality of the issues related to barriers, drivers and the principal–agent problem. There are many possibilities before us that we must recognize and take advantage of in the best possible way. The sea offers us the opportunity to be connected in a rich, changing global world. The least we can do is reflect on how we can give it back a little of what it gives us. Innovation requires imagination, knowledge, reflection and a willingness to face new challenges. But it also requires support, facilities, breaking new ground and smoothing out the obstacles that appear.

Author Contributions

The individual contributions from each author are specified: conceptualization, investigation, resources, visualization, supervision, project administration and funding acquisition, Á.L.-A. and A.C.-S.; methodology, validation, formal analysis, data curation, writing—original draft preparation, writing—review and editing, Á.L.-A., A.C.-S., J.-B.P.-L. All authors have read and agreed to the published version of the manuscript.

Funding

This research was supported by Consellería de Cultura, Educación e Ordenación Universitaria, Xunta de Galicia, grant number Ref. ED481A-2015/224 “Axudas á etapa predoutoral” Galician Plan of Research, Innovation and Growth 2011–2015 (Plan I2C) and Agencia Estatal de Investigación (Ministerio de Ciencia, Innovación y Universidades) under research project with reference RTI2018-100702-B-I00, co-funded by the European Regional Development Fund (ERDF/FEDER).

Acknowledgments

The authors want to acknowledge the support given by Rightship.com to the collection and interpretation of the provided data.

Conflicts of Interest

The authors declare no conflict of interest. The funders had no role in the design of the study; in the collection, analyses, or interpretation of data; in the writing of the manuscript, or in the decision to publish the results.

References

  1. DNV GL Maritime Forecast to 2050. Available online: https://eto.dnvgl.com/2019/Maritime/forecast (accessed on 1 August 2020).
  2. Rojon, I.; Dieperink, C. Blowin’ in the wind? Drivers and barriers for the uptake of wind propulsion in international shipping. Energy Policy 2014, 67, 394–402. [Google Scholar] [CrossRef]
  3. UNEP; FAO; IMO; UNDP; IUCN; Center, W. GRID-Arendal. Green Economy in a Blue World: Synthesis Report; UNEP: Nairobi, Kenya, 2012; ISBN 978-82-7701-104-2. [Google Scholar]
  4. Psaraftis, H.N.; Kontovas, C.A. Speed models for energy-efficient maritime transportation: A taxonomy and survey. Transp. Res. Part C Emerg. Technol. 2013, 26, 331–351. [Google Scholar] [CrossRef]
  5. International Maritime Organization (IMO); Smith, T.W.P.; Jalkanen, J.P.; Anderson, B.A.; Corbett, J.J.; Faber, J.; Hanayama, S.; O’Keeffe, E.; Parker, S.; Johansson, L.; et al. Third IMO GHG Study 2014. Available online: https://www.cedelft.eu/en/publicatie/third_imo_ghg_study_2014/1525 (accessed on 30 July 2020).
  6. Rehmatulla, N.; Smith, T. Barriers to energy efficient and low carbon shipping. Ocean Eng. 2015, 110, 102–112. [Google Scholar] [CrossRef] [Green Version]
  7. Gillingham, K.; Newell, R.G.; Palmer, K. Energy Efficiency Economics and Policy. Annu. Rev. Resour. Econ. 2009, 1, 597–620. [Google Scholar] [CrossRef]
  8. Stulgis, V.; Smith, T.; Rehmatulla, N.; Hoppe, J.; Mcmahon, H.; Lee, T. The Carbon War Room; University College London Energy Institute: London, UK, 2014. [Google Scholar]
  9. Boardman, B. Achieving energy efficiency through product policy: The UK experience. Environ. Sci. Policy 2004, 7, 165–176. [Google Scholar] [CrossRef]
  10. Croucher, M. Potential problems and limitations of energy conservation and energy efficiency. Energy Policy 2011, 39, 5795–5799. [Google Scholar] [CrossRef]
  11. International Energy Agency (IEA). Mind the Gap: Quantifying Principal-Agent Problems in Energy Efficiency. Available online: https://www.oecd-ilibrary.org/energy/mind-the-gap_9789264038950-en (accessed on 30 July 2020).
  12. Brown, M.A. Market failures and barriers as a basis for clean energy policies. Energy Policy 2001, 29, 1197–1207. [Google Scholar] [CrossRef]
  13. Sanstad, A.H.; Howarth, R.B. ‘Normal’ markets, market imperfections and energy efficiency. Energy Policy 1994, 22, 811–818. [Google Scholar] [CrossRef]
  14. Apeaning, R.W.; Thollander, P. Barriers to and driving forces for industrial energy efficiency improvements in African industries—A case study of Ghana’s largest industrial area. J. Clean. Prod. 2013, 53, 204–213. [Google Scholar] [CrossRef] [Green Version]
  15. Sudhakara Reddy, B. Barriers and drivers to energy efficiency—A new taxonomical approach. Energy Convers. Manag. 2013, 74, 403–416. [Google Scholar] [CrossRef] [Green Version]
  16. Thollander, P.; Ottosson, M. An energy efficient Swedish pulp and paper industry—Exploring barriers to and driving forces for cost-effective energy efficiency investments. Energy Effic. 2008, 1, 21–34. [Google Scholar] [CrossRef] [Green Version]
  17. Cagno, E.; Worrell, E.; Trianni, A.; Pugliese, G. A novel approach for barriers to industrial energy efficiency. Renew. Sustain. Energy Rev. 2013, 19, 290–308. [Google Scholar] [CrossRef]
  18. Golove, W.; Eto, J. Market Barriers to Energy Efficiency: A Critical Reappraisal of the Rationale for Public Policies to Promote Energy Efficiency, Report Done by Energy & Environment Division; Lawrence Berkeley National Laboratory (LBNL), University of California: Berkeley, CA, USA, 1996. [Google Scholar]
  19. Jaffe, A.B.; Stavins, R.N. The energy paradox and the diffusion of conservation technology. Resour. Energy Econ. 1994, 16, 91–122. [Google Scholar] [CrossRef]
  20. Jaffe, A.B.; Stavins, R.N. The energy-efficiency gap What does it mean? Energy Policy 1994, 22, 804–810. [Google Scholar] [CrossRef]
  21. Levinson, A.; Niemann, S. Energy use by apartment tenants when landlords pay for utilities. Resour. Energy Econ. 2004, 26, 51–75. [Google Scholar] [CrossRef]
  22. Sorrell, S.; Schleich, J.; Scott, S.; O’malley, E.; Trace, F.; Boede, U.; Ostertage, K.; Radgen, P. Barriers to Energy Efficiency in Public and Private Organisations, Science and Technology Policy Research; University of Sussex: Brighton, UK, 2000. [Google Scholar]
  23. Sorrell, S.; O’Malley, E.; Schleich, J.; Scott, S. The Economics of Energy Efficiency: Barriers to Cost-Effective Investment; Edward Elgar Publishing: Cheltenham, UK, 2004; ISBN 978-1-84064-889-8. [Google Scholar]
  24. Sorrell, S.; Mallett, A.; Nye, S. “Barriers to Industrial Energy Efficiency: A Literature Review”, Background Study for the UNIDO Industrial Development Report (IDR) ‘Industrial Energy Efficiency Pays, Why Is It Not Happening? UNIDO (SPRU, University of Sussex): Vienna, Austria; Brighton, UK, 2011. [Google Scholar]
  25. Abadie, L.M.; Ortiz, R.A.; Galarraga, I. Determinants of energy efficiency investments in the US. Energy Policy 2012, 45, 551–566. [Google Scholar] [CrossRef] [Green Version]
  26. Arvanitis, S.; Ley, M. Factors Determining the Adoption of Energy-Saving Technologies in Swiss Firms: An Analysis Based on Micro Data. Environ. Resour. Econ. 2013, 54, 389–417. [Google Scholar] [CrossRef]
  27. Hrovatin, N.; Dolšak, N.; Zorić, J. Factors impacting investments in energy efficiency and clean technologies: Empirical evidence from Slovenian manufacturing firms. J. Clean. Prod. 2016, 127, 475–486. [Google Scholar] [CrossRef]
  28. Hrovatin, N.; Zorić, J. Determinants of energy-efficient home retrofits in Slovenia: The role of information sources. Energy Build. 2018, 180, 42–50. [Google Scholar] [CrossRef]
  29. Murtishaw, S.; Sathaye, J. Quantifying the Effect of the Principal-Agent Problem on US Residential Energy Use; Lawrence Berkeley National Laboratory, University of California: Berkeley, CA, USA, 2006. [Google Scholar]
  30. Rehmatulla, N. Market Failures and Barriers Affecting Energy Efficient Operations in Shipping. Ph.D. Thesis, UCL, University College London, London, UK, 2014. [Google Scholar]
  31. Rehmatulla, N.; Smith, T. Barriers to energy efficiency in shipping: A triangulated approach to investigate the principal agent problem. Energy Policy 2015, 84, 44–57. [Google Scholar] [CrossRef] [Green Version]
  32. Trotta, G. The determinants of energy efficient retrofit investments in the English residential sector. Energy Policy 2018, 120, 175–182. [Google Scholar] [CrossRef]
  33. Trotta, G. Factors affecting energy-saving behaviours and energy efficiency investments in British households. Energy Policy 2018, 114, 529–539. [Google Scholar] [CrossRef]
  34. Vernon, D.; Meier, A. Identification and quantification of principal–agent problems affecting energy efficiency investments and use decisions in the trucking industry. Energy Policy 2012, 49, 266–273. [Google Scholar] [CrossRef]
  35. Jensen, M.C.; Meckling, W.H. Theory of the firm: Managerial behavior, agency costs and ownership structure. J. Financ. Econ. 1976, 3, 305–360. [Google Scholar] [CrossRef]
  36. Ross, S.A. The Economic Theory of Agency: The Principal’s Problem. Am. Econ. Rev. 1973, 63, 134–139. [Google Scholar]
  37. Blumstein, C.; Krieg, B.; Schipper, L.; York, C. Overcoming social and institutional barriers to energy conservation. Energy 1980, 5, 355–371. [Google Scholar] [CrossRef] [Green Version]
  38. Arens, M.; Worrell, E.; Eichhammer, W. Drivers and barriers to the diffusion of energy-efficient technologies—A plant-level analysis of the German steel industry. Energy Effic. 2017, 10, 441–457. [Google Scholar] [CrossRef]
  39. Cagno, E.; Trianni, A.; Abeelen, C.; Worrell, E.; Miggiano, F. Barriers and drivers for energy efficiency: Different perspectives from an exploratory study in the Netherlands. Energy Convers. Manag. 2015, 102, 26–38. [Google Scholar] [CrossRef] [Green Version]
  40. Trianni, A.; Cagno, E.; Marchesani, F.; Spallina, G. Drivers for Industrial Energy Efficiency: An Innovative Approach. In Proceedings of the ICAE—International Conference on Applied Energy, Pretoria, South Africa, 1–4 July 2013; pp. 1–9. [Google Scholar]
  41. Acciaro, M. A Critical Review of Port Pricing Literature: What Role for Academic Research? Asian J. Shipp. Logist. 2013, 29, 207–228. [Google Scholar] [CrossRef] [Green Version]
  42. Agnolucci, P.; Smith, T.; Rehmatulla, N. Energy efficiency and time charter rates: Energy efficiency savings recovered by ship owners in the Panamax market. Transp. Res. Part Policy Pract. 2014, 66, 173–184. [Google Scholar] [CrossRef] [Green Version]
  43. Faber, J.; Markowska, A.; Nelissen, D.; Davidson, M.; Eyring, V.; Cionni, I.; Selstad, E.; Kågeson, P.; Lee, D.; Buhaug, Ø.; et al. Technical Support for European Action to Reducing Greenhouse Gas Emissions from International Maritime Transport; CE Delft; Faculty of Science (FNWI); Institute for Biodiversity and Ecosystem Dynamics (IBED): Amsterdam, The Netherlands, 2009. [Google Scholar]
  44. Faber, J.; Wang, H.; Nelissen, D.; Russel, B.; Amand, D. Marginal Abatement Costs and Cost-Effectiveness of Energy-Efficiency Measures. Available online: https://www.cedelft.eu/en/publicatie/marginal_abatement_costs_and_cost-effectiveness_of_energy-efficiency_measures/1090 (accessed on 30 July 2020).
  45. Faber, J.; Behrends, B.; Lee, D.S.; Nelissen, D.; Smit, M. The Fuel Efficiency of Maritime Transport. Available online: https://www.cedelft.eu/en/publicatie/the_fuel_efficiency_of_maritime_transport/1320 (accessed on 30 July 2020).
  46. Fisher, A.C.; Rothkopf, M.H. Market failure and energy policy A rationale for selective conservation. Energy Policy 1989, 17, 397–406. [Google Scholar] [CrossRef]
  47. Levine, M.D.; Koomey, J.G.; McMahon, J.E.; Sanstad, A.H.; Hirst, E. Energy Efficiency, Market Failures, and Government Policy; Lawrence Berkeley Lab.: Berkeley, CA, USA, 1994. [Google Scholar]
  48. Gillingham, K.; Palmer, K. Encuentre su institución. Rev. Environ. Econ. Policy 2014, 8, 18–38. [Google Scholar] [CrossRef] [Green Version]
  49. Jafarzadeh, S.; Utne, I.B. A framework to bridge the energy efficiency gap in shipping. Energy 2014, 69, 603–612. [Google Scholar] [CrossRef]
  50. Maddox Consulting. Analysis of Market Barriers to Cost Effective GHG Emission Reductions in the Maritime Transport Sector. Available online: http://op.europa.eu/en/publication-detail/-/publication/b641a090-04c8-4459-99fe-4302bb5b9176 (accessed on 30 July 2020).
  51. Thollander, P.; Palm, J.; Rohdin, P. Categorizing Barriers to Energy Efficiency—An Interdisciplinary Perspective. Energy Effic. 2010. [Google Scholar] [CrossRef] [Green Version]
  52. Hasanbeigi, A.; Menke, C.; du Pont, P. Barriers to energy efficiency improvement and decision-making behavior in Thai industry. Energy Effic. 2010, 3, 33–52. [Google Scholar] [CrossRef]
  53. Rohdin, P.; Thollander, P.; Solding, P. Barriers to and drivers for energy efficiency in the Swedish foundry industry. Energy Policy 2007, 35, 672–677. [Google Scholar] [CrossRef] [Green Version]
  54. Hochman, G.; Timilsina, G.R. Energy efficiency barriers in commercial and industrial firms in Ukraine: An empirical analysis. Energy Econ. 2017, 63, 22–30. [Google Scholar] [CrossRef] [Green Version]
  55. Wang, X.; Lu, M.; Mao, W.; Ouyang, J.; Zhou, B.; Yang, Y. Improving benefit-cost analysis to overcome financing difficulties in promoting energy-efficient renovation of existing residential buildings in China. Appl. Energy 2015, 141, 119–130. [Google Scholar] [CrossRef]
  56. Brechling, V.; Smith, S. Household energy efficiency in the UK. Fisc. Stud. 1994, 15, 44–56. [Google Scholar] [CrossRef] [Green Version]
  57. Hobson, M.; Pell, E.; Surgand, M.; Kollamthodi, S.; Moloney, S.; Mesbahi, E.; Wright, P.; Cabezas, B.; Pazouki, K. Low Carbon Commercial Shipping; Low Carbon Transport Innovation Strategy (LCTIS); Low Carbon Transport Innovation Strategy(LCTIS); Department for Transport: Policy, Guidance and Research (DfT): London, UK, 2007.
  58. Kollamthodi, S.; Pueyo, A.; Gibson, G.; Narkeviciute, N.; Hawkes, A.; Cesbron, S.; Milnes, R.; Harries, J.; Zamparutti, T.; Hernandez, G.; et al. Support for the Impact Assessment of a Proposal to Address Maritime Transport Greenhouse Gas Emissions; European Commission – DG Climate Action: Bruxelles, Belgium, 2013. [Google Scholar]
  59. Reddy, S.; Painuly, J.P. Diffusion of renewable energy technologies—Barriers and stakeholders’ perspectives. Renew. Energy 2004, 29, 1431–1447. [Google Scholar] [CrossRef]
  60. Alriksson, S.; Filipsson, M. Risk perception and worry in environmental decision-making—A case study within the Swedish steel industry. J. Risk Res. 2017, 20, 1173–1194. [Google Scholar] [CrossRef]
  61. Hirst, E.; Brown, M. Closing the efficiency gap: Barriers to the efficient use of energy. Resour. Conserv. Recycl. 1990, 3, 267–281. [Google Scholar] [CrossRef]
  62. Schleich, J.; Gruber, E. Beyond case studies: Barriers to energy efficiency in commerce and the services sector. Energy Econ. 2008, 30, 449–464. [Google Scholar] [CrossRef]
  63. Bukarica, V.; Tomšić, Ž. Energy efficiency policy evaluation by moving from techno-economic towards whole society perspective on energy efficiency market. Renew. Sustain. Energy Rev. 2017, 70, 968–975. [Google Scholar] [CrossRef]
  64. Abeelen, C.; Harmsen, R.; Worrell, E. Implementation of energy efficiency projects by Dutch industry. Energy Policy 2013, 63, 408–418. [Google Scholar] [CrossRef]
  65. Stern, P.; Aronson, E. Energy Use: The Human Dimension. J. Econ. Psychol. 1984, 6, 417–420. [Google Scholar] [CrossRef]
  66. Gillingham, K.; Harding, M.; Rapson, D. Split Incentives in Residential Energy Consumption. Energy J. 2012, 33. [Google Scholar] [CrossRef] [Green Version]
  67. DeCanio, S.J.; Watkins, W.E. Investment in Energy Efficiency: Do the Characteristics of Firms Matter? Rev. Econ. Stat. 1998, 80, 95–107. [Google Scholar] [CrossRef]
  68. Anderson, S.T.; Newell, R.G. Information programs for technology adoption: The case of energy-efficiency audits. Resour. Energy Econ. 2004, 26, 27–50. [Google Scholar] [CrossRef] [Green Version]
  69. Baye, M.R. Economía de Empresa y Estrategia Empresarial; McGraw-Hill, Interamericana de España: Madrid, Spain, 2006; ISBN 978-84-481-4620-7. [Google Scholar]
  70. Akerlof, G.A. The Market for “Lemons”: Quality Uncertainty and the Market Mechanism. Q. J. Econ. 1970, 84, 488–500. [Google Scholar] [CrossRef]
  71. Markinson, S. Public Finance Mechanisms to Increase Investment in Energy Efficiency, a Report for Policymakers and Public Finance Agencies; Basel Agency for Sustainable Energy (BASE); UNEP Sustainable Energy Finance Initiative (SEFI): Basel, Switzerland, 2006. [Google Scholar]
  72. Sharma, A. Professional as Agent: Knowledge Asymmetry in Agency Exchange. Acad. Manag. Rev. 1997, 22, 758–798. [Google Scholar] [CrossRef]
  73. Arruñada, B. Economía de la Empresa: Un Enfoque Contractual; Ariel: Barcelona, Spain, 1990; ISBN 978-84-344-2048-9. [Google Scholar]
  74. Charlier, D. Energy efficiency investments in the context of split incentives among French households. Energy Policy 2015, 87, 465–479. [Google Scholar] [CrossRef]
  75. Mankiw, N.G. Principios de Economía, 4th ed.; Thomson: Madrid, Spain, 2007; ISBN 978-84-9732-534-9. [Google Scholar]
  76. Milgrom, P.R.; Roberts, J.; Jimeno, E. Economía, organización y gestión de la empresa; Ariel: Barcelona, Spain, 1993; ISBN 978-84-344-2082-3. [Google Scholar]
  77. Spence, M. Signaling in Retrospect and the Informational Structure of Markets. Am. Econ. Rev. 2002, 92, 434–459. [Google Scholar] [CrossRef]
  78. Meier, A.; Eide, A. How Many People Actually See the Price Signal? Quantifying Market Failures in the End Use of Energy; Lawrence Berkeley National Laboratory: Berkeley, CA, USA, 2007; ISBN 978-91-633-0899-4. [Google Scholar]
  79. Graus, W.; Worrell, E. The principal-agent problem and transport energy use: Case study of company lease cars in the Netherlands. Energy Policy 2008, 36, 3745–3753. [Google Scholar] [CrossRef] [Green Version]
  80. Maruejols, L.; Young, D. Split incentives and energy efficiency in Canadian multi-family dwellings. Energy Policy 2011, 39, 3655–3668. [Google Scholar] [CrossRef] [Green Version]
  81. Adland, R.; Alger, H.; Banyte, J.; Jia, H. Does fuel efficiency pay? Empirical evidence from the drybulk timecharter market revisited. Transp. Res. Part Policy Pract. 2017, 95, 1–12. [Google Scholar] [CrossRef] [Green Version]
  82. Trianni, A.; Cagno, E.; Farné, S. Barriers, drivers and decision-making process for industrial energy efficiency: A broad study among manufacturing small and medium-sized enterprises. Appl. Energy 2016, 162, 1537–1551. [Google Scholar] [CrossRef]
  83. Trianni, A.; Cagno, E.; Marchesani, F.; Spallina, G. Classification of drivers for industrial energy efficiency and their effect on the barriers affecting the investment decision-making process. Energy Effic. 2017, 10, 199–215. [Google Scholar] [CrossRef]
  84. Thollander, P.; Backlund, S.; Trianni, A.; Cagno, E. Beyond barriers—A case study on driving forces for improved energy efficiency in the foundry industries in Finland, France, Germany, Italy, Poland, Spain, and Sweden. Appl. Energy 2013, 111, 636–643. [Google Scholar] [CrossRef] [Green Version]
  85. Armstrong, V.N.; Banks, C. Integrated approach to vessel energy efficiency. Ocean Eng. 2015, 110, 39–48. [Google Scholar] [CrossRef] [Green Version]
  86. Stevens, L.; Sys, C.; Vanelslander, T.; van Hassel, E. Is new emission legislation stimulating the implementation of sustainable and energy-efficient maritime technologies? Res. Transp. Bus. Manag. 2015, 17, 14–25. [Google Scholar] [CrossRef]
  87. Painuly, J.P.; Park, H.; Lee, M.-K.; Noh, J. Promoting energy efficiency financing and ESCOs in developing countries: Mechanisms and barriers. J. Clean. Prod. 2003, 11, 659–665. [Google Scholar] [CrossRef]
  88. Brunke, J.-C.; Johansson, M.; Thollander, P. Empirical investigation of barriers and drivers to the adoption of energy conservation measures, energy management practices and energy services in the Swedish iron and steel industry. J. Clean. Prod. 2014, 84, 509–525. [Google Scholar] [CrossRef] [Green Version]
  89. de Groot, H.L.F.; Verhoef, E.T.; Nijkamp, P. Energy saving by firms: Decision-making, barriers and policies. Energy Econ. 2001, 23, 717–740. [Google Scholar] [CrossRef] [Green Version]
  90. International Maritime Organization (IMO). Reducing Greenhouse Gas Emissions from Ships. Available online: http://www.imo.org/en/MediaCentre/HotTopics/Pages/Reducing-greenhouse-gas-emissions-from-ships.aspx (accessed on 8 September 2020).
  91. International Maritime Organization (IMO). MEPC 74th Session. Available online: http://www.imo.org/en/MediaCentre/MeetingSummaries/MEPC/Pages/MEPC-74th-session.aspx (accessed on 8 September 2020).
  92. Cooremans, C. Make it strategic! Financial investment logic is not enough | SpringerLink. Energy Effic. 2011, 4, 473–492. [Google Scholar] [CrossRef] [Green Version]
  93. Stern, N.H. The Economics of Climate Change. The Stern Review; Cambridge University Press: Cambridge, UK, 2006; ISBN 978-0-521-87725-1. [Google Scholar]
  94. EEA (European Environmental Agency); Eionet (European Environment Information and Observation Network). Greenhouse Gas Emissions from Transport in Europe—European Environment Agency. Available online: https://www.eea.europa.eu/data-and-maps/indicators/transport-emissions-of-greenhouse-gases/transport-emissions-of-greenhouse-gases-12 (accessed on 30 August 2020).
  95. Sookun, A.; Boojhawon, R.; Rughooputh, S.D.D.V. Assessing greenhouse gas and related air pollutant emissions from road traffic counts: A case study for Mauritius. Transp. Res. Part Transp. Environ. 2014, 32, 35–47. [Google Scholar] [CrossRef]
  96. Wang, Y.; Szeto, W.Y.; Han, K.; Friesz, T.L. Dynamic traffic assignment: A review of the methodological advances for environmentally sustainable road transportation applications. Transp. Res. Part B Methodol. 2018, 111, 370–394. [Google Scholar] [CrossRef]
  97. Chang, C.-C. Marine energy consumption, national economic activity, and greenhouse gas emissions from international shipping. Energy Policy 2012, 41, 843–848. [Google Scholar] [CrossRef]
  98. International Maritime (IMO). Report of the Marine Environment Protection Committee on Its Sixty-Second Session; IMO: London, UK, 2020. [Google Scholar]
  99. Lagouvardou, S.; Psaraftis, H.N.; Zis, T. A Literature Survey on Market-Based Measures for the Decarbonization of Shipping. Sustainability 2020, 12, 3953. [Google Scholar] [CrossRef]
  100. Gençsü, I.; Hino, M. Raising Ambition to Reduce International Aviation and Maritime Emissions; New Climate Economy: London, UK; Washington, DC, USA, 2015. [Google Scholar]
  101. Longarela-Ares, Á. Factores impulsores de la inversión en medidas de eficiencia energética en el transporte marítimo de mercancías: Una revisión sistemática de la literatura. 3C Empresa Investig. Pensam. Crít. 2018, 12–31. [Google Scholar] [CrossRef] [Green Version]
  102. Del Río González, P. Analysing the factors influencing clean technology adoption: A study of the Spanish pulp and paper industry. Bus. Strategy Environ. 2005, 14, 20–37. [Google Scholar] [CrossRef]
  103. Sardianou, E. Barriers to industrial energy efficiency investments in Greece. J. Clean. Prod. 2008, 16, 1416–1423. [Google Scholar] [CrossRef]
  104. Halme, M.; Nieminen, J.; Nykänen, E.; Sarvaranta, L.; Savonen, A. Business from Sustainability: Drivers for Energy Efficient Housing; Julkaisija Utgivare Publisher: Helsinki, Finland, 2005. [Google Scholar]
  105. Schlomann, B.; Schleich, J. Adoption of low-cost energy efficiency measures in the tertiary sector—An empirical analysis based on energy survey data. Renew. Sustain. Energy Rev. 2015, 43, 1127–1133. [Google Scholar] [CrossRef] [Green Version]
  106. Velthuijsen, J.W. Incentives for investment in energy efficiency: An econometric evaluation and policy implications. Environ. Resour. Econ. 1993, 3, 153–169. [Google Scholar] [CrossRef]
  107. Li, J.; Lu, Q.; Fu, P. Carbon Footprint Management of Road Freight Transport under the Carbon Emission Trading Mechanism. Available online: https://www.hindawi.com/journals/mpe/2015/814527/ (accessed on 6 September 2020).
  108. Halim, R.A.; Kirstein, L.; Merk, O.; Martinez, L.M. Decarbonization Pathways for International Maritime Transport: A Model-Based Policy Impact Assessment. Sustainability 2018, 10, 2243. [Google Scholar] [CrossRef] [Green Version]
  109. Zhu, M.; Yuen, K.F.; Ge, J.W.; Li, K.X. Impact of maritime emissions trading system on fleet deployment and mitigation of CO2 emission. Transp. Res. Part Transp. Environ. 2018, 62, 474–488. [Google Scholar] [CrossRef]
  110. Boama, P.O.; Onumah, J.; Takase, M.; Bonsu, P.O.; Salifu, T. Air pollution control techniques. Glob. J. Bio-Sci. Biotechnol. 2012, 1, 124–131. [Google Scholar]
  111. Kholod, N.; Evans, M.; Gusev, E.; Yu, S.; Malyshev, V.; Tretyakova, S.; Barinov, A. A methodology for calculating transport emissions in cities with limited traffic data: Case study of diesel particulates and black carbon emissions in Murmansk. Sci. Total Environ. 2016, 547, 305–313. [Google Scholar] [CrossRef] [Green Version]
  112. Saija, S.; Romano, D. A methodology for the estimation of road transport air emissions in urban areas of Italy. Atmos. Environ. 2002, 36, 5377–5383. [Google Scholar] [CrossRef]
  113. Agyemang-Bonsu, K.W.; Dontwi, I.K.; Tutu-Benefoh, D.; Bentil, D.; Boateng, O.; Asuobonteng, K.; Agyemang, W. Traffic-data driven modelling of vehicular emissions using COPERT III in Ghana: A case study of Kumasi. Am. J. Sci. Ind. Res. 2010, 1, 32–40. [Google Scholar]
  114. Cai, H.; Xie, S. Estimation of vehicular emission inventories in China from 1980 to 2005. Atmos. Environ. 2007, 41, 8963–8979. [Google Scholar] [CrossRef]
  115. Alam, M.S.; Duffy, P.; Hyde, B.; McNabola, A. Downscaling national road transport emission to street level: A case study in Dublin, Ireland. J. Clean. Prod. 2018, 183, 797–809. [Google Scholar] [CrossRef]
  116. Johansson, L.; Jalkanen, J.-P.; Kukkonen, J. Global assessment of shipping emissions in 2015 on a high spatial and temporal resolution. Atmos. Environ. 2017, 167, 403–415. [Google Scholar] [CrossRef]
  117. Paxian, A.; Eyring, V.; Beer, W.; Sausen, R.; Wright, C. Present-Day and Future Global Bottom-Up Ship Emission Inventories Including Polar Routes. Environ. Sci. Technol. 2010, 44, 1333–1339. [Google Scholar] [CrossRef] [PubMed]
  118. Ürge-Vorsatz, D.; Novikova, A.; Köppel, S.; Boza-Kiss, B. Bottom–up assessment of potentials and costs of CO2 emission mitigation in the buildings sector: Insights into the missing elements. Energy Effic. 2009, 2, 293–316. [Google Scholar] [CrossRef]
  119. Cheewaphongphan, P.; Chatani, S.; Saigusa, N. Exploring Gaps between Bottom-Up and Top-Down Emission Estimates Based on Uncertainties in Multiple Emission Inventories: A Case Study on CH4 Emissions in China. Sustainability 2019, 11, 2054. [Google Scholar] [CrossRef] [Green Version]
  120. RightShip. Calculating and Comparing CO2 Emissions from the Global Maritime Fleet; Rightship: Melbourne VIC, Australia, 2013. [Google Scholar]
  121. RightShip. RightShip—Experts in Maritime Safety & Environmental Sustainability. Available online: https://www.rightship.com/ (accessed on 7 August 2020).
  122. RightShip. DNV GL Methodology Review—Executive Summary; Rightship: Melbourne, Australia, 2015. [Google Scholar]
  123. RightShip. Vessel Verification; Rightship: Melbourne, Australia, 2020. [Google Scholar]
  124. Aravena, C.; Riquelme, A.; Denny, E. Money, Comfort or Environment? Priorities and Determinants of Energy Efficiency Investments in Irish Households. J. Consum. Policy 2016, 39, 159–186. [Google Scholar] [CrossRef]
  125. Weber, L. Some reflections on barriers to the efficient use of energy. Energy Policy 1997, 25, 833–835. [Google Scholar] [CrossRef]
  126. Lee, K.-H. Drivers and Barriers to Energy Efficiency Management for Sustainable Development. Sustain. Dev. 2015, 23, 16–25. [Google Scholar] [CrossRef]
  127. Carbon War Room. Road Transport: Unlocking Fuel-Saving Technologies in Trucking and Fleets; Carbon War Room: London, UK, 2012. [Google Scholar]
  128. Klemick, H.; Kopits, E.; Wolverton, A.; Sargent, K. Heavy-duty trucking and the energy efficiency paradox: Evidence from focus groups and interviews. Transp. Res. Part Policy Pract. 2015, 77, 154–166. [Google Scholar] [CrossRef]
  129. Roeth, M.; Kircher, D.; Smith, J.; Swim, R. Barriers to the Increased Adoption of Fuel Efficiency Technologies in the North American On-Road Freight Sector, Report for the International Council on Clean Transportation; International Council on Clean Transportation (ICCT): Washington, DC, USA, 2013. [Google Scholar]
  130. Harris, J.; Anderson, J.; Shafron, W. Investment in energy efficiency: A survey of Australian firms. Energy Policy 2000, 28, 867–876. [Google Scholar] [CrossRef]
  131. Meath, C.; Linnenluecke, M.; Griffiths, A. Barriers and motivators to the adoption of energy savings measures for small- and medium-sized enterprises (SMEs): The case of the Climate Smart Business Cluster program. J. Clean. Prod. 2016, 112, 3597–3604. [Google Scholar] [CrossRef] [Green Version]
  132. Kontokosta, C.E. Modeling the energy retrofit decision in commercial office buildings. Energy Build. 2016, 131, 1–20. [Google Scholar] [CrossRef]
  133. Matosović, M.; Tomšić, Ž. Modeling energy efficiency investment choices—A case study on Croatia’s residential sector. Energy Sources Part B Econ. Plan. Policy 2018, 13, 311–319. [Google Scholar] [CrossRef]
  134. Olsthoorn, M.; Schleich, J.; Hirzel, S. Adoption of Energy Efficiency Measures for Non-residential Buildings: Technological and Organizational Heterogeneity in the Trade, Commerce and Services Sector. Ecol. Econ. 2017, 136, 240–254. [Google Scholar] [CrossRef]
  135. Krishnamurthy, C.K.B.; Kriström, B. How large is the Owner-Renter Divide in Energy Efficient Technology? Evidence from an OECD cross-section. Energy J. 2015, 36. [Google Scholar] [CrossRef]
  136. Scott, S. Household energy efficiency in Ireland: A replication study of ownership of energy saving items. Energy Econ. 1997, 19, 187–208. [Google Scholar] [CrossRef]
  137. Dato, P. Investment in Energy Efficiency, Adoption of Renewable Energy and Household Behavior: Evidence from OECD Countries. Energy J. 2018, 39. [Google Scholar] [CrossRef]
  138. Davis, L.W. Evaluating the Slow Adoption of Energy Efficient Investments: Are Renters Less Likely to Have Energy Efficient Appliances? Vol. The Design and Implementation of U.S. Climate Policy; Working Paper Series; National Bureau of Economic Research (NBER): Cambridge, MA, USA, 2011; ISBN 0-226-36914-0. [Google Scholar]
  139. Hill, D.R. Regional determinants of residential energy expenditures and the principal-agent problem in Austria. REGION 2015, 2, Y1–Y16. [Google Scholar] [CrossRef]
  140. Hellman Miller, K.; Colantuoni, F.; Lasco Crago, C. An Empirical Analysis of Residential Energy Efficiency Adoption by Housing Types and Occupancy. In Proceedings of the 2014 Annual Meeting, Minneapolis, MN, USA, 27–29 July 2014. [Google Scholar]
  141. Souza, M.N.M. Why are rented dwellings less energy-efficient? Evidence from a representative sample of the U.S. housing stock. Energy Policy 2018, 118, 149–159. [Google Scholar] [CrossRef]
  142. Broberg, T.; Egüez, A. Blame it on the owner—Ownership and energy performance of multi-dwelling buildings. Energy Econ. 2018, 72, 108–119. [Google Scholar] [CrossRef] [Green Version]
  143. Achtnicht, M.; Madlener, R. Factors influencing German house owners’ preferences on energy retrofits. Energy Policy 2014, 68, 254–263. [Google Scholar] [CrossRef] [Green Version]
  144. Ramos, A.; Labandeira, X.; Löschel, A. Pro-environmental Households and Energy Efficiency in Spain. Environ. Resour. Econ. 2016, 63, 367–393. [Google Scholar] [CrossRef]
  145. Hamilton, I.G.; Summerfield, A.J.; Shipworth, D.; Steadman, J.P.; Oreszczyn, T.; Lowe, R.J. Energy efficiency uptake and energy savings in English houses: A cohort study. Energy Build. 2016, 118, 259–276. [Google Scholar] [CrossRef] [Green Version]
  146. Schaefer, C.; Weber, C.; Voss-Uhlenbrock, H.; Schuler, A.; Oosterhuis, F.; Nieuwlaar, E.; Angioletti, R.; Kjellsson, E.; Leth-Petersen, S.; Togeby, M.; et al. Effective Policy Instruments for Energy Efficiency in Residential Space Heating: An International Empirical Analysis (EPISODE); University of Stuttgart: Stuttgart, Germany, 2000. [Google Scholar]
  147. Suk, S.; Lee, S.-Y.; Jeong, Y.S. A survey on the impediments to low carbon technology investment of the petrochemical industry in Korea. J. Clean. Prod. 2016, 133, 576–588. [Google Scholar] [CrossRef]
  148. Zundel, S.; Stieß, I. Beyond Profitability of Energy-Saving Measures—Attitudes Towards Energy Saving. J. Consum. Policy 2011, 34, 91–105. [Google Scholar] [CrossRef]
  149. Gordon, S. Steering towards Change: Overcoming Barriers to Energy Efficiency in Merchant Ships. Master’s Thesis, Environmental Change Institute, University of Oxford, Oxford, UK, 2008. [Google Scholar]
  150. Hill, J. Unlocking the Potential for CO2 Abatement in Ships Arriving and Departing from UK Ports. Master’s Thesis, Imperial College, London, UK, 2010. [Google Scholar]
  151. Buhaug, Ø.; Corbett, J.J.; Endresen, Ø.; Eyring, V.; Faber, J.; Hanayama, S.; Lee, D.S.; Lee, D.; Lindstad, H. Second IMO GHG Study; International Maritime Organization (IMO): London, UK, 2009. [Google Scholar]
  152. Bergantino, A.S.; Veenstra, A.W. Interconnection and Co-ordination: An Application of Network Theory to Liner Shipping. Int. J. Marit. Econ. 2002, 4, 231–248. [Google Scholar] [CrossRef]
  153. Johnson, H.; Andersson, K. Barriers to energy efficiency in shipping. WMU J. Marit. Aff. 2016, 15, 79–96. [Google Scholar] [CrossRef] [Green Version]
  154. Rehmatulla, N.; Parker, S.; Smith, T.; Stulgis, V. Wind technologies: Opportunities and barriers to a low carbon shipping industry. Mar. Policy 2017, 75, 217–226. [Google Scholar] [CrossRef]
  155. Johnson, H.; Johansson, M.; Andersson, K. Barriers to improving energy efficiency in short sea shipping: An action research case study. J. Clean. Prod. 2014, 66, 317–327. [Google Scholar] [CrossRef]
  156. Refinitiv Eikon. Available online: https://eikon.thomsonreuters.com/index.html (accessed on 7 August 2020).
  157. Energy Efficiency Rating. Available online: http://www.energyefficiencyrating.net/ (accessed on 7 August 2020).
  158. R Core Team 3.4.4; R Core Team; The R Foundation for Statistical Computing: Vienna, Austria, 2018.
  159. Bauwens, T.; Eyre, N. Exploring the links between community-based governance and sustainable energy use: Quantitative evidence from Flanders. Ecol. Econ. 2017, 137, 163–172. [Google Scholar] [CrossRef]
  160. Aldás, J.; Uriel, E. Análisis Multivariante Aplicado con R, 2nd ed.; Paraninfo: Madrid, Spain, 2017; ISBN 978-84-283-2969-9. [Google Scholar]
  161. Hilbe, J.M. Logistic Regression Models; CRC Press: Boca Raton, FL, USA, 2009; ISBN 978-1-138-10671-0. [Google Scholar]
  162. Berry, W. Understanding Regression Assumptions; SAGE Publications, Inc.: Thousand Oaks, CA, USA, 1993; ISBN 978-0-8039-4263-9. [Google Scholar]
  163. Liao, J.; McGee, D. Adjusted Coefficients of Determination for Logistic Regression. Am. Stat. 2003, 57, 161–165. [Google Scholar] [CrossRef]
  164. EEA (European Environmental Agency); Eionet (European Environment Information and Observation Network). Final Energy Consumption in Europe by Mode of Transport—European Environment Agency. Available online: https://www.eea.europa.eu/data-and-maps/indicators/transport-final-energy-consumption-by-mode/assessment-10 (accessed on 30 August 2020).
  165. International Maritime Organization (IMO). IMO and the Sustainable Development Goals. Available online: http://www.imo.org/en/MediaCentre/HotTopics/Pages/SustainableDevelopmentGoals.aspx (accessed on 8 August 2020).
Figure 1. Methodological procedure.
Sustainability 12 07943 g001
Table 1. Barriers to Energy Efficiency Investments.
TypesSubtypesExamples
Barriers to Energy Efficiency InvestmentsBehavioral barriers
Organizational barriers
Economic barriersMarket barriers or
Nonmarket failures
Capital constraints
Heterogeneity
Hidden costs
Risk and uncertainty
Market failuresRegulation and other
Asymmetric information
Split incentives
Adverse selection
Moral hazard
Principal–agent problem
Source: Authors’ own work, based on the literature.
Table 2. Cases of principal–agent relationships and problems in maritime shipping.
Charterer Can Select the MeasuresCharterer Does Not Select the Measures, Shipowner Selects Them
Charterer pays the energy costsCase 1: no principal–agent problemCase 2: Time Charter
principal–agent and efficiency problems.
Charterer does not pay the energy costs, shipowner pays themCase 3: principal–agent, usage and efficiency problemsCase 4: Voyage Charter
principal–agent and usage problems.
Source: Author’s own work, based on literature.
Table 3. Drivers of energy efficiency investments.
TypesExamples
Drivers of Energy Efficiency InvestmentsEconomic-financial driversPrivate financing, public funding and financial incentives, energy cost management, information costs, budget management *
Regulation and policiesEfficiency due to legal restrictions, energy audit, management, guidelines, taxes, tariffs, clarity, standards, willingness to compete, long-term energy strategy, green image *
Informational driversAvailability of information, verified information, awareness, ambition, knowledge
Professional training driversTraining and educational programmes, technical support
Source: Author’s own work, based on literature. * Market-based mechanisms are specified separately, since they can have a political-regulatory nature and provide a financial incentive.
Table 4. Hypotheses and predictable relationships with EE investment.
HypothesisDescriptionPredictable Relationship with EE InvestmentFactor Analyzed:
Barriers and Drivers
H1A negative effect of the age of the vessel in active use is expected on the probability of investing in energy efficiency.-Market barriers: Heterogeneity and risk//Vessel characteristics as drivers
H2A positive effect of vessel’s size is expected on the probability of investing in energy efficiency.+
H3A positive effect of the vessel’s activity is expected on the probability of investing in energy efficiency.+Economic-financial aspects, regulation and policies: control, management, audit, method of operation as driver
H4A negative effect of Time Charter contracts is expected on the probability of investing in energy efficiency.-Market failures: split incentives and principal–agent problem
H5A positive effect of Voyage Charter contracts is expected on the probability of investing in energy efficiency.+
H6A positive effect of the level of emissions is expected on the probability of investing in energy efficiency.+Regulation and policies: emissions management as driver
H7A positive effect of verified information is expected on the probability of investing in energy efficiency.+Market barriers: uncertainty, informational failures, principal–agent problem//Information as a driver
H8A negative effect of unverified information or lack of verified information is expected on the probability of investing in energy efficiency.-
H9Regulation on emissions and EE in maritime shipping are expected to have a positive effect on the probability of investing in energy efficiency.+Regulation and policies: legislation, regulation and IMO guidelines as a driver
Source: Author’s own work, based on the literature review.
Table 5. Variable Definition for the Study of Economic Barriers and Drivers that Influence EE Investments.
VariableVariable DescriptionUnit of MeasurementType of VariableAuthors
INVDECEE Investment Decision0: no investment in EE
1: investment in EE
Dichotomous[25,27,28,32,33,67,68,105,124,137]
AGEACAge of the vessel in active use and IMO guidelinesYV: young vessels under IMO guidelines
MV: medium-aged vessels
OV: old vessels
Qualitative[25,26,28,30,32,33,42,54,56,67,68,74,86,98,124,132,134,136,137,141,142,143,144,145,146,150]
SIZEMVessel sizeDWT/1000Quantitative[26,27,28,30,42,54,56,62,67,68,74,86,98,99,105,132,134,136,139,141,142,143,144,145,146]
RACTRate of vessel activity per yearNo. of contracts per vessel/active year in the studied periodQuantitative[26,30,62,68,105,145]
CTCType of contract under which the vessel operates0: VY contract
1: TC contract
Dichotomous[6,11,26,29,30,31,32,33,34,42,54,56,62,74,105,132,134,136,141,145,150]
EVDIExisting Vessel Design Index or emissionsGrams of CO2 per tonne nautical mileQuantitative[25,42,74,120,121,122,123,137]
VINFOBQuality of Information about Emissions0: Unverified info.
1: Verified info.
Dichotomous[25,26,28,32,33,54,62,121,123,124,136,137,141]
Source: Author’s own work.
Table 6. Information collected by vessel type and sources.
DatabaseInformation/VesselVessel TypeNo. of ObservationsSource
Base 1Vessel characteristics and activity informationBulk Carrier81,533Eikon Thomson Reuters
Base 2Vessel characteristicsBulk Carrier13,500Eikon Thomson Reuters
Base 3Vessel characteristics and energy and environmental informationBulk Carrier10,762Rightship
Base 4Information on EE investmentsSeveral vessel types12,968Rightship
Source: Author’s own work.
Table 7. Descriptive Analysis of the Model Variables.
VariableUnit of MeasurementTypeRange, Means, SD or FD *
INVDEC0: no investment in EE
1: investment in EE
Dichotomous0 FD: 55601 FD: 1190
AGEACYV: 0–7 years
MV: 8–14 years
OV > 14 years
QualitativeYV FD: 1504
MV FD: 3556
OV FD: 1690
SIZEMDWT/1000QuantitativeRange: 10.13–269.96
Mean: 78.49 SD: 47.20053
RACTNo. of contracts per vessel/active year in the studied periodQuantitativeRange: 0.07143–46.2
Mean: 1.25011 SD: 2.562161
CTC0: VY
1: TC
Dichotomous0 FD: 8881 FD:5862
EVDIGrams of CO2
per tonne nautical mile
QuantitativeRange: 1.92–14.93
Mean: 4.696 SD: 1.372506
VINFOB0: Unverified info.
1: Verified info.
Dichotomous0 FD: 28801 FD: 3870
* Standard Deviation (SD) and Frequency Distribution (FD).
Table 8. Estimation of the regression coefficients, significance of the individual variables, odds ratios and standardized coefficients.
VariableEstimated CoefficientsStd. ErrorZ ValueSignificance Pr(>|z|)a)Odds RatioStandardized Coefficients
(Constant)−6.6207440.465344−14.2280.0000 *****0.0013
AGEAC_MV−0.4980430.095494−5.2150.0000 *****0.6077−0.4510582
AGEAC_OV−1.4406750.0131916−10.9210.0000 *****0.2368−1.1321457
SIZEM0.0112610.0017396.4770.0000 *****1.01130.9640811
RACT0.9854590.04496421.9160.0000 *****2.67904.5796698
CTC−0.3505230.150543−2.3280.0199 ***0.7043−0.2149137
EVDI0.6374570.05571611.4410.0000 *****1.89171.5869178
VINFOB1.2270240.10046812.2130.0000 *****3.41111.1008358
***** < 0.001 *** < 0.05; Number of observations: 6750; McFadden Pseudo-R2: 0.2612194.
Table 9. Hypothesis testing.
HypothesisDescriptionPredicted Relationship with InvestmentSign Validation
H1A negative effect of the age of the vessel in active use is expected on the probability of investing in energy efficiency.-Validated
H2A positive effect of vessel’s size is expected on the probability of investing in energy efficiency.+Validated
H3A positive effect of the vessel’s activity is expected on the probability of investing in energy efficiency.+Validated
H4A negative effect of Time Charter contracts is expected on the probability of investing in energy efficiency.-Validated
H5A positive effect of Voyage Charter contracts is expected on the probability of investing in energy efficiency.+Validated
H6A positive effect of the level of emissions is expected on the probability of investing in energy efficiency.+Validated
H7A positive effect of verified information is expected on the probability of investing in energy efficiency.+Validated
H8A negative effect of the unverified information or lack of verified information is expected on the probability of investing in energy efficiency.-Validated
H9Regulation on emissions and EE in maritime shipping are expected to have a positive effect on the probability of investing in energy efficiency.+Validated

