Abstract
Academic research has shed light on the empirical relationships among a firm’s corporate social responsibility (CSR), corporate social irresponsibility (CSiR) and firm performance and on the firm’s customer satisfaction–firm performance relationship in different markets. However, little notice has been taken of whether the coexistence of corporate social responsibility, corporate social irresponsibility and customer satisfaction has an interactive effect on firm performance. This study aims to examine the effects of their interaction on firm performance from an investment perspective. Using unbalanced panel regression to test a sample of publicly traded firms from the United States, this study finds that, in general, firms with higher customer satisfaction earn positive changes in abnormal stock returns. For firms that engage in CSR, CSR positively affects corporate performance, whereas firms’ social irresponsibility activities reduce firms’ financial performance. All else equal, a positive interactive effect of CSiR and customer satisfaction on stock return was observed. The results reveal that high customer satisfaction can alleviate the negative effect of corporate social irresponsibility on firms’ financial performance. Our findings will help management executives and investors to understand that the negative effect of a firm’s unforeseen events on firm performance can be weakened by increasing customer satisfaction.
1. Introduction
Prior studies have examined the influences of corporate social responsibility (hereafter, CSR) on important outcomes in the financial markets. Recent studies have examined various elements of this relationship. For example, Chen, Dong and Lin [1], Nguyen, Kecskés and Mansi [2] and Oikonomou, Yin and Zhan [3] investigate the relevance of CSR to investors’ investment decisions; Jin, Cheng and Zeng [4] investigate the stock market’s impact on firms’ corporate socially irresponsible (hereafter, CSiR) events. While previous research explicitly indicates CSR and customer satisfaction as intangible assets that work in achieving a firm’s sustainable competitive advantage and higher performance. However, research regarding the impact of CSR, CSiR, customer satisfaction and their interaction on firm performance for a firm is relatively few. From an investment perspective, this paper investigates the relationship between CSR, CSiR, customer satisfaction and their interaction and stock returns.
In 2015, 92% of the world’s 250 largest companies released a CSR report to illustrate the importance that they attached to CSR activities. According to a recent special report in the Harvard Business Review [5], Fortune Global 500 companies annually spend approximately US$20 billion on socially responsible investment (SRI). SRI is becoming increasingly popular because of the increase in funds invested according to socially responsible criteria, constituting more than US$11.6 trillion in assets under management in the Unites States in 2018. (https://www.ussif.org/files/2018%20_Trends_OnePager_Overview(2).pdf) A recent survey indicated that a large majority of chief executive officers (CEOs) believe that CSR improves firm competitiveness and is crucial for a firm’s future success [6]. CSR is a high-profile notion that has strategic importance to numerous companies. During the last two decades, the concept of CSR performance has become a mainstream preoccupation in the corporate world as well as the academic domain. The widespread practice of emphasizing CSR goals and multiple theoretical perspectives supporting a firm’s strategic emphases imply that empirical evidence on the CSR–performance relationship should consistently support a positive relationship [7,8,9]. However, a qualitative review of the literature reveals that evidence of the CSR–performance relationship is relatively inconsistent [10,11,12]. One reason for the conflicting findings on the CSR–performance relationship is the aggregation of CSR and corporate social irresponsibility (CSiR) into an overall measure by the majority of studies [13,14]. Another potential question to address before we proceed is this: do investors follow firms’ CSR or CSiR announcements?
CSR initiatives are a firm’s activities which aim to improve the wellbeing of stakeholders or society at large [15]. By contrast, CSiR refers to a firm’s actions that negatively affect the welfare of stakeholders or society at large [16]. Strike, Gao and Bansal [17] and Lee, Oh and Kim [18] indicate that a firm is likely to simultaneously engage in CSR and CSiR. For instance, Walmart has implemented fair labor practices in its foreign subsidiaries and suppliers; however, the Bangladeshi factories that produced goods for Walmart were found to have mistreated their workers [19]. Lenz et al. [13] decompose a firm’s CSR activities into CSR and CSiR activities and determine that a positive CSR–performance relationship is significantly attenuated by the existence of CSiR. Kim et al. [14] demonstrate that CSR enhances firm value when a firm’s competitive action level is high, whereas CSiR improves firm performance when the competitive action level is low. However, studies have extensively used Tobin’s Q, a financial-market-based measure used as a proxy for firm performance, to examine the link between CSR activities and firm performance (for reviews of the literature, see [8,20]). Scholars have emphasized the theoretical relevance of Tobin’s Q as a financial determinant of investment behavior [21]; however, the performance of investments such as asset expected returns is essential to the financial wellbeing of investors and thus affects their trading decisions [22]. From an investment perspective, these results raise the intriguing question of whether CSR relates to a firm’s stock returns as it does to a firm’s Tobin’s Q.
From the market force perspective, Brønn and Vrioni [23] indicate that strong CSR implies a powerful cause-related marketing tool that can enhance customer perceptions such as loyalty; strong CSR builds and shape a company’s reputation, thereby increasing profitability, and therefore, a firm’s CSR activities can be viewed as a form of reputation building or maintain [24], and CSR strategies can be used to create a sustainable competitive advantage [25]. The stakeholder theory literature also confirms the evidence of CEOs beliefs that CSR strategies can reinforce intangible assets such as reputation, contributing to a firm’s competitiveness and economic performance [14,20]. However, CSR addresses social objectives and stakeholders other than shareholders [26], implying that firms’ intangible assets are developed through voluntary corporate actions instead of efforts regarding products or services. Researchers and managers have begun to examine which factors affect firms’ intangible assets, such as company reputation, and thus influence firm value. A rising strand of research shows that intangible values of firms in the form of customer satisfaction bring about significant benefit to stakeholders [27,28,29]. In particular, customer value is on the mission statements of many large corporations (e.g., Amazon, TOYOTA and CISICO) and has become a sought-after source of competitive advantage. According to a resource-based view of the firm [25], CSR strategies can be used to create sustainable competitive advantage. We posed the following question: if customer satisfaction is associated with firm value, can higher customer satisfaction facilitate (alleviate) the positive (negative) relationship between CSR (CSiR) and firm performance?
As mentioned above, there is a rich body of literature that examines the linkage between customer satisfaction and financial performance [29,30] or analyzes the influence of firms’ CSR and CSiR activities on firms’ value [13,14]. However, Luo and Bhattacharya [7] conducted the first study investigating the potential relationship between CSR, customer satisfaction and firm performance. Because of data availability, they do not examine the potential negative effect of CSiR on firm performance. The relationship between CSR and firm performance is discovered to be amplified in firms with higher product quality. They conclude that a proper mix of internal corporate abilities such as customer satisfaction and external CSR initiatives are more likely to generate and sustain firm value. Surroca, Tribó and Waddock [31] suggest that internal corporate capabilities such as customer satisfaction can moderate the relationships between CSR and market value. Based on a resource-based view of the firm, the present study relies on the insight of Luo and Bhattacharya [7] that the impact of CSR on firm performance depends on the level of customer satisfaction. We expect that customer satisfaction may negatively affect the relationship between CSiR and firm stock return. Accordingly, the second goal of this study is to investigate whether CSR (CSiR) and customer satisfaction synergistically affect firms’ stock returns. Following the criteria of Kim et al. [14], this study decomposes CSR initiatives into CSR and CSiR to investigate whether CSR, CSiR, customer satisfaction and the interactive effects between CSR (CSiR) and customer satisfaction influence stock returns.
The rest of this paper is organized as follows. Section 2 presents the literature review and develops our research hypotheses from an investment perspective to reconcile our evidence. Section 3 details the empirical models in this study. Section 4 describes the data. This is followed by a discussion of the empirical results and managerial implications. Finally, the conclusions are presented.
2. Theoretical Framework
2.1. CSR and Firm Performance
Although the definition of CSR is not always clear [12], the literature suggests that it is a general measure of how a firm serves other stakeholders, communities and the environment. Recent studies show that, through CSR activities, firms can not only generate favorable stakeholder attitude and better improve support behaviors but also earn reputation, strengthen stakeholder–company relationships, enhance stakeholders’ advocacy behaviors [32], gain traction in the evolving investor and consumer market, as well as, eventually, enhance firm value [5]. These facts align well with the notion that CSR enhances firm value. Skroupa [33] reports that approximately 70% of high-net-worth millennials invest more money in companies with a higher level of CSR. Meier and Cassar [34] demonstrate that the CSR activities of the world’s 250 largest companies, according to the companies themselves, increased from 64% in 2005 to 92% in 2015. Brière, Peillex and Ureche-Rangau [35] mention that the market scale of CSR mutual funds constituted more than US$8 trillion in assets under management in the United States in 2016.
Accordingly, many studies have examined whether CSR positively affects firm value represented, for example, by Tobin’s Q. From the market force perspective, recent studies have indicated that engaging in CSR initiatives can help firms to earn reputation and obtain support from diverse stakeholders, eventually increasing the firm’s financial performance [14] and reducing risks [36]. Lins et al. [36] show that, during the 2008–2009 financial crisis, firms with higher CSR experienced higher profitability, growth and sales per employee relative to firms with lower CSR. From the perspective of resource-based theory, McWilliams and Siegel [25] indicate that CSR strategies can be used to build a firm’s sustainable competitive advantage. Meanwhile, sustainable competitive advantages positively influence cross-sectional stock returns [37]. Although there appears to be more support for the view that CSR activities are positively related to Tobin’s Q and other accounting ratios [9], some studies have reported a weak or neutral relationship between CSR and firm performance. Kim et al. [14] observe that CSR significantly positively affects firm performance, whereas the relationship between CSiR and firm performance is insignificantly positive. Lenz et al. [13] confirm a positive relationship between CSR and firm performance and determine that the positive effect of CSR on firm performance is significantly attenuated by the existence of CSiR. Accordingly, the results appear to be inconclusive owing to the failure to decompose CSR into socially responsible and socially irresponsible activities.
Investors’ trading behavior may significantly affect asset prices. Brzeszczyński and McIntosh [10] and Statman, Fisher and Anginer [38] report that investors are willing to sacrifice their investment returns if social benefits can be achieved through their investments. Bollen [39] determines that investors have a multi-attribute utility function: they combine their investments’ social responsibility and return characteristics during their investment decision making. However, much less notice has been taken of the increasing attention of investors to sustainable investment [10] and its impact on individual stock returns. From an investment perspective, this study expects that investors should pay attention to CSR and thereby positively affect their investment returns. Therefore, we propose the following hypothesis:
Hypothesis 1.
An increase in CSR leads to a positive change in stock price.
2.2. CSiR and Firm Performance
CSiR, the antithesis of CSR, refers to firm actions that adversely affect the wellbeing of stakeholders or society at large. The literature documents that CSiR undermines a firm’s corporate reputation and brand image [32] as well as affecting the firm’s relationship with various stakeholders, ultimately harming firm performance and increasing firm risk [40]. According to Massa [41] and Bollen [39], investors are concerned about the moral and social wellbeing connotations of corporate activity and are likely to profit from SRI. However, the performance differential between SRI and benchmark market returns is found to be insignificant or significantly negative [10,35,42]. The reason for the conflicting evidence of the positive boom in SRI and underperforming investment is that CSR and CSiR, conceptually distinct constructs, should be considered separately and simultaneously rather than being combined.
Recent articles have indicated that firms engage in CSR and CSiR concurrently [14,16,17] and have indicated that CSiR regularly occurs in the majority of firms that engage in CSR [43]. For instance, positive stakeholder news is released around CEO stock option granting dates [44]. In 2000, Exxon Mobil offered strong retirement benefits programs for its employees; simultaneously, the company faced major controversies related to workforce health and safety issues [40]. Socially irresponsible firms may be involved in more negative messages and negative stories than others when their faults become public [45]. Thus, stakeholders may interpret firms’ CSiR activities as insincere, and these are likely to induce higher physiological activation than others [18], which reduces stakeholders trust, affects firm reputation and attenuates or inverses the positive CSR impact on firm value. Studies have indicated that a firm’s CSR is ineffective in offsetting the negative effects of CSiR on firm performance [16]. Jayachandran, Kalaignanam and Eilert [46] indicate that the negative impact of CSiR is stronger than CSR’s positive effect on firm performance. We decompose CSR into socially responsible and socially irresponsible activities to investigate the coexisting influences of CSR and CSiR on individual firms’ stock return and hypothesize the following:
Hypothesis 2.
An increase in CSiR leads to a negative change in stock returns.
2.3. Effects of CSR, CSiR and Customer Satisfaction on Stock Return
According to stakeholder theory, CSR is viewed as an intangible asset that significantly positively affects customer-related outcomes such as loyalty, stakeholder attitudes and advocacy behaviors, leading to future cash flows and market share gains [7,13,17]. Studies on customer satisfaction have indicated that the beneficial effects of CSR on customers’ and investors’ behaviors result in increased firm value. Empirical evidence has been obtained showing that firms with higher customer satisfaction can earn higher loyalty, reduce the costs of attracting new customers and have higher reputation in the marketplace, thereby leading to higher stock market returns [30,47].
CSR and customer satisfaction are potentially crucial sources of intangible capital that positively influences firm value. Huberman and Regev [48] indicate that prices react to new information only when investors pay attention to it. Whether investors follow firms’ CSR and strong customer satisfaction information announcements to help make investment decisions is unclear. Recent studies have documented that awareness of a company’s CSR initiatives among its stakeholders is typically low [26], but investors follow American Consumer Satisfaction Index (ACSI) announcements, and such announcements encourage their trading, thereby generating significantly positive stock returns [41,42]. Moreover, engaging in CSR and increasing customer satisfaction could be regarded as strategies to create a sustainable competitive advantage that is positively related to future stock returns [37]. Thus, this study expects that firms embark on both CSR and attempt to satisfy customers to reap the benefits of the synergistic interaction between CSR and strong customer satisfaction to ensure a high stock return, in addition to using the independent effects of CSR and ACSI. Correspondingly, this study proposes the following hypothesis:
Hypothesis 3.
After controlling for the independent effects of change in CSR and the strong customer satisfaction indicator, the interaction of positive change in CSR and strong customer satisfaction is positively related to a firm’s stock return.
As mentioned, firms can be simultaneously socially responsible and socially irresponsible. CSiR weakens CSR’s positive effects on firm value. In view of resource-based theory, CSiR may weaken the sustainable competitive advantage of a firm and has a negative effect on a firm’s stock returns. One question is then whether investors pay attention to a firm’s CSiR initiatives when people are unaware of the firm’s CSR activities. Tench et al. [45] reveal that the media always report negative stories concerning a firm’s CSiR. The mass media’s coverage of a firm’s CSiR initiatives undermines the firm’s value and thereby negatively affects investors’ trading behavior and firm performance. CSiR may be the intentional or unintentional actions of a firm [43]; a firm may thus simultaneously satisfy customers and have CSiR. Peng et al. [47] report that firms with high ACSI generate significantly positive abnormal returns when markets are pessimistic. They conjecture that the intangible value of high customer satisfaction can insulate a firm’s returns from economic downturns. Therefore, this study proposes the following hypothesis:
Hypothesis 4.
After controlling for the independent effects of change in CSiR and the customer satisfaction indicator, the interaction of positive changes in CSiR and strong customer satisfaction is positively related to a firm’s stock return.
3. Methods
3.1. Data and Variable Construction
In order to examine the effects of CSR, CSiR, customer satisfaction and their interaction on firm’s financial performance separately, this study acquires data on CSR, CSiR and customer satisfaction from various databases: the Kinder, Lydenburg, Domini (KLD) Research and Analytics data set and ACSI database. Firstly, this study obtains CSR and CSiR ratings from the KLD database, which contains the most comprehensive and detailed data on firm-level CSR scores used in the literature [1,2,49] and has been widely used by academics and practitioners as a source of information on corporate social responsibility [1,2,3,26,49,50,51]. The KLD contains data on various CSR strengths and concerns (weaknesses) for seven socially irresponsibility ratings—community, corporate governance, diversity, employee relations, environment, human rights and product—for a large set of US companies since 1991. The database uses sources both internal to the firm (e.g., annual reports) and external (e.g., articles in the business press) to conduct annual assessments of the social performance of the 3000 largest US publicly traded firms by market capitalization. Based on company filings, government data, nongovernmental organization data and more than 14,000 global media sources, the KLD covers several strengths and concerns across the seven social dimensions mentioned. It provides differentiation of strength and concern binary-item measures based on whether a firm meets certain strength and concern criteria, enabling disentanglement of CSR and CSiR rather than capturing them simultaneously using an overall approach [1,13,52]. The KLD’s strength and concern criteria are assigned values of 0 or 1, and the number of measures for most dimensions has evolved over time as KLD has refined the database. The raw CSR and CSiR scores are the sum of seven-dimension scores based on the number of measures for strengths and concerns, respectively. However, the simple summation approach has a disadvantage, because the number of strength and concern measures varies considerably between years due to slight changes of the KLD measures. Therefore, the raw CSR and CSiR scores may not be helpful in evaluating a firm’s actual CSR activities over the years [49]. Accordingly, directly comparing raw CSR or CSiR scores within a category over years is inappropriate [26,49].
To overcome this concern and obtain consistent comparisons in unbalanced panel data structure, this study follows Lenz et al. [13] and Cao et al. [49], dividing the number of strengths (concerns) with a KLD rating for each firm-year within each CSR category by the maximum possible number of strengths (concerns) within the domain in the respective year. We scale the strengths and concerns for each firm-year to obtain two indicators that range from 0 to 1. The resulting scores of CSR and CSiR are scaled for each firm-year within each domain to a range of zero to one. We then sum these scaled numbers of strengths (concerns) across the seven domains, resulting in a measure anchored by 0 and 7. According to the definition, for each firm i, we can obtain two adjusted CSR and CSiR measures, denoted by CSRi,t and CSiRi,t. Higher CSR scores indicate that the firm engages in more CSR activities in time t. By contrast, higher CSiR scores indicate that the firm is more involved in CSiR in time t.
Following prior studies in marketing and finance, this study collected the customer satisfaction data from the American Customer Satisfaction Index (ACSI), which is computed annually and has been employed in a large number of studies [7,27,28,30,47,53,54,55,56,57]. Since 1994, the ACSI has been developed and maintained by the National Quality Research Center at the University of Michigan. By interviewing consumers regarding their comprehensive level of satisfaction, the ACSI measures customer satisfaction as a score on a 0 to 100 scale that is experienced by the broader and larger sample of customers instead of experts, which can reduce sampling error and delimit biases from regional differences in satisfaction tendencies [58]. (For a detail description of the ACSI database, see e.g., Aksoy et al. [30], Peng et al. [47], and Fornell, Morgeson and Hult [59]. All the ACSI data are available at https://www.theacsi.org/) Moreover, the firms in the ACSI list account for the majority of market share in their industry sectors, which are broadly representative of the US economy serving US households [30,47]. Although reporting at an annual level on the ACSI website, these ACSI scores are collected in four quarterly instalments, and a subset of firms’ ACSI scores is released in each specific release quarter. Annual satisfaction scores for each firm were collected on a quarterly basis for different industries and it is assumed that the ACSI scores for firms maintained until new ACSI scores were released in next year. By using the firms’ names as shown on the ACSI website, we merge data from KLD and ACSI databases to span the publicly traded firms in the universe of firms in our sample that received ACSI scores in each year.
Firms which do better than their competition in terms of satisfying customers generate superior performance [59]. Customer satisfaction has been recognized as a key driver of firm profitability and market value [7] but shown not to move stock prices around the public release date. This seems to suggest that it is necessary to consider both level and changes in ACSI scores because the stock market do not seem to respond immediately to changes in the score [30]. According to the method of prior studies [30,47], this study classifies each firm into one of four categories according to whether the firm’s ACSI is higher or lower than the national average-adjusted mean ACSI and whether it was non-decreasing or decreasing. The firms with high and non-decreasing ACSI are termed the strong portfolio in Aksoy et al. [30]. In this study, we classify firms belonging to the strong portfolio as strong ACSI firms by defining the dummy variable ACSIi,t that equals 1 if firm i is classified as a strong ACSI firm in time t. This study assesses whether a firm has both a changing CSR (CSiR) and strong customer satisfaction score and whether the synergistic interaction of change in CSR (CSiR) and strong customer satisfaction results in higher stock return. The raw data used to calculate control variables such as stock returns, firm size, cash asset ratio, leverage, firm profitability, turnover, liquidity and firm risk are collected from the Center for Research in Security Prices (CRSP) and Compustat. After cross-referencing these databases and accounting for lags and changes in CSR (CSiR), ACSI and financial information variables, this study obtains cross-sectional and time-series combined unbalanced panel data consisting of 285 publicly traded firms with approximately 4328 observations from 1995 to 2013 as the final sample.
3.2. Empirical Models
Following Cai, Jo and Pan [60], this study develops a model to predict an individual firm’s stock return as a function of the variables described in the previous section. Working with changes also enables us to avoid problems of spurious regression and control for firm-specific information that is not modeled [61]. The model used to test the proposed hypotheses is as follows:
where ΔPerformancei,t+1 denotes the change in annual cumulative abnormal return of stock i in time t + 1, measured by the risk-adjusted returns of the capital asset pricing model (CAPM), the Fama and French three-factor model [62] or the Carhart four-factor model [63], respectively. To obtain the annual risk-adjusted returns of each company i in month t, this study follows Peng et al. [47] and Carhart [51], running regressions on the CAPM as well as the Fama and French three-factor or Carhart four-factor models, with a rolling window over the preceding 36 monthly returns, to obtain the time-varying factor loadings over time using the following equation:
where Ri,t denotes the return on firm i in period t, and Rf,t denotes the risk-free rate in period t. RMRFt, SMBt, HMLt and MOMt denote the index investing, size investing, value investing and momentum investing strategy returns, respectively. The intercepts (alpha) from these regressions can be interpreted as risk-adjusted returns of an individual firm related to Carhart’s model. (The monthly factor-loadings data used in this study are obtained from the Kenneth R. French Data Library: http://mba.tuck.dartmouth.edu/pages/faculty/ken.french/data_library.html.) Following Peng et al. [47], we retrieve the value of alpha by estimating the expected return in excess over the realized risk premium. We use the realized factor loading of firm i during specific time periods by subtracting the firm’s monthly returns from the product of each factor realization and its estimated loadings to obtain a series of individual firm i’s monthly abnormal returns at time t (ARi,t) as follows:
This study examines the relationship between change in CSR, change in CSiR and their interactive effect on strong ACSI firms and stock return on a yearly basis. Annual cumulative abnormal returns are computed as follows:
In each case, changes in adjusted CSR and CSiR measures are denoted as ΔCSRi,t and ΔCSiRi,t. Following past studies [36,64], this study accounts for observable heterogeneity with many control variables found to influence firm performance, including change in ΔLnSizei,t (the logarithm of total assets) [13,52], change in ΔLeveragei,t (total debt to common equity ratio; D/E ratio) [20,52], change in ΔProfiti,t [36] (operating income divided by total assets), change in ΔLiquidityi,t (current ratio, as calculated by dividing book value of current assets by debt in current liabilities) [13,14], changes in ΔTurnoveri,t (dividing the total number of shares traded over month t by the number of shares outstanding for the period) [65], change in ΔIdiosyi,t (the standard deviation of the residuals from the fitted market models, estimated by the rolling regression with period t − 1 and including the past 36 months of returns) [30] and the lagged dependent variable (ΔPerformancei,t) [66] to control for the potential lagged effect of stock performance changes. Moreover, we include the industry dummies (based on all four-digit Standard Industrial Classification (SIC) code industries) and monthly time dummies to account for unobserved heterogeneity across industries and time, respectively. Industryk and Monthm are the dummies for industry and time fixed effects and εi,t ~ N(0, σ2). This study used the lagged independent variables as instrumental variables to reduce potential endogeneity concerns. Moreover, we follow Petersen [67] to test the significance of the estimated coefficients in the regression by using t-statistics based on standard errors corrected for firm and time clustering.
4. Empirical Results
4.1. Summary Statistics
Panel A and Panel B of Table 1 summarize the descriptive statistics of raw scores of our main independent variables, CSR and CSiR, during our sampling period. Consistent with Lenz et al. [13], the mean CSR and CSiR scores are all positive, indicating that CSiR actions regularly occur in firms also engaging in CSR. Table 1 demonstrates that, on average, firms’ CSiR scores are significantly higher than their CSR scores—approximately 0.30 higher (t = 10.02) during 2001 and 2009. Firms’ CSR scores are higher than their CSiR scores by approximately 0.45 between 2010 and 2013, indicating that the firms engaged in more socially responsible actions and fewer and fewer socially irresponsible initiatives after 2009 (see Figure 1).

Table 1.
Summary statistics of main independent variables: CSR and CSiR.
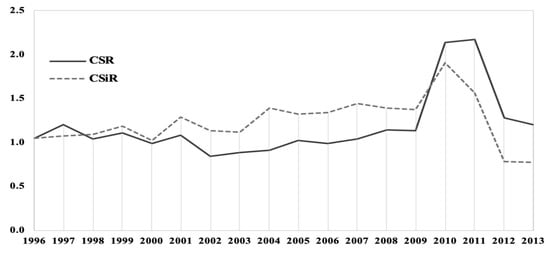
Figure 1.
Mean CSR and CSiR scores for our sample firms over period 1996–2013.
As mentioned above, this study obtains firms’ customer satisfaction data from the ACSI website. The average (median) of ACSI is 75.546 (76) and the maximum and minimum values are 90 and 54, respectively. The standard deviation of ACSI is 5.882, indicating that the level of customer satisfaction with the firms in our sample varied considerably. A dummy is assigned for a strong ACSI firm if the firm has a high and increasing ACSI in time t − 1. The summary statistics of the dependent variable and our control variables—changes in firm size, leverage, profit, liquidity, turnover and idiosyncratic risk—are reported in Table 2.
Table 2.
Descriptive statistics for dependent variable and independent variables.
Table 3 presents the Pearson (lower triangular matrix) and Spearman (upper triangular matrix) correlation coefficients and the variance inflation factors (VIFs) of all the independent variables in our empirical models. Although the pairwise correlations among the independent variables are not particularly high, ΔCSRi,t (ΔCSiRi,t) is correlated with the interactive term of ΔCSRi,t (ΔCSiRi,t) with ACSIi,t, with a correlation coefficient of 0.65 (0.62). The highest correlation coefficient between independent variables is lower than 0.7, indicating that the regression model should not exhibit the multicollinearity problem [68]. Furthermore, this study tests for potential multicollinearity by checking the VIFs in our models. Table 3 reports the VIFs of independent variables and reveals no severe multicollinearity concern, with the VIFs ranging from 1.01 to 2.37. Given that all VIFs are below the threshold of 10 and the average full collinearity of the VIF of 1.47 satisfies the 3.3 limit of Kock [69], we conclude that multicollinearity does not pose a threat to the results.
Table 3.
Correlation matrix and VIFs.
4.2. Empirical Results
Table 4 details the independent variables, control variables and variables of interest: CSR, CSiR, ACSI and their interactions. Hypotheses 1 and 2 state that CSR and CSiR have contrasting relationships with stock return performance. After controlling factors found to influence firm performance, Model 1 indicates the separate direct effects of CSR and CSiR on firm performance. An increase in a firm’s CSR score is associated with an increase in the firm’s risk-adjusted returns, indicating that investors investing in firms that engage in more CSR initiatives receive higher stock returns. Thus, Hypothesis 1 is supported. By contrast, an increase in firms’ CSiR is negatively related to performance, suggesting that firms’ CSiR actions directly damage investors’ stock returns. Thus, Hypothesis 2 is supported. The separate positive and negative effects of CSR and CSiR scores on firm stock return are found. CSiR is discovered to more strongly affect stock return than CSR. This evidence echoes previous findings, such as those of Jayachandran et al. [46], who report that CSiR’s negative effect on firm performance exceeds CSR’s positive effect. As indicated in Model 2 of Table 4, the coefficient of a strong ACSI dummy is positive and significant, supporting earlier findings that firms with a strong ACSI generate higher investment returns than those with lower ACSI [47].
Table 4.
Effects of change in CSR (change in CSiR) and strong ACSI on stock return.
Hypothesis 3 states that the interaction between ΔCSRi,t and ACSIi,t affects the positive relationship between CSR and firms’ stock returns. Hypothesis 4 states that a strong ACSI effect negatively moderates the relationship between CSiR and firms’ stock return. We rely on Model 4 to test our hypothesis because this model is a fully specified model and provides an accurate picture of the impact of each variable. Model 4 of Table 4 reports the results concerning the direction of the effects of ΔCSRi,t, ΔCSiRi,t and ACSIi,t. Consistent with the results obtained from Model 3, we find a significant positive direct effect of CSR and a significant negative effect of CSiR. We discover that the interaction between ΔCSRi,t and ACSIi,t is insignificantly negative, whereas the coefficient of the interaction between ΔCSiRi,t and ACSIi,t is significantly positive and higher than that of the direct effect of CSiR on firm stock return. This result implies that firms that maintain higher customer satisfaction have the capacity to mitigate the negative effect of CSiR on firm performance. The results confirm past studies which state that firms with a strong ACSI generate positive abnormal returns.
Model 4 illustrates the interaction effects of ΔCSRi,t (ΔCSiRi,t) and ACSIi,t on the relationship between ΔCSRi,t (ΔCSiRi,t) and firm performance. The coefficient of the interaction variable, ΔCSRi,t × ACSIi,t, is negatively but insignificantly associated with a firm’s stock returns. By contrast, the coefficient of the interaction between ΔCSiRi,t and ACSIi,t is positive and significant. There is no evidence that firms engaging in CSR generate positive market value from their higher customer satisfaction. However, our evidence supports the notion that CSiR’s negative effect on stock return is significantly weakened for firms with strong customer satisfaction. Therefore, the results obtained from Model 4 support Hypothesis 4 and refute the alternative Hypothesis 3. Regarding control variables, ΔLnSizei,t is significantly negatively related to a firm’s stock return, Furthermore, the relationships of ΔLeveragei,t, ΔLiquidityi,t and ΔIdiosyi,t with firm stock return are significantly positive.
We also examine the CAPM and Fama and French risk-adjusted returns of our empirical models. The impact of the interaction between ΔCSiRi,t and ACSIi,t is found to be positive and significant on both the CAPM and Fama and French risk-adjusted returns (Table 5). We rely on the fully specified models in Table 5 to test our arguments. For controlling for the potential persistence of firm performance over time, in Table 6, this study follows Brennan et al. [66] and examines whether there are lagged effects from the dependent variable (ΔPerformancei,t) to stock performance changes (ΔPerformancei,t+1). After considering the lagged return effect, Table 6 shows that the coefficient of the interaction variable, ΔCSRi,t × ACSIi,t, is negatively but insignificant associated with a firm’s stock returns. Meanwhile, the coefficient of the interaction between ΔCSiRi,t and ACSIi,t is positive and significant. Regarding control variables, ΔLnSizei,t and ΔPerformancei,t are significantly negatively related to a firm’s stock return changes. Furthermore, the relationships of ΔLeveragei,t, ΔLiquidityi,t and ΔIdiosyi,t with firm stock return are significantly positive. Our evidence indicates that the interaction between ΔCSRi,t and ACSIi,t has an insignificantly negative effect, whereas that between ΔCSiRi,t and ACSIi,t has a significant positive effect. This study explains the significantly positive interaction term of ΔCSiRi,t × ACSIi,t on firm performance that (1) the stock market appears to underreact to CSiR when a firm’s ACSI is high and that (2) a firm’s strong ACSI can mitigate CSiR’s negative effect on firm performance. The results are presented in Table 4, Table 5 and Table 6.
Table 5.
Impacts of CSR, CSiR and ACSI on changes in cumulative stock return.
Table 6.
Impacts of CSR, CSiR and ACSI on changes in cumulative stock return, including lagged dependent variable (ΔPerformancei,t).
4.3. Robustness Checks
Because the cumulative abnormal returns (CARs) overlap, following Gallant [70], this study employs a heteroskedasticity-and-autocorrelation-consistent (HAC) estimate of the variance, setting one-period lags equal to the number of overlapping months in the holding-period window (t + 2 to t + 12). After considering HAC effects, panel regression analysis was performed to test Hypotheses 1, 2, 3 and 4 using the cumulative abnormal returns obtained from the CAPM, Fama and French and Carhart’s models (Table 7). We obtain similar results to those presented in Table 4 and Table 5. Our findings indicate that firm ΔCSRi,t is significantly positively related to firm performance in the CAPM and Fama and French models. Meanwhile, the relationship between the direct effect of ΔCSRi,t and firm performance is insignificantly positive in Carhart model. Thus, Hypothesis 1 is partially supported. In all models, the direct effects of ΔCSiRi,t on firm performance are significantly negative. Thus, Hypothesis 2 is supported. Table 7 details results similar to those in Table 4; Table 5, indicating that the interaction terms of ΔCSiRi,t × ACSIi,t are positive and significant in pricing models. We have obtained supporting evidence: firms with a strong ACSI can undermine and reverse the negative relationship between ΔCSiRi,t and stock return.
Table 7.
Changes in cumulative abnormal returns without overlapping (t + 2 to t + 12).
This study also follows the literature [14,26] by excluding the product quality dimension, which represents a firm’s efforts in extra quality control and product safety and the corporate governance dimension, which represents voluntary corporate activities for primary stakeholders. These two dimensions appear to contribute to the wellbeing of internal shareholders rather than society. The results are consistent with those reported in Table 4, Table 5, Table 6 and Table 7.
5. Discussion and Conclusions
This study investigates whether CSR, CSiR, customer satisfaction and their interaction terms affect individual stock returns. Scholars have asserted that CSR helps a firm to acquire a competitive advantage over its competitors by building up its reputation and obtaining support from diverse stakeholders, thereby enhancing the firm’s financial performance. According to the United Nations-supported Principles for Responsible Investment (PRI) survey (the PRI survey is a survey of 1100 financial professionals, predominantly CFA members, around the world), the size of assets managed by institutions incorporated into environment, social and governance (ESG) factors has exceeded US$86 trillion, and the number of institutions which had signed up to the PRI increased from 63 to more than 2370 companies between 2006 and 2018. Recent research has revealed that firms with higher CSR scores experienced less volatility [71], as well as higher profitability, growth and sales per employee [36], during the financial crisis. Despite the fact that an increasing number of studies have supported the positive effect on firms’ performance in an investment perspective, more and more portfolio managers and analysts have selected firms on the basis of CSR criteria [72,73] but have rarely adjusted their models based on ESG information. (Brzeszczyński and McIntosh [10] and Statman, Fisher and Anginer [38] report that investors are willing to sacrifice their investment returns if social benefits can be achieved through their investments. Bollen [39] determines that investors have a multi-attribute utility function: they combine their investments’ social responsibility and return characteristics during their investment decision making.) Only 20% and 17% of the respondents believed that CSR factors such as environmental and social issues would affect their stock returns. This study obtains statistical evidence that financial markets in the United States earn rewards for CSR and are penalized for CSiR. Managers of firms can consider the potential implications of the results of this research and maintain or increase their resources on CSR activities to enhance their firms’ value.
CSR is a subject of increasing interest in business practice and marketing research, but we devote very little attention to the issue of corporate social irresponsibility [13]. CSiR is a phenomenon that is encountered time and again. CSiR may involve intentional or unintentional CSiR. Intentional CSiR indicates behavior which violates the law and legal but irresponsible behavior (potential lack of morality and opportunism) on the part of the firm. An example of violation of law like Enron is the extreme case of intentional CSiR that entails the demise of a company, while the case of a fast food manufacturer engaging in advertising near primary schools is a kind of legal but irresponsible behavior. An example like the explosion at the BP Deepwater Horizon oil rig, which released over 130 million gallons of crude oil into the Gulf of Mexico, constitutes unintentional CSiR but the pollution incident harmed wildlife and the marine environment and temporarily resulted in more than 50% loss in BP’s stock price. In theory, public disclosure of CSiR may result in a variety of negative consequences for companies and attenuate firms’ sustainable competitive advantages. However, the market may not systematically reward firms’ actions that activate and advance social good, while it does consistently punish firms exposed to CSiR. Kim et al. [14] find that firms’ CSiR improve firms’ Tobin’s Q when the competitive action level is low. In this study, we find that CSiR is significantly and negatively associated with firms’ stock returns. Investors do not appreciate firms that engage in n corporate social irresponsibility activities.
Higher customer satisfaction should increase loyalty, insulate the current market share from competitors, help to build a firm’s reputation, open the opportunity for new sources of revenue and increase investor recognition, and anticipated future cash flows should increase, boosting firm value and stock returns [27,47,74,75,76]. Previous research has presented the idea that customer satisfaction as an intangible asset works in achieving a sustainable competitive advantage. Regarding the direct effect of customer satisfaction, using Aksoy et al.’s [30] approach, the findings of this study are consistent with the marketing literature: higher customer satisfaction positively affects a firm’s stock returns [20]. With regard to the interactive effects of CSR, CSiR and ACSI on a firm’s financial performance, we do not find a significant synergistic effect of CSR and ACSI on firm performance. However, our research shows evidence that the relationship between the synergistic effect of CSiR and ACSI is positive.
Our results suggest that our understanding of the ACSI mechanism is strongly enriched when firms encounter difficulties in a series of unfortunate events not deliberately inflicted by a corporation. This study makes two key contributions. Firstly, our evidence offers a novel understanding of the stock market effects of CSR, CSiR and the interaction between CSR (CSiR) and customer satisfaction to the growing literature on CSR. This understanding is essential for researchers, practitioners and investors considering the ongoing debate regarding whether investors benefit from SRI. For instance, a firm’s CSiR can be caused by unforeseen events such as an earthquake that could lead to the explosion of a power plant. This unintentional CSiR may entail a variety of negative consequence for the company value. Secondly, our results reveal that firms with higher customer satisfaction can undermine and reverse the negative effect of CSiR on their stock return. These findings are useful for management executives and investors. For firm managers, our findings can help them to allocate limited resources more efficiently to increase their customer satisfaction and then increase firm performance. From an investment perspective, investors can look to invest in firms with strong ACSI scores.
6. Limitations and Future Research Directions
Although the findings of this study are very encouraging, some limitations may pave new directions for future research. Firstly, by using firms’ ACSI data to investigate the synergistic effects of CSR, CSiR and ACSI on firm performance, this study is limited to the sample of firms which have both ACSI and KLD scores. Secondly, the KLD data set has been elaborating over the years and variables have been modified, added or dropped. In addition, some firms have missed through mergers and acquisition and such changes have not been considered in the KLD database, therefore, the nominal firms’ KLD scores at different periods are not directly compared across periods. Prior studies have reported that different independent effects of CSR, CSiR and ACSI on stock returns in different market states do exist. The results of this study thus call for future research to examine the effects of CSR, CSiR, ACSI and their interaction on firm performance under different market conditions.
Author Contributions
Conceptualization, A.-P.W. and C.-L.P.; methodology, A.-P.W. and C.-L.P.; software, A.-P.W.; validation, A.-P.W., C.-L.P., H.-C.H. and S.-P.Y.; formal analysis, A.-P.W. and C.-L.P.; investigation, A.-P.W. and C.-L.P.; resources, A.-P.W.; data curation A.-P.W.; writing—original draft preparation, A.-P.W. and C.-L.P.; writing—review and editing, H.-C.H. and S.-P.Y.; project administration, C.-L.P.; funding acquisition, A.-P.W. All authors have read and agreed to the published version of this manuscript.
Funding
This research was funded by the National Natural Science Foundation of China (grant number 71703176 and 71702203) and by the Ministry of Science and Technology of Taiwan (grant numbers MOST-106-2410-H-992-001-).
Conflicts of Interest
The authors declare no conflict of interest.
References
- Chen, T.; Dong, H.; Lin, C. Institutional shareholders and corporate social responsibility. J. Financ. Econ. 2020, 135, 483–504. [Google Scholar] [CrossRef]
- Nguyen, P.-A.; Kecskés, A.; Mansi, S. Does corporate social responsibility create shareholder value? The importance of long-term investors. J. Bank. Financ. 2020, 112, 105217. [Google Scholar] [CrossRef]
- Oikonomou, I.; Yin, C.; Zhao, L. Investment horizon and corporate social performance: The virtuous circle of long-term institutional ownership and responsible firm conduct. Eur. J. Financ. 2019, 26, 14–40. [Google Scholar] [CrossRef]
- Jin, Y.; Cheng, C.; Zeng, H. Is evil rewarded with evil? The market penalty effect of corporate environmentally irresponsible events. Bus. Strat. Environ. 2019, 29, 846–871. [Google Scholar] [CrossRef]
- Marti, C.P.; Drescher, L.G.J.; Martí-Ballester, C.; Rovira-Val, M.R. Are Firms that Contribute to Sustainable Development Better Financially? Corp. Soc. Responsib. Environ. Manag. 2013, 22, 305–319. [Google Scholar] [CrossRef]
- Kiron, D. Sustainability nears a tipping point. Strateg. Dir. 2012, 28, 69–74. [Google Scholar] [CrossRef]
- Luo, X.; Bhattacharya, C. Corporate Social Responsibility, Customer Satisfaction, and Market Value. J. Mark. 2006, 70, 1–18. [Google Scholar] [CrossRef]
- Socoliuc, M.; Cosmulese, C.G.; Ciubotariu, M.-S.; Mihaila, S.; Gliga, I.D.; Grosu, V. Sustainability Reporting as a Mixture of CSR and Sustainable Development. A Model for Micro-Enterprises within the Romanian Forestry Sector. Sustainability 2020, 12, 603. [Google Scholar] [CrossRef]
- Yang, M.; Bento, P.; Akbar, A. Does CSR Influence Firm Performance Indicators? Evidence from Chinese Pharmaceutical Enterprises. Sustainability 2019, 11, 5656. [Google Scholar] [CrossRef]
- Brzeszczynski, J.; McIntosh, G. Performance of Portfolios Composed of British SRI Stocks. J. Bus. Ethics 2013, 120, 335–362. [Google Scholar] [CrossRef]
- McWilliams, A.; Siegel, D.S. Corporate social responsibility and financial performance: Correlation or misspecification? Strateg. Manag. J. 2000, 21, 603–609. [Google Scholar] [CrossRef]
- McWilliams, A.; Siegel, D. Corporate Social Responsibility: A Theory of the Firm Perspective. Acad. Manag. Rev. 2001, 26, 117–127. [Google Scholar] [CrossRef]
- Lenz, I.; Wetzel, H.A.; Hammerschmidt, M. Can doing good lead to doing poorly? Firm value implications of CSR in the face of CSI. J. Acad. Mark. Sci. 2017, 45, 677–697. [Google Scholar] [CrossRef]
- Kim, K.-H.; Kim, M.; Qian, C. Effects of Corporate Social Responsibility on Corporate Financial Performance: A Competitive-Action Perspective. J. Manag. 2015, 44, 1097–1118. [Google Scholar] [CrossRef]
- Korschun, D.; Bhattacharya, C.; Swain, S.D. Corporate Social Responsibility, Customer Orientation, and the Job Performance of Frontline Employees. J. Mark. 2014, 78, 20–37. [Google Scholar] [CrossRef]
- Kang, C.; Germann, F.; Grewal, R. Washing Away Your Sins? Corporate Social Responsibility, Corporate Social Irresponsibility, and Firm Performance. J. Mark. 2016, 80, 59–79. [Google Scholar] [CrossRef]
- Strike, V.M.; Gao, J.; Bansal, P. Being good while being bad: Social responsibility and the international diversification of US firms. J. Int. Bus. Stud. 2006, 37, 850–862. [Google Scholar] [CrossRef]
- Lee, K.; Oh, W.-Y.; Kim, N. Social Media for Socially Responsible Firms: Analysis of Fortune 500’s Twitter Profiles and their CSR/CSIR Ratings. J. Bus. Ethics 2013, 118, 791–806. [Google Scholar] [CrossRef]
- Clifford, S. Wal-Mart Is Being Pressed to Disclose How Global Suppliers Treat Workers. Available online: https://www.nytimes.com/2011/05/31/business/31walmart.html (accessed on 20 May 2020).
- Flammer, C. Does Corporate Social Responsibility Lead to Superior Financial Performance? A Regression Discontinuity Approach. Manag. Sci. 2015, 61, 2549–2568. [Google Scholar] [CrossRef]
- Landsman, W.R.; Shapiror, A.C. Tobin’s q and the Relation between Accounting ROI and Economic Return. J. Account. Audit. Finance 1995, 10, 103–118. [Google Scholar] [CrossRef]
- Grinblatt, M.; Keloharju, M.M. What Makes Investors Trade? J. Financ. 2001, 56, 589–616. [Google Scholar] [CrossRef]
- Brønn, P.S.; Vrioni, A.B. Corporate social responsibility and cause-related marketing: An overview. Int. J. Advert. 2001, 20, 207–222. [Google Scholar] [CrossRef]
- McWilliams, A.; Siegel, D.S.; Wright, P.M. Corporate Social Responsibility: Strategic Implications. J. Manag. Stud. 2006, 43, 1–18. [Google Scholar] [CrossRef]
- McWilliams, A.; Siegel, D.S. Creating and Capturing Value. J. Manag. 2010, 37, 1480–1495. [Google Scholar] [CrossRef]
- Servaes, H.; Tamayo, A. The Impact of Corporate Social Responsibility on Firm Value: The Role of Customer Awareness. Manag. Sci. 2013, 59, 1045–1061. [Google Scholar] [CrossRef]
- Anderson, E.W.; Fornell, C.; Mazvancheryl, S.K. Customer Satisfaction and Shareholder Value. J. Mark. 2004, 68, 172–185. [Google Scholar] [CrossRef]
- Rego, L.L.; Morgan, N.A.; Fornell, C. Reexamining the Market Share–Customer Satisfaction Relationship. J. Mark. 2013, 77, 1–20. [Google Scholar] [CrossRef]
- Otto, A.S.; Szymanski, D.M.; Varadarajan, R. Customer satisfaction and firm performance: Insights from over a quarter century of empirical research. J. Acad. Mark. Sci. 2019, 48, 543–564. [Google Scholar] [CrossRef]
- Aksoy, L.; Cooil, B.; Groening, C.; Keiningham, T.L.; Yalcin, A.; Yalçın, A. The Long-Term Stock Market Valuation of Customer Satisfaction. J. Mark. 2008, 72, 105–122. [Google Scholar] [CrossRef]
- Surroca, J.; Tribó, J.A.; Waddock, S. Corporate responsibility and financial performance: The role of intangible resources. Strateg. Manag. J. 2009, 31, 463–490. [Google Scholar] [CrossRef]
- Du, S.; Bhattacharya, C.B.; Sen, S. Maximizing Business Returns to Corporate Social Responsibility (CSR): The Role of CSR Communication. Int. J. Manag. Rev. 2010, 12, 8–19. [Google Scholar] [CrossRef]
- Skroupa, C.P. CSR: How Fortune 500 Companies Measure up. Available online: https://skytopstrategies.com/csr-fortune-500-companies-measure/ (accessed on 20 May 2020).
- Meier, S.; Cassar, L. Stop Talking about How CSR Helps Your Hottom Line. Harvard Business Review. Available online: https://hbr.org/2018/01/stop-talking-about-how-csr-helps-your-bottom-line (accessed on 20 May 2020).
- Brière, M.; Peillex, J.; Ureche-Rangau, L. Do Social Responsibility Screens Matter When Assessing Mutual Fund Performance? Financ. Anal. J. 2017, 73, 53–66. [Google Scholar] [CrossRef]
- Lins, K.V.; Servaes, H.; Tamayo, A. Social Capital, Trust, and Firm Performance: The Value of Corporate Social Responsibility during the Financial Crisis. J. Financ. 2017, 72, 1785–1824. [Google Scholar] [CrossRef]
- Liu, Y.; Mantecon, T. Is sustainable competitive advantage an advantage for stock investors? Q. Rev. Econ. Financ. 2017, 63, 299–314. [Google Scholar] [CrossRef]
- Statman, M.; Fisher, K.L.; Anginer, D. Affect in a Behavioral Asset-Pricing Model. Financ. Anal. J. 2008, 64, 20–29. [Google Scholar] [CrossRef]
- Bollen, N.P.B. Mutual Fund Attributes and Investor Behavior. J. Financ. Quant. Anal. 2007, 42, 683–708. [Google Scholar] [CrossRef]
- Oikonomou, I.; Brooks, C.; Pavelin, S. The Impact of Corporate Social Performance on Financial Risk and Utility: A Longitudinal Analysis. Financ. Manag. 2012, 41, 483–515. [Google Scholar] [CrossRef]
- Massa, M. How do family strategies affect fund performance? When performance-maximization is not the only game in town. J. Financ. Econ. 2003, 67, 249–304. [Google Scholar] [CrossRef]
- Bauer, R.; Derwall, J.; Otten, R. The Ethical Mutual Fund Performance Debate: New Evidence from Canada. J. Bus. Ethics 2006, 70, 111–124. [Google Scholar] [CrossRef]
- Price, J.M.; Sun, W. Doing good and doing bad: The impact of corporate social responsibility and irresponsibility on firm performance. J. Bus. Res. 2017, 80, 82–97. [Google Scholar] [CrossRef]
- Aboody, D.; Kasznik, R. CEO stock option awards and the timing of corporate voluntary disclosures. J. Account. Econ. 2000, 29, 73–100. [Google Scholar] [CrossRef]
- Tench, R.; Bowd, R.; Jones, B. Perceptions and perspectives: Corporate social responsibility and the media. J. Commun. Manag. 2007, 11, 348–370. [Google Scholar] [CrossRef]
- Jayachandran, S.; Kalaignanam, K.; Eilert, M. Product and environmental social performance: Varying effect on firm performance. Strateg. Manag. J. 2013, 34, 1255–1264. [Google Scholar] [CrossRef]
- Peng, C.-L.; Lai, K.-L.; Chen, M.-L.; Wei, A.-P. Investor sentiment, customer satisfaction and stock returns. Eur. J. Mark. 2015, 49, 827–850. [Google Scholar] [CrossRef]
- Huberman, G.; Regev, T. Contagious Speculation and a Cure for Cancer: A Nonevent that Made Stock Prices Soar. J. Financ. 2001, 56, 387–396. [Google Scholar] [CrossRef]
- Cao, J.; Liang, H.; Zhan, X. Peer Effects of Corporate Social Responsibility. Manag. Sci. 2019, 65, 5487–5503. [Google Scholar] [CrossRef]
- Cui, J.; Jo, H.; Na, H. Does Corporate Social Responsibility Affect Information Asymmetry? J. Bus. Ethics 2016, 148, 549–572. [Google Scholar] [CrossRef]
- Hasan, I.; Kobeissi, N.; Liu, L.; Wang, H. Corporate Social Responsibility and Firm Financial Performance: The Mediating Role of Productivity. J. Bus. Ethics 2016, 149, 671–688. [Google Scholar] [CrossRef]
- Deng, X.; Kang, J.-K.; Low, B.S. Corporate social responsibility and stakeholder value maximization: Evidence from mergers. J. Financ. Econ. 2013, 110, 87–109. [Google Scholar] [CrossRef]
- Ivanov, V.; Joseph, K.; Wintoki, M.B. Disentangling the market value of customer satisfaction: Evidence from market reaction to the unanticipated component of ACSI announcements. Int. J. Res. Mark. 2013, 30, 168–178. [Google Scholar] [CrossRef]
- Sorescu, A.B.; Sorescu, S. Customer Satisfaction and Long-Term Stock Returns. J. Mark. 2016, 80, 110–115. [Google Scholar] [CrossRef]
- Huang, M.-H.; Trusov, M. Customer satisfaction underappreciation: The relation of customer satisfaction to CEO compensation. Int. J. Res. Mark. 2020, 37, 129–150. [Google Scholar] [CrossRef]
- Lim, L.G.; Tuli, K.R.; Grewal, R. Customer Satisfaction and Its Impact on the Future Costs of Selling. J. Mark. 2020, 84, 23–44. [Google Scholar] [CrossRef]
- Luo, X.; Zhang, R.; Zhang, W.; Aspara, J. Do institutional investors pay attention to customer satisfaction and why? J. Acad. Mark. Sci. 2013, 42, 119–136. [Google Scholar] [CrossRef]
- Mittal, V.; Kamakura, W.A.; Govind, R. Geographic Patterns in Customer Service and Satisfaction: An Empirical Investigation. J. Mark. 2004, 68, 48–62. [Google Scholar] [CrossRef]
- Fornell, C.; Morgeson, F.V.; Hult, G.T.M. Stock Returns on Customer Satisfaction Do Beat the Market: Gauging the Effect of a Marketing Intangible. J. Mark. 2016, 80, 92–107. [Google Scholar] [CrossRef]
- Cai, Y.; Jo, H.; Pan, C. Doing Well While Doing Bad? CSR in Controversial Industry Sectors. J. Bus. Ethics 2011, 108, 467–480. [Google Scholar] [CrossRef]
- Angulo-Ruiz, L.F.; Donthu, N.; Prior, D.; Rialp, J. How does marketing capability impact abnormal stock returns? The mediating role of growth. J. Bus. Res. 2018, 82, 19–30. [Google Scholar] [CrossRef]
- Fama, E.F.; French, K.R. Common risk factors in the returns on stocks and bonds. J. Financ. Econ. 1993, 33, 3–56. [Google Scholar] [CrossRef]
- Carhart, M.M. On Persistence in Mutual Fund Performance. J. Financ. 1997, 52, 57–82. [Google Scholar] [CrossRef]
- Dyck, A.; Lins, K.V.; Roth, L.; Wagner, H.F. Do institutional investors drive corporate social responsibility? International evidence. J. Financ. Econ. 2019, 131, 693–714. [Google Scholar] [CrossRef]
- Lin, Y.E.; Chu, C.C.; Omura, A.; Li, B.; Roca, E. Arbitrage risk and the cross-section of stock returns: Evidence from China. Emerg. Mark. Rev. 2020, 43, 100609. [Google Scholar] [CrossRef]
- Brennan, M.J.; Chordia, T.; Subrahmanyam, A. Alternative factor specifications, security characteristics, and the cross-section of expected stock returns. J. Financ. Econom. 1998, 49, 345–373. [Google Scholar] [CrossRef]
- Petersen, M.A. Estimating Standard Errors in Finance Panel Data Sets: Comparing Approaches. Rev. Finance Stud. 2008, 22, 435–480. [Google Scholar] [CrossRef]
- Lehaney, B.; Mason, R.D.; Lind, D.A. Statistical Techniques in Business and Economics. J. Oper. Res. Soc. 1991, 42, 187. [Google Scholar] [CrossRef]
- Kock, N. Common Method Bias: A Full Collinearity Assessment Method for PLS-SEM; Springer Science and Business Media LLC: Berlin, Germany, 2017; pp. 245–257. [Google Scholar]
- Gallant, A.R. Nonlinear Statistical Models; John Wiley and Sons: New York, NY, USA, 2009. [Google Scholar]
- Bouslah, K.; Kryzanowski, L.; M’Zali, B. Social Performance and Firm Risk: Impact of the Financial Crisis. J. Bus. Ethics 2016, 149, 643–669. [Google Scholar] [CrossRef] [PubMed]
- Riedl, A.; Smeets, P. Why Do Investors Hold Socially Responsible Mutual Funds? J. Financ. 2017, 72, 2505–2550. [Google Scholar] [CrossRef]
- Ammann, M.; Bauer, C.; Fischer, S.; Müller, P. The impact of the Morningstar Sustainability Rating on mutual fund flows. Eur. Financ. Manag. 2018, 25, 520–553. [Google Scholar] [CrossRef]
- Gong, Y.; Ho, K.; Lo, C.; Karathanasopoulos, A.; Jiang, I.-M. Forecasting price delay and future stock returns: The role of corporate social responsibility. J. Forecast. 2019, 38, 354–373. [Google Scholar] [CrossRef]
- Homburg, C.; Koschate, N.; Hoyer, W.D. Do Satisfied Customers Really Pay More? A Study of the Relationship between Customer Satisfaction and Willingness to Pay. J. Mark. 2005, 69, 84–96. [Google Scholar] [CrossRef]
- Truong, C.; Nguyen, T.H.; Huynh, T. Customer satisfaction and the cost of capital. Rev. Account. Stud. 2020, 1–50. [Google Scholar] [CrossRef]

© 2020 by the authors. Licensee MDPI, Basel, Switzerland. This article is an open access article distributed under the terms and conditions of the Creative Commons Attribution (CC BY) license (http://creativecommons.org/licenses/by/4.0/).