Article

Artificial Intelligence in the Urban Environment: Smart Cities as Models for Developing Innovation and Sustainability

by
Anabel Ortega-Fernández
,
Rodrigo Martín-Rojas
* and
Víctor Jesús García-Morales
Department of Business and Management, Facultad de Ciencias Economicas y Empresariales, Universidad de Granada, Campus de Cartuja s/n, 18071 Granada, Spain
*
Author to whom correspondence should be addressed.
Sustainability 2020, 12(19), 7860; https://doi.org/10.3390/su12197860
Submission received: 20 August 2020 / Revised: 10 September 2020 / Accepted: 14 September 2020 / Published: 23 September 2020
(This article belongs to the Special Issue Advances in Sustainability Oriented Innovations)

Abstract

:
Climate change, overpopulation and the squandering of resources currently pose problems of such magnitude that they require a change in the trend to mitigate their effects. It is essential to make society aware of the facts and to educate the population about the advantages that new technologies can provide for efficient urban development. We therefore ask whether an ordinary medium-sized city can become a Smart City. In order to assess this possibility, our study analyzes different models of Smart Cities implemented in Spain (e.g., Madrid, Barcelona, Valencia, Malaga and Santander), contrasting them with the specific case of one city that is not yet a Smart City (Granada) in order to discuss which strategic technological actions to implement in different topical areas of action: the economy, sustainability, mobility, government, population, and quality of life. The study uses Cohen’s wheel to give researchers in the field a series of indicators and factors that can be used to analyze public data with statistical methods in order to obtain clear positive scores for Madrid and Barcelona. The analysis shows Granada’s deficiencies in the scores for digital government, accessibility, the efficiency of public transport, and mobility, among others. Finally, the data obtained demonstrate the need to implement an integrated dashboard with different proposals in the strategic areas analyzed in order to achieve the transformation of conventional cities into Smart Cities.

1. Introduction

The widespread growth of urban spaces is an increasingly worrying reality. By the middle of this century, two thirds of the population are expected to inhabit large cities, with over 20 megacities of over 10 million inhabitants [1]. This change raises a question we must try to answer: are we forcing changes in the environment?
Humanity has advanced by giant steps on these issues in the past century. The transformation of rural areas into big cities, the creation of transportation networks that are intensively interconnected by high-speed technologies, the infrastructures in the urban environment, and the methods of technological research, etc., have brought changes of a magnitude that has been impossible since the Industrial Revolution [2]. However, these changes have also created serious problems for public health and the environment due to the use of fossil fuels [3]. Large amounts of greenhouse gas emissions, the squandering of natural resources, and current problems such as the coronavirus (SARS-CoV-2) are now alerting us to the need to change the trend and mitigate the effects of human action. Adopting extraordinary measures, such as the lockdown and paralysis of a large portion of economic activity, have had negative repercussions for Gross Domestic Product (GDP) and employment in much of the world, requiring urgent solutions to these problems. The magnitude of all of these changes creates uncertainty about an ambiguous future, making it necessary for firms, citizens, and institutions to seek strategic solutions to manage the threats efficiently and generate a change in behavior that will impact future generations [4].
Innovation is key to achieving sustainable cities. Sustainable development is a pressing issue that requires immediate action and change from governments, industry, and society as whole [5]. Learning is a crucial element in these entities’ pursuit of sustainable innovation, which improves their sustainability and enables sustainable performance [5,6]. Now more than ever, it is necessary to invest in innovation to make cities capable of resilience through planned and sustainable measures, such as the stimulation of digital and technological transformation [3,7,8,9,10,11]. Artificial Intelligence (AI) makes available seemingly infinite unexploited possibilities that must be transferred to society to stimulate their use in citizens’ day-to-day activities. The disruptive new technologies that are emerging are transforming society to make it more digital, implementing this new technological social thinking in numerous situations and activities that were previously unknown [5,12]. Greater digital knowledge will improve the performance of facilities and the application of future proposals and policies [13,14]. Bidding for innovation and technology is also key to facing public health emergencies and establishing strong entrepreneurial ecosystems [2,3,6,11,12,14].
Taking these needs into account, this study focuses on two theoretical approaches: (1) Dynamic Capabilities Theory, which provides a suitable conceptual framework for obtaining competitive advantages in highly dynamic environments [15] and considers the dynamic environment in the process of seeking results and sustainable business advantages [16]; and (2) Complexity Theory, which understands the organizational environment as a complex system, and requires connectivity among a set of heterogeneous agents to analyze the management of organizations [17,18,19]. This approach requires not only the identification of the internal and external factors that form part of the organizational ecosystem but also the management and generation of value from these factors through interaction with the heterogeneous agents involved in the system [19]. Both theories are ideal for the analysis of dynamic and turbulent environments, in which interrelations are global, technologies evolve constantly, and firms’ competitive advantages quickly become obsolete.
The goal of this study is to contribute to the generation of technological solutions to reduce the impact of the factors causing the current deterioration of cities, and to determine whether these solutions will be decisive for the achievement of the goals. We thus attempt to identify an integrated dashboard with different strategic dimensions using artificial intelligence (AI) and new forms of data processing that enable the transformation of a conventional city into a new notion of a much more sustainable, efficient city. This study thus aims to discover the dimensions, factors, and indicators that compose an intelligent city—or ‘Smart City’—and the repercussions and advantages of Smart Cities for citizens’ quality of life, such as more free time, security, energy efficiency, and pollution reduction [20,21]. Spain already has Smart Cities of great importance in the national landscape, such as Madrid, Barcelona, Valencia, Malaga, and Santander, which serve as our starting point. Based on these cities, we seek to provide a series of recommendations to transform other cities into Smart Cities. These measures will be analyzed through the city of Granada, because Granada is imminently poised to become a Smart City [22]. We will compare Granada’s degree of smartness to the different cities mentioned above and formulate proposals for implementation based on the deficiencies detected.
To fulfill these goals, this study is divided into several sections. First, we establish the theoretical background to determine the main research questions to be studied in this analysis. Next, we present the study methodology and the results achieved. Finally, we explain and discuss the conclusions, theoretical and practical implications, limitations and future research lines, and some final observations for consideration.

2. Theoretical Background

2.1. Theoretical Focus

2.1.1. Relationship between Innovation and AI: Dynamic Capabilities Theory

In the 21st century, AI has become an important area of research in most areas of science [23,24,25,26]. AI is developing rapidly, and disseminating follow-up research has become an arduous task [27]. Because AI can be a difficult concept, we start with a simple definition: “Artificial intelligence is the science of making intelligent machines that perform tasks as well as, or better and faster than humans can” [28].
Today’s AI is a combination of machine learning and deep learning techniques, which constitute the latest breakthrough in AI [29,30]. Organizations’ learning capabilities are central to their ability to take advantage of AI [17]. Technological capability is also crucial, due to the technological component of AI. Further, since AI can promote innovation in organizations [31], innovation capability is also important. Given the environmental dynamism and this study’s focus on these capabilities, we must define the concept of dynamic capability. The term was coined by Teece et al. [15] (p. 510) as “the firm’s ability to integrate, build, and reconfigure internal and external competences to address rapidly changing environments”, and gave rise to Dynamic Capabilities Theory.
We chose this theory because our study works with AI to promote learning capability, innovation capability, and technology capability, which are evolving in a dynamic, changing environment. We seek to evaluate the extent of the changes that could occur in a city’s spending on new development activities, the number of new processes introduced, the emphasis on developing technologies and/or technological innovation, and the city’s government’s emphasis on R&D, technological leadership, and innovations [32,33]. We therefore analyze AI as an innovative form of entrepreneurship based on the firm’s technology.
Ultimately, the organizational capabilities analyzed in this study are dynamic capabilities which give a competitive advantage because the cities are also changing. AI motivates these capabilities fundamentally in learning in the fields of innovation and technology [15,16,31].

2.1.2. Relationship between Connectivity and AI: Complexity Theory

We need only examine AI’s uses globally to understand how important it is for society and for businesses [34]:
  • Facebook recently disclosed plans to invest in AI at the annual F8 conference.
  • Baidu is investing heavily in artificial intelligence: “The era of mobile Internet is over.” In fact, 5G, which focuses on AI, is becoming a disruptive innovation of the Internet.
  • JPMorgan is using AI to achieve high financial automation and increase employee productivity.
  • Deloitte’s 2020 CEO Shelby Austin confirmed that the organization was thrilled to collaborate with the World Economic Forum and the government of the UK in the development of procurement guidelines that help the public sector put AI at the service of its constituents in a manner that is both efficient and ethical.
Furthermore, the largest companies around the world are using AI to improve their connections and undertake significant actions to enhance their performance. These actions include media buying, runbook automation, reducing production management work through automation, resolving users’ technology problems, detecting and deterring security intrusions, tailoring promotions (online or offline), monitoring social media comments to determine overall brand affinity and issues, anticipating future customer purchases and presenting offers accordingly, and gauging internal compliance by using approved technology vendors [35].
From a complexity perspective, AI and innovation are significantly related to Complexity Theory. Because they enable a firm’s innovativeness through dynamic network structures [19], the new innovative knowledge (AI) acquired by connections [36] creates interactions that can determine the development of organizations and enable innovativeness [19]. Moreover, the greater the connectivity of society and organizations, the more information exists, and the more complex entrepreneurial systems are. Connections thus create new or more complex entrepreneurial ecosystems through their different ways of obtaining information. Complexity theory is a productive perspective from which to examine these heterogeneous agents that promote connectivities. Its application can help to make society aware of the importance of AI in a city and help the city to achieve its goal of becoming a Smart City.

2.1.3. The Importance of Sustainability as a Resulting Performance

AI applications can predict time-to-performance milestones based on progress data and provide customized products, processes, or services for web searches and social media users. The University of Queensland developed a deep learning system called Blackboard [37], a neural networks analysis of players’ decision-making processes based on their previous behavior, to help players make the best decisions to accomplish their goals.
This feature of AI would have a positive influence on city governments. For example, it would analyze drivers’ current situations in cities and make predictions about what will happen next, in order to avoid traffic accidents or traffic jams, and administer polls, etc. This feature could also be used in teaching, to analyze citizens’ behavior in order to identify which of their habits pollute, and then correct them, or even to discover what problems citizens face and develop better plans to help them. AI thus encourages sustainability as a much-needed change in cities.

2.2. Current Problems: Overpopulation, Pollution, New Illnesses, and the Squandering of Resources

This section presents four major problems at the global level in today’s large cities, based on the various sources available [38,39,40]. It then proposes strategic action to undertake in response.

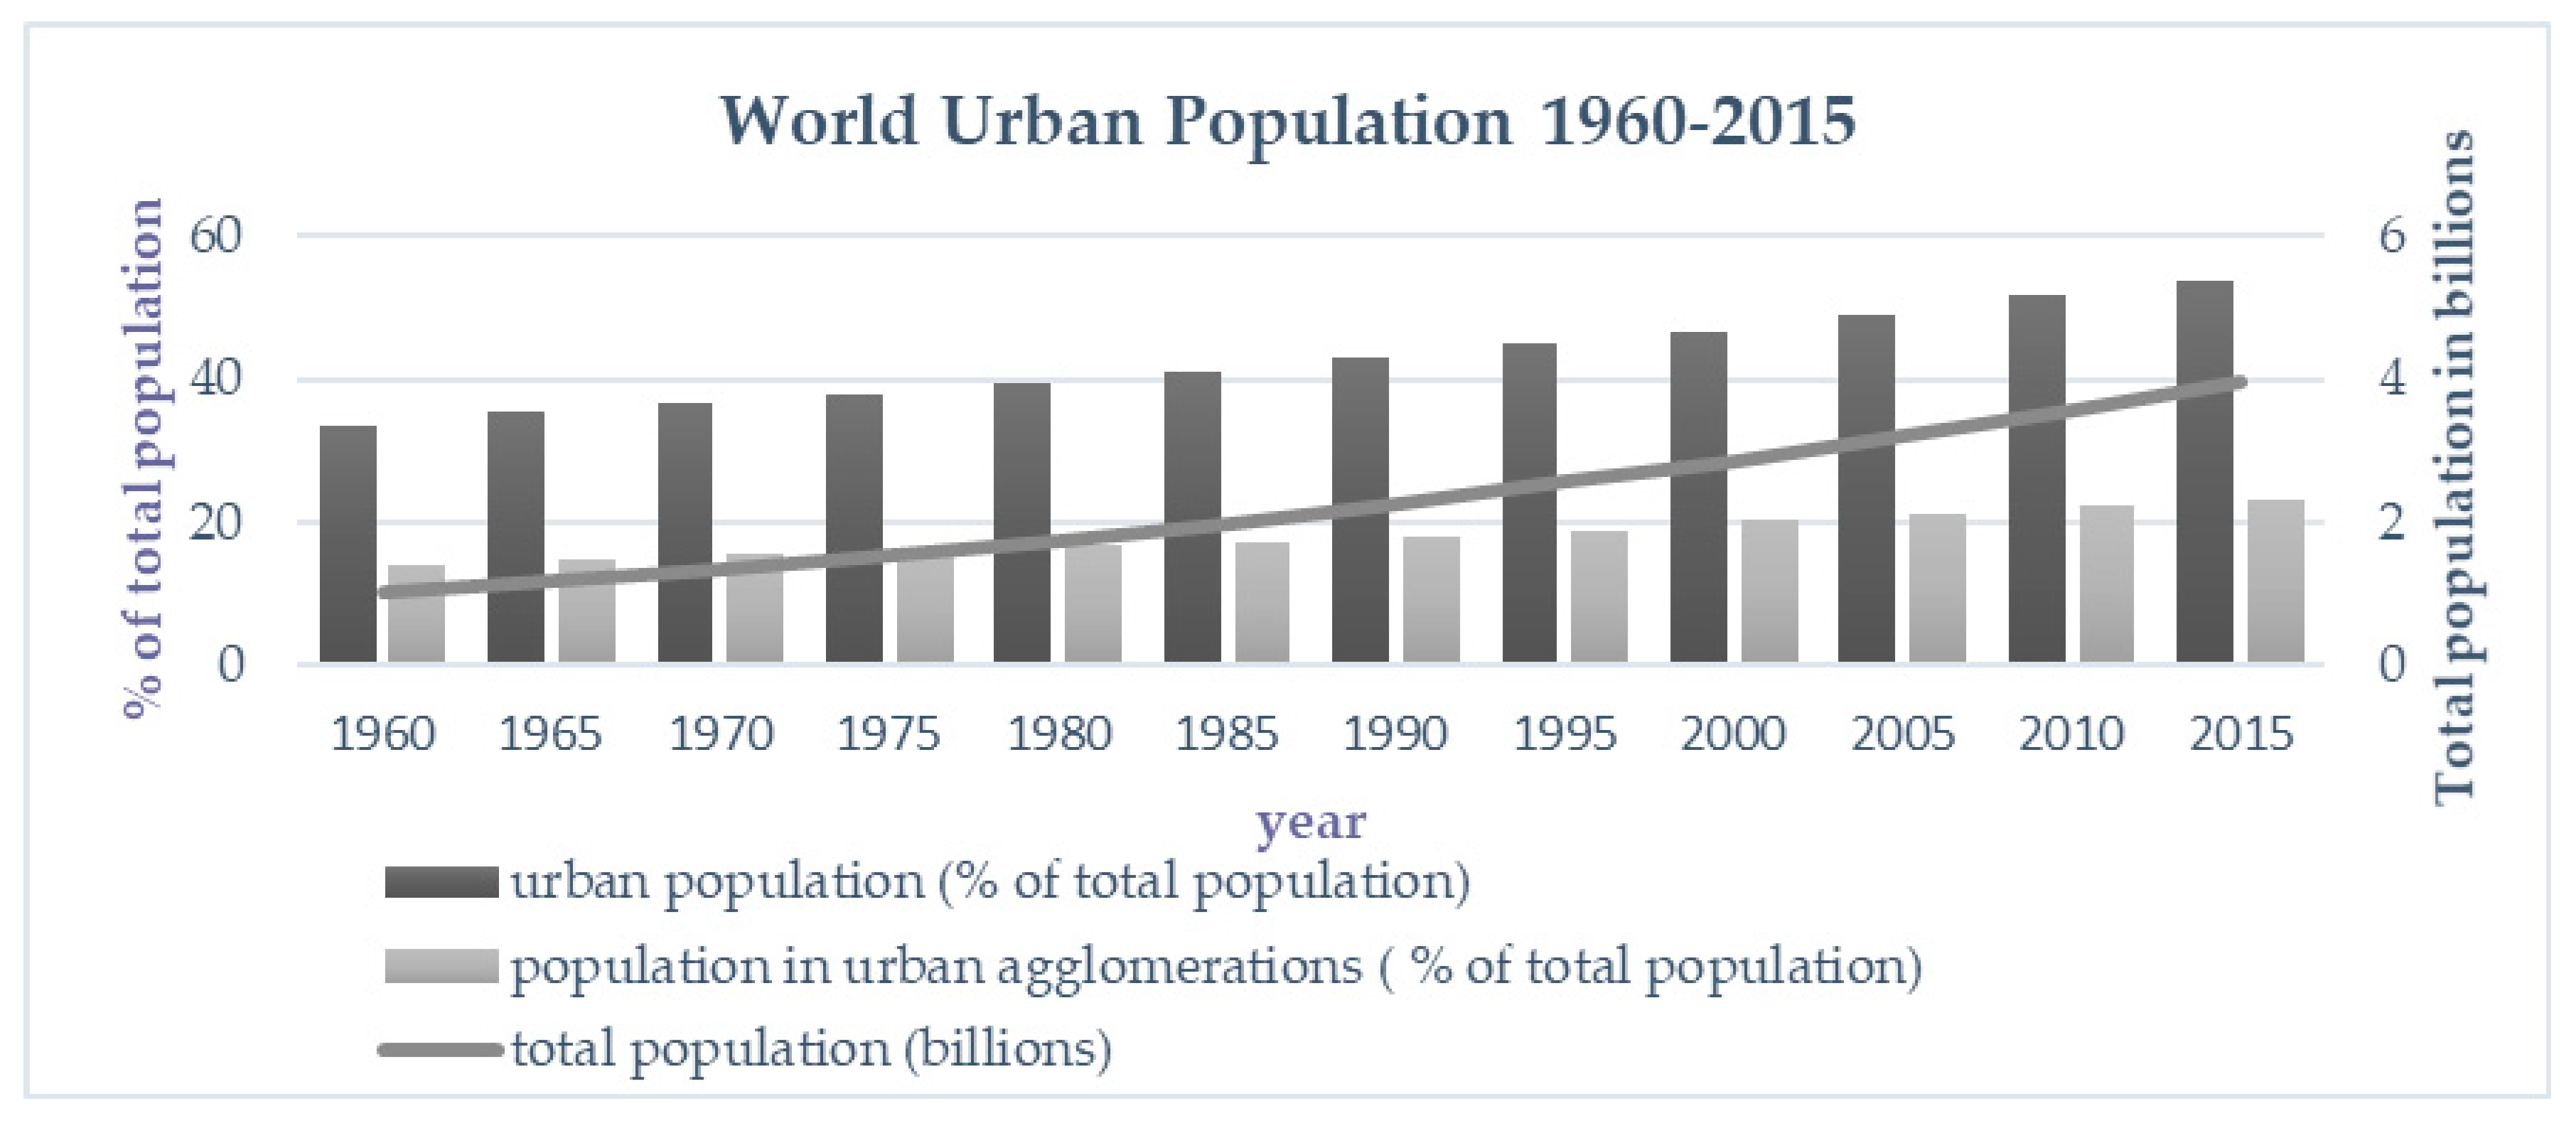
2.2.1. Overpopulation: Pressure Generated by Migration from Rural Areas to Urban Centers

This study is motivated by the alarming data from various official sources. According to the current data from the United Nations (UN), the population growth of urban agglomerations has increased at a dizzying rate. The world’s population is expected to increase by over 2000 million in the next 30 years, reaching 11,000 million by 2100 at its most critical point. Changes in the population size and distribution (an increase in the population living in urban agglomerations) have negative consequences for the environment and the Sustainable Development Goals (SDGs) agreed upon to reduce environmental impact and improve social wellbeing. Recent studies of the increase in the population rate in the nine cities with the highest exponential growth in population density worldwide show that India will replace China as the most populous country in the world by 2027 [41].
The United Nations Educational, Scientific and Cultural Organization (UNESCO) [42] estimates that, by 2030, over 60% of the world’s population will inhabit urban centers. According to the UN [1], by 2050, there will be over 41 megacities (of over 10 million inhabitants). The trend toward urban population is increasing in the global population (Figure 1), and a higher percentage of the urban population inhabits urban agglomerations (currently, nearly 50%).
In Spain, around 60% of the population already lives in urban agglomerations. Since 1950, the population has grown around 53% in towns, while the metropolitan population has grown around 136%. Such growth produces a sharp regional contrast and makes it difficult to maintain sustainable evolution [43].
Further, most developed countries have inverted population pyramids due to a high life expectancy at birth and an aging population, while the poorest countries have high fertility rates. Efforts to improve quality of life are higher in developed countries, since they tend to reduce inequalities and combat hunger and malnutrition. In contrast to Africa and other developing regions, developed countries have low birth-rates and increased emigration. Migration therefore becomes a trigger of overpopulation in many metropolises worldwide. The exponential increase in migratory movement impacts the environment, producing another major problem of 21st-century large cities: excessive pollution.

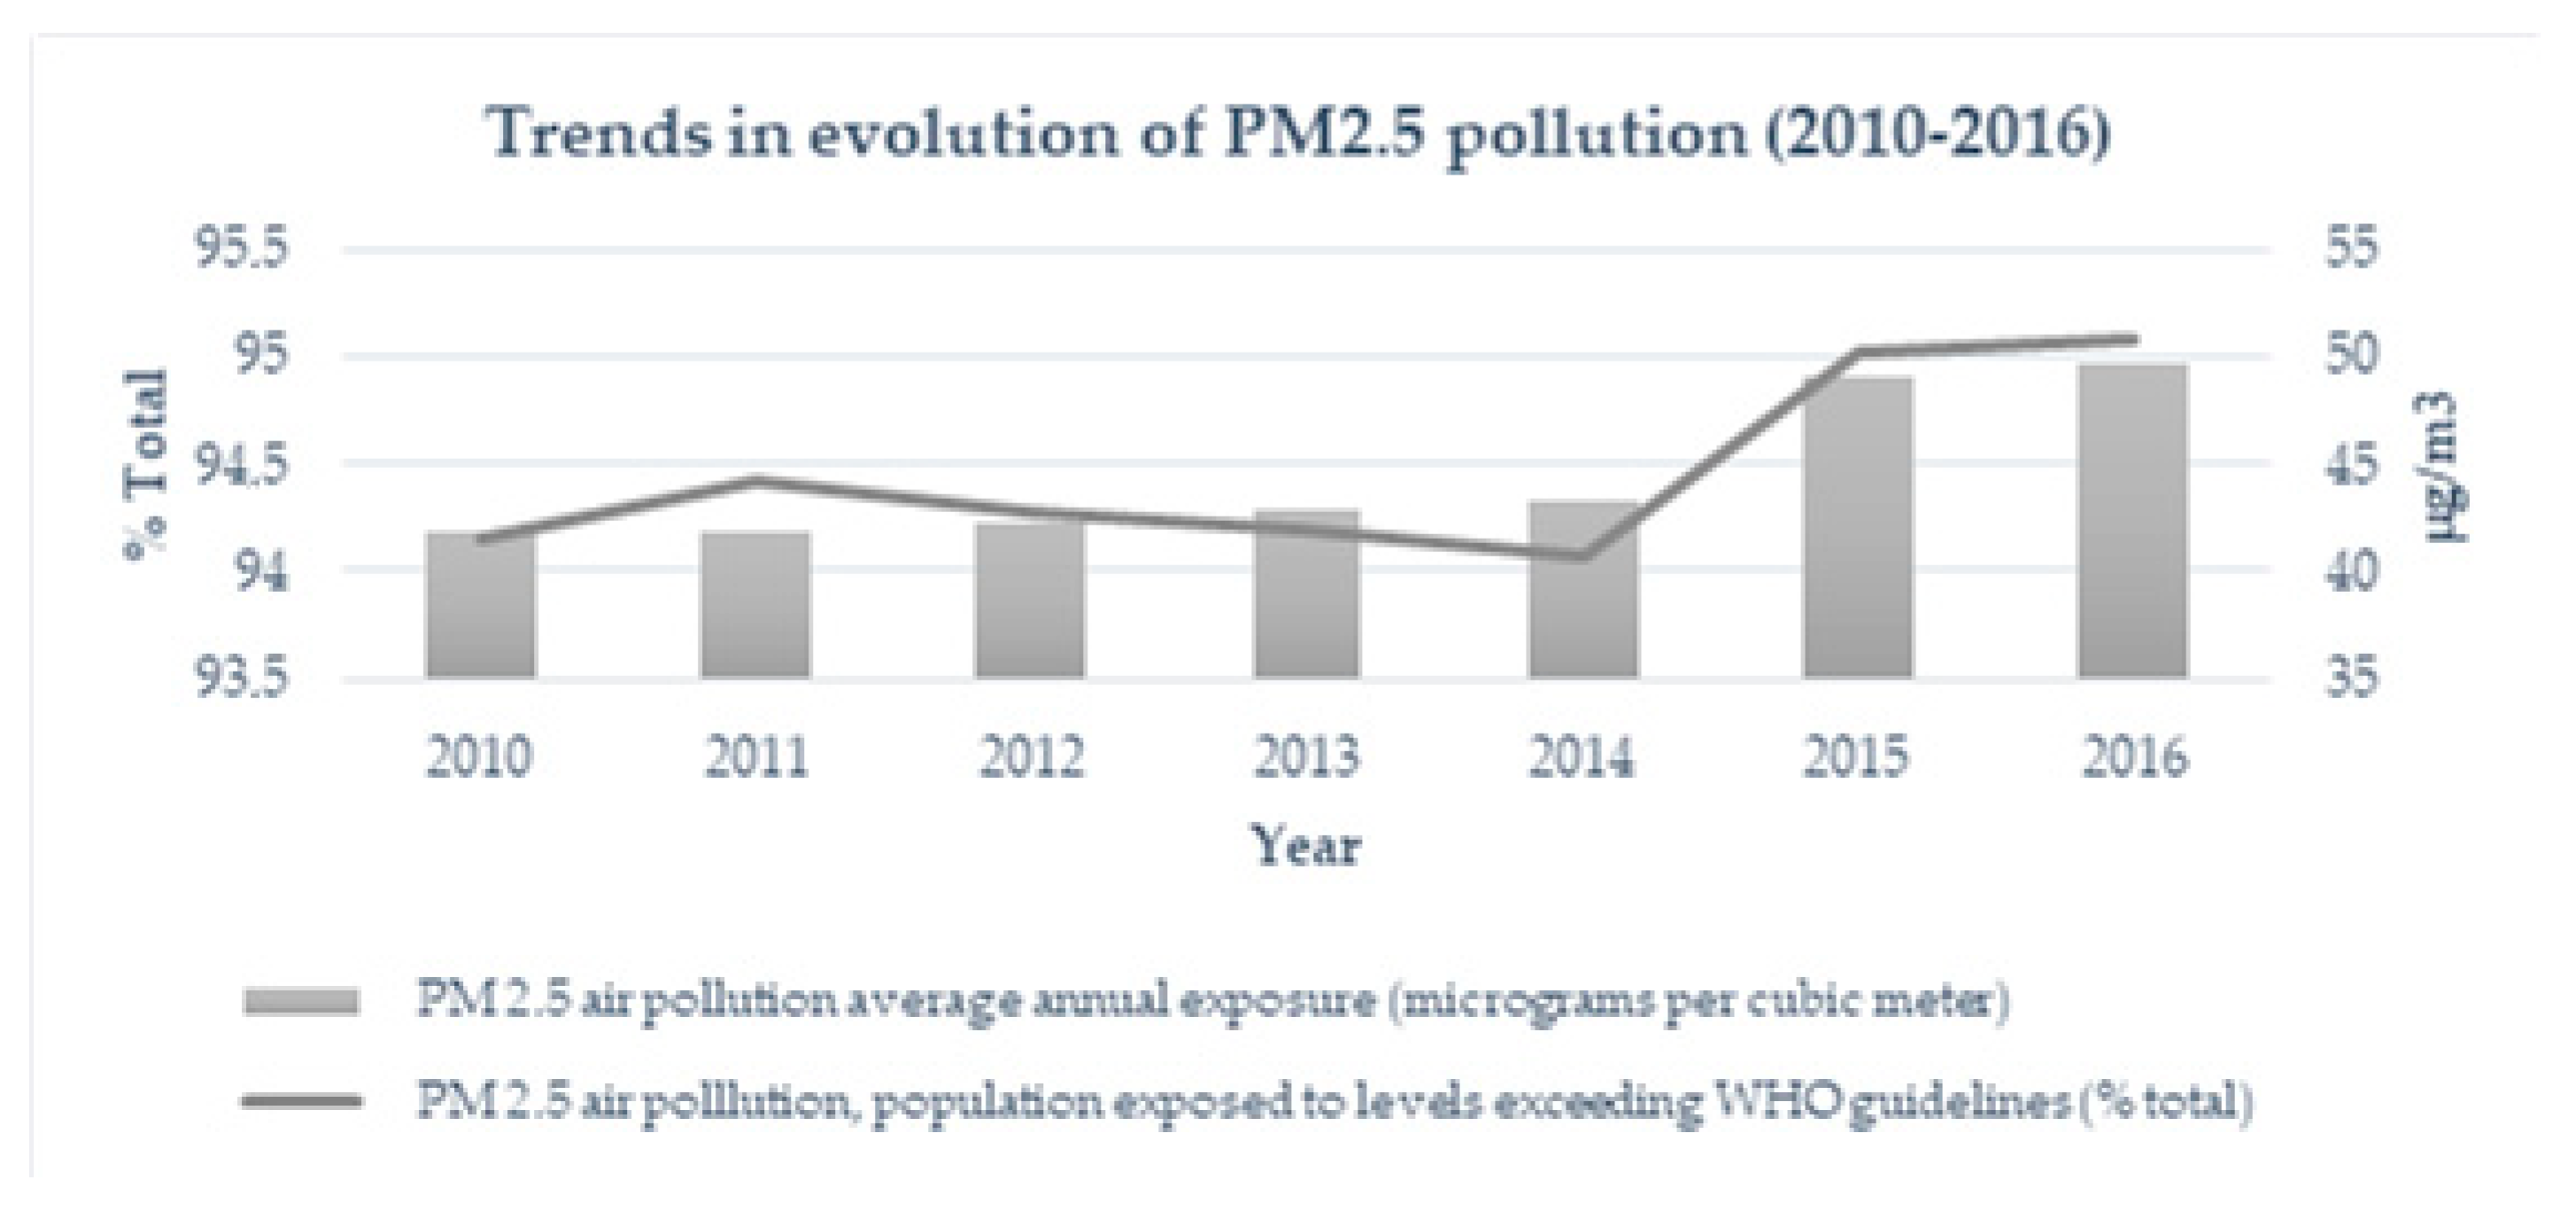
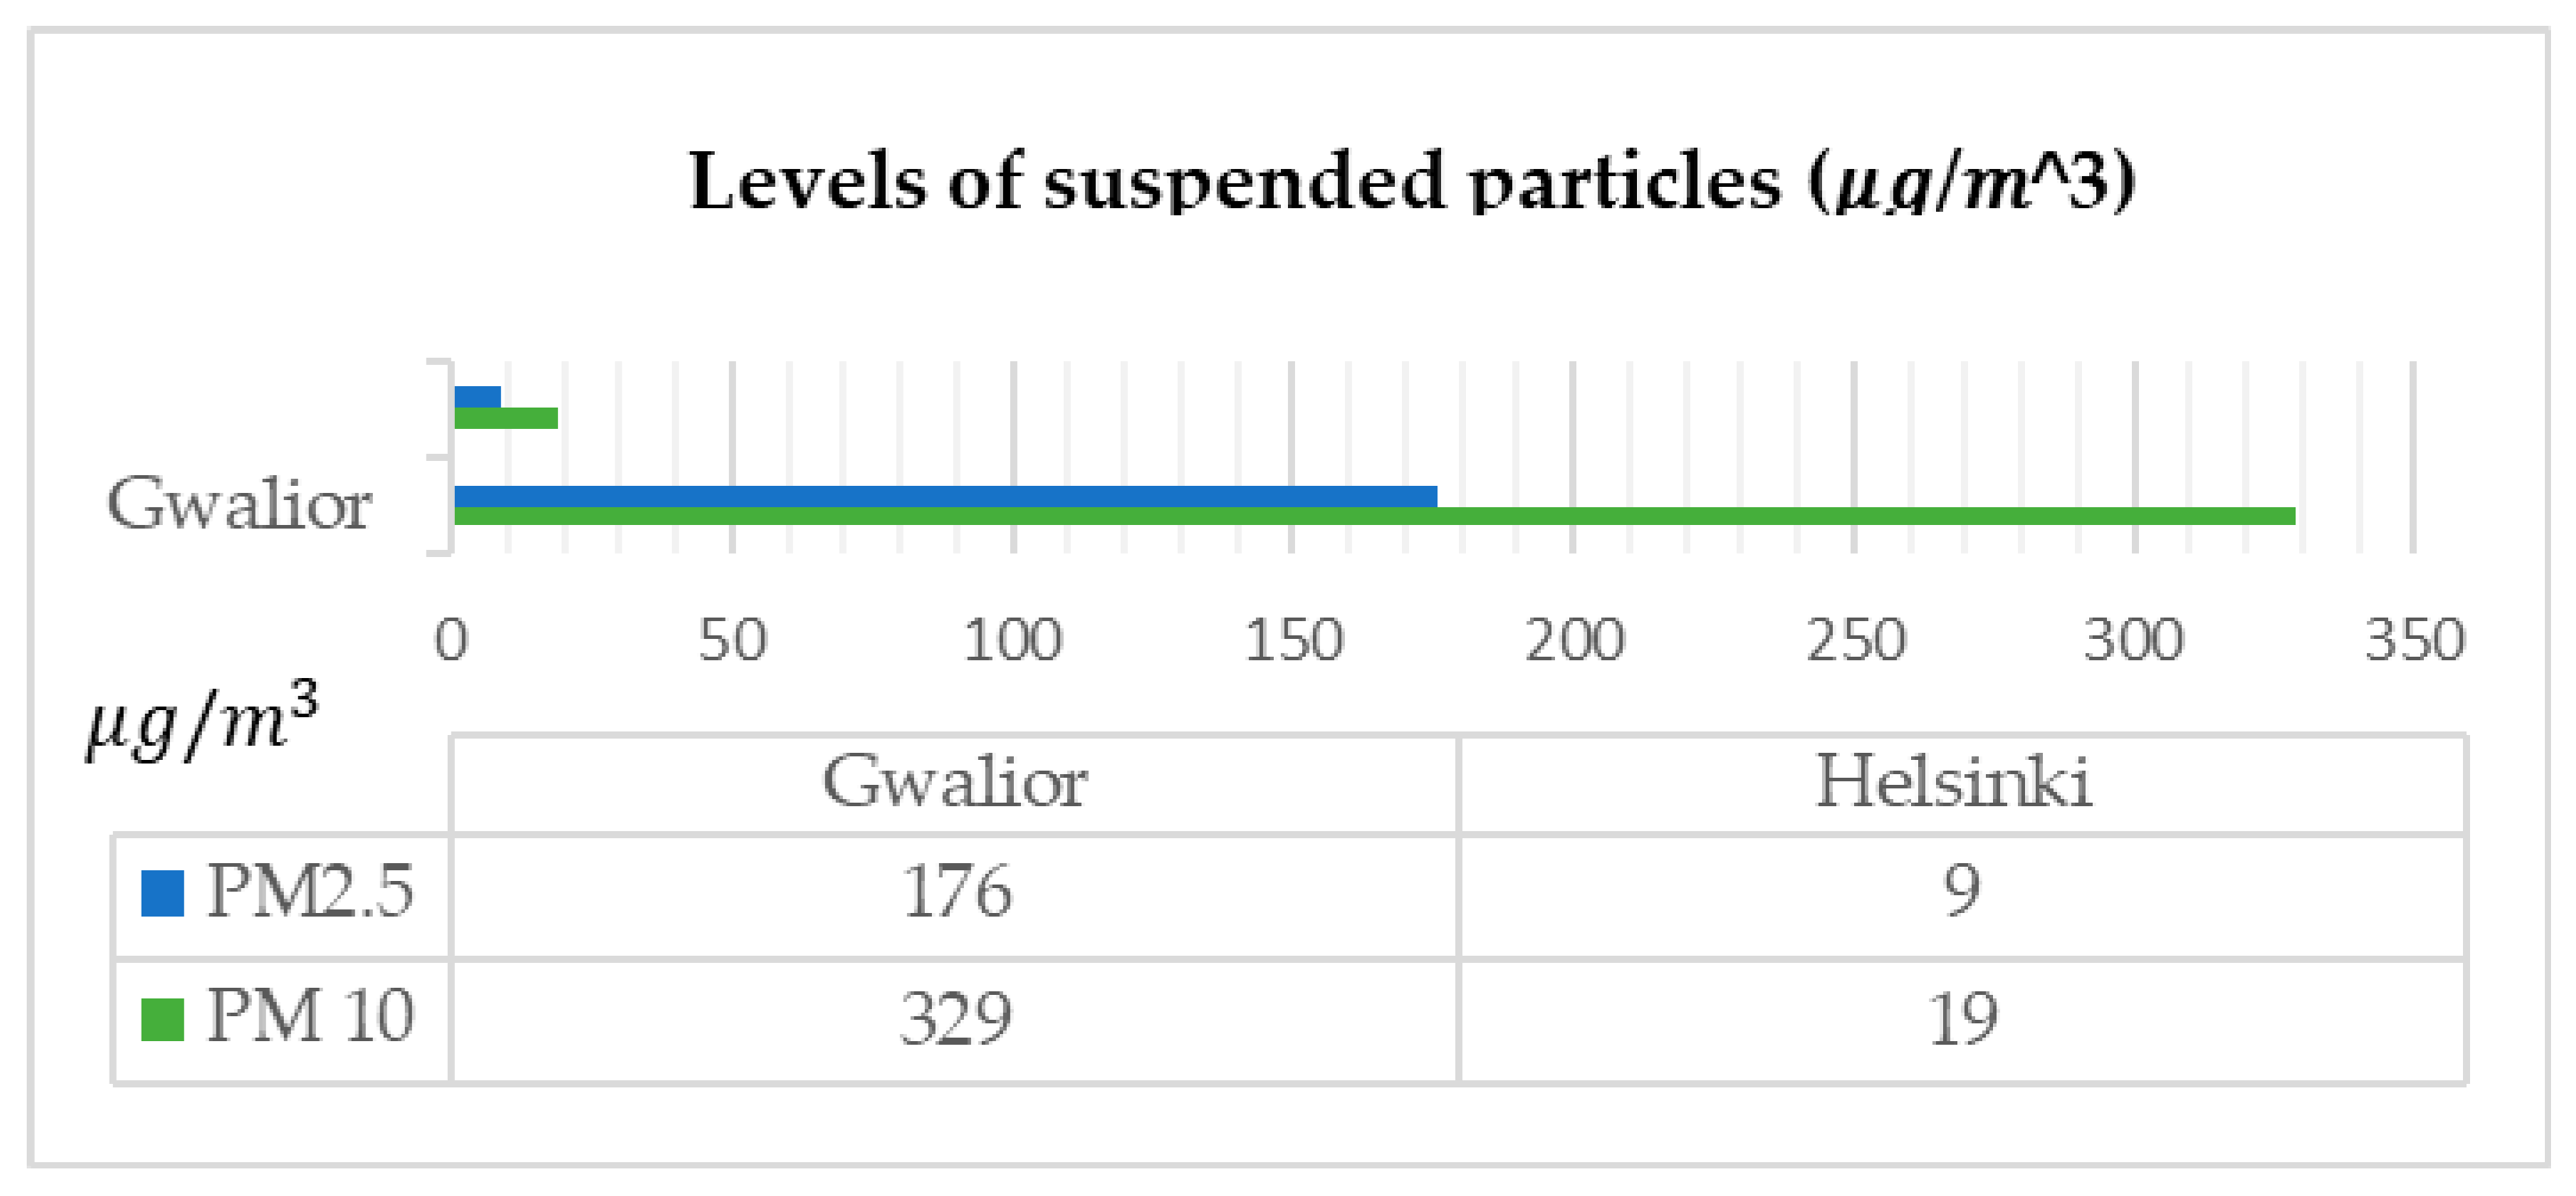
2.2.2. Pollution: the Widespread Growth of Metropolises, which Generate Over 80% of Global Pollution

Today, human beings are truly interested in health issues and the implications of the environment for their health. Environmental health emerged as a problem during the last century due to exponential industrial development. Various published studies show the repercussions of this growth: one out of every four illnesses is cause by pollution [8].
Headlines like these alarm society. Despite the skepticism of many, this news promotes a dizzying change in the trend through the search for solutions.
The level of particulate matter air pollution (PM 2.5) is growing significantly worldwide [39]. Figure 2 shows the increase in the average annual exposure to air pollution levels of PM 2.5 in micrograms per m3, and in total percentage of the population exposed to levels above the limits established by the World Health Organization (WHO) [40]. Of the years for which data are available, we see that 2016 shows the highest recorded pollution relative to the total percentage of the population exposed.
The current urban phenomenon began with the Industrial Revolution and has been developing in different urban models, with changes in social patterns and new lifestyles due to innovation and the advent of information technologies (IT).
As Figure 3 shows, the comparison of a city like Gwalior (India) (one of the most polluted cities in the world) to the reference data established by the WHO shows that Gwalior far exceeds the limit values established. The world’s cleanest cities, such as Helsinki (Finland), in contrast, have values below the WHO’s limits [9].
These data attest to the urgent need for action in the most polluted cities. This level of atmospheric pollution intensifies climate change through environmental disasters such as acid rain and the deterioration of the ozone layer.

2.2.3. The Emergence of New Illnesses

Although there is still no consensus on the emergence of SARS-CoV-2 (the COVID-19 virus), it is widely believed that pollution and overpopulation have forced animals to live closer to urban cities, increasing the probability of outbreaks of new diseases, such as COVID-19. Unless we start using our resources consciously and efficiently so as not to waste them, more new diseases will emerge worldwide, creating new problems for our society. Given this problem of pollution and the ongoing COVID-19 pandemic, a significant focus of research is health and the influence of the environment on health. Environmental health is one of the topics that has awakened the most interest in recent years, following the exponential industrial development of this past century. One of every four illnesses is linked to pollution factors [44]. Based on this information, we must seek solutions to promote a dizzyingly fast change in this trend. The WHO established the maximum levels for the main pollution sources permitted for human beings (Table 1).
The pollution values currently that are currently being produced are much higher than the averages permitted. In the case of SO2, they can even reach a value 25 times higher in 10 min worldwide. If we continue at such extremely high levels, more illnesses could emerge, and current illnesses could worsen. Cities like Helsinki (Finland) are obtaining values far below the average accepted by the WHO, and are thus becoming international models. However, the global data show the urgent need to act in all of the most polluting cities worldwide, since atmospheric pollution is influencing climate change, natural catastrophes (e.g., acid rain), and deterioration of the ozone layer.

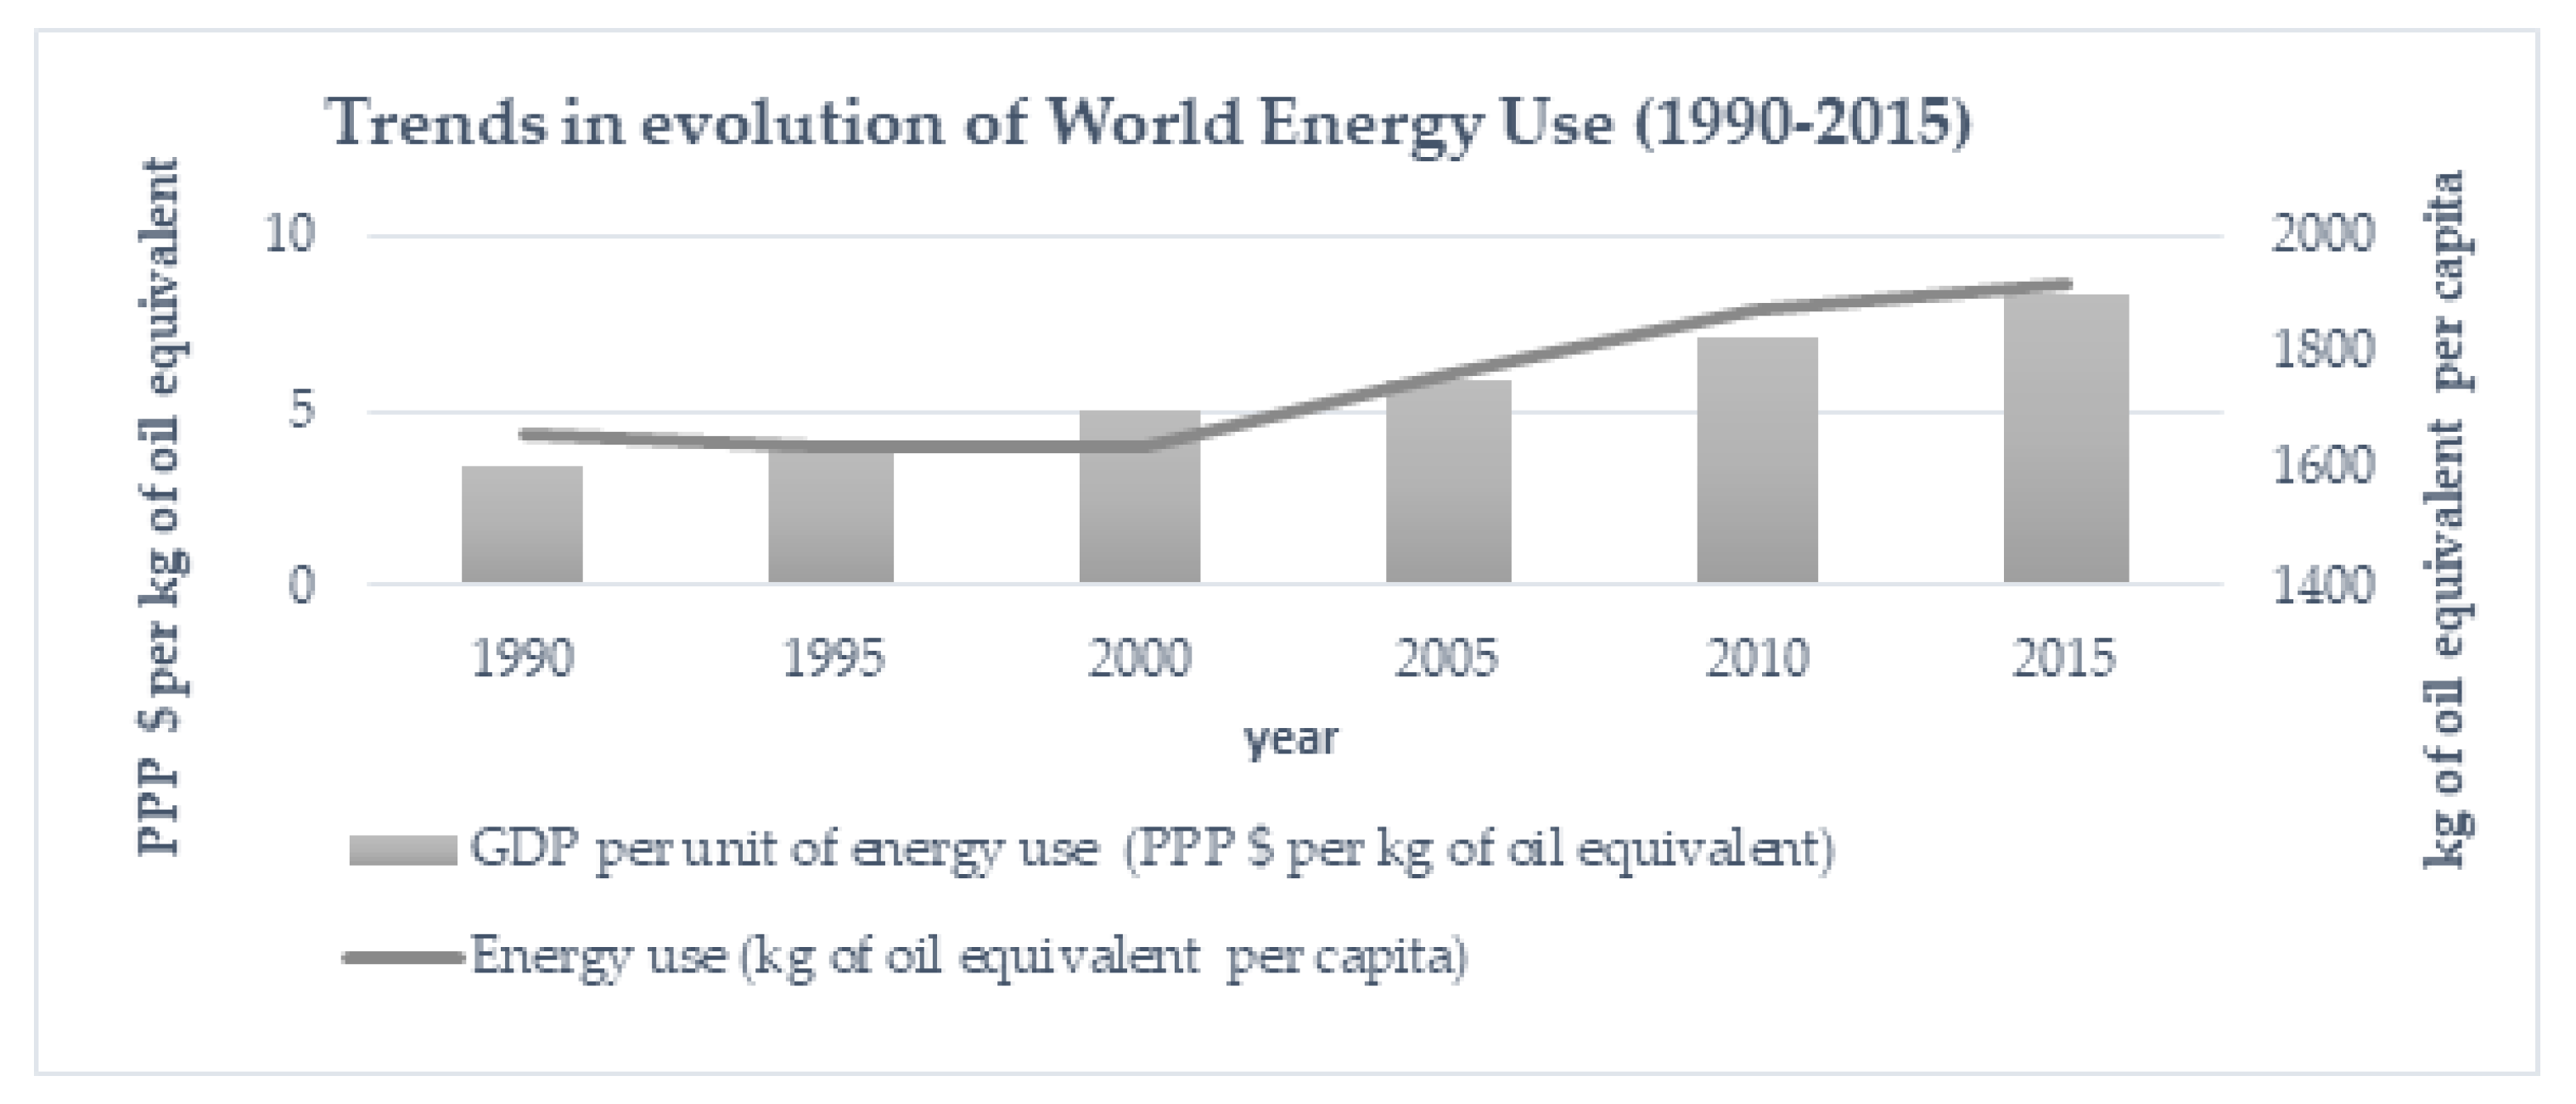
2.2.4. Squandering of Resources: Greater Expenditure on Energy Consumption (Almost 80% of World Consumption)

The use of oil (kg per capita) continues to increase (Figure 4), even though the world’s oil reserves have decreased dramatically [39,45,46]. If we observe the worldwide trend in GDP per unit of energy used from oil, we can confirm that oil forms part of the exponential growth in world energy consumption. Limitations on physical space involve changes in cities’ sizes. Just as we limit the size of a metropolis, we must limit the exploitation of the amounts of energy and infrastructure resources that change the environment irreversibly.

2.3. Proposed Solution

To solve these problems, this study analyzes the minimum factors needed to transform a conventional city into a Smart City. This approach is becoming compulsory for cities, since “the city is destined to grow indefinitely, and how to handle the problem of limiting its growth has not really been posed. Understanding growth as a natural, not a debatable, phenomenon is naturally complementary to limiting the field of inquiry on the city” [47] (p. 19). Since it is estimated that, by 2050, 70% of humanity will live in cities [47], today’s cities must correct certain patterns of action, making improvement on four strategic issues their main focus [21]:
-
Economic competitiveness: attracting and achieving financing for new firms, conserving existing ones, and achieving improvement in economic development [48];
-
Quality of life: improving health and security, new implications for healthcare, and changes in the way information is processed [44];
-
Sustainability: energy efficiency, social change, greater economic prospects, and changes in resource and risk management [49];
-
Mobility: efficiency in the means of transportation, traffic, and pollution, etc. [50].
This study stresses that a successful Smart City must contribute optimally to the improvement of economic competitiveness, quality of life, mobility, and sustainability by its government or public administration (a fifth strategic issue to consider), with greater regulation of hiring and the establishment of e-administration to make bureaucratic procedures quicker and easier. Smart Cities must also monitor sustainability and the environment (control of waste, energy efficiency, environmental management, etc.) [51]. Their services must contribute to the improvement of transportation, tourism, health, education, and culture, and they must draw on the advancements in data processing and the interconnection of networks to create an information and communication technology (ICT) network [52] dedicated to improving privacy and security. It is crucial to know how to manage data use to benefit society, and to evaluate transparency and privacy, while avoiding the fraudulent use of data. Cities must also measure the precision of the algorithms they use in setting up government policies: correcting for population bias, for example, or for policies that discriminate by geographic area [53]. Specifications should focus on the positive interventions of more inclusive policies.
AI, applied to the city, would considerably improve the issues of sustainability and efficiency involving problems of pollution and energy consumption [54]. The initial conception of AI for the planning of urban environments involves optimal resource planning, lowering costs using fewer of these resources (land, roadways, etc.), and optimizing the structure of all spaces and infrastructures. Cities such as London, Tokyo, and New York pioneered in bidding for strategic innovation projects to achieve processes of economic, social, and environmental cohesion [55,56,57]. Other cities, such as Hamburg and Bergen [58,59], have developed projects to remedy the deficiencies detected: projects which are currently global models of urban efficiency. In the case of Spain, a study by the University of Navarre [59] showed the world ranking of various Spanish cities (Figure 5.) E.g. Madrid is 25th in a ranking headed at the international level by New York).
These classifications are based on different dimensions (Figure 6) of strategic actions to improve cities and establish model cities and policies that other cities can follow in order to transform themselves.
Based on these dimensions, we formed the notion of a new city, termed a Smart City. Smart Cities are the result of disruptive innovations with technological transformations (e.g., the implementation of 5G) of mobility, the economy, sustainability, and the public administration or government itself to implement efficient urban development. The goal of Smart Cities is to provide optimal and efficient support for society’s strategic activities through public–private collaboration mechanisms to set up such activities. A city is ‘smart’ if it has at least one initiative in the different areas of action [51]. Based on the foregoing, we formulated the following research questions (RQ):
RQ.1:Does the development of strategic technological governance measures drive the transformation into a Smart City?
RQ.2:Does the development of strategic technological mobility measures drive the transformation into a Smart City?
RQ.3:Does the development of strategic technological environmental measures drive the transformation into a Smart City?
RQ.4:Does the development of strategic technological economic measures drive the transformation into a Smart City?
RQ.5:Does the development of strategic technological quality of life measures drive the transformation into a Smart City?

3. Methodology and Methods

3.1. Sample

To contrast each of the research questions in this study, we analyzed the different factors that determine the position of an average European city, taking the case of Granada—a city in the south of Spain—as a reference and target city for transformation into a Smart City. There is no optimal size at which a city can be transformed into a Smart City, since size depends on many conditions, including culture, diversity, social interaction, regional location, and country, etc. [30]. The country for analysis is Spain, one of Europe’s largest economies. Furthermore, we chose a relatively homogeneous geographical, political, legal, and cultural space in order to minimize the impact of the variables that cannot be controlled in the empirical research [61]. Figure 7 represents the research methodology which was followed.

3.2. Measures

We analyzed various Spanish Smart cities (Madrid, Barcelona, Valencia, Malaga, and Santander), taking different international model Smart Cities (e.g., Tokyo, New York, London, Hamburg, Boston, Bergen, Toronto, and Singapore, etc.) as our starting point, in order to design the integrated dashboard and subsequently apply it to the average Spanish city chosen as our focus (Granada). Due to the complexity of the data collection, we limited the study’s scope to 42 primary indicators (see Table 2) obtained from different sources [62,63,64,65,66,67,68,69,70,71,72,73,74,75,76,77,78,79].
These indicators were classified based on the different dimensions (Table 3) or areas of a city’s overall action (governance, mobility, the environment, the economy, and quality of life) obtained by analyzing the indicators. The resulting dimensions aligned with the literature review previously performed (see Figure 5).
These dimensions can then be divided into different factors for strategic action (Table 4).
We used a star schema for the data analysis (Figure 8), analyzing the different indicators (DIM_INDICATOR), dimensions (DIM_GLOBAL), factors (DIM_FACTORS), and cities (DIM_CITY) in the study (Madrid, Barcelona, Valencia, Malaga, Santander, Granada). We used a Business Intelligence tool to develop the dashboard.
Based on the review of the cities which have previously been considered Smart Cities, the literature review, and the table of facts mentioned above, we proposed the development of an integrated dashboard to drive the transformation of these cities. This integrated dashboard was created through detailed studies of different Smart Cities throughout the world, using some of their main initiatives for the production of secure ecosystems. Specifically, we took the models of different cities, such as Hamburg, with its Smart Mobility or Smartroad with the Kattwykbrucke (bridge); Boston, with its Smart Governance BOS (City of Boston) 311 incident reporting system; Bergen (and London), with the Smart Green Environment and I20 water project; London, with its application DataStore to network for a Smart Economy; Toronto, with its Toronto Civic 101 project for Smart People; and Singapore, with its Smart Living system to monitor patients’ health in detail through Smart Health TeleRehab, a model which many countries have followed as a guide in the current pandemic. To these Smart Cities, our analysis adds the four main Spanish cities in the Smart City ranking (Madrid, Barcelona, Valencia, and Malaga) and another model Smart City in the Spanish Network of Smart Cities (Santander) as the basis for contrast. The resulting integrated dashboard (Table 5)—which encompasses dimensions, factors, and indicators—will be applied to evaluate each of these cities.
The table identifies the indicators, factors, and dimensions that any city needs to improve as the basis for designing our plan to implement the proposals of things that must be changed in order to make a city a Smart City. Numerous cities have insufficient ratios that they must develop strategically in order to become Smart Cities. These indicators are a starting point for the implementation of a strategic plan based on the deficiencies detected. We used a Likert scale from 1 to 6 for each indicator on the integrated dashboard; values of 1 and 2 indicate insufficient implementation, 3 and 4 indicate good implementation, and 5 and 6 indicate excellent implementation. The goal is to obtain scores for the results to show the deficient measures detected in each city that must be improved in order to achieve its transformation into a Smart City.

4. Results and Discussion

4.1. Data Analysis

To evaluate the degree to which a city fulfills the requirements to be a Smart City, we used a data dashboard as an information management tool in order to visually track, analyze, and display the key performance indicators, metrics, and data points. The dashboard was used to meet the specific needs or measurements to achieve a goal. This procedure enabled us to contrast visually the different cities analyzed. Within the International Standards Organization (ISO), ISO 37120 defines the 46 basic performance indicators that can and should be measured. We obtained information on 42 of these (Table 5). By fulfilling these indicators in overall terms, cities are considered to be Smart Cities according to the different existing classifications. We also evaluated each item on the integrated dashboard on a scale from 1 to 6 (two items were eliminated due to unavailability of relevant information on some cities analyzed— citizen–government channels and public services for people with limited mobility—ultimately leaving 40 items). The data are obtained from different public sources available to citizens, such as the various cities’ City Councils, open data published by the Spanish government, the official webpages of regional governments, local newspapers, and the Andalusian Multiterritorial Information System (SIMA) [48,49,50,51,52,53,54,55,56,57,58,59,60,61,62]. If the city is successful in each field (for example, obtains a 6 in all fields), it can obtain a maximum of 240 points. The evaluation is quite comprehensive, as it unifies criteria in order to define the strengths and weaknesses of each city. As the visual scorecard shows, the classification positions Madrid first, followed by Barcelona, Valencia, and Malaga. Santander is the lowest-classified in the Granada study, with a total of 24 points (for level 6), in contrast to Madrid’s 108. We thus obtained a total score for each city that includes all 40 of the indicators studied (240 maximum points). This score enables us to evaluate each city (Figure 9).
We were then able to establish comparative evaluations for the 40 measures for each city (Figure 10). Madrid ranked highest, followed by Barcelona, Valencia, Malaga, and Santander. Granada received the lowest score.
The following are some of the initiatives that these cities have implemented in order to become models that are considered to be Spanish examples:
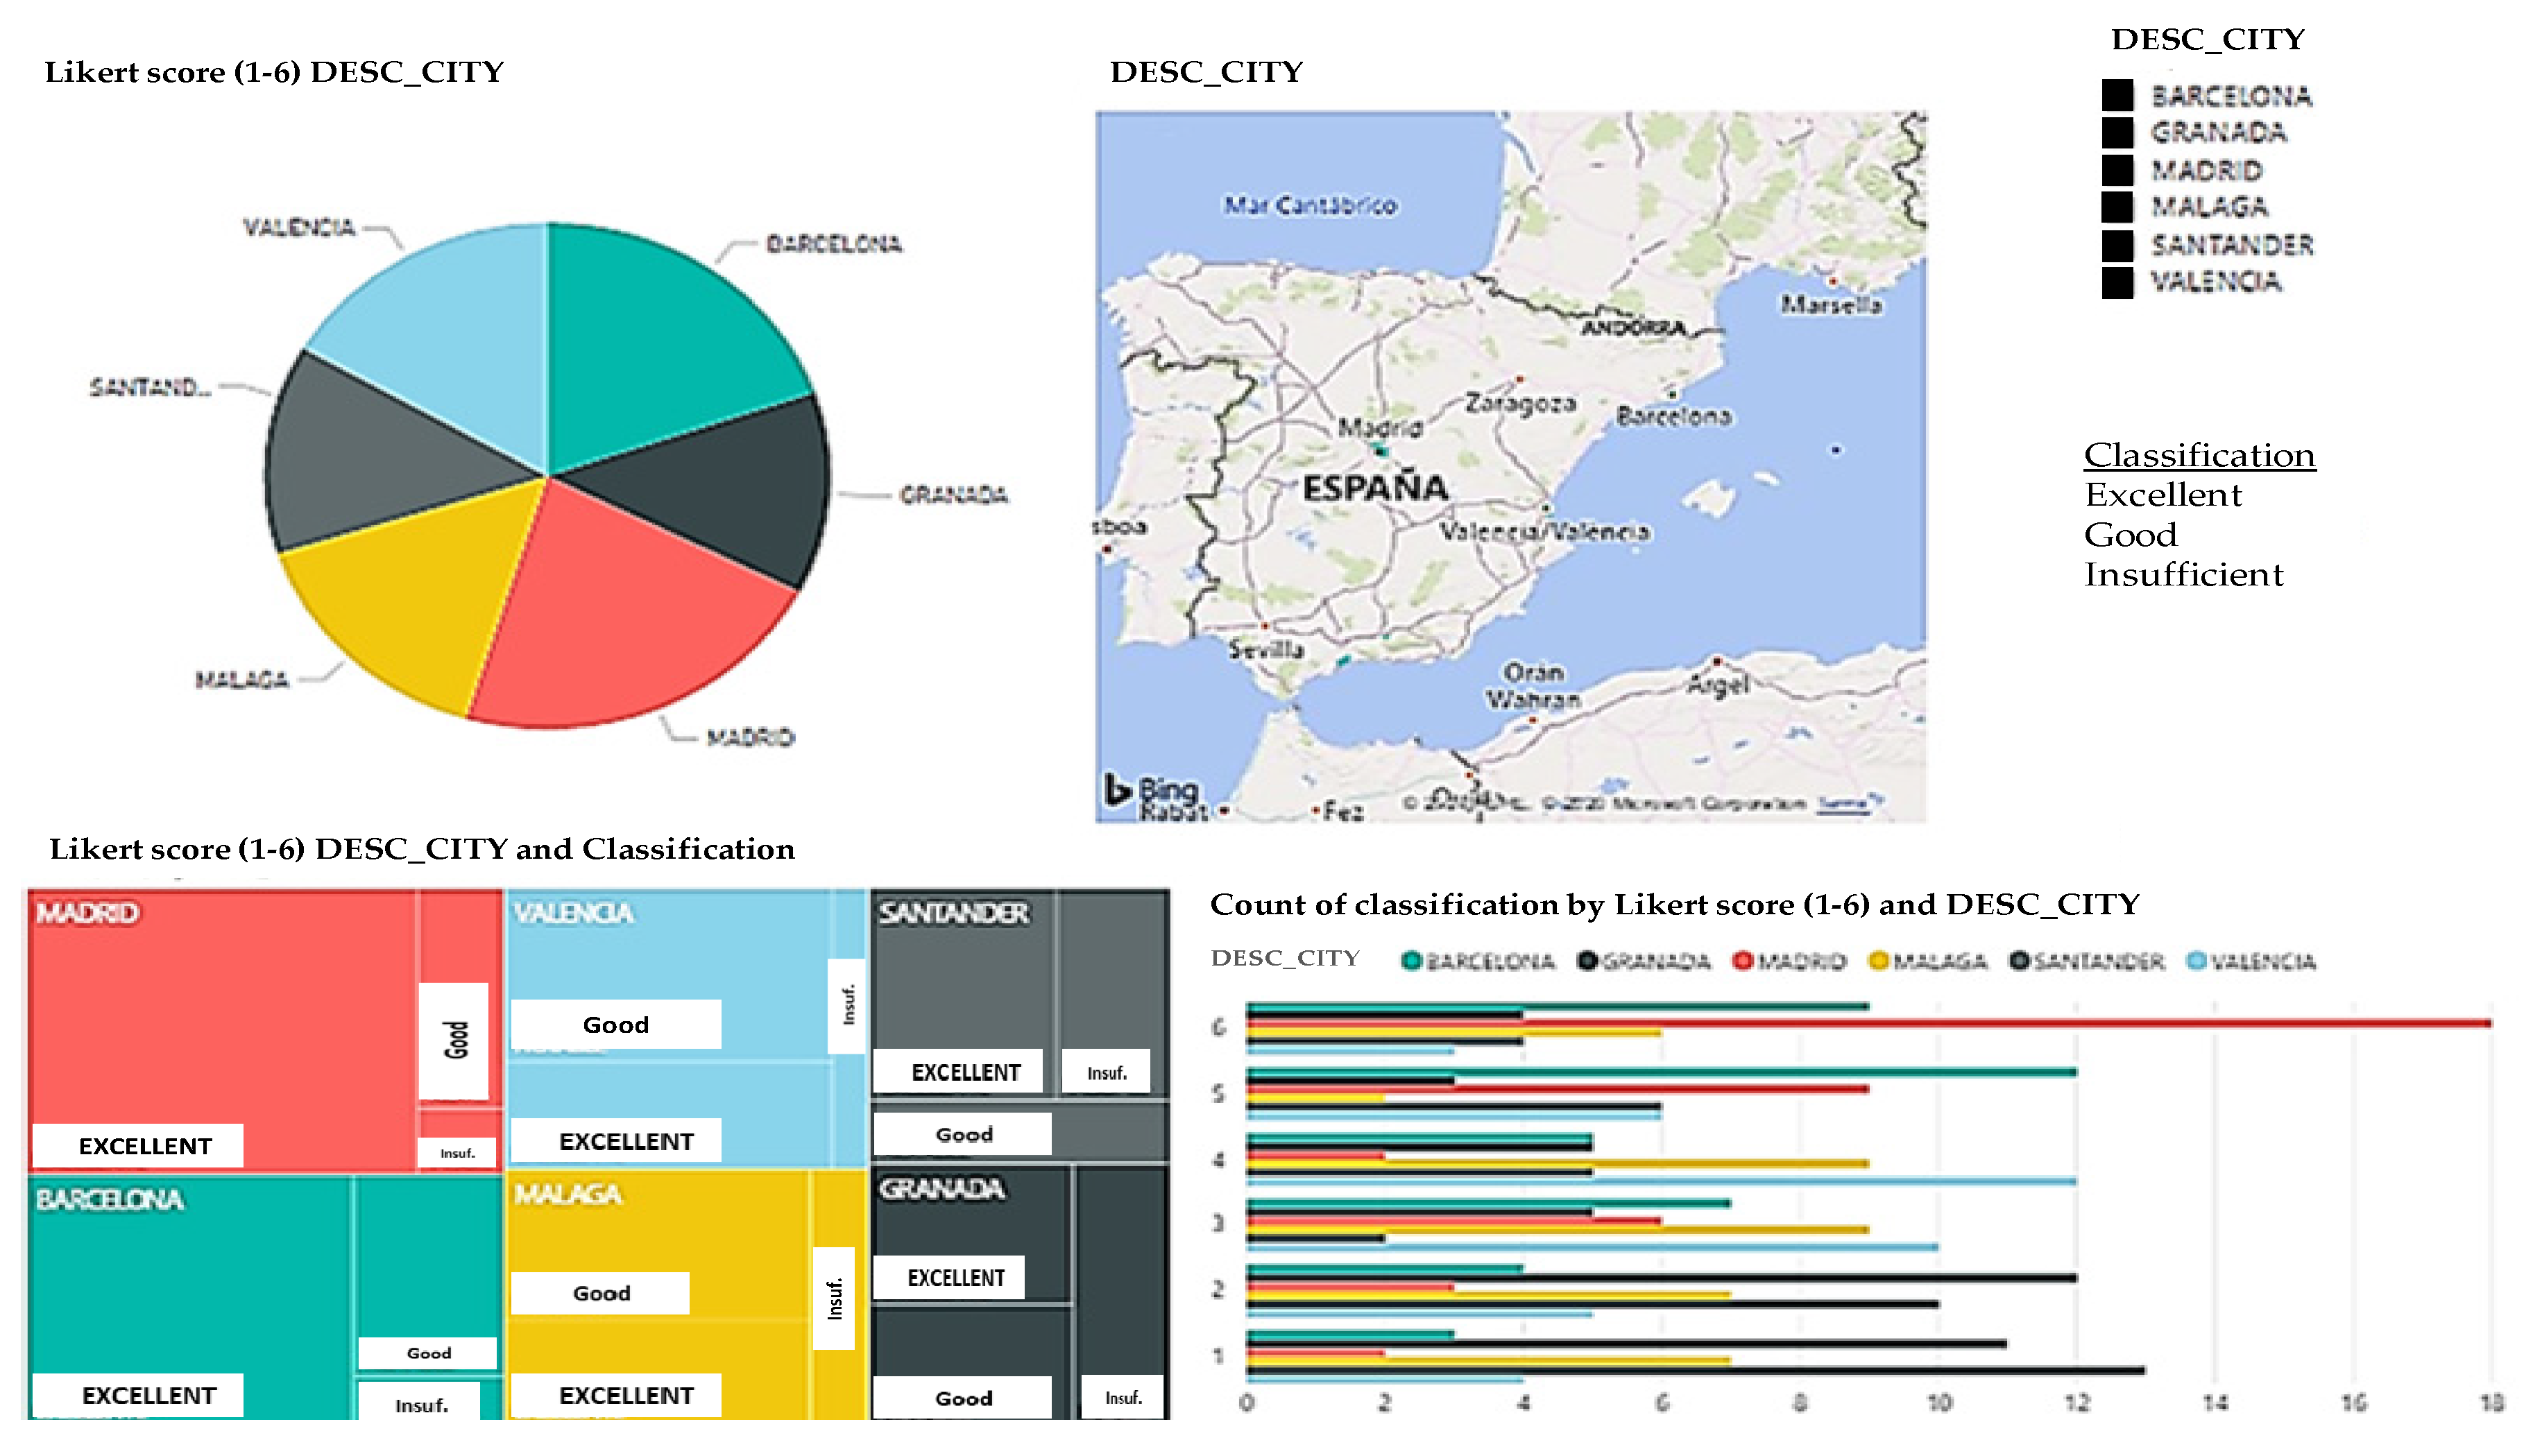
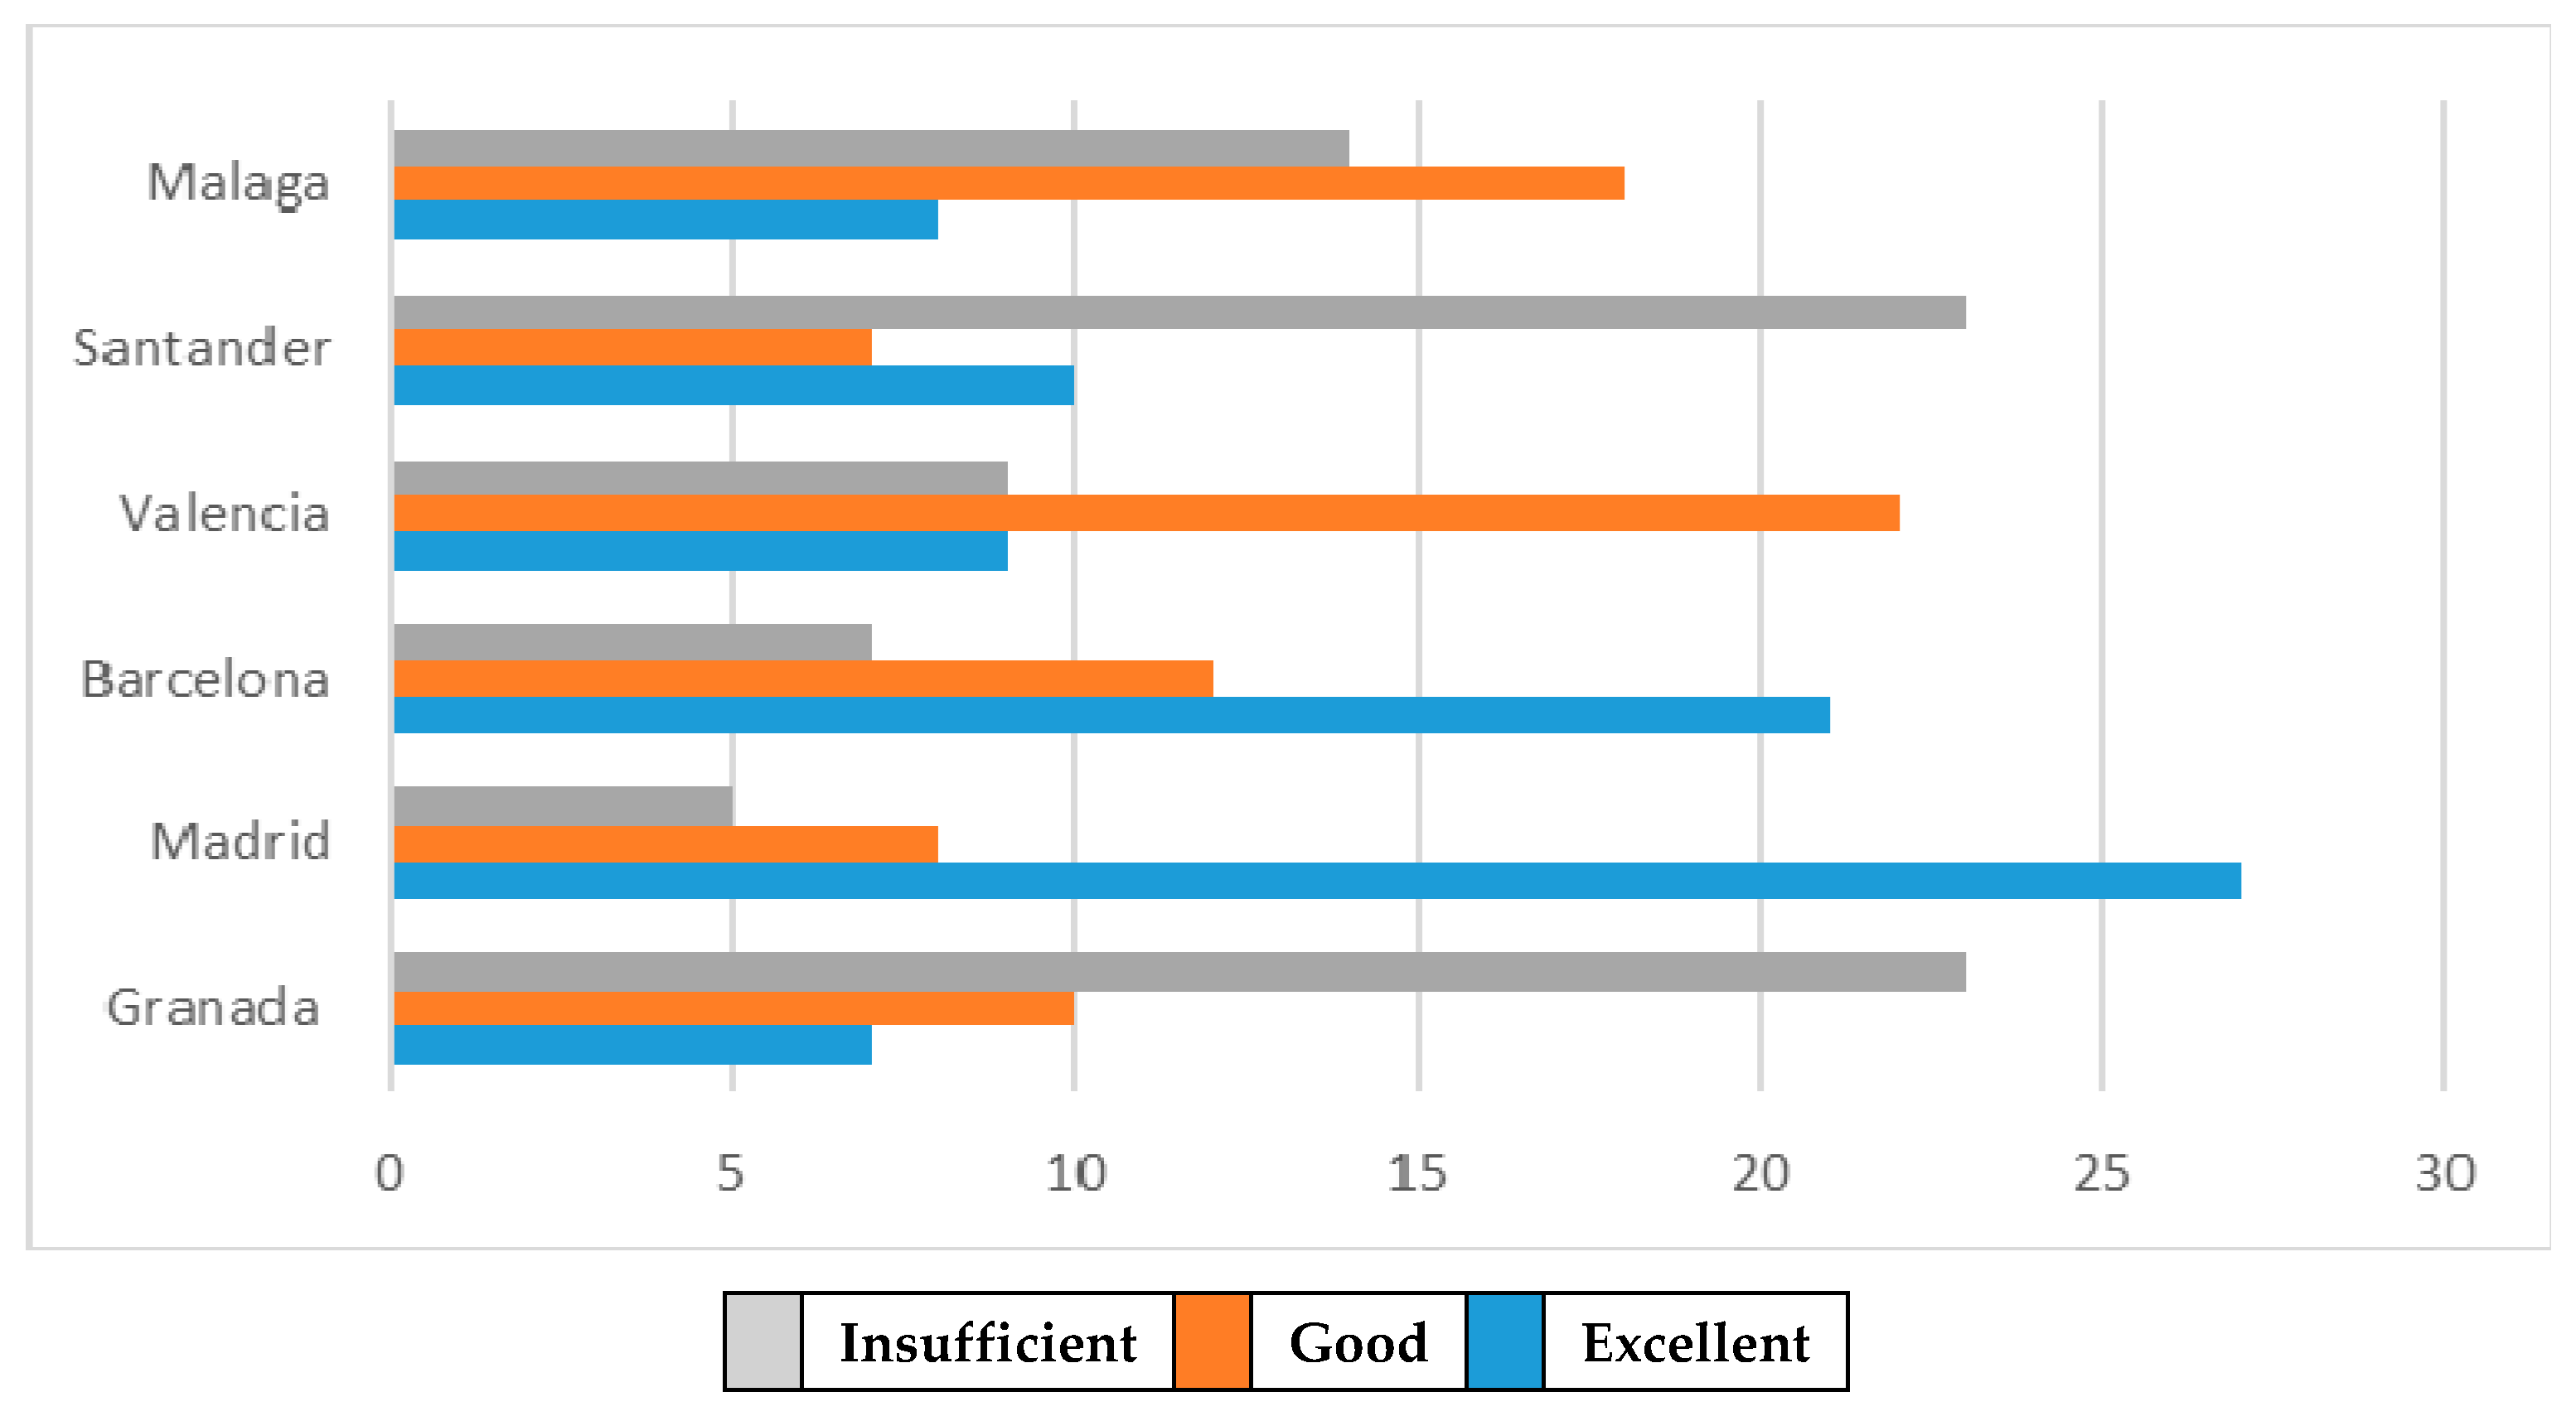
  • Malaga stands out for its energy efficiency and pollution reduction project, which reduced CO2 emissions by 20% and earned the city the classification of Good (scores of 3 and 4).
  • Santander was one of the pioneers in developing a real-time traffic monitoring plan, with over 20,000 sensors distributed throughout the city.
  • Valencia was one of the first cities to develop a citizen services management platform with the project fiware VLCi. Valencia is improving its position in the ranking of Smart Cities. This platform integrates key citizen services that span five areas of the city: governance, mobility, environmental management, wellbeing, and tourism.
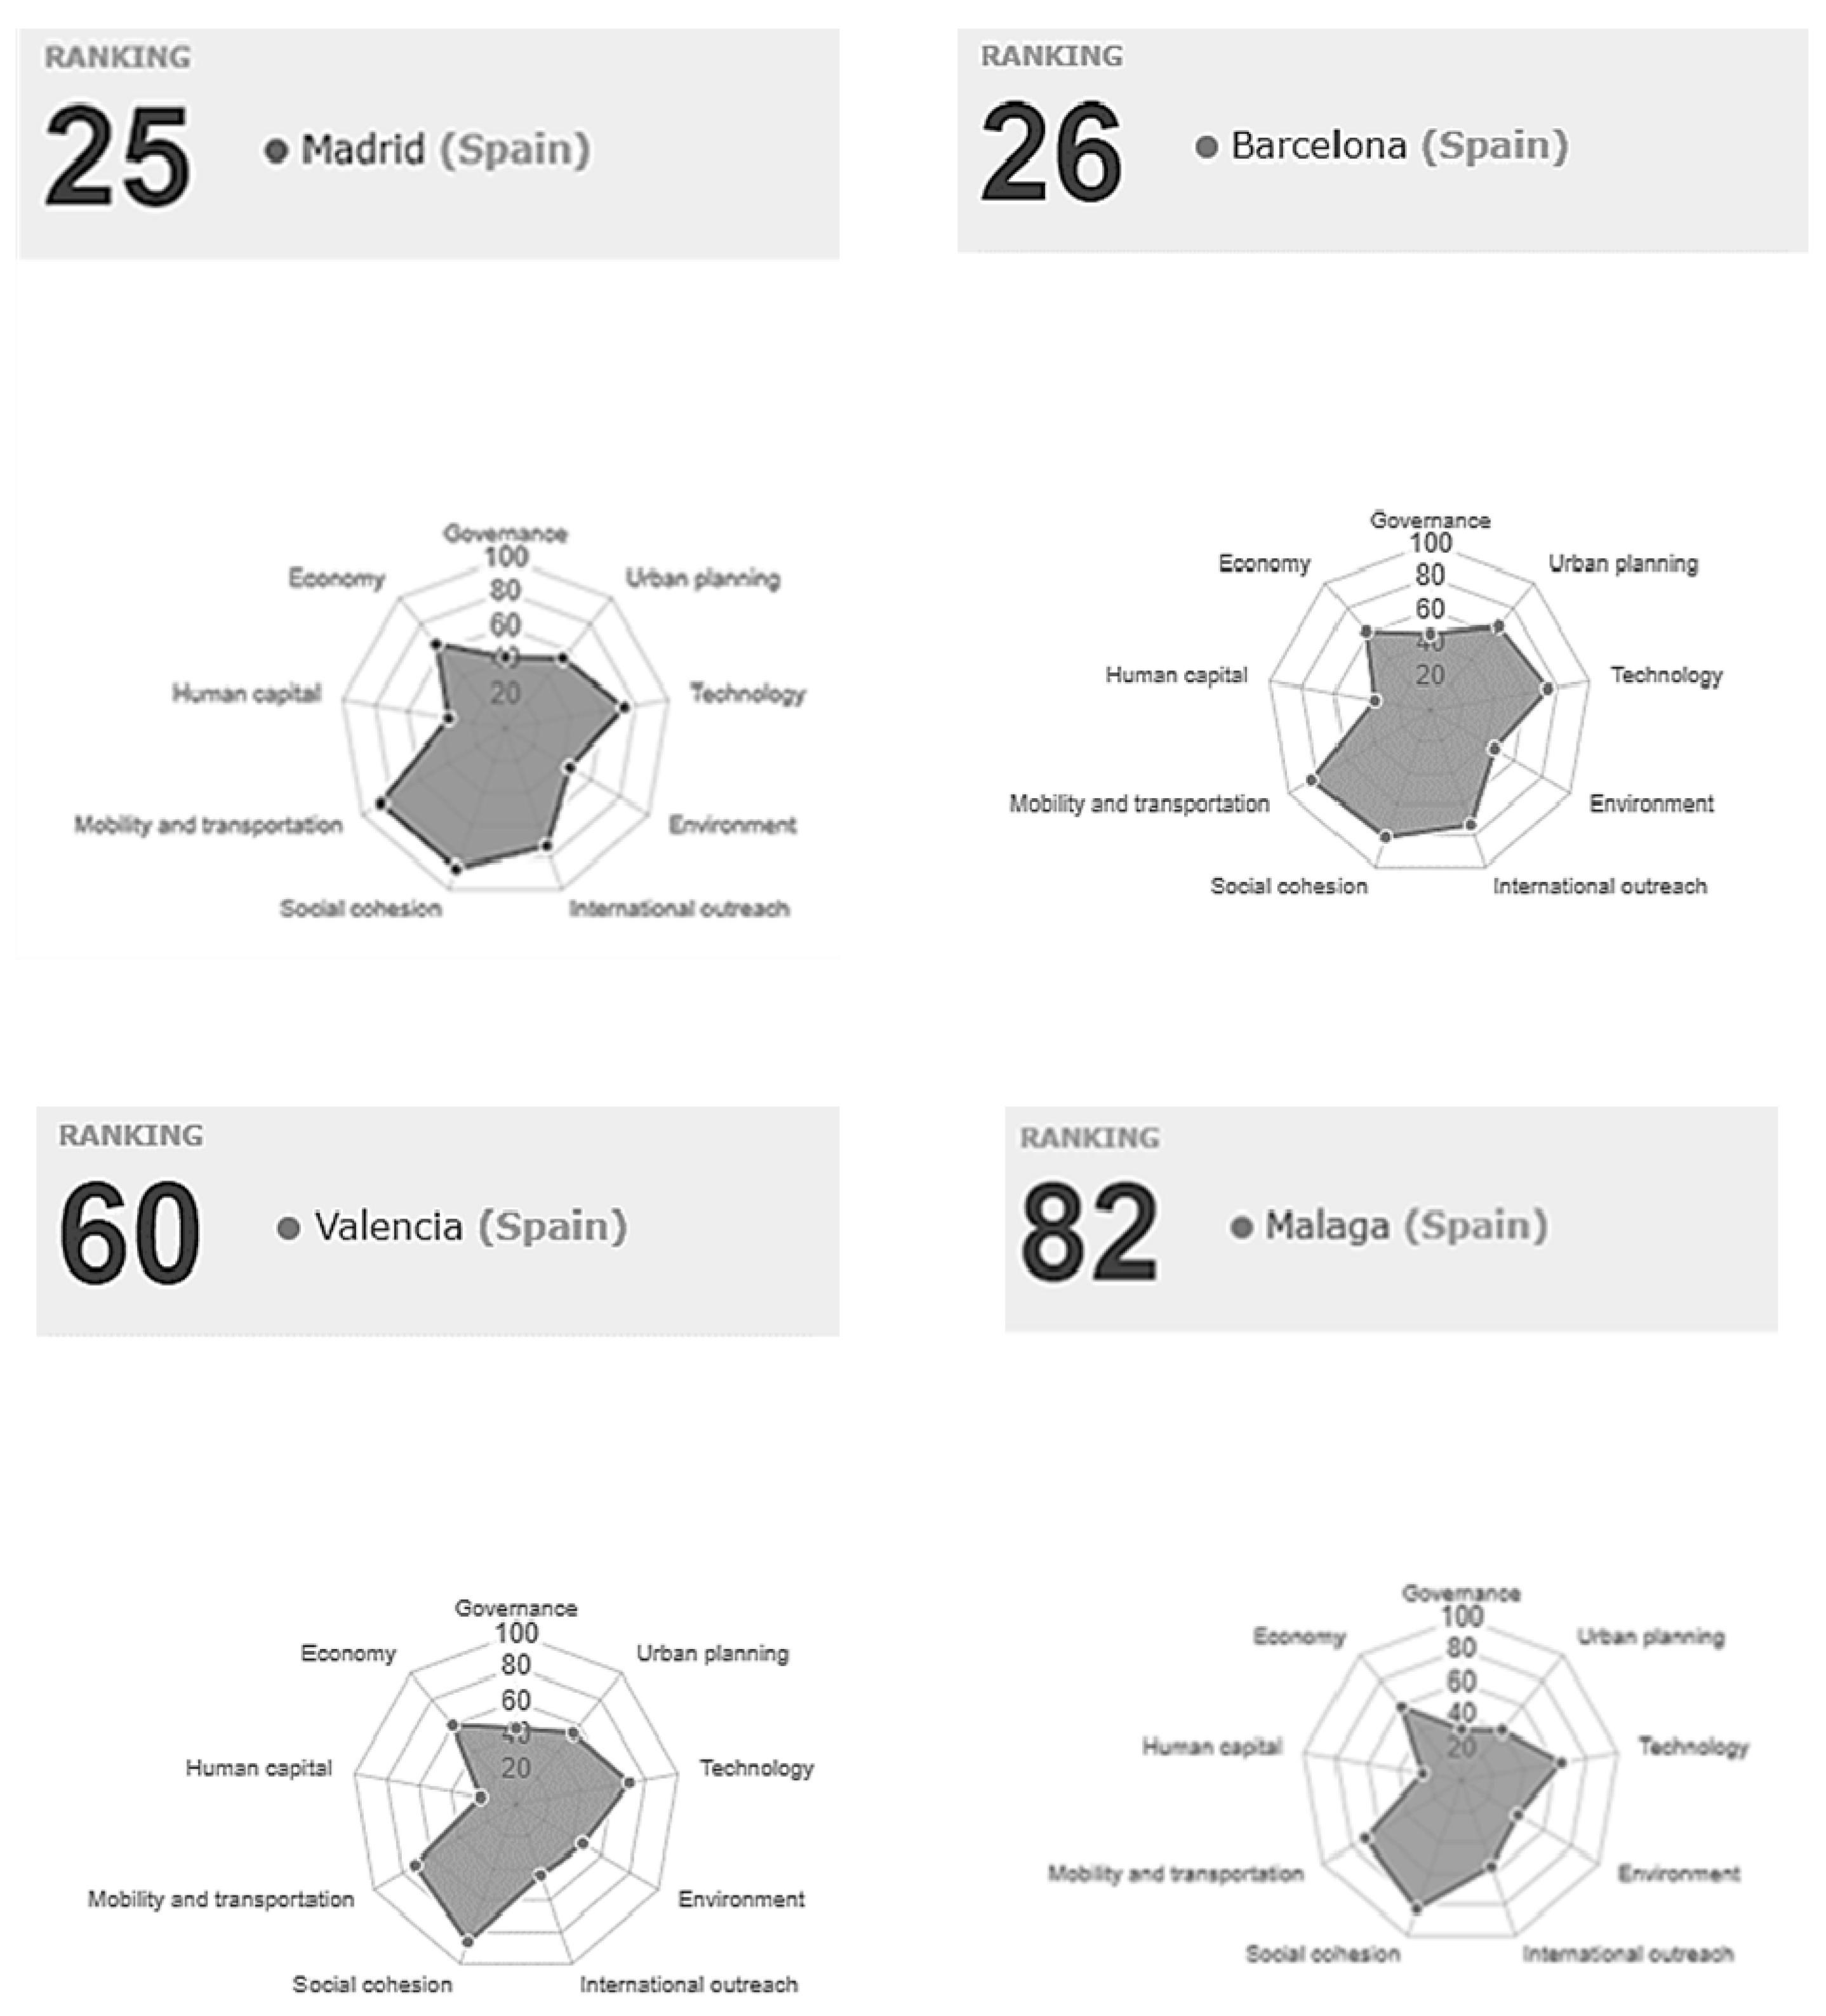
  • Barcelona uses a transportation network for a public bicycle service, intelligent devices in the home, and a real-time stock management system for available healthcare material, obtaining a score of Excellent. The city should, however, improve in some aspects which are classified as insufficient (e.g., little use of renewable energy in public transport, inefficient mobility (measured by traffic accidents per 1000 inhabitants), emergency citizen services, CO2 emissions per capita, number of homeless people, and average emergency response time).
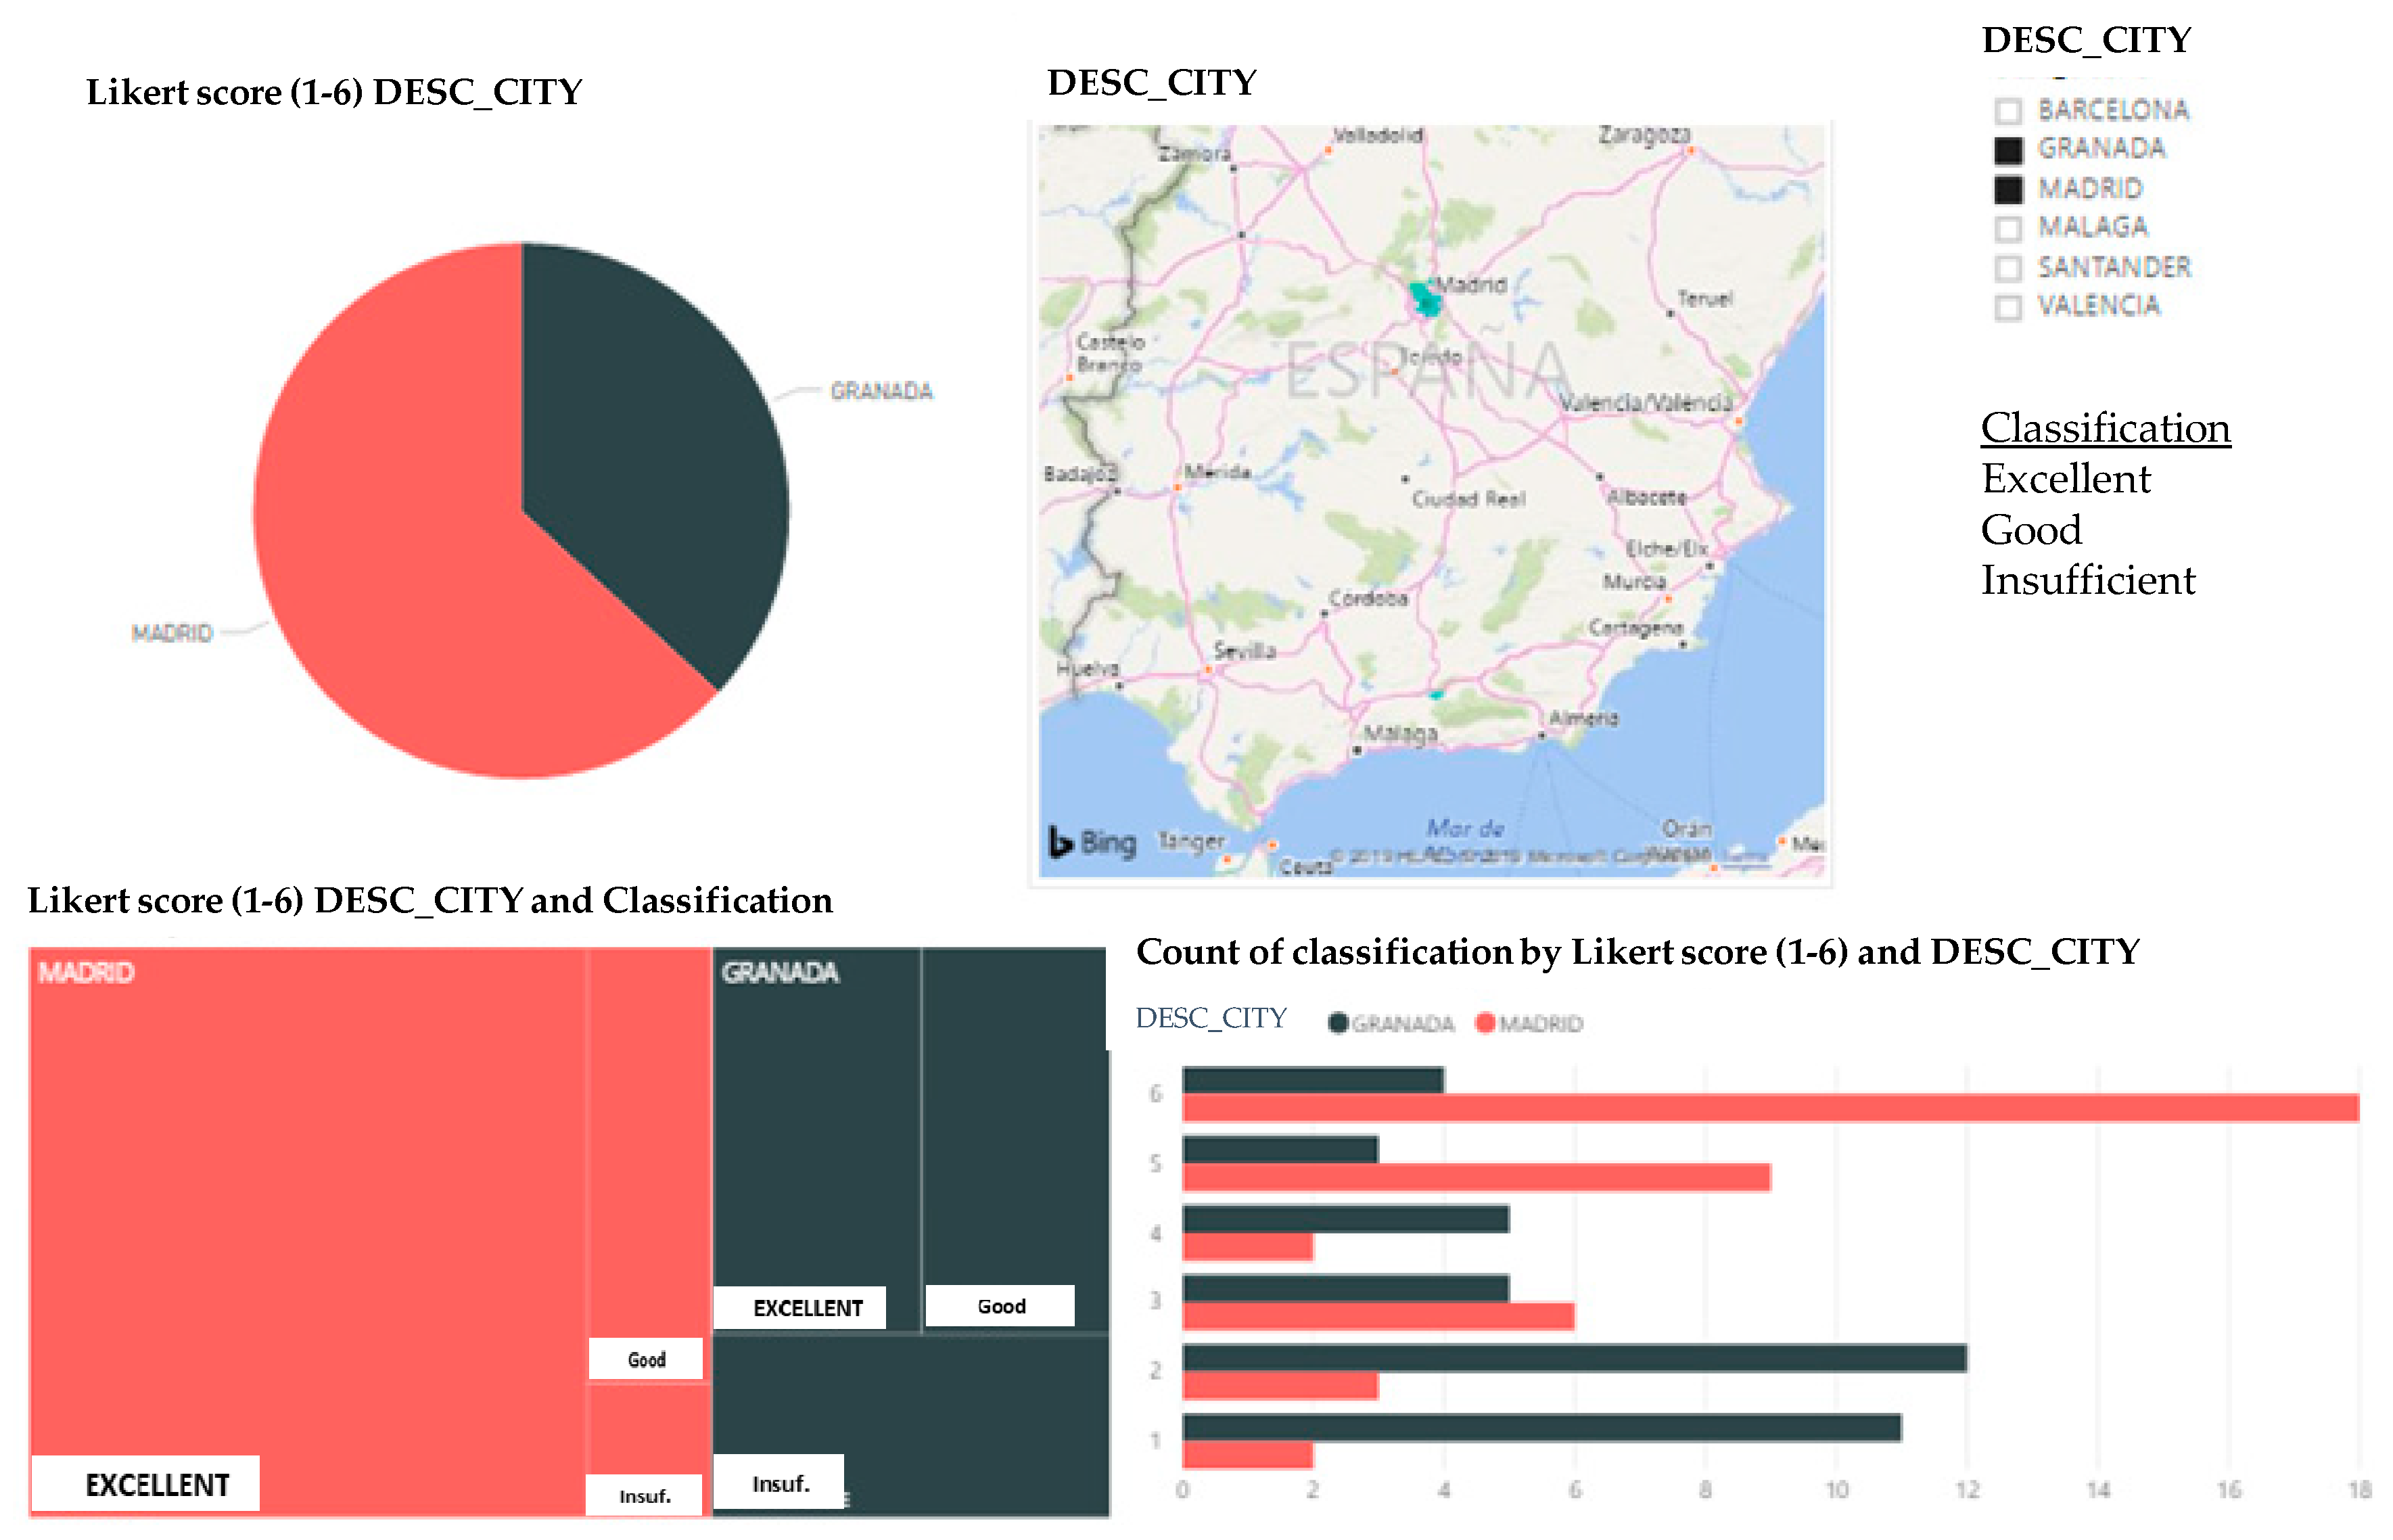
  • Most of Madrid’s indicators are classified as Excellent, with a score of 6. Madrid should, however, improve in some issues that continue to be classified as insufficient (e.g., the approximate percentage of electric energy consumption (kwh), number of accidents per 1000 inhabitants, average daily concentration of NO2, security in the use of mobile devices, and average emergency response time).
Nevertheless, specific issues need improvement in each city (Table 6). The Health Emergency areas for all of the cities are striking, as are the impact of mobility and the sustainable development of public transport. Other areas of concern are the levels of energy resource consumption and of pollution discharged into the atmosphere.
Figure 11, below, displays the scores of each city by level.
As to the reference city in our study, Granada, we first compared it to the highest-ranked Spanish city, Madrid (Figure 12). The results show that Granada receives a score of Excellent for some of the indicators present in Madrid (Madrid obtained a total of 18 indicators with a score of 6, and nine with a score of 5) vs. Granada (a total of four indicators with a score of 6, and three with a score of 5). At the other extreme, Madrid has five scores of Insufficient (three indicators with scores of 2, and two with scores of 1), whereas Granada has 23 (12 with scores of 2, and 11 with scores of 1) that must improved. The integrated dashboard developed enables us to focus on the strategies that must be considered for the transformation of Granada into a Smart City.

4.2. Measures Proposed to Overcome the Deficiencies Detected in the City of Granada

To improve Granada, we must take a series of strategic measures in governance, mobility, the environment, the economy, and quality of life, in order to enable the city’s transformation into a Smart City (Table 7). These 23 indicators correspond to the research questions formulated in this study in order to enable Granada’s transformation into a Smart City.
The following are some notable deficiencies:
  • As to governance measures, the number of ambulances per 100,000 inhabitants is 1.64 [67], one of the worst figures for the region. We propose a personalized service for each patient, with full transparency of information and an app for the real-time management of the waiting time for each patient [67].
  • To foster government–citizen channels, Granada should work to create an e-government with participatory processes for citizens, elections accessible to its population, and e-administration to improve the quality of services. These proposals revolve around apps to enable citizens to participate in activities organized in the city, and information given in real time about municipal publications to exploit and optimize different areas of the city.
  • The city lacks a great deal of knowledge on almost any online procedure. Procedures are performed in person, which makes digital integration difficult for citizens. Granada must create an open data network to make data accessible to all of its citizens. Such a network would enable transparency in local government action.
  • As for mobility, Granada has about 30 km of bicycle paths [73]. The city’s orography makes it difficult to implement a network that reaches the Albaycin and Sacromonte neighborhoods. Further, most bike lanes are on the periphery, which makes them hard to use. We thus propose the focusing of the network on leisure and not functional mobility as a means of transportation. We propose the restructuring of the areas of the city center to reduce traffic congestion and increase the network to just 54% of the city’s metropolitan network.
  • Establishing public charging stations for electric vehicles. Most are currently private. The power level required for the network should be 2.3–350 kw. Most of the charging stations in the city have a low power levels. If we compare Granada to Barcelona (the city with the highest number of charging stations (570 stations and 14 km2 per charging station)), Granada (with 35 stations and 361 km2 for each station) is deficient by a large margin in this measure [67,72].
  • A total of 15% of the population uses public bus transportation in Granada, whereas 32% use cars [75]. The bus system’s 29 lines provide a complete but inefficient transportation network. Travelers are lost due to the saturation of users, especially with the large university population. We propose the development of online applications to manage urban traffic for visitors, and apps that register the type of visitor in order to adapt the city’s services to visitors’ habits and customs.
  • As for the environment, around 30% of Granada’s waste is not treated as recyclable material [76]. We propose to raise urban awareness with brochures and information to improve these figures, and R&D projects to create smart networks that manage supply.
  • The quantity of green space shows that Granada has a total of one tree per five inhabitants, or a shortfall of nearly 30,000 trees [74] to achieve the approximately 15 m2 that the WHO guidelines establish for green areas per inhabitant.
  • Granada has approximately three fire fighters per 10,000 inhabitants, well below the European recommendations of 10 per 10,000 [68].
  • As for economic measures, increasing the foreign resident population in the city is another key factor that Granada should foster from the perspective of multiculturalism. We propose the improvement of online reservations services, information at tourist access points, free WiFi, and secure data networks, etc.
  • As for quality of life through universal accessibility, we propose the hiring of more disabled personnel in order to achieve greater social integration. Teleassistance for the elderly and/or disabled improves hospital security for these patients. Sensors enable the monitoring of subjects’ healthcare activity, providing information on their state of health in real time [77]. Another measure that we propose is the installation of more traffic lights with acoustical signals for the blind.
  • Decreasing the percentage of the population living in poverty: one third of Granada’s population lives in poverty [78]. The city should bid to help entrepreneurs and firms access a commercial network that is more favorable to e-commerce and social networks. The city must also work to improve education, for example, by gradually changing the city’s tough education system to adopt new teaching styles that involve students in critical thinking, creativity, and innovation. It would also be beneficial to update education for 21st-century students, and provide an education system with digital tools that form part of the change in technological trends, digital blackboards, and tablets, etc., by making students aware of how to use them well.
  • In the area of health, Granada must foster an increased birth rate in the population. The city’s population pyramid is inverted, with around 22% of the population being over 65 years old [79]. Other health-related areas in need of improvement are hospitals and the quality of healthcare [80]. We propose virtual reality projects in order to control stress and psychological processes. The system can use the waiting time for a virtual self-check to determine the patient’s state prior to an appointment with a specialist. A real-time stock management system for healthcare material could also be implemented, like that in Barcelona.
The areas in which Granada receives below-average scores relate especially to quality of life (universal accessibility, social cohesion, and healthcare), the environment, and pollution levels. Based on a comparative analysis of the six Spanish cities, we can answer the research questions. To make Granada a Smart City, we recommend using the strategic technological measures from Table 7 to respond affirmatively to Research Questions 1, 2, 3, 4, and 5, and to improve the lowest-scoring strategic issues in public administration, mobility, the environment, the economy, and quality of life.

4.3. Discussion

At a general level, we are facing a process of dizzying change with terrible consequences for the environment and quality of life for present and future generations. Changing business activity has created a change in internal demand. To all of this, add the fall in demand for goods and services from other countries and a suspension of global value chains intensified by the pandemic [8,81]. At a macroeconomic level, government authorities have deployed a range of measures to palliate these effects, from granting bank credits to firms to providing economic aid for the most vulnerable households.
All of the dimensions to consider in a Smart City will be affected by this new reality. In facing these changes in the global trend (e.g., overpopulation, excess pollution and energy waste, pandemic), we propose actions to mitigate the negative effects of change. We must put into practice sustainable urban movements that contribute to the growth of local economies and improve the process of raising citizens’ awareness of such an abrupt transformation.
This study has led to the creation of an integrated dashboard with governance, mobility, environmental, economic, and quality-of-life measures that can be applied to specific cities with an average of 250,000 inhabitants, in order to transform them into Smart Cities [63]. More specifically, this study has characterized the city of Granada (in the south of Spain) and identified the areas in which it needs to improve in order subsequently to design a plan to implement proposals to transform the city. The study generated improvement measures that can be applied to Granada to change its excellence ratio and make it into a Smart City on the level of Madrid, Barcelona, London, Bergen, Hamburg, Boston, Toronto, and Singapore.
In sum, all of the evidence aligns with our results. It suggests that these variables, taken together, combine to generate a process of change to achieve new models of resilient cities that can face and survive critical situations [82,83]. The analysis refers specifically to Granada, to the development of AI in cities’ innovation and learning [6,31], and to obtaining a performance that complies with some of the SDGs [84] and will endure over time in order to avoid situations like the current one. Some of these goals focus on innovation and sustainability, such as: (a) fostering sustained, inclusive, sustainable economic growth, with full productive employment and decent work for all; (b) making cities inclusive, safe, resilient, and sustainable in terms of technology and business; (c) guaranteeing sustainable consumption and production patterns; and (d) developing resilient infrastructure, promoting inclusive and sustainable industrialization, and fostering innovation.

5. Conclusions, Implications, Limitations and Future Research Lines

This section synthesizes the theoretical and practical implications of this study. It also details the limitations and future research lines, and provides a brief conclusion from the study.

5.1. Theoretical Implications

This study enables us to advance Dynamic Capabilities Theory and Complexity Theory by fostering the measures of the integrated dashboard to permit cities to obtain a competitive advantage and to improve their current situation through innovation and collaboration with the different agents involved in urban development.
The study contributes to Dynamic Capabilities Theory by advancing the field of innovation, learning technology, and sustainable entrepreneurship.
The study also concludes that variations in dynamic capabilities are interrelated, due to firms’ dynamic environments and the connections among the agents involved. That is, the development of dynamic capabilities is constantly influenced by the turbulence and change that can arise in the firm’s environment. One key to the development of dynamic capabilities is thus the optimal interpretation of the opportunities and threats that emerge in a dynamic, complex, turbulent, and hostile environment. Such interpretation enables the city to readjust its knowledge and resource base substantially, in order to enable cities’ survival and future sustainable economic performance. At the same time, the goal is to encourage the development of new products, processes, action plans, services, and business models that are innovative and difficult to imitate [16,85,86].
As for entrepreneurship, it is necessary to create resilient ecosystems that can face crises [9,14] in a sustainable way [11,12] by developing the concept of resilient entrepreneurship ecosystems.
Furthermore, the application of Complexity Theory leads us to argue that firms and governments must establish relationships with diverse agents, since the development of new ideas (to be transformed subsequently into products and services) is the fruit of collaborative effort [87]. Heterogeneous agents (market-based networks (clients, suppliers, competitors), localized learning networks (universities, commercial laboratories/R&D enterprises, private social organizations, not-for-profit research institutes, and other institutional bodies), and knowledge flows through networks) foster a network of networks, linking companies, institutions, inventors, communities, and technologies [18,19], and stimulating innovative research on AI to relate connectivities to sustainable performance in cities.

5.2. Practical Implications

The high levels of improvisation and the interaction of the above-mentioned heterogeneous agents studied here require the implementation of certain measures along the way, which we can consider to be a learning period during which to exploit the potential of new technologies in periods of crisis. One must focus on the government’s advances in a three-dimensional area [88]—resilience, inclusion, and sustainability—to encourage the goals of sustainable development programmed for 2030 [89], which will enable more civic and adaptive harmony.
In the case of resilience, every city must adapt to new circumstances and do everything possible to survive through technological innovation or the application of AI. Drones could be used for communication, energy could be obtained from non-fossil fuels, images could be processed to help in the analysis of X-rays for faster diagnoses, new forms of surveillance could be adopted for security in cities, and projects could slow the spread of the SARS-CoV-2 virus through the crowdsourcing of data for real-time applications to monitor the location of positive COVID-19 patients and detect them early, etc. Blockchain is one of the most innovative cutting-edge technologies used in the response to Covid-19, with applications for firms, vulnerable people, and fake news, etc. [3]. Using big data to control traffic and mobility is the key to facing this type of pandemic. The application of AI in these initiatives can use predictive analyses in decision-making about specific behavior in order to help cities to get ahead of or avoid poor practice. Now more than ever, we must seek national digitalization that is ‘people-focused’, with greater knowledge of digital competences that advance society in a more humanistic framework.
In the area of microeconomics, firms must change their business strategies and value chains [1,81]. Firms will have to adopt primarily measures that permit them to focus on other types of work models that highlight more resilient supply chains that are rapid and transparent, in order to permit the following: evaluation of risk management plans when making decisions in times of emergency; the reactivation of multilateralism, in order to achieve better cooperation for greater consensus among countries and thus a truce in international investment flows [4]; the stimulation of digital transformation in industry in order to enable faster economic recovery for many firms, reducing costs and creating new jobs; the bid for innovation to face individual healthcare emergencies (R&D projects and investment to make the system more flexible using new instruments that encourage competitiveness and advance biomedical research, and the environmental and social management of Smart Cities and public health); the fostering of health information systems supported by ICTs in their various dimensions (e-health), combined with virtual and augmented reality systems; and the inclusion of e-commerce and telework in the city’s business network in order to avoid urban agglomerations and decrease excessive traffic, contributing to technological inclusion and the optimization of energy consumption.
In terms of resilience, cities must develop resilient infrastructures that promote inclusive and sustainable industrialization and foster innovation. Cities and firms must be inclusive, secure, resilient, and sustainable [89]. Job inclusion is also necessary, based on the circumstances. Making work flexible through teleworking is key to an effective production model when facing a crisis. A new, more collaborative ecosystem and the creation of synergies are necessary to face today’s less certain, more complex situations. Bidding for virtual meetings and the daily monitoring of employees’ health, etc., is a necessary next step in workplace harmony and cohesion. Specifically, sustained, inclusive economic growth should be fostered, as well as full and productive employment, and decent work for all. In the area of sustainability, the new city will involve a much more conscious society which is more interconnected with firms, agents, and citizens [5]. Businesses and municipal governments should value the most humanitarian actions. Each business must adapt or reinvent its strategies to be global and comprehensive, and to contribute value in environmental terms [6,84]. Guidelines must be guaranteed for sustainable consumption and production.
This study visualizes and provides guidelines for improvement through the application and implementation of the algorithmic proposals inherent in the current conception of the use of machine learning, AI, or automatic learning at the city level in order to improve the measures implemented in public administration, mobility, the environment, the economy, and quality of life.

5.3. Limitations and Future Research Lines

Performing a project of this size involves the assessment of the need for complex processes of great scope. The study’s strategic lines are not exclusive in determining what a Smart City is, but rather constitute a step toward the improvement of what one wishes to achieve. Similarly, the initial disbursement in endowing a city with technology infrastructures involves attracting investors to support that local economy. Promoting a complete communications network helps to achieve this goal by increasing universal accessibility and overcoming these deficiencies. A process of local leadership must develop a process to manage and stimulate the innovation ecosystems that bid for sustainability. Over 50% of the projects carried out in cities come from the environment and mobility [90].
Starting from real data from different sources [46,48,49,50,51,52,53,54,55,56,57,58,59,60,61,62], we have created an integrated dashboard and applied it to the specific case of Granada, identifying 23 deficient indicators, so that different measures supported by technological innovation and AI can help the city to improve its level of Smartness in the national landscape. Other indicators can be analyzed in the future, and the study could be expanded to assess more cases at the national and international levels. We must stress that not all Smart measures proposed in a city involve the same use of AI or technological innovation, but we can indeed affirm that AI and digital and technological innovation bring noteworthy improvement in the sustainability and efficiency of the different dimensions in the urban environment, the reduction of pollution, and the production of significant energy savings in the city.

5.4. Conclusions

Technological and digital innovation and AI are crucial for the development of improvements in the public administration, mobility, environment, economy, and quality of life in cities. What is essential for achieving a transition from a conventional city to a Smart City is the consideration of the change in the trend from functional systems to more sustainable and intelligent ones. ICT infrastructures must be set up to optimize the financial structure [91]. Very diverse issues, which involve the environment, quality of services, and social behavior, etc., must be integrated.
All of these changes are achieved by engaging citizens and interested parties (universities, firms, and R&D centers, etc.). We must use a full series of technological strategies and tools to help open the field to decision-making that increases cities’ perceived value. Analyzing and applying the field of AI is thus key to achieving disruptive change in all of the areas of the urban environment [92]. We must not forget to analyze the technological measures to be applied in different ways based on the local strengths and weaknesses reflected in the specific integrated dashboard and the different areas of each city, in order to make it a Smart City.

Author Contributions

At this research A.O.-F. did the ground exploration and the initial research to get the theoretical framework. R.M.-R. focused on the ideas of Anabel and the statistic and methodology made by V.J.G.-M. got further research and widened the theoretical focuses of the article, contributions, examples and conclusions. V.J.G.-M. did the methodology, the analysis of the article and reviewed all the article combined. All authors have read and agreed to the published version of the manuscript.

Funding

This work was supported by the Spanish Ministry of Economy, Industry, and Competitiveness within the framework of two projects: ECO2017-88222-P and B-SEJ-042-UGR18.

Conflicts of Interest

The authors declare no conflict of interest on this article.

References

  1. United Nations. Cities Will Continue to Grow Especially in Developing Countries. Available online: https://bit.ly/2L8Abdc (accessed on 10 January 2020).
  2. Dameri, R.P. Smart City Implementation. In Creating Economic and Public Value in Innovative Urban Systems; Springer International Publishing: Cham, Switzerland, 2017; pp. 1–108. [Google Scholar]
  3. Huang, S.L.; Chen, C.W. Theory of Urban Energetics and mechanisms of urban development. Ecol. Model. 2005, 189, 49–71. [Google Scholar] [CrossRef]
  4. Caragliu, A.; Del Bo, C.; Nijkamp, P. Smart Cities in Europe. J. Urban Technol. 2011, 18, 65–82. [Google Scholar]
  5. Silvestre, B.S.; Tirca, D.M. Innovations for sustainable development: Moving toward a sustainable future. J. Clean. Prod. 2019, 208, 325–332. [Google Scholar]
  6. D’Adamo, I.; Falcone, P.M.; Martin, M.; Rosa, P. A sustainable revolution: Let’s go sustainable to get our globe cleaner. Sustainability 2020, 12, 4387. [Google Scholar] [CrossRef]
  7. Zaheer, A. On big data, artificial intelligence and smart cities. Cities 2019, 89, 80–91. [Google Scholar]
  8. Banco de España. Escenarios macroeconómicos de referencia para la economía española tras el Covid-19. Bol. Econ. Banco Espan. 2020, 2, 1–35. [Google Scholar]
  9. Bullough, A.; Renko, M. Entrepreneurial resilience during challenging times. Bus. Horiz. 2013, 56, 343–350. [Google Scholar]
  10. Elmqvist, T.; Andersson, E.; Frantzeskaki, N.; McPhearson, T.; Olsson, P.; Gaffney, O.; Takeuchi, K.; Folke, C. Sustainability and resilience for transformation in the urban century. Nat. Sustain. 2019, 2, 267–273. [Google Scholar]
  11. Roundy, P.T.; Brockman, B.K.; Bradshaw, M. The resilience of entrepreneurial ecosystems. J. Bus. Ventur. Ins. 2017, 8, 99–104. [Google Scholar]
  12. D’Adamo, I.; Rosa, P. How Do You See Infrastructure? Green Energy to Provide Economic Growth after COVID-19. Sustainability 2020, 12, 4738. [Google Scholar]
  13. Cocchia, A. Smart and Digital City: A Systematic Literature Review. In Smart City. Progress in IS; Dameri, R., Rosenthal-Sabroux, C., Eds.; Springer: Cham, Switzerland, 2014; pp. 13–43. [Google Scholar]
  14. Osiyevskyy, O.; Shirokova, G.; Ritala, P. Exploration and exploitation in crisis environment: Implications for level and variability of firm performance. J. Bus. Res. 2020, 114, 227–239. [Google Scholar] [CrossRef] [PubMed]
  15. Teece, D.; Pisano, G.; Shuen, A. Dynamic capabilities and strategic management. Strateg. Manag. J. 1997, 18, 509–533. [Google Scholar] [CrossRef]
  16. Cruz, J.; López, P.; Martín de Castro, G. La influencia de las capacidades dinámicas sobre los resultados financieros de la empresa. Cuad. Estud. Empres. 2009, 19, 105–128. [Google Scholar]
  17. McElroy, M.W. Integrating complexity theory, knowledge management and organizational learning. J. Knowl. Manag. 2000, 4, 195–203. [Google Scholar] [CrossRef] [Green Version]
  18. Corral de Zubielqui, G.; Jones, J.; Statsenko, L. Managing innovation networks for knowledge mobility and appropriability: A complexity perspective. Entrep. Res. J. 2016, 6, 75–109. [Google Scholar] [CrossRef]
  19. Martín-Rojas, R.; García-Morales, V.J.; Garrido-Moreno, A.; Salmador-Sanchez, M.P. Social Media Use and the Challenge of Complexity: Evidence from the Technology Sector. J. Bus. Res. 2020, in press. [Google Scholar]
  20. Su, K.; Li, J.; Fu, H. Smart City and the applications. In Proceedings of the International Conferences on Electronics, Communications and Control, Nigbo, China, 9–11 September 2011; pp. 1028–1031. [Google Scholar]
  21. Enerlis, Y. Libro Blanco de Smart Cities; Imprintia: Madrid, Spain, 2012; pp. 1–113. [Google Scholar]
  22. Andalusia Smart Action Plan. 2020. Available online: https://www.juntadeandalucia.es/export/drupaljda/2016-08-30%20PAAS2020.pdf (accessed on 15 January 2020).
  23. Elmahdy, H.N. Medical Diagnosis Enhancements through Artificial Intelligence; Ain Shams University Press: Cairo, Egypt, 2014; pp. 9–12. [Google Scholar]
  24. Moursund, D. Brief Introduction to Educational Implications of Artificial Intelligence; University of Oregon Press: Eugene, OR, USA, 2003; pp. 3–68. [Google Scholar]
  25. Nordlander, T.E.; Nordlander, T.E. AI Surveying: Artificial Intelligence in Business; Montfort University Press: Leicester, UK, 2001; pp. 33–54. [Google Scholar]
  26. Reiterer, A.; Egly, U.; Björn Riedel, M.H. Application of Artificial Intelligence and Innovations in Engineering Geodesy. In Proceedings of the Second International Workshop on Application of Artificial Intelligence and Innovations in Engineering Geodesy (AIEG 2010), Braunschweig, Germany, 7–9 June 2010; pp. 1–95. [Google Scholar]
  27. Cristani, M. The complexity of reasoning about spatial congruence. J. Artif. Intell. Res. 1999, 11, 361–390. [Google Scholar] [CrossRef] [Green Version]
  28. Mihael, H.C. Artificial Intelligence; Library Congress: Washington, DC, USA, 1963; pp. 89–125.
  29. LeCun, Y.; Bengio, Y.; Hinton, G. Deep Learning; Macmillan Publishers Limit: London, UK, 2015; pp. 1–9. [Google Scholar]
  30. Silver, D.; Aja, H. Mastering the game of Go with deep neural networks and tree search. Nature 2016, 529, 484–489. [Google Scholar] [CrossRef]
  31. Giménez Figueroa, R.; Martín Rojas, R.; García Morales, V.J. Business Intelligence: An Innovative Technological Way to Influence Corporate Entrepreneurship. In Entrepreneurship-Development Tendencies and Empirical Approach; Mura, L., Ed.; InTechOpen: Zagreb, Croatia, 2018; pp. 113–132. [Google Scholar] [CrossRef] [Green Version]
  32. Knight, G.A. Cross-cultural reliability and validity of a scale to measure firm entrepreneurial orientation. J. Bus. Ventur. 1997, 12, 213–225. [Google Scholar] [CrossRef]
  33. Zahra, S.A. Environment, corporate entrepreneurship, and financial performance: A taxonomic approach. J. Bus. Ventur. 1993, 8, 319–340. [Google Scholar] [CrossRef]
  34. Daws, R. AI News. 2016. Available online: https://artificialintelligence-news.com/ (accessed on 13 July 2020).
  35. Ramaswamy, S. How Companies are Already Using AI. 2017. Available online: https://hbr.org/2017/04/how-companies-are-already-using-ai (accessed on 13 July 2020).
  36. Dodds, P.; Watts, D.; Sabel, C. Information exchange and the robustness of organizational networks. Proc. Natl. Acad. Sci. USA 2003, 100, 12516–12521. [Google Scholar] [CrossRef] [Green Version]
  37. The University of Queensland. Blackboard Learn. 2015. Available online: https://learn.uq.edu.au/ (accessed on 19 May 2020).
  38. Word Bank. Word Bank Open Data. 2018. Available online: https://data.worldbank.org/ (accessed on 15 January 2020).
  39. World Bank. Urban Development. 2018. Available online: https://www.worldbank.org/en/topic/urbandevelopment (accessed on 25 January 2020).
  40. World Health Organization. WHO Global Urban Ambient Air Pollution Database. 2016. Available online: https://www.who.int/phe/health_topics/outdoorair/databases/cities/en/ (accessed on 26 January 2020).
  41. United Nations Department of Public Information. 2019. Available online: https://population.un.org/wpp/Publications/Files/WPP2019_PressRelease_ES.pdf (accessed on 26 January 2020).
  42. United Nations Educational, Scientific and Cultural Organization. Urban Ex. Available online: https://bit.ly/31mF6A2 (accessed on 17 January 2020).
  43. Martínez, J.M.S. Aglomeraciones y áreas urbanas en España, dimensión y tendencias: Breves precisiones. Lurralde Investig. Esp. 2006, 29, 115–142. [Google Scholar]
  44. World Health Organization. Public Health, Environmental and Social Determinants of Health (PHE). 2016. Available online: https://bit.ly/2KbzVgR (accessed on 23 January 2019).
  45. Stern, D.I.; Cleveland, C.J. Economic growth and energy. Enc. Energ. 2004, 2, 35–51. [Google Scholar]
  46. Liotta, P.H.; Miskel, J. The Real Population Bomb: Megacities, Global Security & the Map of the Future; Potomac Books: Sterling, VA, USA, 2012; pp. 1–20. [Google Scholar]
  47. Jiménez Romera, C. Tamaño y Densidad Urbana: Análisis de Ocupación de Suelo por las Areas Urbanas Españolas; Escuela Técnica Superior de Arquitectura de Madrid, Universidad Politécnica de Madrid: Madrid, Spain, 2015. [Google Scholar]
  48. Sofronijević, A.; Milićević, V.; Ilić, B. Smart City as Framework for Creating Competitive Advantages in International Business Management. Manag. J. Sustain. Bus. Manag. Solut. Emerg. Econ. 2014, 19, 5–15. [Google Scholar] [CrossRef]
  49. Haarsad, H. Constructing the sustainable city: Examining the role of sustainability in the smart city discourse. J. Environ. Pol. Plan. 2017, 19, 423–430. [Google Scholar] [CrossRef]
  50. Banister, D.; Lichfield, N. The Key Issues in Transport and Urban Development. In Transport and Urban Development; Banister, D., Lichfield, N., Eds.; Taylor & Francis: Abingdon, UK, 2003; pp. 1–16. [Google Scholar]
  51. European Parliament. Directorate-General for Internal Policies, Mapping Smart cities in the UE; European Union: Bruselss, Belgium, 2014. [Google Scholar] [CrossRef]
  52. Anthopoulus, L. Defining smart city arquitecture for sustainability. In Proceedings of the 14th Electronic Government and 7th Electronic Participation Conference, Thessaloniki, Greece, 30 August–3 September 2015; pp. 140–147. [Google Scholar]
  53. Brauneis, R.; Goodman, E.P. Algorithmic transparency for the smart city. Yale J. Law Tech. 2018, 20, 103–176. [Google Scholar] [CrossRef] [Green Version]
  54. Chui, K.T.; Lytras, M.D.; Visvizi, A. Energy Sustainability in Smart Cities: Artificial Intelligence, smart monitoring and optimization of energy consumption. Energies 2018, 11, 2869. [Google Scholar] [CrossRef] [Green Version]
  55. Fietkiewicz, K.J.; Stock, W.G. How “Smart” Are Japanese Cities? An Empirical Investigation of Infrastructures and Governmental Programs in Tokyo, Yokohama, Osaka, and Kyoto. In Proceedings of the 48th Hawaii International Conference on System Sciences, Kauai, HI, USA, 5–8 January 2015; pp. 2345–2354. [Google Scholar]
  56. Willems, J.; Van den Bergh, J.; Viaene, S. Smart City Projects and Citizen Participation: The Case of London. In Public Sector Management in a Globalized World. NPO-Management; Andeßner, R., Greiling, D., Vogel, R., Eds.; Springer Gabler: Wiesbaden, Germany, 2017; pp. 249–266. [Google Scholar] [CrossRef]
  57. Hall, R.E.; Bowerman, B.; Braverman, J.; Taylor, J.; Todosow, H.; Von Wimmersperg, U. The Vision of A Smart City; Brookhaven National Laboratory: Upton, NY, USA, 2000; pp. 1–7.
  58. Spil, T.A.M.; Effing, R.; Kwast, J. Smart City Participation: Dream or Reality? A Comparison of Participatory Strategies from Hamburg, Berlin & Enschede. In Digital Nations–Smart Cities, Innovation, and Sustainability: Proceedings of the 16th IFIP WG 6.11 Conference on e-Business, e-Services, and e-Society, I3E 2017, Delhi, India, 21–3 November 2017; Springer: Cham, Switzerland, 2017; pp. 122–134. [Google Scholar] [CrossRef] [Green Version]
  59. Gohari, S.; Ahlers, D.F.; Nielsen, B.; Junker, E. The Governance Approach of Smart City Initiatives. Evidence from Trondheim, Bergen, and Bodø. Infrastructures 2020, 5, 31. [Google Scholar] [CrossRef] [Green Version]
  60. Berrone, P.; Ricart, J.E.; Carrasco, C. IESE Cities in Motion Index. 2019. Available online: https://citiesinmotion.iese.edu/indicecim/ (accessed on 25 March 2020).
  61. Fernández-Pérez, V.; Lloréns-Montes, F.J.; García-Morales, V.J. Towards strategic flexibility: Social networks, climate and uncertainty. Ind. Manag. Data Syst. 2014, 114, 858–871. [Google Scholar] [CrossRef]
  62. Cohen, B. The Smart Cities in the World: Methodology. Available online: https://www.fastcompany.com/3038818/the-smartestcities-in-the-world-2015-methodology (accessed on 12 July 2020).
  63. INE. Cifras Oficiales de Población de los Municipios Españoles: Revisión del Padrón Municipal. 2020. Available online: https://www.ine.es/dynt3/inebase/es/index.html?padre=517&dh=1 (accessed on 1 August 2020).
  64. Instituto de Cartografia y Estadistica de Andalucia. Andalucía Pueblo a Pueblo—Fichas mMunicipales de Granada y Málaga. Available online: http://www.juntadeandalucia.es/institutodeestadisticaycartografia/sima/ficha.htm?mun=18087 (accessed on 27 March 2020).
  65. Eurostat. European Statist Database. 2018. Available online: https://ec.europa.eu/eurostat/data/database (accessed on 26 March 2020).
  66. Datos Abiertos del Gobierno de España. Available online: https://datos.gob.es/es (accessed on 28 March 2020).
  67. Ayuntamiento de Granada. Datos de Interés. Available online: https://www.granada.org/ (accessed on 30 March 2020).
  68. Ayuntamiento de Malaga. Datos de Interés. Available online: http://www.malaga.eu/ (accessed on 30 March 2020).
  69. Ayuntamiento de Santander. Santander Ciudad. Available online: https://santander.es/ (accessed on 30 March 2020).
  70. Ayuntamiento de Valencia. Portal de Transparencia y Datos Abiertos. Available online: http://gobiernoabierto.valencia.es/va/ (accessed on 30 March 2020).
  71. Ayuntamiento de Madrid. Portal Web del Ayuntamiento de Madrid. Available online: https://www.madrid.es/portal/site/munimadrid (accessed on 1 April 2020).
  72. Ayuntamiento de Barcelona. Available online: https://ajuntament.barcelona.cat/es/ (accessed on 1 April 2020).
  73. Galvez, C.; Del Campo, A. Movilidad Sostenible en Andalucía. Prácticas y Discursos en el Uso de la Bicicleta. Etnografía en Granada. Available online: https://bit.ly/3dy8sk8 (accessed on 2 April 2020).
  74. Fernández Gutierrez, F. El Area Metropolitana de Granada Según sus Habitantes; Editorial Universidad de Almería: Almería, Spain, 2001; pp. 1–230. [Google Scholar]
  75. Cariñanos, P.; Casares-Porcel, M.; de la Guardia, C.D.; Aira, M.J.; Boi, M.; Cardador, C.; de la Cruz, D.R. Salud Ambiental de los parques españoles: Aproximación al potencial alergénico de espacios verdes urbanos. Rev. Salud Amb. 2016, 16, 33–42. [Google Scholar]
  76. Junta de Andalucía. Residuos Urbanos y Asimilables. Available online: https://bit.ly/35YiwRb (accessed on 6 April 2020).
  77. Cook, D.J.; Duncan, G.; Sprint, G.; Fritz, R. Using Smart City Technology to make healthcare Smarter. Proc. IEEE Inst. Electr. Electron. Eng. 2018, 106, 708–722. [Google Scholar] [CrossRef] [PubMed]
  78. Rodriguez, A.; Alaminos, F. Informe OIA 2019. Pobreza y Desigualdad. Granada 2019. Available online: https://www.observatoriodelainfancia.es/ficherosoia/documentos/5906_d_4_POBREZA_EIA2019.pdf (accessed on 10 April 2020).
  79. Junta de Andalucía. Andalucía pueblo a pueblo—Fichas Municipales Granada. 2019. Available online: https://bit.ly/2vDbj8y (accessed on 11 April 2020).
  80. Neill, D.B. Using artificial intelligence to improve hospital inpatient care. IEEE Intell. Syst. 2013, 28, 92–95. [Google Scholar] [CrossRef]
  81. Zavala-Alcívar, A.; Verdecho, M.J.; Alfaro-Saíz, J.J. A Conceptual Framework to Manage Resilience and Increase Sustainability in the Supply Chain. Sustainability 2020, 12, 6300. [Google Scholar] [CrossRef]
  82. Kottika, E.; Özsomer, A.; Ryden, P.; Theodorakis, I.G.; Kaminakis, K.; Kottikas, K.G.; Stathakopoulos, V. We survived this! What managers could learn from SMEs who successfully navigated the Greek economic crisis. Ind. Mark. Manag. 2020, 88, 352–365. [Google Scholar] [CrossRef]
  83. Neumeyer, X.; Santos, S.C. Sustainable business models, venture typologies, and entrepreneurial ecosystems: A social network perspective. J. Clean. Prod. 2018, 172, 4565–4579. [Google Scholar] [CrossRef]
  84. Nash, K.L.; Blythe, J.L.; Cvitanovic, C.; Peci, G.T.; Watson, R.A.; Blanchard, J.L. To achieve a sustainable blue future, progress assessments must include interdependencies between the sustainable development goals. One Earth 2020, 2, 161–173. [Google Scholar] [CrossRef] [Green Version]
  85. Chakravarthy, B.S. Adaptation: A promising metaphor for strategic management. Acad. Manag. Rev. 1982, 7, 35–44. [Google Scholar] [CrossRef]
  86. Nonaka, I.; Takeuchi, H. The Knowledge Creating Company; Oxford University Press: Oxford, UK, 1995; pp. 1–285. [Google Scholar]
  87. Mention, A.L. Co-operation and co-opetition as open innovation practices in the service sector: Which influence on innovation novelty? Technovation 2011, 31, 44–53. [Google Scholar] [CrossRef]
  88. Clavellina, J.L.; Domínguez, M.I. Implicaciones económicas de la pandemia por COVID-19 y opciones de política. Dirección Gen. Finanz. 2020, 81, 1–11. [Google Scholar]
  89. Naciones Unidas. Ministerio de Asuntos Exteriores, Unión Europea y Cooperación. 2020. Available online: http://www.exteriores.gob.es/Portal/es/PoliticaExteriorCooperacion/NacionesUnidas/Paginas/ObjetivosDeDesarrolloDelMilenio.aspx (accessed on 13 July 2020).
  90. Malakorn, K.J.; Park, B. Assessment of mobility, energy, and environment impacts of IntelliDrive-based Cooperative Adaptive Cruise Control and Intelligent Traffic Signal control. In Proceedings of the 2010 IEEE Symposium on International Symposium on Sustainable Systems and Technology (ISSST), Arlington, VA, USA, 17–19 May 2010; pp. 1–6. [Google Scholar] [CrossRef]
  91. Perboli, G.; De Marco, A.; Perfetti, F.; Marone, M. A new taxonomy of smart city projects. Transport. Res. Procedia 2014, 3, 470–478. [Google Scholar] [CrossRef] [Green Version]
  92. Khan, S.; Paul, D.; Momtahan, P.; Aloqaily, M. Artificial intelligence framework for smart city microgrids: State of the art, challenges, and opportunities. In Proceedings of the Third International Conference on Fog and Mobile Edge Computing (FMEC), Barcelona, Spain, 23–26 April 2018; pp. 283–288. [Google Scholar] [CrossRef]
Figure 1. Evolution of World Urban Population 1960–2015. Source: developed from data collected by the World Bank [39].
Sustainability 12 07860 g001
Figure 2. Global comparison of the evolution of pollution PM 2.5. Source: the authors.
Sustainability 12 07860 g002
Figure 3. Levels of suspended particles in Helsinki and Gwalior. Source: the authors, based on data collected by the World Bank [39] and the World Health Organization [40].
Sustainability 12 07860 g003
Figure 4. Evolution of world energy use (1990–2015). Source: developed by the authors from data collected by the World Bank [39].
Sustainability 12 07860 g004
Figure 5. Ranking of four main Spanish Smart Cities. Source: IESE City in Motion [60].
Sustainability 12 07860 g005
Figure 6. Dimensions of a Smart City. Source: developed by the authors based on the European Parliament [51].
Sustainability 12 07860 g006
Figure 7. Structure of the methodology. Source: developed by the authors.
Sustainability 12 07860 g007
Figure 8. Data warehouse development. Source: the authors.
Sustainability 12 07860 g008
Figure 9. Total score for Smart indicators. Source: the authors.
Sustainability 12 07860 g009
Figure 10. General Dashboard of the cities analyzed. Source: the authors.
Sustainability 12 07860 g010
Figure 11. Scores of each city by level. Source: developed by the authors.
Sustainability 12 07860 g011
Figure 12. Differences between Madrid and Granada. Source: the authors.
Sustainability 12 07860 g012
Table 1. Maximums established for the main urban pollutants.
Main Sources of PollutionValues Established in Directives
Average Value AcceptedReal Value Produced
Particulate matter (PM)PM 2.5: 10 µg/m3 annual average
PM 10: 20 µg/m3 annual average
PM 2.5: 25 µg/m3 average in 24 h
PM 10: 50 µg/m3 average in 24 h
Nitrogen Dioxide (NO2)40 µg/m3 annual average200 µg/m3 average in 1 h
Sulphur Dioxide (SO2)20 µg/m3 average in 24 h500 µg/m3 average in 10 min
Source: developed by the authors from data collected by the WHO [44].
Table 2. Indicators of Smart Cities.
ID_INDICATORDESC_INDICATOR
1No. of reusable open databases
2Number of ambulances per 1000 inhabitants
3Number of firefighters per 1000 inhabitants
4Average response time to an emergency
5Number of police officers per 1000 inhabitants
6Communication by social networks
7Citizen-government channels
8Procedures carried out online per total procedures
9Polls
10Number of kilometers of bicycle paths
11Number of electric vehicle charging stations
12Number of traffic accidents per 1000 inhabitants
13% of trips by public transport
14Density of the public transport network (m/km2)
15Number of active buses 100,000
16Number of metro stations per 100,000
17% of clean energy use over total energy use
18Approximate consumption of electrical energy (kWh)
19Approximate number of smart meters
20Average daily NO2 concentration (µg/m3)
21Number of trees in urban spaces
22M2 of green spaces, excluding rural spaces
23Per capita CO2 emissions
24Total water consumption per inhabitant (liters/day)
25Total volume of waste generated by the city in kg per person per year
26Percentage of solid waste recycled
27Unemployment rate
28GDP per capita (thousands of euros)
29Number of new patents per year per 100,000 inhabitants
30Number of airports
31Percentage of foreign population
32Number of 4- and 5-star hotel rooms
33Number of tourists visiting the city
34Number of international events (conferences and fairs) per year
35Public services for people with reduced mobility (ramps, elevators, escalators, etc.)
36Auditory communication in public services (acoustic alarms)
37% of employed people with disabilities
38Number of hospitals
39Life expectancy at birth (years)
40Number of births per year
41Percentage of population living in poverty
42Number of homeless people per 1000 inhabitants
Source: developed by the authors, based on Cohen [62].
Table 3. Dimensions of Smart Cities.
ID_GLOBALDESC_GLOBAL
1Governance
2Mobility
3Environment
4Economy
5Quality of Life
Source: the authors.
Table 4. Factors of Smart Cities.
ID_FACTORSDESC_FACTORS
1Open data
2Emergency Citizen Attention
3e-Government
4Institutionality
5Efficiency
6Security
7Public Transport
8Energy
9Air Quality
10Urban Spaces
11Carbon Dioxide Levels
12Water Consumption
13Spillage and Waste
14Employment
15Productivity
16Internationalization
17Universal Accessibility
18Healthcare
19Social Cohesion
Source: the authors.
Table 5. Integrated dashboard for a Smart City.
ItemFactorIndicator
GovernanceOpen DataNo. of reusable open databases
Emergency
Citizen
Attention
Number of ambulances per 1000 inhabitants
Number of firefighters per 1000 inhabitants
Average response time to an emergency
Number of police officers per 1000 inhabitants
E-GovernmentCommunication by social networks
Citizen-government channels
Procedures carried out online/total procedures
InstitutionalityPolls
MobilityEfficiencyNumber of kilometers of bicycle paths
Number of electric vehicle charging stations
SecurityNumber of traffic accidents per 1000 inhabitants
Public Transport% of trips by public transport
Density of public transport network (m/km2)
Number of active buses 100,000
Number of metro stations per 100,000
EnvironmentEnergy% of clean energy use/total energy use
Approximate consumption of electrical energy (kWh)
Approximate number of smart meters
Air QualityAverage daily NO2 concentration (µg/m3)
Urban spacesNumber of trees in urban spaces
M2 of green spaces, excluding rural spaces.
Carbon Dioxide LevelsPer capita CO2 emissions.
Water ConsumptionTotal water consumption per inhabitant (liters/day)
Spillage and WasteTotal volume of waste generated by the city in kg per person per year
Percentage of solid waste recycled
EconomyEmploymentUnemployment rate
ProductivityGDP per capita (thousands of euros)
Number of new patents per year per 100,000 inhabitants
InternationalizationNumber of airports
Percentage of foreign population
Number of 4- and 5-star hotel rooms
Number of tourists visiting the city
Number of international events (conferences and fairs) per year
Quality of lifeUniversal
Accessibility
Public services for people with reduced mobility (ramps, elevators, escalators etc.).
Auditory communication in public services (acoustic alarms)
% of people with disabilities with work
HealthcareNumber of hospitals
Life expectancy at birth (years)
Number of births per year
Social CohesionPercentage of population living in poverty
Number of homeless people per 1000 inhabitants
Source: Developed by the authors, based on Cohen [62].
Table 6. Assessment of insufficiency in Smart factors.
ItemFactorSmart Cities
GranadaMadridBarcelonaMalagaValenciaSantander
GovernanceOpen DataX X
Emergency
Citizen
Attention
XXXXXX
E-GovernmentX X
Institutionality
MobilityEfficiencyXXX
Security X
Public TransportX XXXX
EnvironmentEnergy X X
Air Quality
Urban spacesX XX
Carbon Dioxide Levels XX X
Water ConsumptionX X
Spillage and WasteX X
EconomyEmploymentX XX
Productivity X X
InternationalizationX XXX
Quality of lifeUniversal
Accessibility
X
HealthcareX X X
Social CohesionX XX
Source: developed by the authors.
Table 7. Strategic measures to transform Granada into a Smart City according to the Integrated Dashboard.
DESC_GLOBALDESC_FACTORSDESC_INDICATOR
GovernanceEmergency citizen attentionNumber of ambulances per 1000 inhabitantsRQ1
GovernanceEmergency citizen attentionNumber of firefighters per 1000 inhabitantsRQ1
GovernanceE-governmentProcedures carried out online/total proceduresRQ1
GovernanceOpen dataNo. of reusable open databasesRQ1
GovernanceE-governmentCitizen-government channelsRQ1
MobilityEfficiencyNumber of electric vehicle charging stationsRQ2
MobilityEfficiencyNumber of kilometers of bicycle pathsRQ2
MobilityPublic TransportNumber of active buses (100,000 hab)RQ2
MobilityPublic TransportDensity of the public transport network (m/km2)RQ2
MobilityPublic TransportNumber of metro stations per 100,000RQ2
EnvironmentAir qualityNumber of trees in urban spacesRQ3
EnvironmentAir qualityM2 of green spaces, excluding rural spaces.RQ3
EnvironmentWastePercentage of solid waste recycledRQ3
EconomyInternationalizationPercentage of foreign populationRQ4
EconomyInternationalization Number of 4-and 5-star hotel roomsRQ4
EconomyEmploymentUnemployment rateRQ4
Quality of lifeUniversal accessibility% of employed people with disabilities RQ5
Quality of lifeUniversal accessibilityAuditory communication in public services (acoustic alarms)RQ5
Quality of lifeSocial CohesionPercentage of population living in povertyRQ5
Quality of lifeSocial CohesionNumber of homeless people per 1000 inhabitantsRQ5
Quality of lifeHealthcareLife expectancy at birth (years)RQ5
Quality of lifeHealthcareNumber of hospitalsRQ5
Quality of lifeHealthcareNumber of doctor (1000 hab)RQ5
RQ = Research Question. Source: Developed by the authors based on Cohen [62].

