Is the Time-Domain Reflectometry (TDR) Technique Suitable for Moisture Content Measurement in Low-Porosity Building Materials?

 ,
, 

Abstract
1. Introduction
2. Time Domain Reflectometry (TDR)
2.1. Basic Principles
2.2. Individual Probe Calibration
2.3. Suitability to Detect Moisture Content Variations
2.4. Approaches to Determine the Moisture Content from the Measured Apparent Relative Permittivity
- Empirical conversion functions developed for soil moisture measurements. The most common and popular conversion function is the third order polynomial relation proposed by Topp et al. in 1980, which is expressed by the following equation:
- Empirical conversion functions based on dielectric mixing models. The use of dielectric mixing models involves knowing the relative permittivities of the particular constituents that compose the materials, which are typically the solid phase, the liquid phase (water), and the gaseous phase (air), as well as some other parameters that cannot be measured directly but have to be determined by empirical calibration of the model. There is a variety of mixing formulas available to describe the relative permittivity of the whole material from its constituents. In Equation (7) the 4-phase -model proposed by Dobson et al. is presented as an example.
- Empirical calibration for the particular material under study using a reference method, such as the gravimetric method. In this case, the relation between the moisture content and the measured apparent relative permittivity is established for the precise material under test. This method is the most reliable until now but also the most time consuming one [3].
2.5. TDR Advantages and Disadvantages for Moisture Monitoring in Building Materials
3. TDR Application
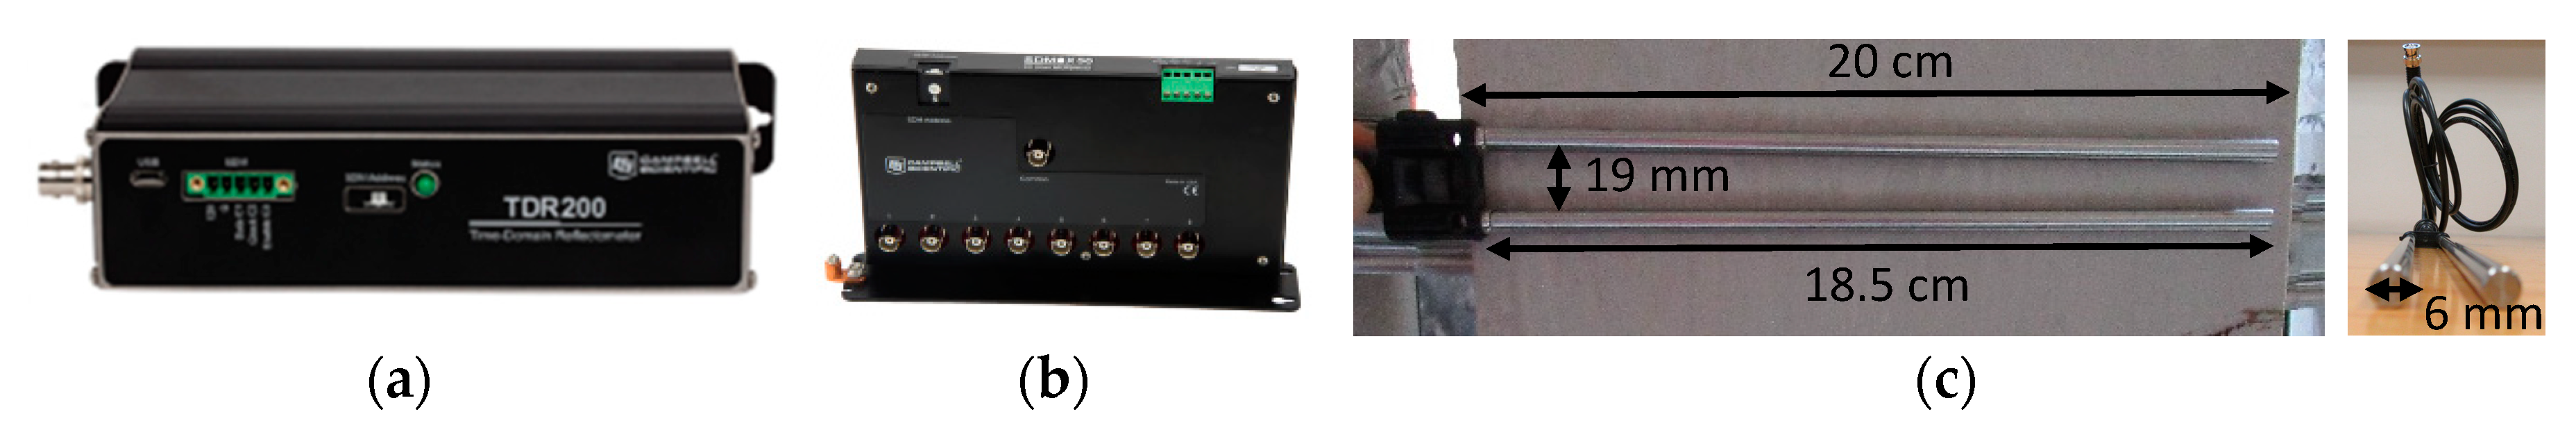
3.1. Equipment
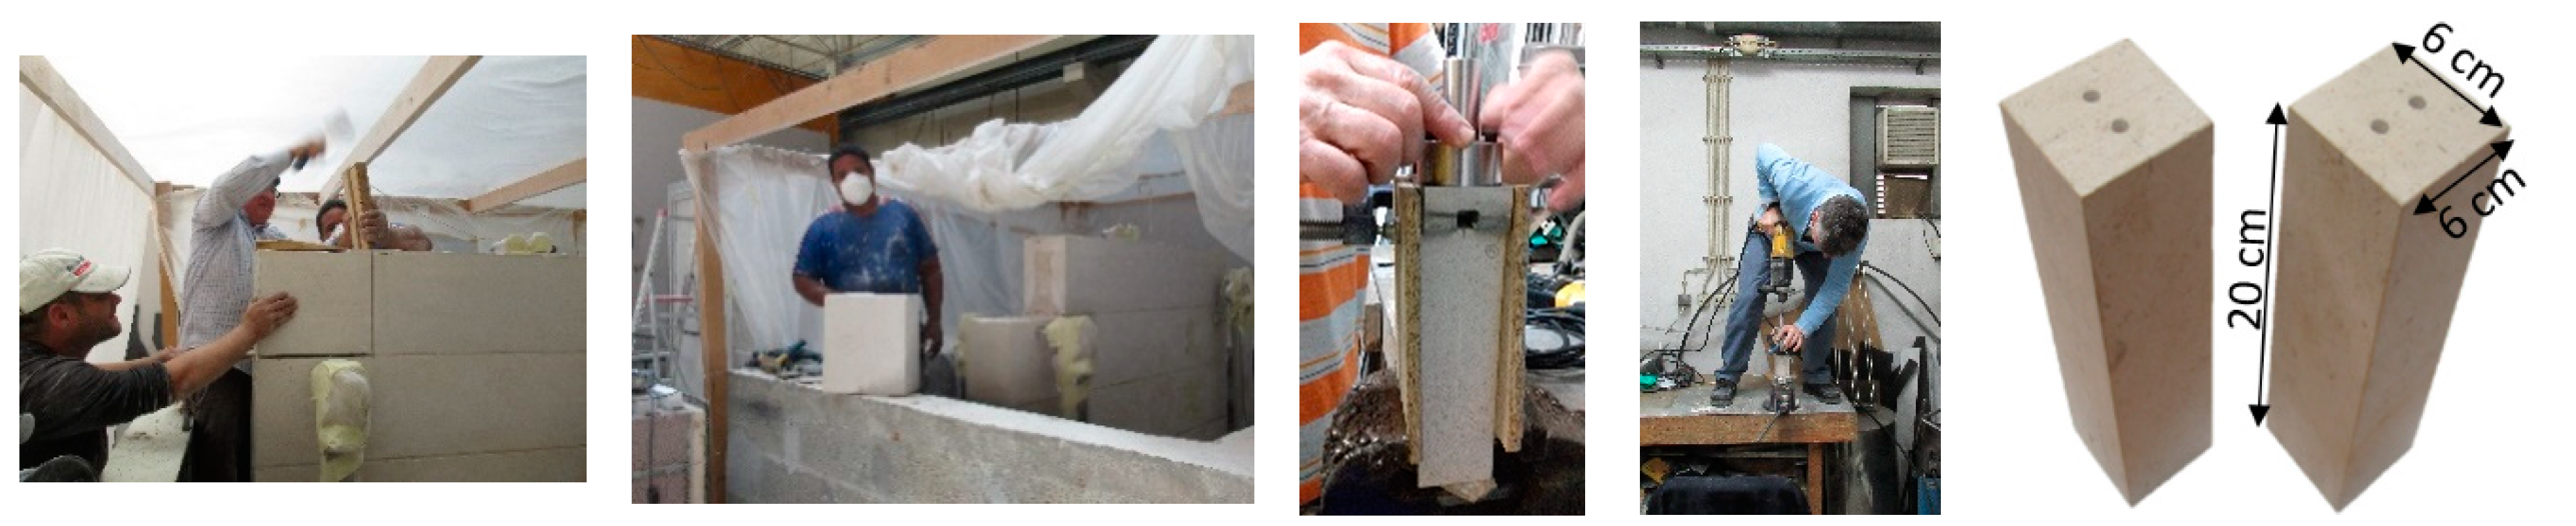
3.2. Installation Steps
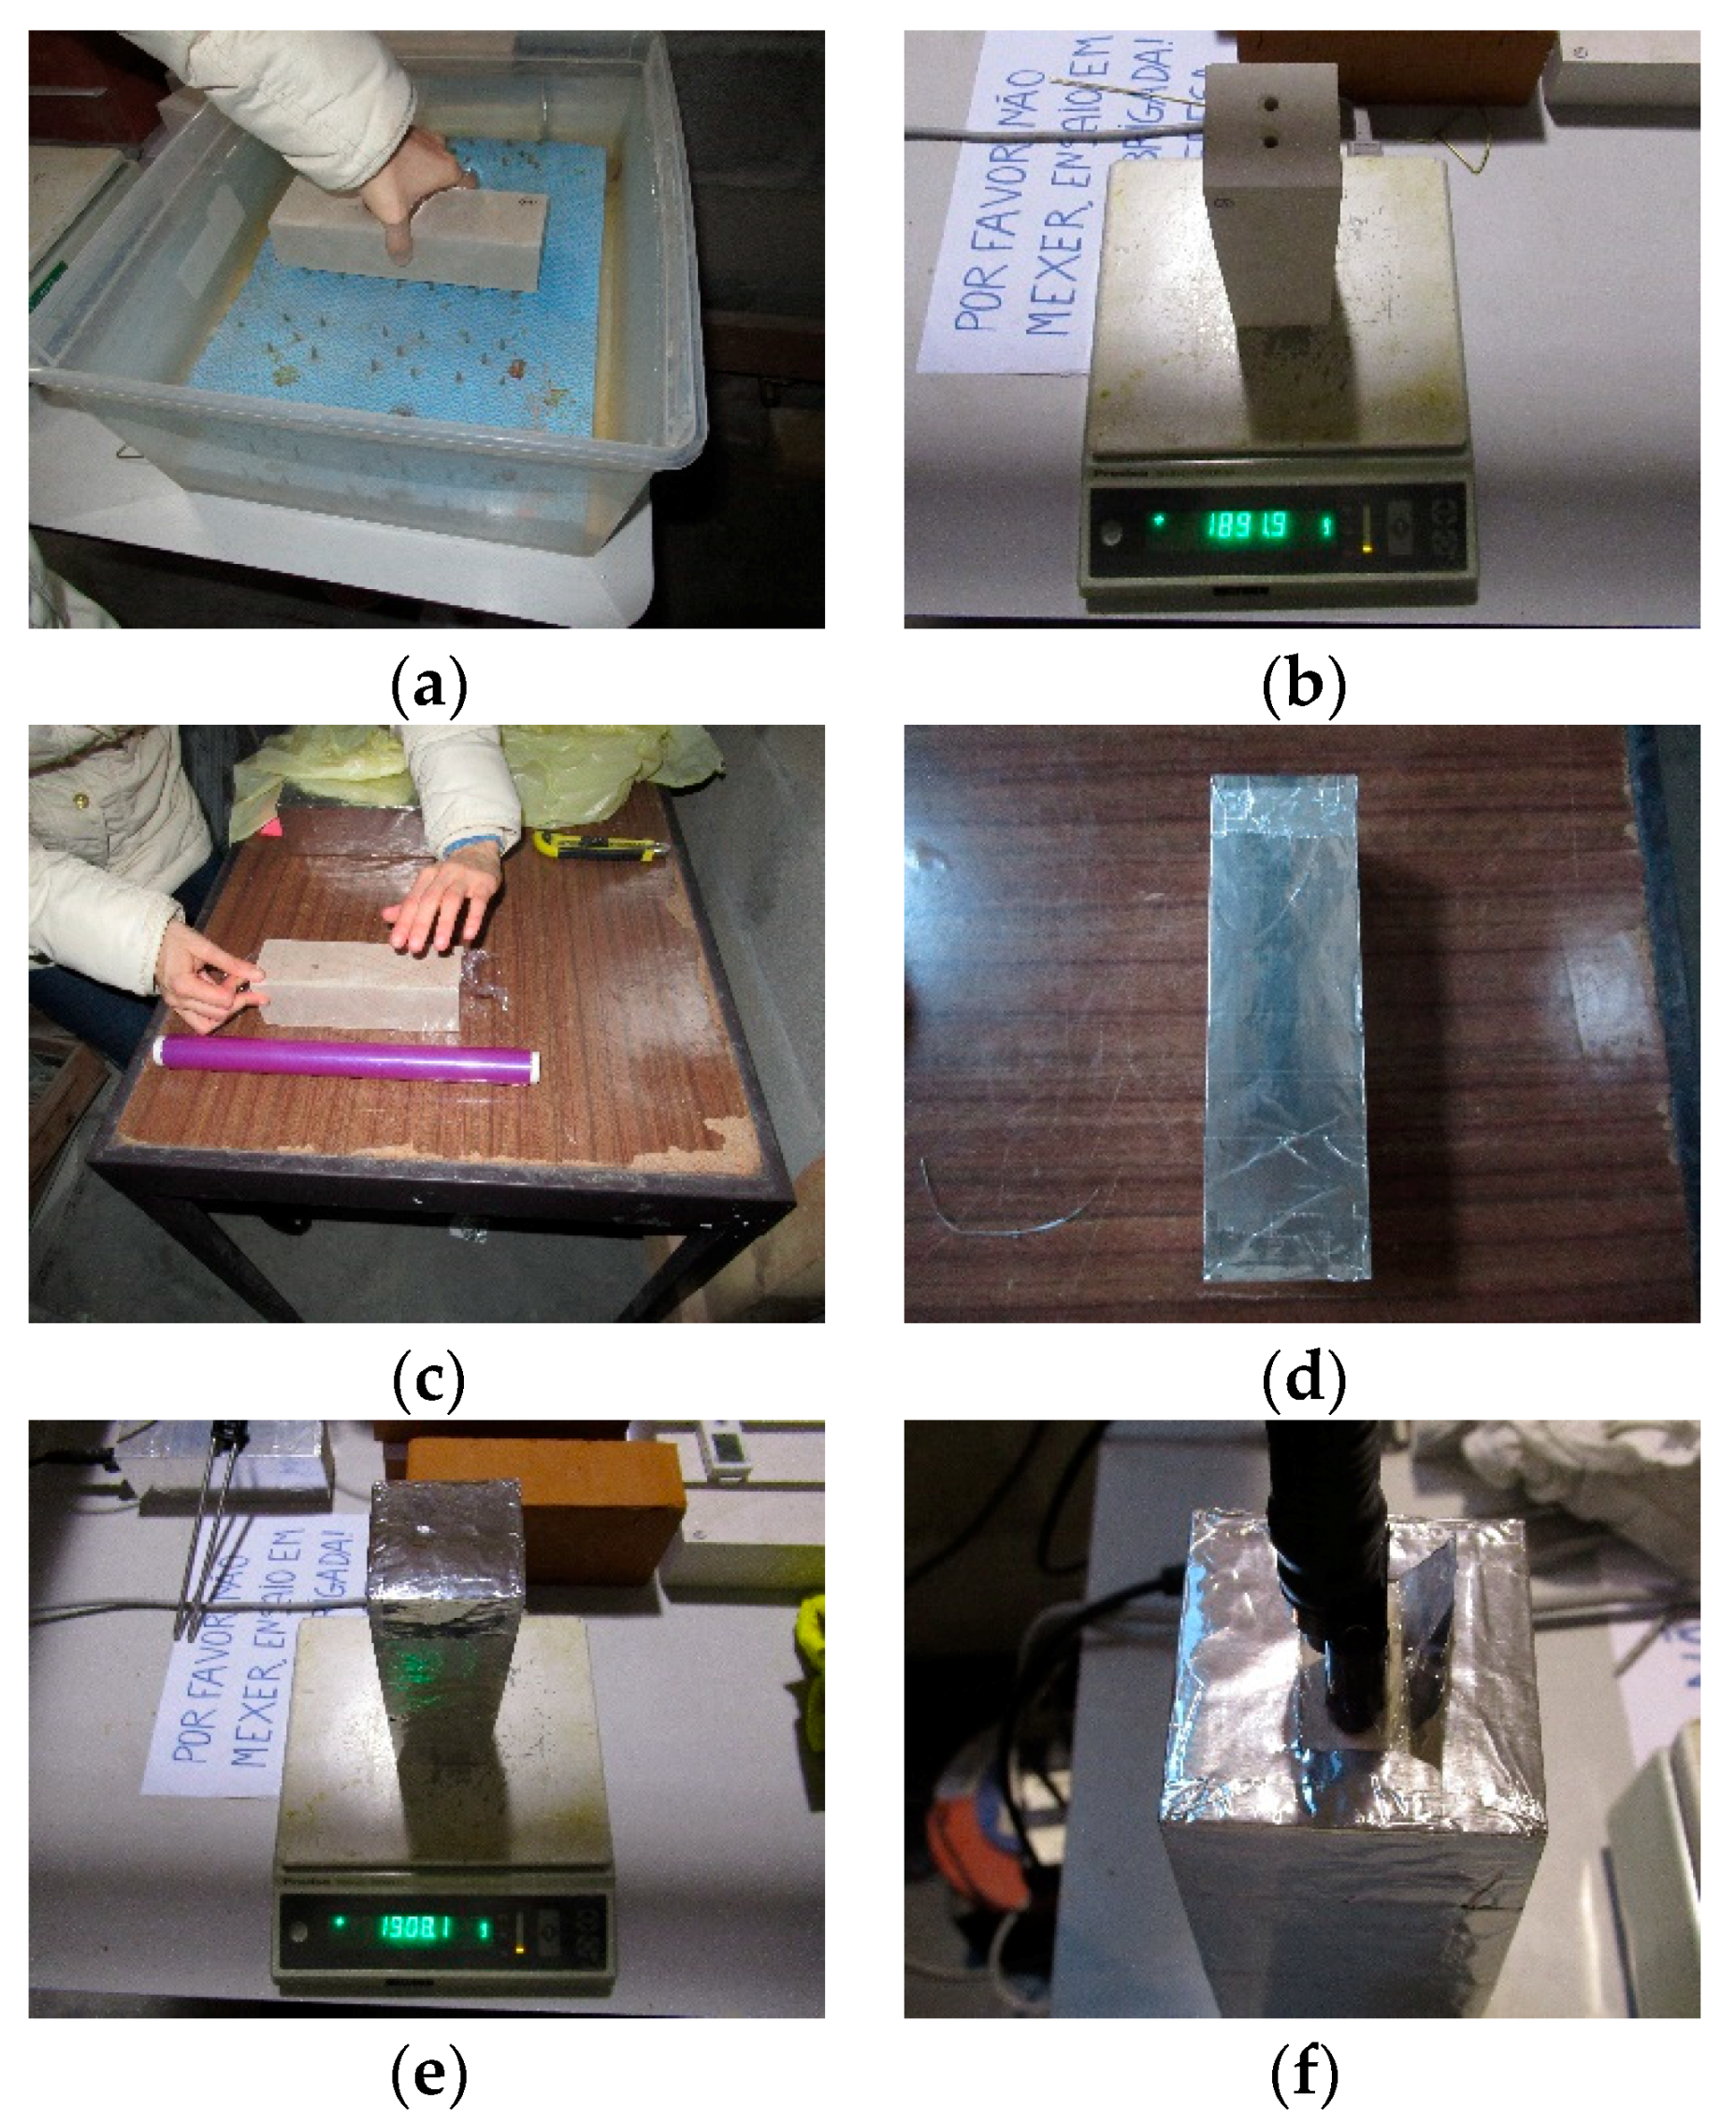
3.3. Calibration
4. Results and Discussion
5. Conclusions
- The steel auxiliary guide developed allows drilling parallel and appropriate holes to accommodate the probes. As a result, no air gap was present next to the rods and the installation was considered a success (Table 3);
- The procedure proposed, through the gravimetric method, to establish a relation between the relative permittivity and the moisture content seems appropriate to obtain valid calibration curves for construction materials (Figure 12);
- The technique is sensitive to detect moisture content variations in limestone (despite their low porosity) and even small moisture content variations (Figure 13).
Author Contributions
Funding
Conflicts of Interest
References
- Phillipson, M.; Baker, P.; McNaughtan, A.; Galbraith, G.; McLean, R.; Davies, M.; Ye, Z. Moisture measurement in building materials: An overview of current methods and new approaches. Build. Serv. Eng. Res. Technol. 2007, 28, 303–316. [Google Scholar] [CrossRef]
- Said, M.N.A. Measurement Methods of Moisture in Building Envelopes—A Literature Review. Int. J. Arch. Heritage 2007, 1, 293–310. [Google Scholar] [CrossRef][Green Version]
- Černý, R. Time-domain reflectometry method and its application for measuring moisture content in porous materials: A review. Measurement 2009, 42, 329–336. [Google Scholar] [CrossRef]
- Cataldo, A.; De Benedetto, E.; Cannazza, G. Advances in Reflectometric Sensing for Industrial Applications. Synth. Lect. Emerg. Eng. Technol. 2016, 2, 1–96. [Google Scholar] [CrossRef]
- Malmberg, C.; Maryott, A. Dielectric constant of water from 0 to 100 C. J. Res. Natl. Inst. Stand. Technol. 1956, 56, 1. [Google Scholar] [CrossRef]
- Wraith, J.M.; Or, D. Temperature effects on soil bulk dielectric permittivity measured by time domain reflectometry: Experimental evidence and hypothesis development. Water Resour. Res. 1999, 35, 361–369. [Google Scholar] [CrossRef]
- De Sousa, F.F.; Da Silva, L.D.P.; Freitas, K.H.G. Electrical and dielectric properties of water. Sci. Plena 2017, 13, 13. [Google Scholar] [CrossRef]
- Rusiniak, L. Electric properties of water. New experimental data in the 5HZ-13MHZ frequency range. Acta Geophys. Pol. 2004, 52, 63–76. [Google Scholar]
- Instruction Manual–TDR Probes CS605, CD610, CS630, CS635, CS640, CS645 (Revision:9/13). Available online: https://s.campbellsci.com/documents/ca/manuals/tdr-probes-manual.pdf (accessed on 24 January 2019).
- Suchorab, Z.; Sobczuk, H.; Cerny, R.; Pavlik, Z.; Miguel, R.S. Sensitivity range determination of surface TDR probes. Environ. Prot. Eng. 2009, 35, 179–189. [Google Scholar]
- Pavlík, Z.; Mihulka, J.; Fiala, L.; Černý, R. Application of Time-Domain Reflectometry for Measurement of Moisture Profiles in a Drying Experiment. Int. J. Thermophys. 2011, 33, 1661–1673. [Google Scholar] [CrossRef]
- Hubbard, S.S.; Peterson, J.E.; Majer, E.L.; Zawislanski, P.T.; Williams, K.H.; Roberts, J.; Wobber, F. Estimation of permeable pathways and water content using tomographic radar data. Lead. Edge 1997, 16, 1623–1630. [Google Scholar] [CrossRef]
- Martinez, A.; Bymes, A.P. Modelling Dielectric-Constant Values of Geologic Materials: An Aid to Ground-Penetrating Radar Data Collection and Interpretation. Available online: http://www.kgs.ku.edu/Current/2001/martinez/martinez.pdf (accessed on 24 January 2019).
- Pavlik, Z.; Fiala, L.; Černý, R. Determination of Moisture Content of Hygroscopic Building Materials Using Time Domain Reflectometry. J. Appl. Sci. 2008, 8, 1732–1737. [Google Scholar] [CrossRef]
- Pavlík, Z.; Fiala, L.; Černý, R. Analysis of dielectric mixing models for the moisture assessment of porous building materials. Pollack Period. 2009, 4, 79–88. [Google Scholar] [CrossRef]
- Suchorab, Z. Laboratory measurements of moisture in a model red-brick wall using the surface TDR probe. Proc. Ecopole 2013, 7, 171–176. [Google Scholar]
- Agliata, R.; Mollo, L.; Greco, R. Use of TDR to Compare Rising Damp in Three Tuff Walls Made with Different Mortars. J. Mater. Civ. Eng. 2017, 29, 04016262. [Google Scholar] [CrossRef]
- Phillipson, M.; Baker, P.; Davies, M.; Ye, Z.; Galbraith, G.; McLean, R. Suitability of time domain reflectometry for monitoring moisture in building materials. Build. Serv. Eng. Res. Technol. 2008, 29, 261–272. [Google Scholar] [CrossRef]
- Pinchin, S.E. Techniques for monitoring moisture in walls. Stud. Conserv. 2008, 53, 33–45. [Google Scholar] [CrossRef]
- Pavlík, Z.; Jiřičková, M.; Černý, R.; Sobczuk, H.; Suchorab, Z. Determination of Moisture Diffusivity using the Time Domain Reflectometry (TDR) Method. J. Build. Phys. 2006, 30, 59–70. [Google Scholar] [CrossRef]
- Cataldo, A.; De Benedetto, E.; Cannazza, G.; Piuzzi, E.; Pittella, E. Moisture content monitoring of construction materials: From in-line production through on-site applications. In Proceedings of the 2017 IEEE International Instrumentation and Measurement Technology Conference (I2MTC), Turin, Italy, 22–25 May 2017; pp. 1–5. [Google Scholar] [CrossRef]
- Torres, M.I.M.; De Freitas, V. Treatment of rising damp in historical buildings: Wall base ventilation. Build. Environ. 2007, 42, 424–435. [Google Scholar] [CrossRef]
- Azevedo, A.; Delgado, J.; De Freitas, V. Rising damp in building walls: The wall base ventilation system. Heat Mass Transf. 2012, 48, 2079–2085. [Google Scholar] [CrossRef]
- Instruction Manual-TDR200 (Revision 4/17). Available online: https://s.campbellsci.com/documents/ca/manuals/tdr200_man.pdf (accessed on 5 March 2020).


| Measurements in Air * | Measurements in Distilled Water | ||
|---|---|---|---|
| Probe 1 | Probe 1 | ||
| Measurement number | Measurement number | ||
| 1 | 0.227162 | 1 | 1.792867 |
| 2 | 0.205178 | 2 | 1.753786 |
| 3 | 0.210063 | 3 | 1.773327 |
| 4 | 0.207621 | 4 | 1.775770 |
| 5 | 0.210063 | 5 | 1.775769 |
| 6 | 0.207621 | 6 | 1.770884 |
| 7 | 0.227161 | 7 | 1.775769 |
| 8 | 0.205178 | 8 | 1.770884 |
| 9 | 0.207621 | 9 | 1.792867 |
| 10 | 0.205178 | 10 | 1.770884 |
| Average: | 0.211285 | Average: | 1.775281 |
| Material | Relative Permittivity |
|---|---|
| Sand (dry) | 3–6 |
| Sand (saturated) | 20–30 |
| Clays (dry) | 2–6 |
| Clays (wet) | 15–40 |
| Humid soil | 30 |
| Rocky soil | 7 |
| Sandy soil (dry) | 3 |
| Sandy soil (saturated) | 19 |
| Clayey soil (dry) | 2 |
| Clayey soil (saturated) | 15 |
| Sandstone (dry) | 2–3 |
| Sandstone (saturated) | 5–10 |
| Granite (dry) | 5 |
| Granite (saturated) | 7 |
| Limestone (dry) | 5–7 |
| Limestone (saturated) | 8 |
| Wall | Probe Number | Apparent Relative Permittivity, εapp |
|---|---|---|
| left | 1 | 6.2 |
| 2 | 6.0 | |
| 3 | 6.1 | |
| 4 | 6.0 | |
| right | 5 | 6.5 |
| 6 | 6.1 | |
| 7 | 6.3 | |
| 8 | 6.4 |
| Sample Mass (kg) | w (kg/m3) | εapp (-) | ||
|---|---|---|---|---|
| Dry in oven | 1.8917 | 0 | 6.8 | |
| Moist | 1.9023 | 14.46 | 7.4 | |
| Saturated | 1.9146 | 31.22 | 8.4 | |
© 2020 by the authors. Licensee MDPI, Basel, Switzerland. This article is an open access article distributed under the terms and conditions of the Creative Commons Attribution (CC BY) license (http://creativecommons.org/licenses/by/4.0/).
Share and Cite
Freitas, T.S.; Guimarães, A.S.; Roels, S.; Peixoto de Freitas, V.; Cataldo, A. Is the Time-Domain Reflectometry (TDR) Technique Suitable for Moisture Content Measurement in Low-Porosity Building Materials? Sustainability 2020, 12, 7855. https://doi.org/10.3390/su12197855
Freitas TS, Guimarães AS, Roels S, Peixoto de Freitas V, Cataldo A. Is the Time-Domain Reflectometry (TDR) Technique Suitable for Moisture Content Measurement in Low-Porosity Building Materials? Sustainability. 2020; 12(19):7855. https://doi.org/10.3390/su12197855
Chicago/Turabian StyleFreitas, Teresa Stingl, Ana Sofia Guimarães, Staf Roels, Vasco Peixoto de Freitas, and Andrea Cataldo. 2020. "Is the Time-Domain Reflectometry (TDR) Technique Suitable for Moisture Content Measurement in Low-Porosity Building Materials?" Sustainability 12, no. 19: 7855. https://doi.org/10.3390/su12197855
APA StyleFreitas, T. S., Guimarães, A. S., Roels, S., Peixoto de Freitas, V., & Cataldo, A. (2020). Is the Time-Domain Reflectometry (TDR) Technique Suitable for Moisture Content Measurement in Low-Porosity Building Materials? Sustainability, 12(19), 7855. https://doi.org/10.3390/su12197855