1. Introduction
In the face of increasing urbanization, urban management is becoming an important issue affecting many social and economic aspects. The increase in population flowing into cities has generated a cumulative demand in the real estate market, and consequently, there is a collective need for land for new investments. Developers are actively looking for new locations for their projects in previously undeveloped areas. The aim of clarifying the purpose of the development of agglomerations is not only to define the particular destination, but above all to create a space that is welcoming to the inhabitants, conducive to the stable development of the various areas of life and attractive to new economic partners on the international stage.
The dynamic development of a city affects the increase in numbers of the inhabitants of that city, and consequently fuels demand in the real estate market, causing an increase in prices. To reduce the apparent preponderance of demand over supply, the development of the Local Zoning Plan in areas in which this has not yet been drawn up, can help [
1,
2,
3,
4,
5].
Cadastre data are the basis for spatial planning, however, planning-related analyses often require 3D information on objects [
6,
7,
8]. This applies to structures consisting of multiple underground and ground-level blocks, often with different and extensive geometric forms, the presentation of which using the available 2D tools, can prove difficult.
In response to demand, the FIG Commission started work at the end of the 20th century on the concept of the 3D cadastre, which was encapsulated in the ISO 19152 Cadastral Land Administration Model. Although the standard contains the main guidelines for the implementation of the 3D cadastre in accordance with historical and economic conditions, no international directive has yet been established. From the point of view of the Polish cadastre, the provision of information relating to the third dimension of the database has many uses. The most important of these is the accurate representation of different numbers of objects on lower- and above-ground floors, especially when these structures are of an irregular shape. Another aspect is the determination of the legal status of the property located either above or below ground.
The multidimensionality of the cadastre is a huge challenge, both in terms of regulations and technical solutions. Many proposals in relation to methods of implementing the 3D cadastre exist. Among them are: geometric (strict determination of objects using x,y,z coordinates), mixed (complementing selected objects which exist in a 2D database with descriptive information relating to the third dimension) and indirect (combining 2D objects with references to 3D objects stored together with documents in a single database). The above methods concern the technical side of the creation of the 3D cadastre, however, the separate issue, that of the creation of the material scope of the base, should also be noted. This requires the specification of additional information, not included in the existing database, which is necessary to create the three-dimensional cadastre.
The creation of the multidimensional cadastre is the solution with countless advantages in the areas of real estate management and spatial planning. Despite its many advantages, it presents a huge technological and legal challenge, and undoubtedly requires considerable financial resources. In view of the current technology and the demand for the highest quality data, the creation of the 3D database, and in the future also 4D, seems an inevitable solution. In some countries, such databases already exist in relation to certain agglomerations, which confirms that this is a viable concept that could constitute the goal in the development of Polish cities in future years [
9,
10,
11,
12].
2. Materials and Methods
When analysing space in urban areas, an important aspect is not only the purpose of the site but also the way in which it is managed. It is important to examine the density and height of buildings. These factors play a strategic role when considering, for example, the creation of air tunnels in the city, ensuring adequate air circulation. Another important aspect is access to sunlight on individual floors of buildings, avoiding excessive shading by maximizing the use of daylight. The third important aspect of space management is the preservation of aesthetic values, green spaces, protection of the historical panorama of the city and local spatial order.
The proper management of urban space is reflected in the real estate market. Potential buyers of apartments treat the purchase of the new apartment as a long-term investment. The awareness of the inhabitants in terms of ecology and sustainability is also changing. After 3 years of operating the government programme, Housing for the Young, offering apartments with the lower than average unit price, buyers prefer intimate investments, with well-planned infrastructure and the possibility of their everyday needs being met in the immediate vicinity. The program, in operation since 2014, enables state aid in the purchase of the first apartment by young people. The main assumption of the Program is to enable young people to purchase their first house or flat. The assistance obtained under the Housing for Young People consists in a one-time co-financing of own contribution granted at the time of payment of the mortgage loan.
For the lower price and government assistance, premises located in unattractive locations and with reduced utility value of housing estates were offered (no parks, green areas, parking spaces). Such investments do not necessarily mean an increase in prices compared to the average, instead a careful decision-making process should begin in the design phase. Despite the existing advantage of supply in the housing market, potential buyers are increasingly wondering what level of comfort will be provided by the investment being built, in which area it is located and whether this situation will change in a few years as a result of planning activities. The good city development policy allows for the creation of many smart investments, eliminating reckless investments which do not adhere to the principles of good space management and can negatively affect the attractiveness of an area, and thus the prices of apartments located in that area.
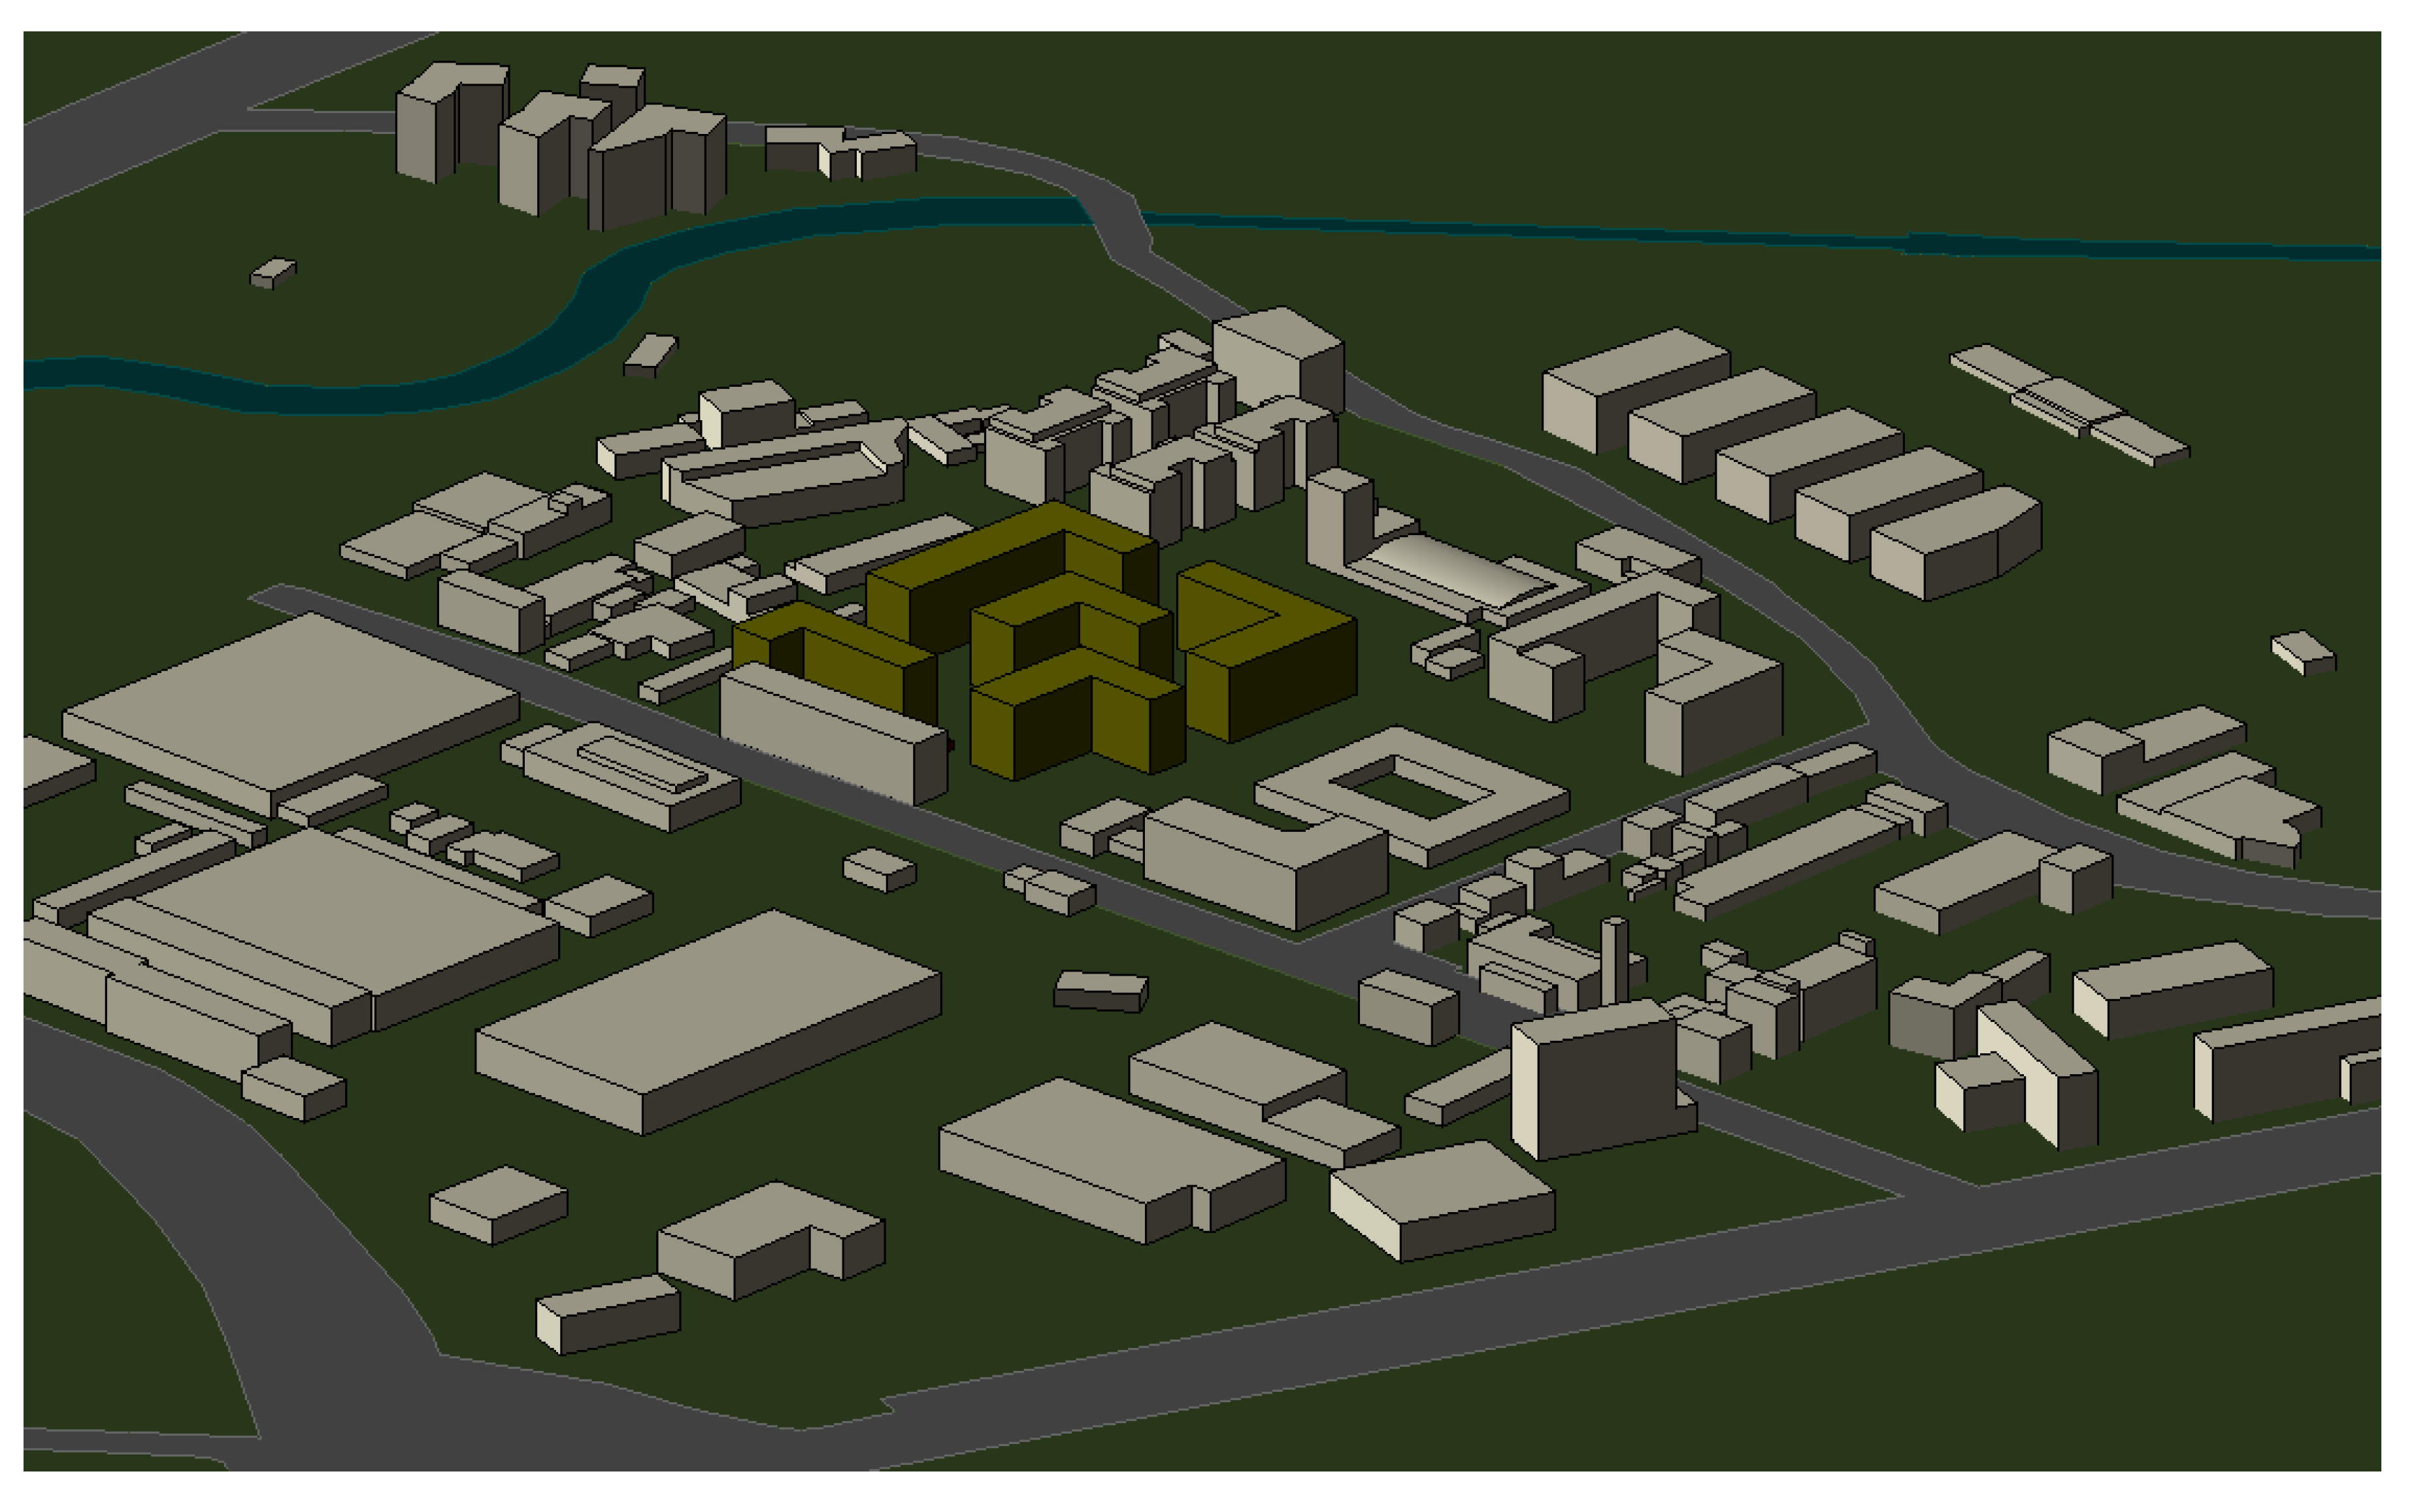
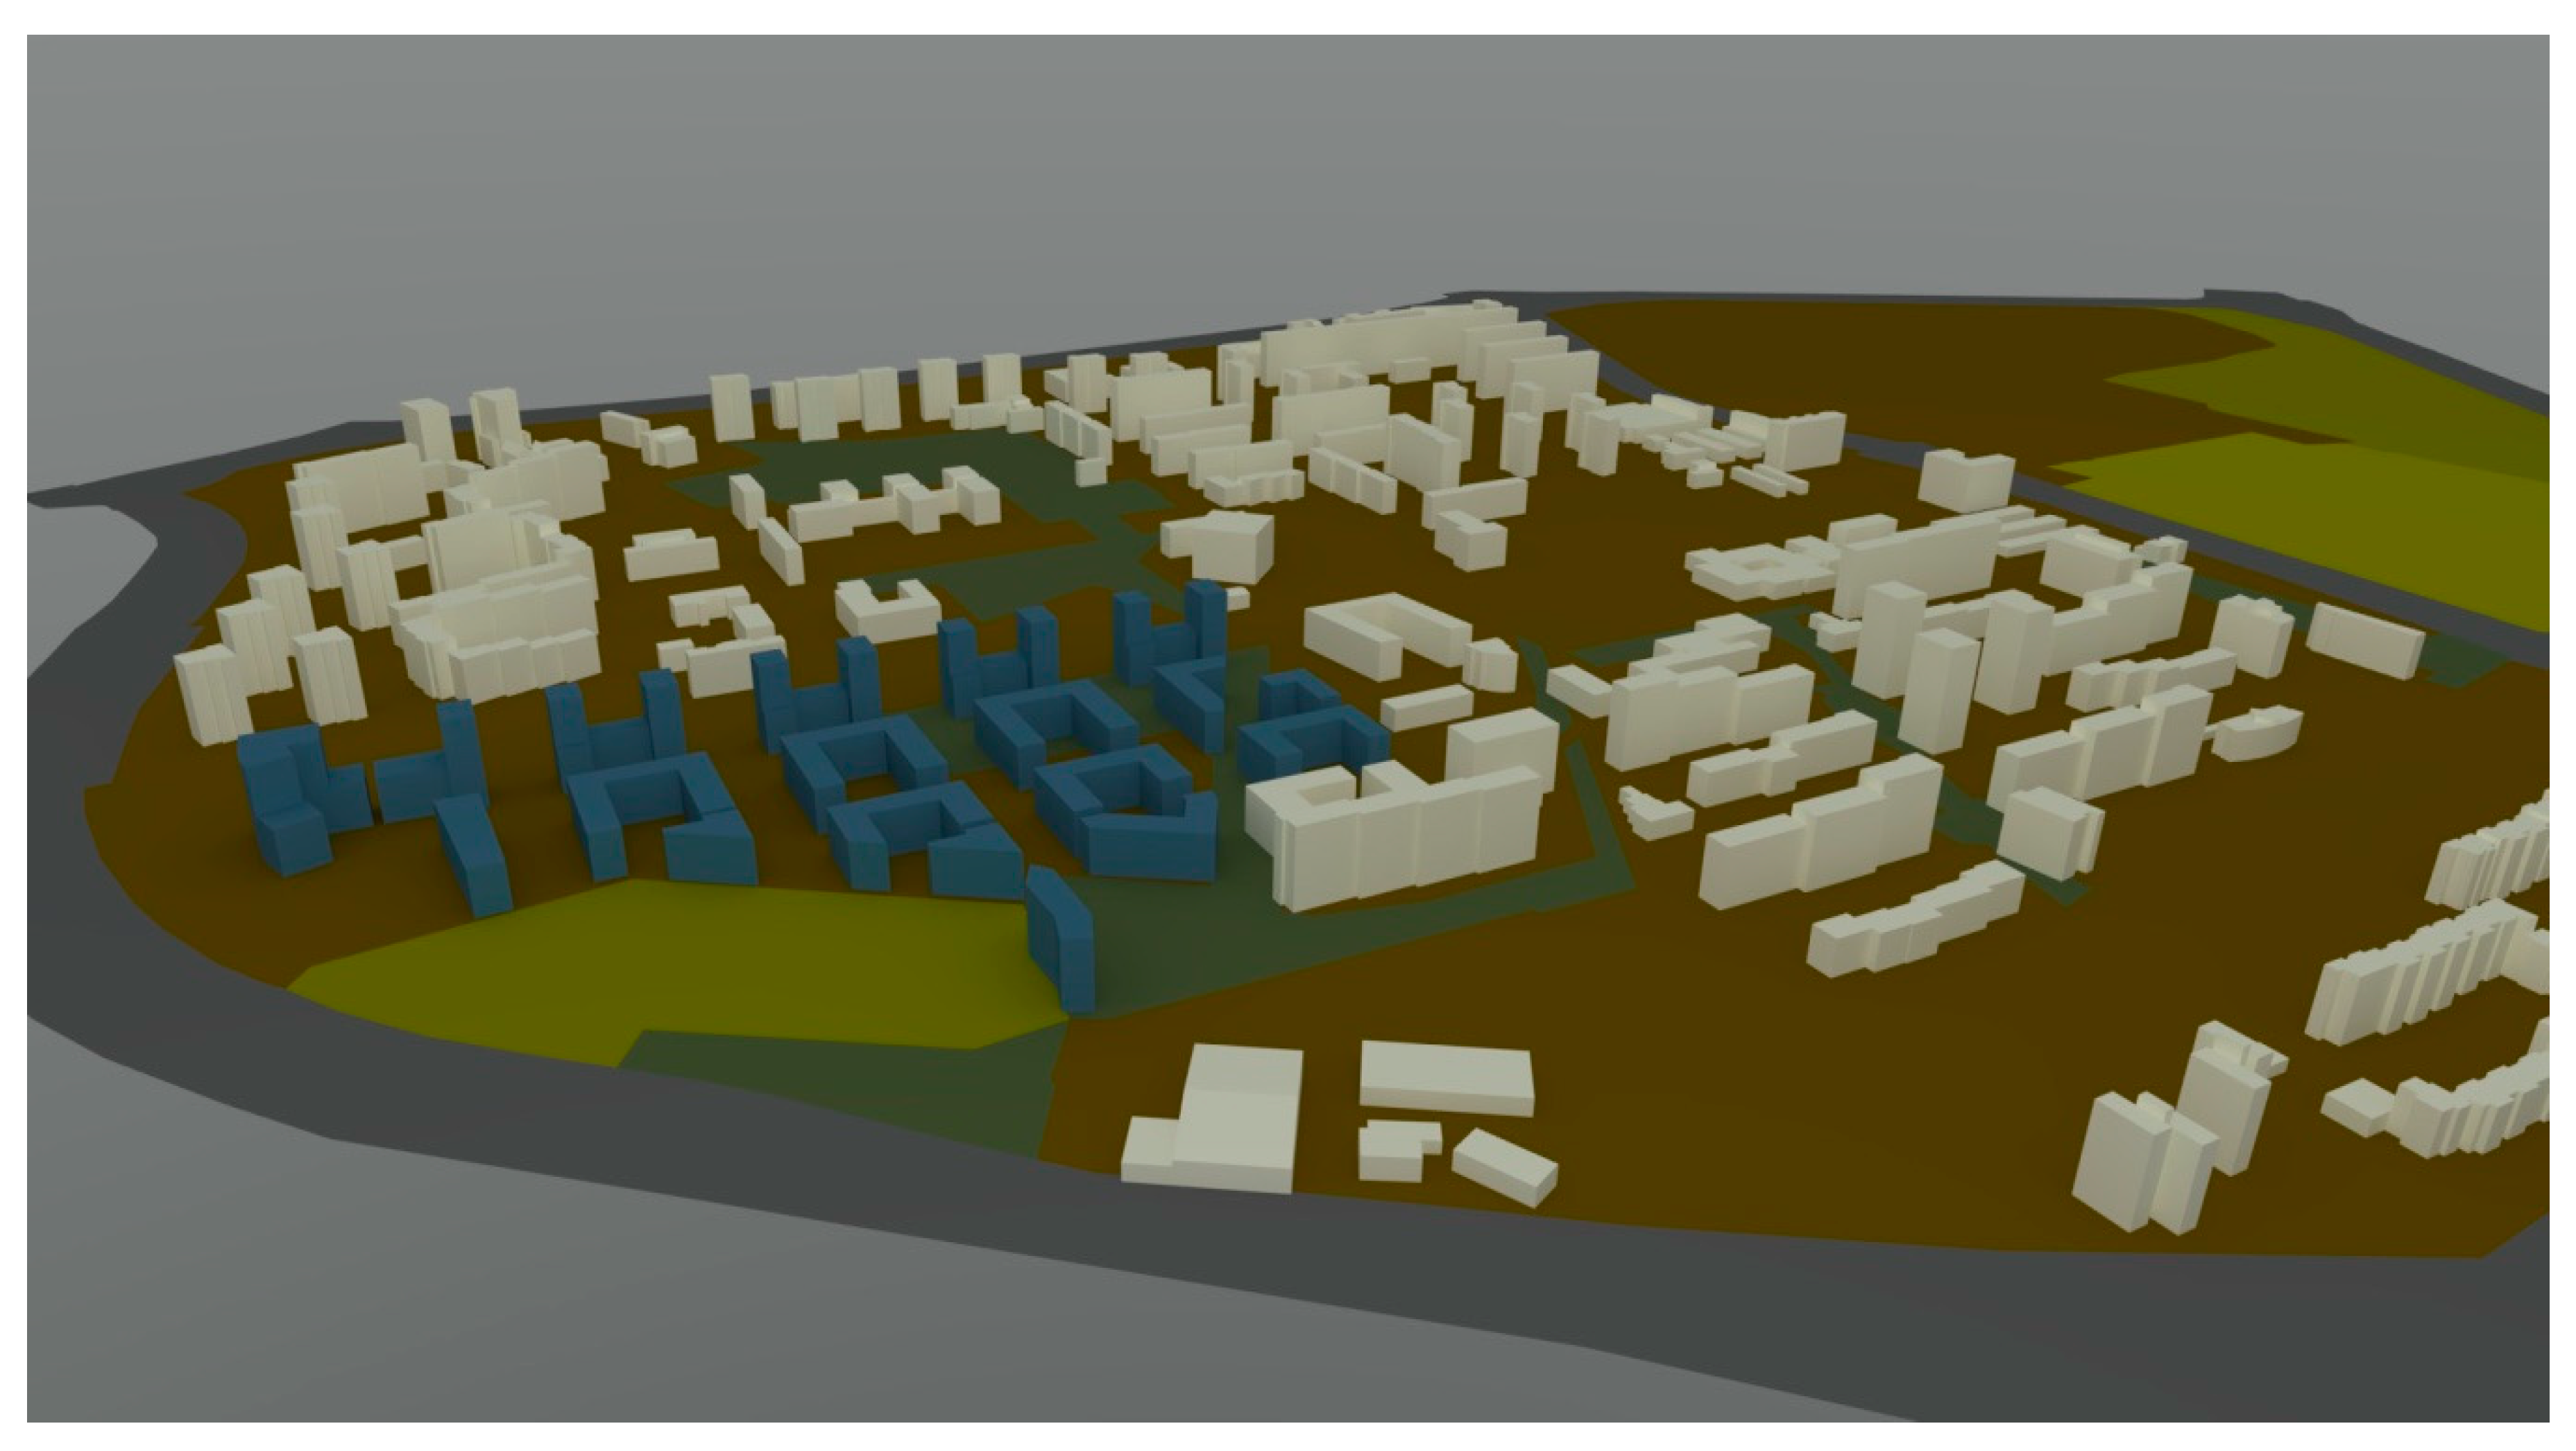
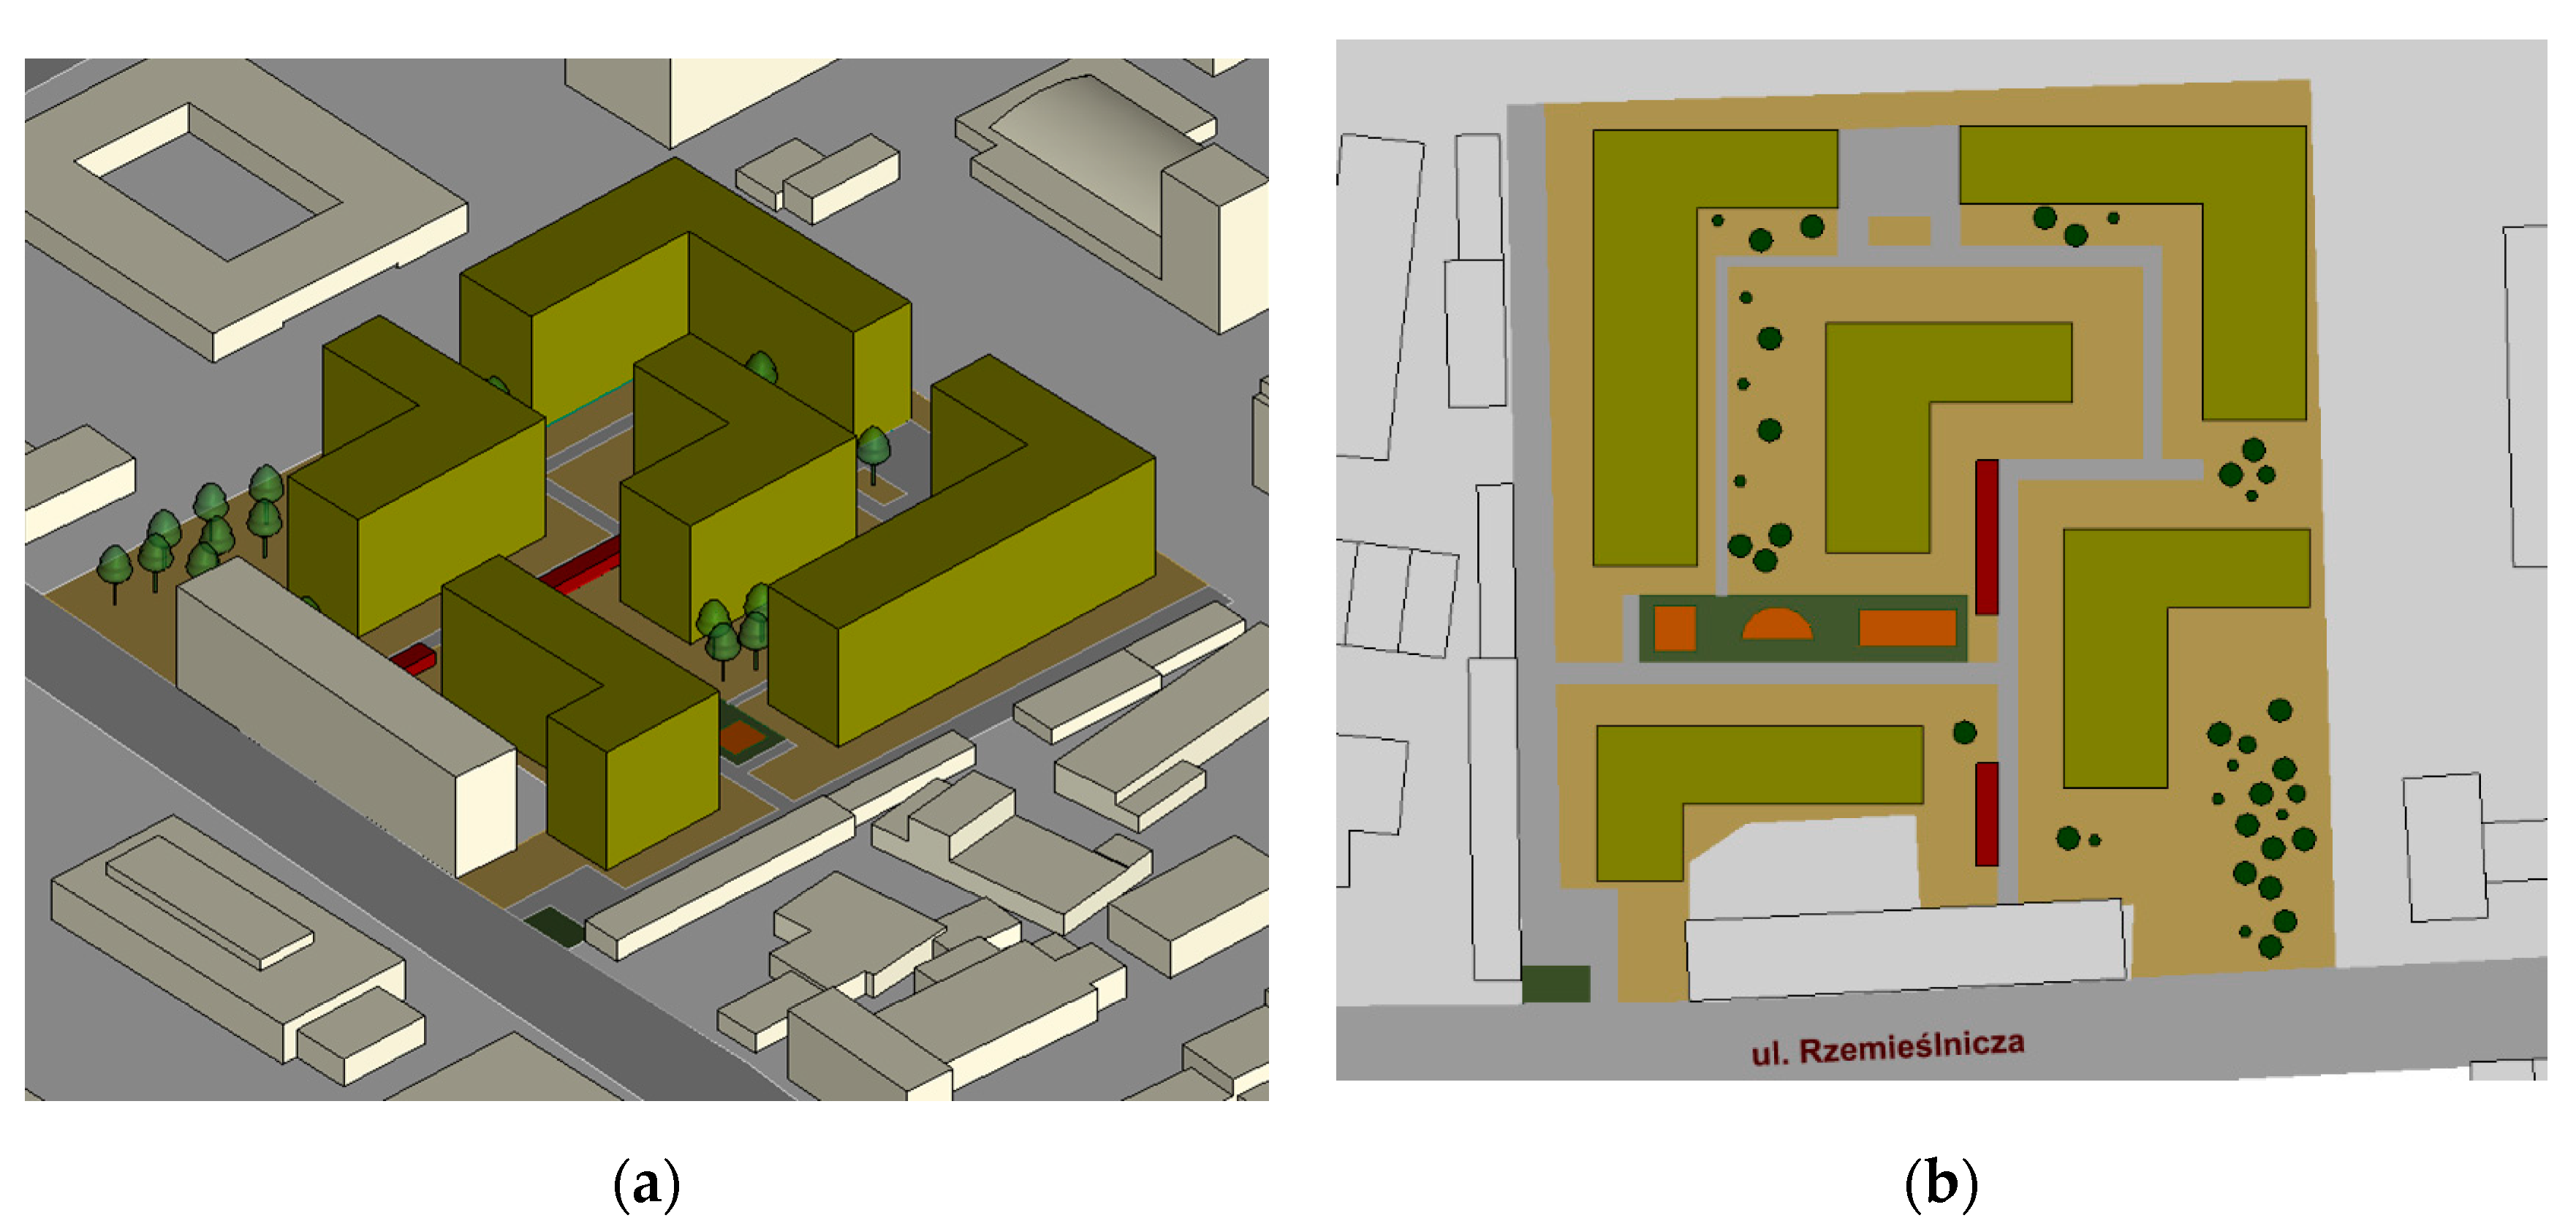
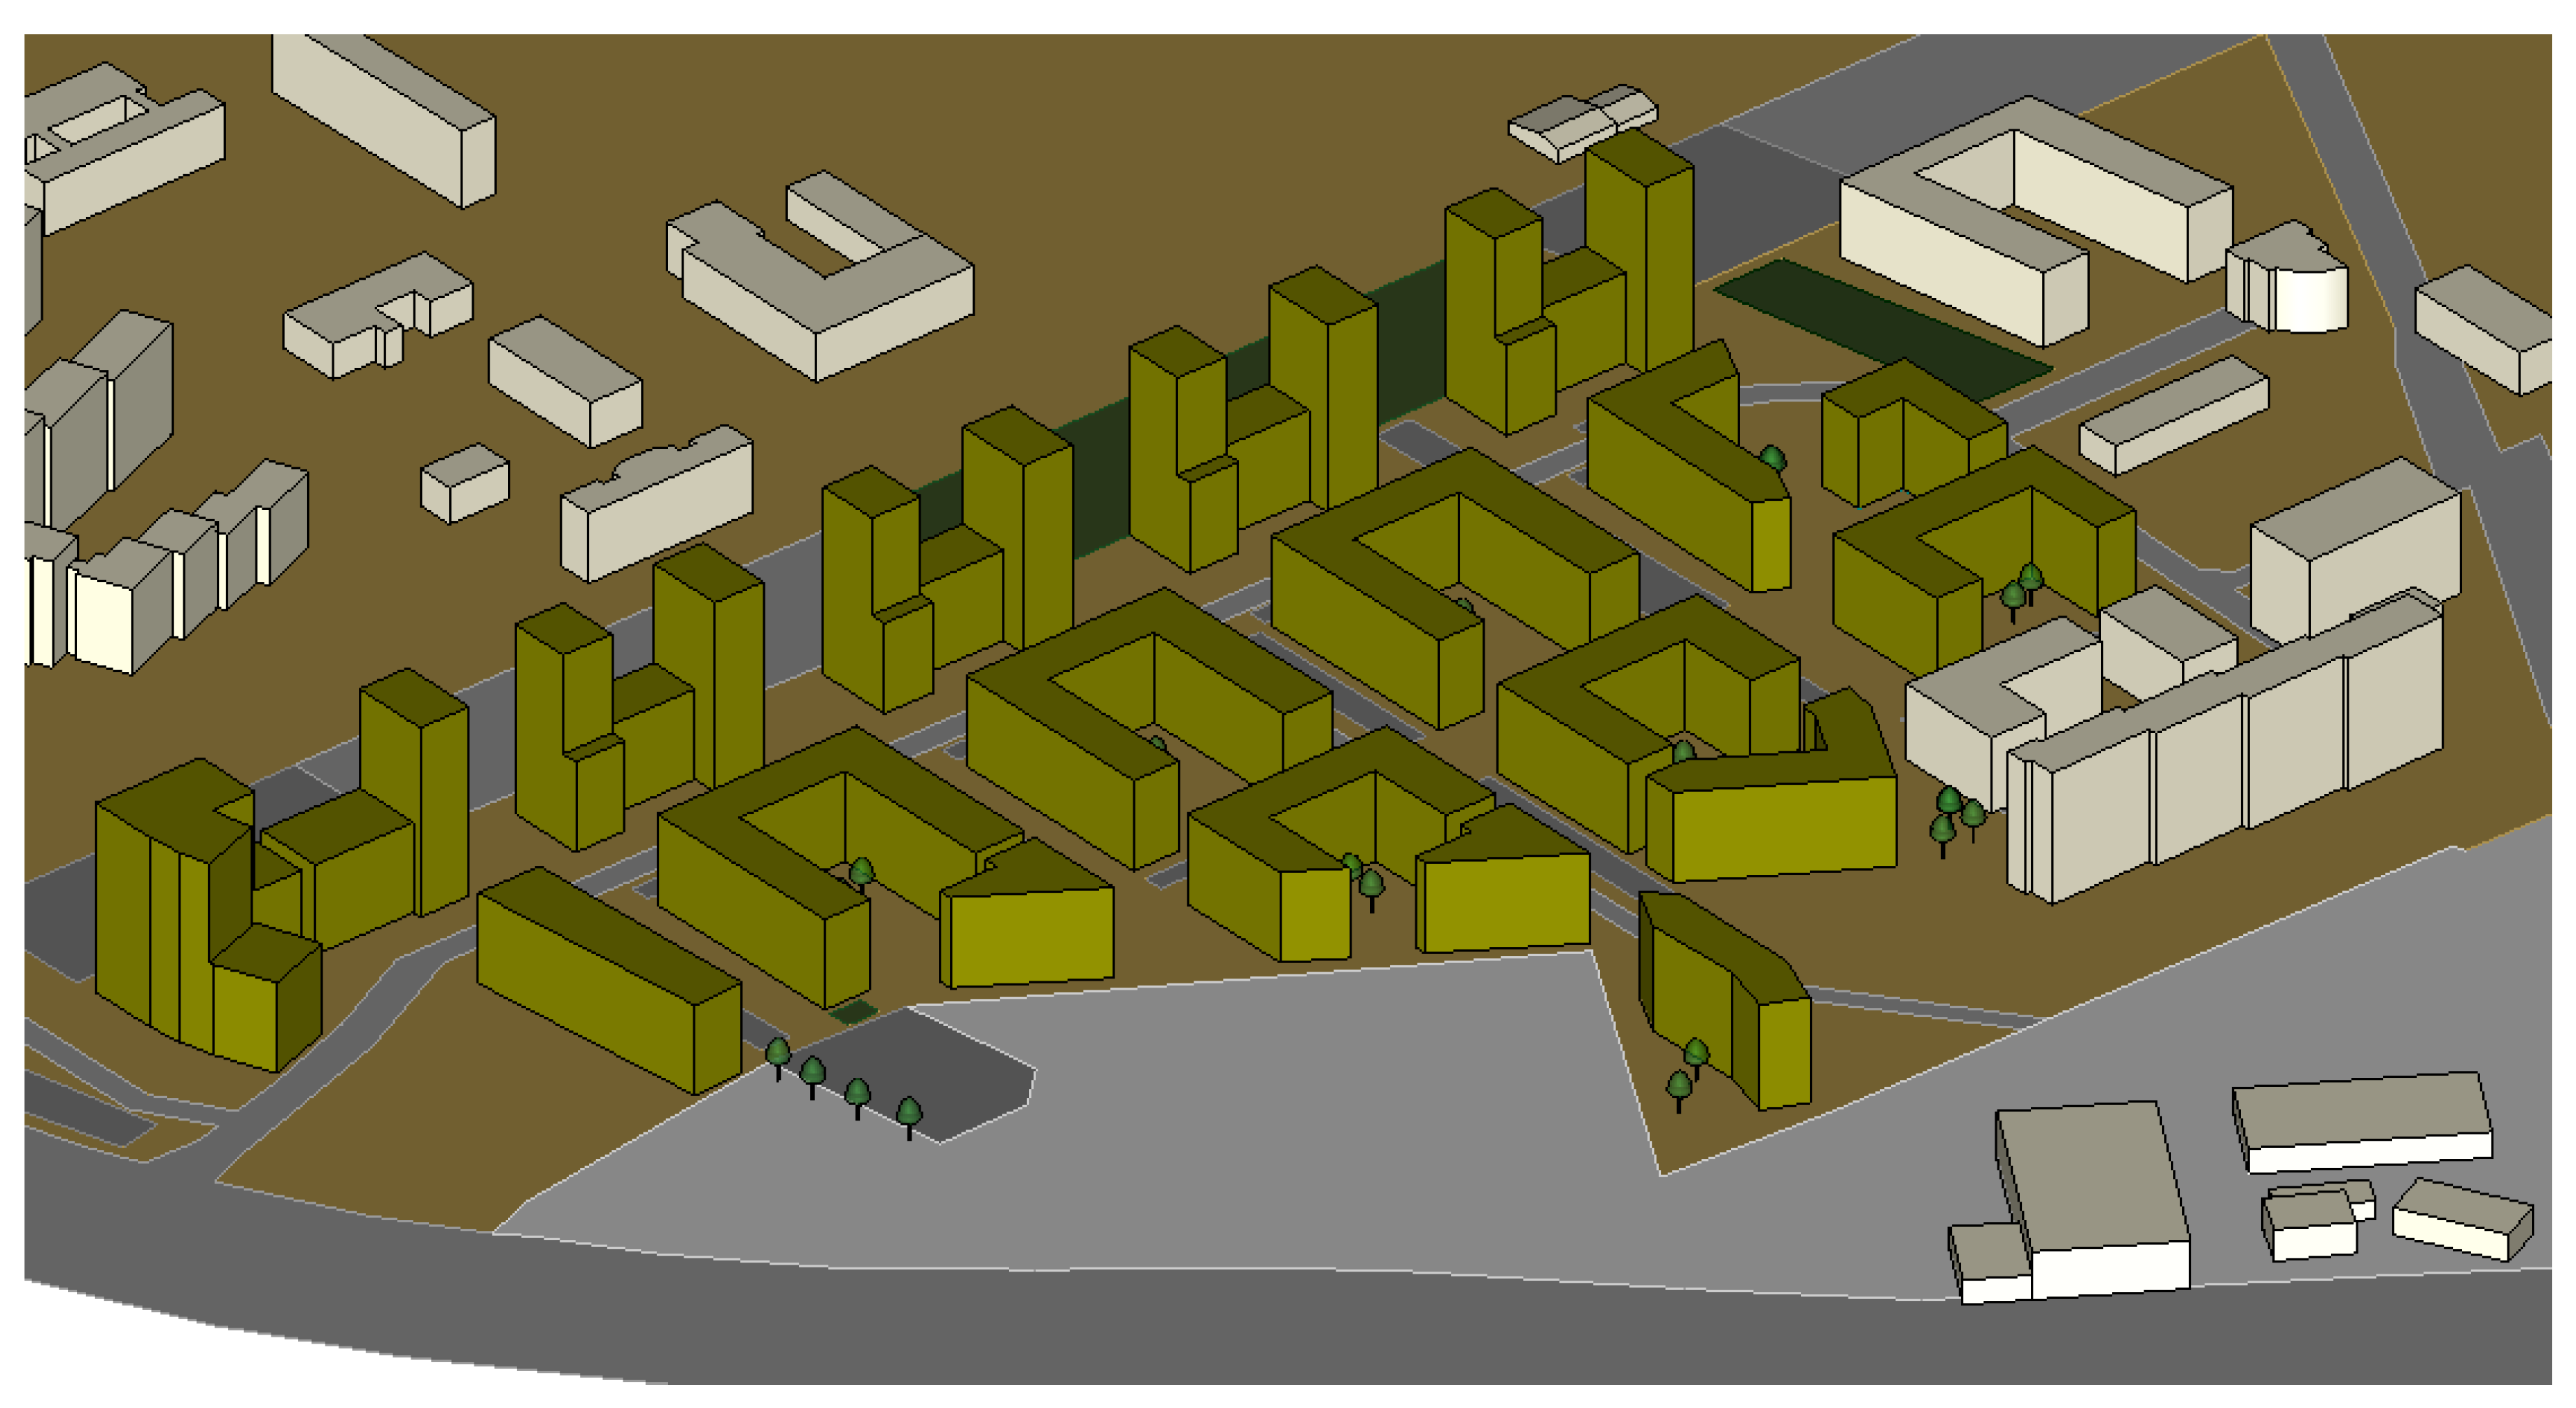
On the basis of current land development plans and the digital mock-up of the city expanded to include small architecture and tree-lining, an investigation was carried out into how to use previously undeveloped areas of the city. The area of Estate Fi (Example 1,
Figure 1) and the New Czyżyny (Example 2,
Figure 2) development were analysed.
The data provided by the developers were also used. The areas analysed were characterized by a similar period of construction, located at similar distances from the main characteristic points of the city, were in close proximity to commercial centres and had similar availability of public transport. Both investments used buildings similar to the shape of letter U or L, where there was suspicion of mutual obscuration of the building blocks. The available land was assessed in terms of its use, in accordance with the idea of a smart city, whether it has been developed in a purposeful and attractive way for the inhabitants and whether green areas have been respected [
13,
14,
15,
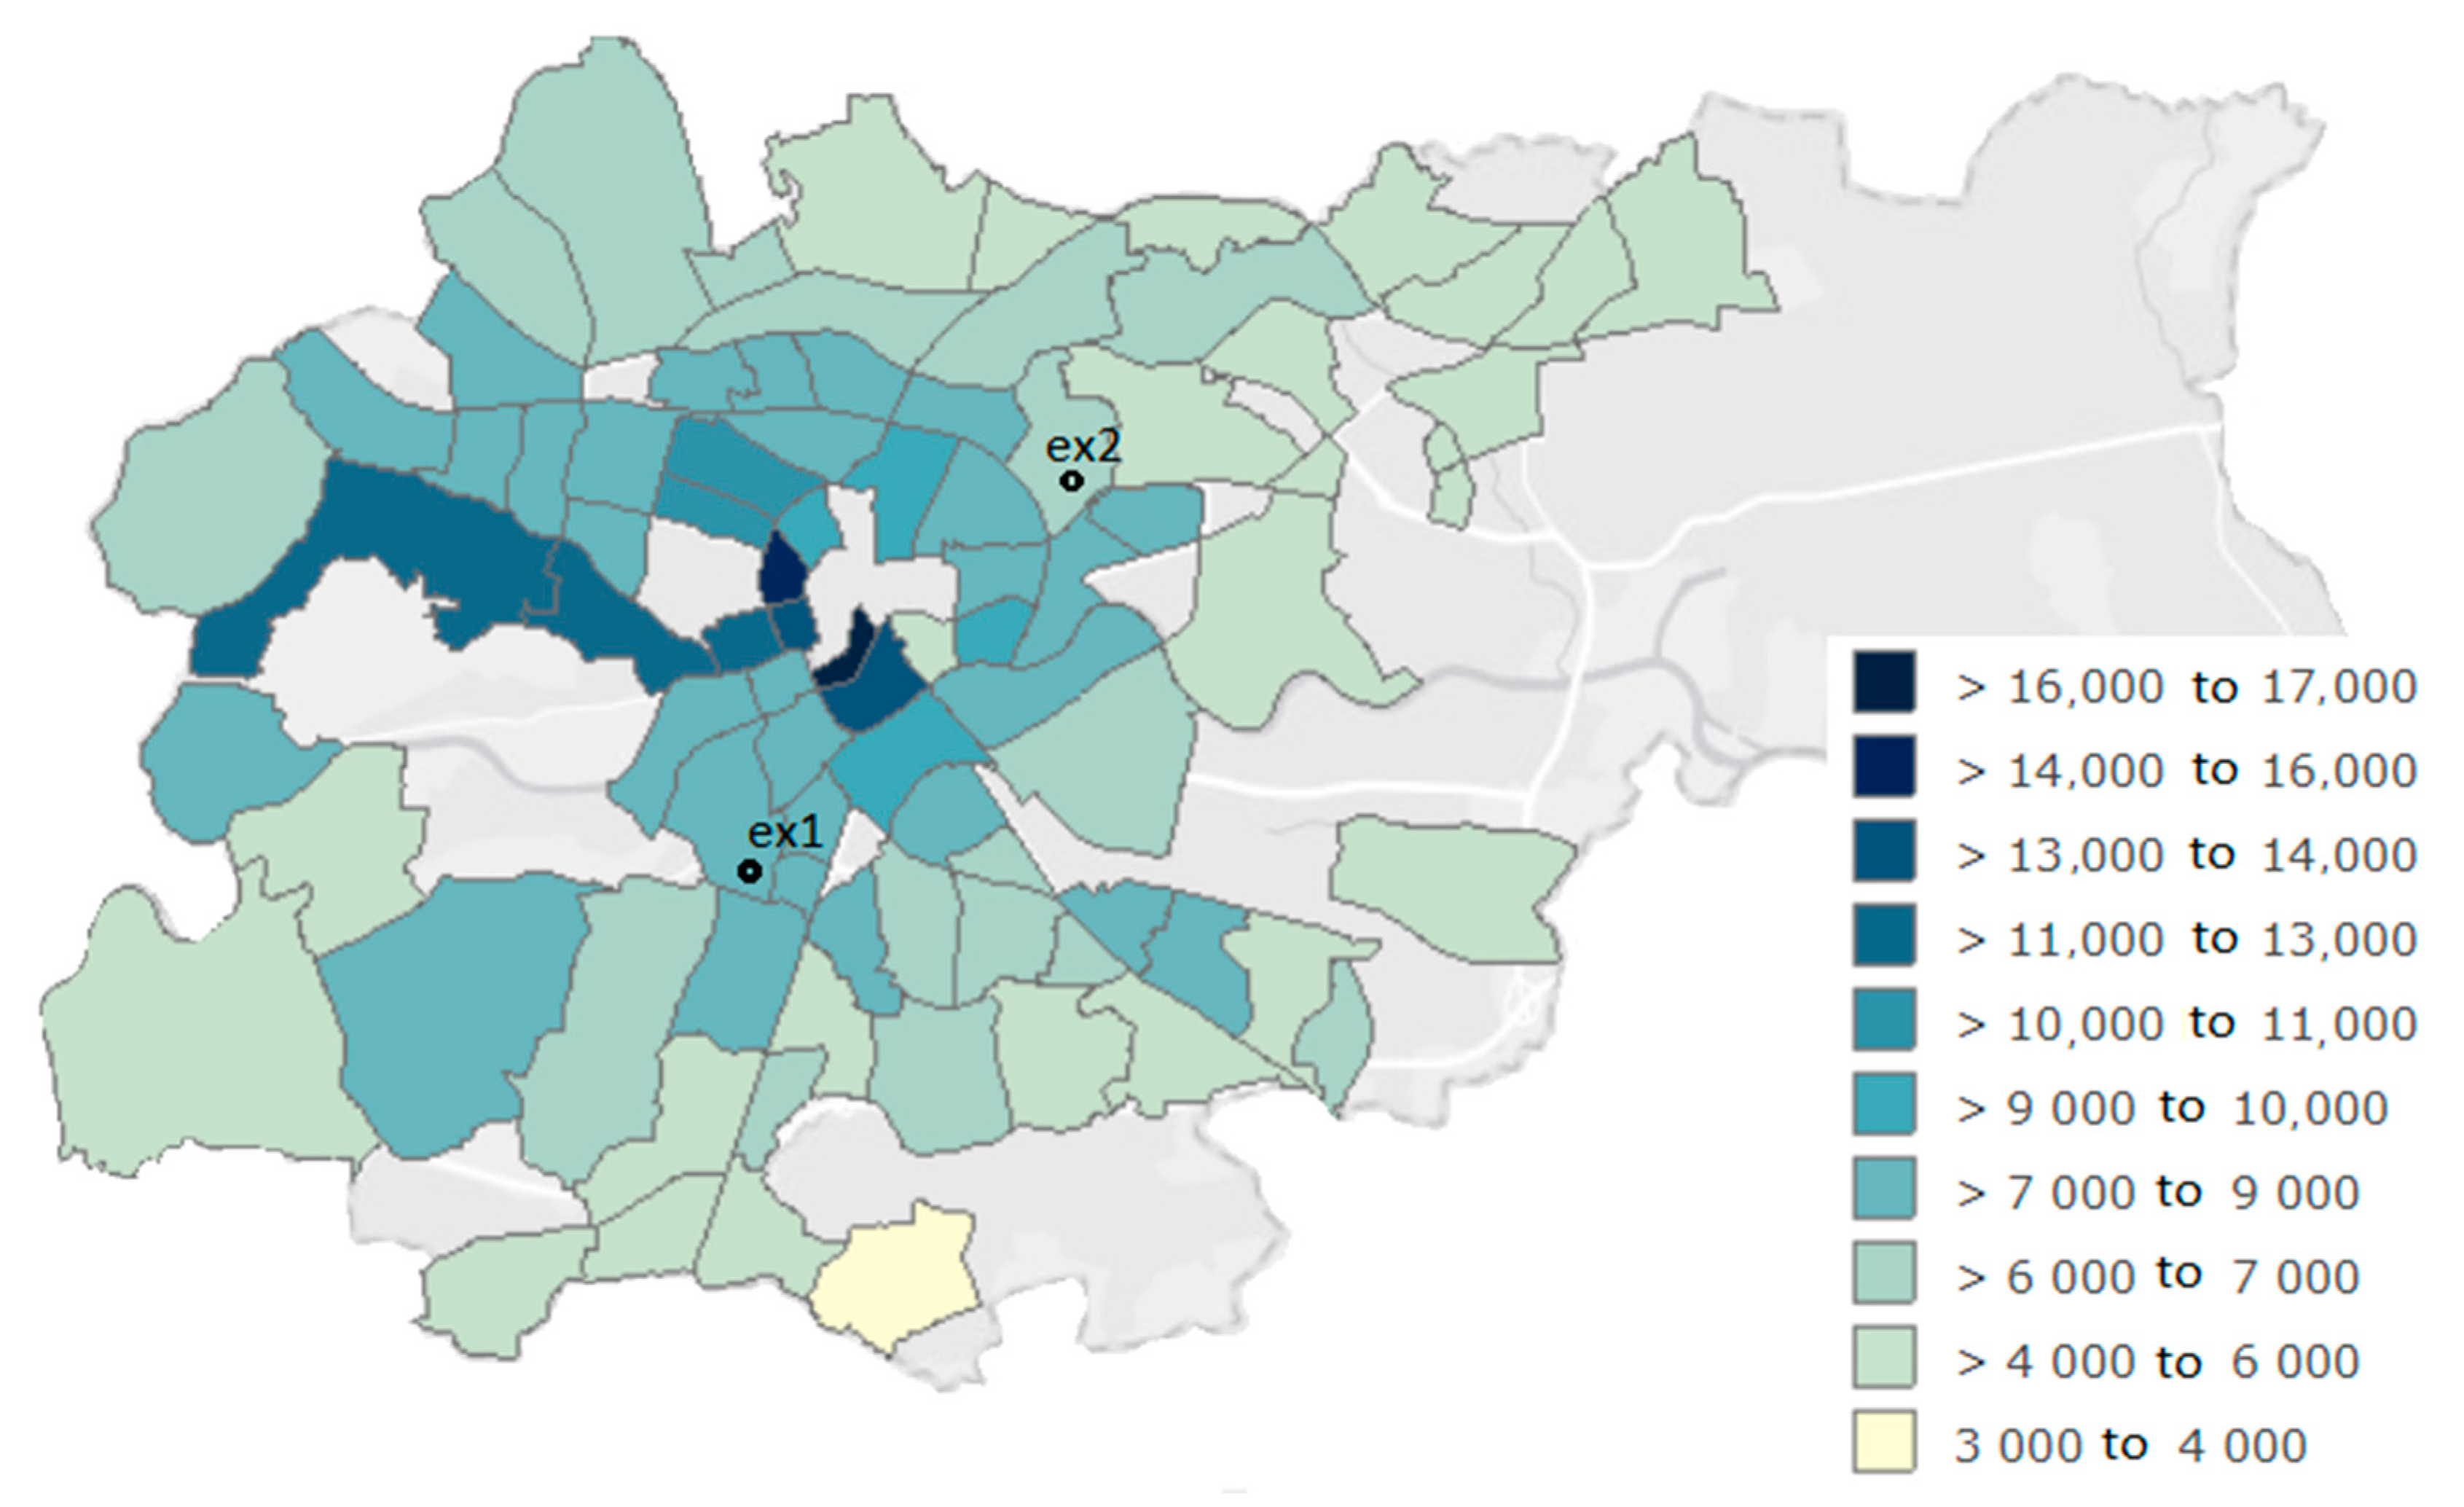
16]. Having considered solely the average property prices on the primary market, it was noted that Example 2 was characterized by undervalued prices, compared to the average prices in its area, whereas Example 1 did not create an enclave of prices and was in line with average prices in the area (
Figure 3). On this basis, the untapped investment potential of Example 2 may be inferred [
17].
In order to illustrate the impact of space development [
19], data obtained under the CAPAP project [
20] were used in both cases to study an area of the city of Krakow. The result of this program was an application presenting the 3D model of buildings in the CityGML 2.0 standard, at the level of detail LoD2 (geometric model, buildings have the roof shape selected). The 3D model is based on 2D outlines of buildings from the topographic object database (BDOT10k) [
21], altitude data from lidar aerial laser scanning at the density of 12 points per square metre and a numerical terrain model (NMT) with a one metre mesh grid. The model is complemented by the boundaries of the registration plots with their numbers and details of ownership [
18,
20].
On this basis, the authors developed a model made in Autodesk Revit. The basic record of the program is the format RVT, however, it is possible to export objects to IFC, which is ISO-certified. This format is supported by most CAD and BIM software. It transmits geometric and semantic properties; however, it is not possible to record geographical locations. City GML, however, is currently supported by an increasing number of CAD and GIS programs, enabling the facilities of IFC to be transformed into City GML objects, using the applications created for this purpose [
22,
23]. This is mainly possible for LoD1 and LoD2 levels, however, given the detail and size of models at higher levels, it is possible to effectively provide the relevant information necessary to create the 3D database of objects in more extensive areas.
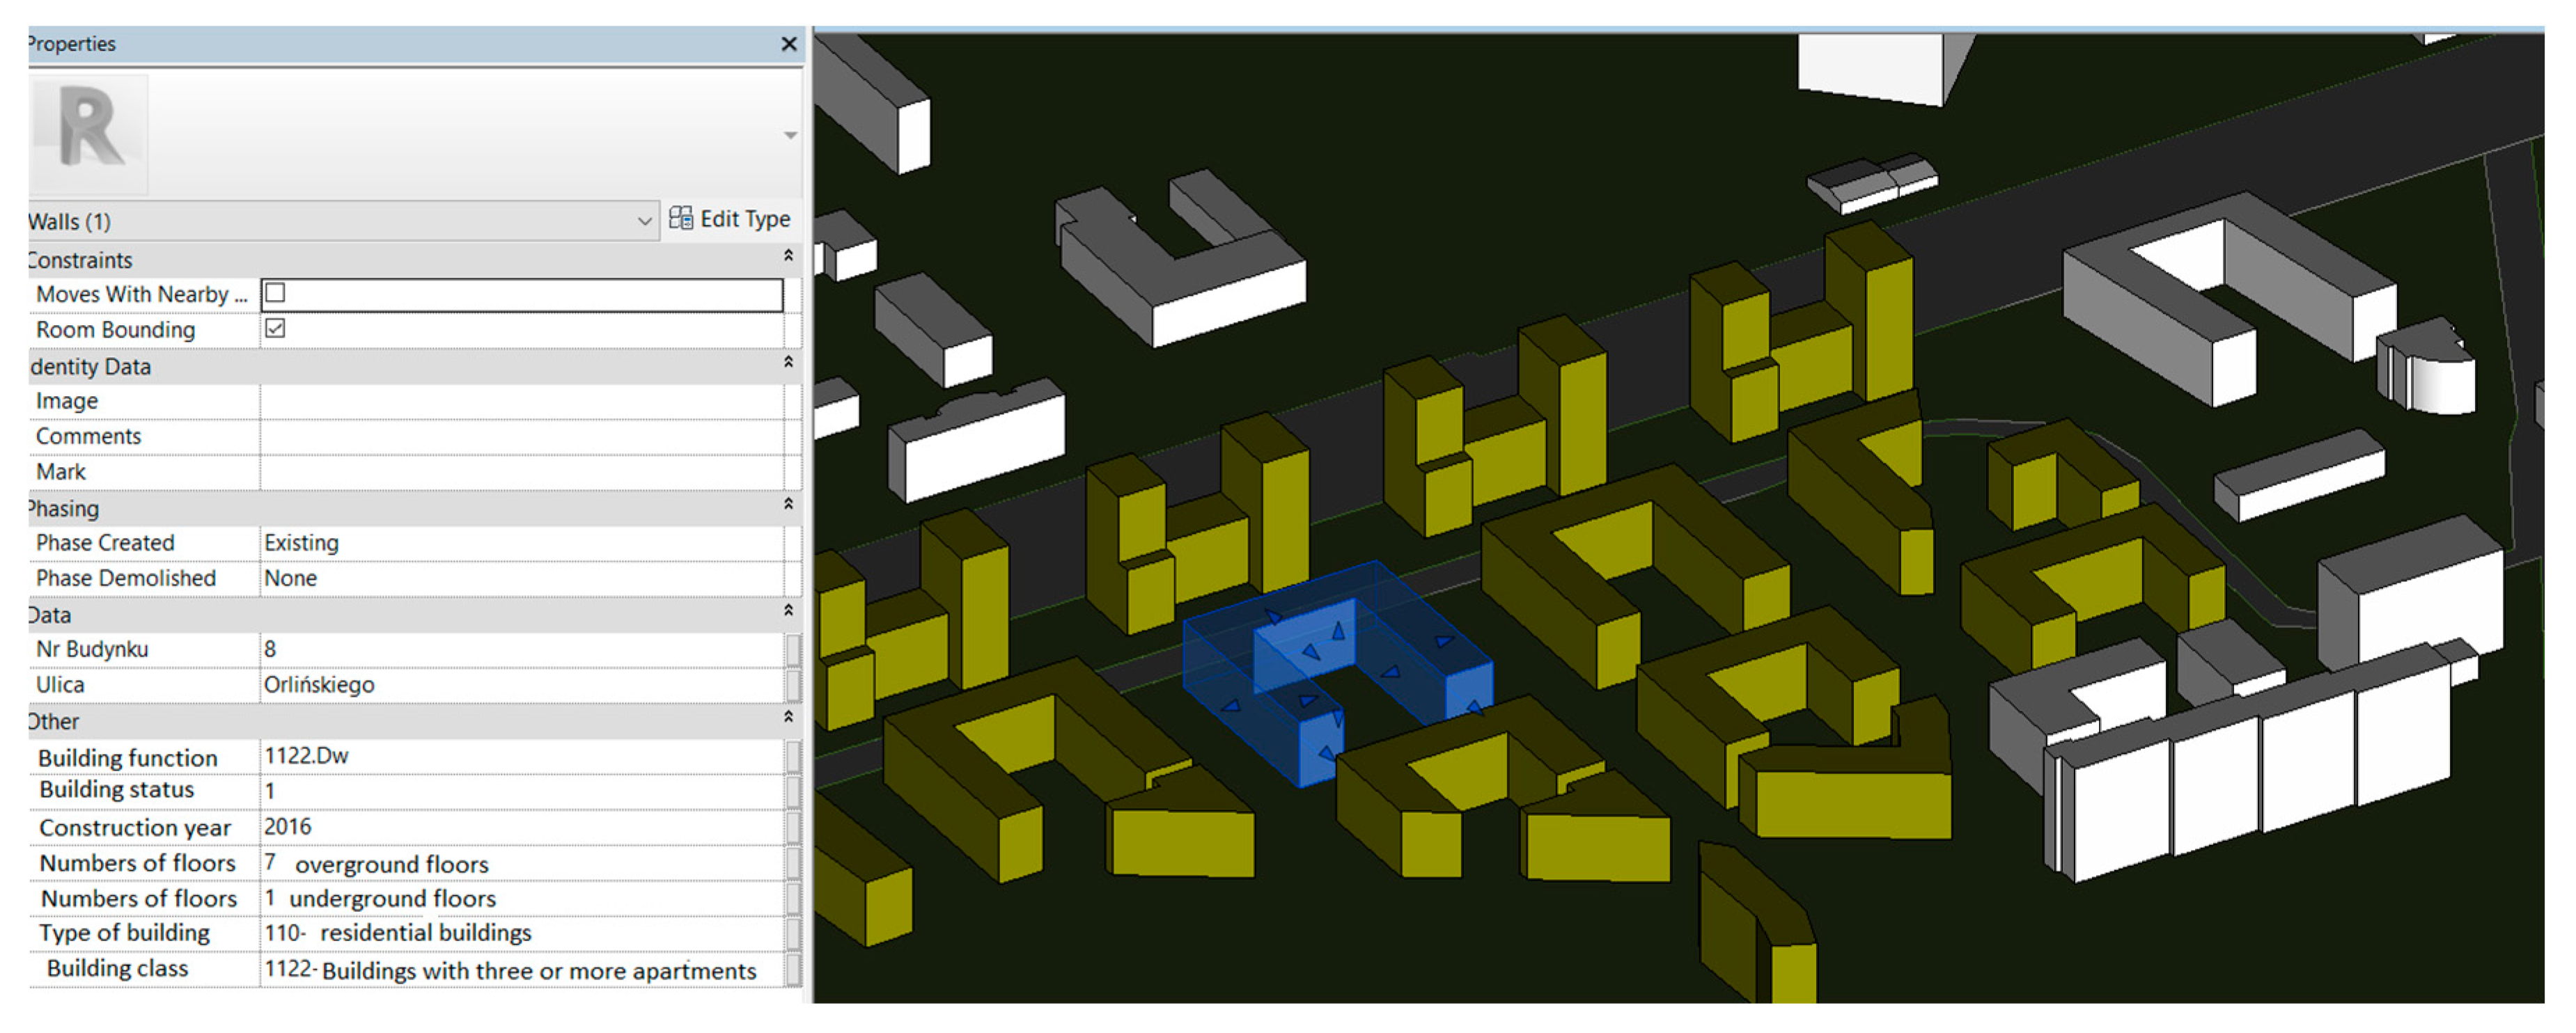
Global parameters were introduced during the execution of the model, so it would be possible to add data for details such as address, building function, year of construction, number of stories (
Figure 4). Thanks to the assigned characteristics, any filtration of objects is possible, based on specific parameters. The wide graphic possibilities allowed for the distinction of objects belonging to the investments, studied against the background of adjacent buildings. This was not feasible for CAPAP [
18].
The Fi estate was built in two stages, the end of the first stage was constructed in the last quarter of 2013, while the entire development was completed during the winter of 2015. In the first phase, two seven-storey blocks were built, during the next stage an additional three buildings with the same number of storeys were built. The height of the building was not distinguished among the existing buildings (
Figure 5a). The development consisted mainly of apartments comprising 1, 2, 3 and 4 rooms, with several apartments and commercial premises on the ground floor, totalling approximately 480 premises built on an area of around 2ha [
24].
According to the developer, the estate was planned to accommodate around 1000 inhabitants, primarily single people and young couples up to the age of 35.
Ecology played an important role in the design, which made use of energy-efficient and renewable energy solutions, such as solar panels and rainwater systems. Communal areas of the estate were lit with solar energy (
Figure 5b). According to the developer, the investment was carried out using natural materials, with a high degree of thermal and acoustic insulation. The technology used also accords with the concept of the smart city, using the potential of natural resources.
Example 2 (
Figure 6), constitutes the construction of the Avia Estate and buildings on Orliński Street, carried out by one developer. Work began in 2011 and two years later the first stage of the development began, eventually resulting in the construction of 28 blocks on approximately 14 hectares, creating 3500 new housing units. To date, 18 seven- and 15-storey buildings have been constructed, mainly 1–2-room and 3-room apartments. Fifteen-storey buildings are taller than others in the area [
25].
The start of construction of the development was met with numerous protests by locals. The main complaint was the planned felling of 51 trees, which was eventually reduced to 40 and the investor undertook to use an additional area for green and recreational areas. The criticism of existing residents of the district related to the high density of buildings without providing adequate facilities in terms of car parks, nurseries and medical facilities. There are seven-storey buildings in the area, but they are more distant from one other than those in this investment, and there was a fear that the 15-storey blocks would obscure the sun’s rays from other buildings in the area.
Significant population growth in small areas requires adequate facilities to ensure that their needs can be met, which has been overlooked in investment planning [
26]. Another problem has been the lack of adequate communication bandwidth. It has been necessary to increase the number of bus stops and create a left-turn from estates. Despite the traffic analysis carried out by the developer, a sufficient modernization of the transport infrastructure was not carried out. In view of the situation, the city took steps to improve transport conditions in the area, allocating public funds for this purpose after the completion of construction of the development.
One of the important elements of urban design is to examine the impact of the location of new developments on existing buildings. In accordance with Article 20 of the Building Law Act [
27] the designer is obliged to designate the area of impact of the object. Two groups of factors must be taken into account within the scope of the Law. The first is the impact of the function of the facility and the requirements of its use. The second element is the impact caused by the structure of the building, i.e., the obscuration caused by the building and shading of adjacent objects, such as other buildings and undeveloped areas, e.g., playgrounds.
The cover-up regulations are contained in the regulation relating to the technical conditions required for buildings and their location [
22]. According to this provision, the location of the buildings intended for residential use should ensure maximum lighting of the premises. This condition, among others, shall be met if “between the arms of the 60° angle, designated in a horizontal plane, with a vertex situated in the inner face of the wall on the axis of the window of the obscured space, there is no obscuring part of the same building or other obscuring object less than:
- (a)
overriding height–for objects that are up to 35 m high,
- (b)
35 m–for objects over 35 m high.” The height of the shadowing is measured “from the level of the lower edge of the lowest window of the building obscured to the level of the highest shading edge of the obscuring object or its obscuring part” [
27,
28]. Exceptions may be made with regard to inner-city buildings and this distance may be halved, however the justification of the designer would be required.
In view of the above, it is advisable to carry out a general analysis of the shadowing in order to determine the areas of impact at the planning stage of the conceptual masses of the buildings. According to the legislation [
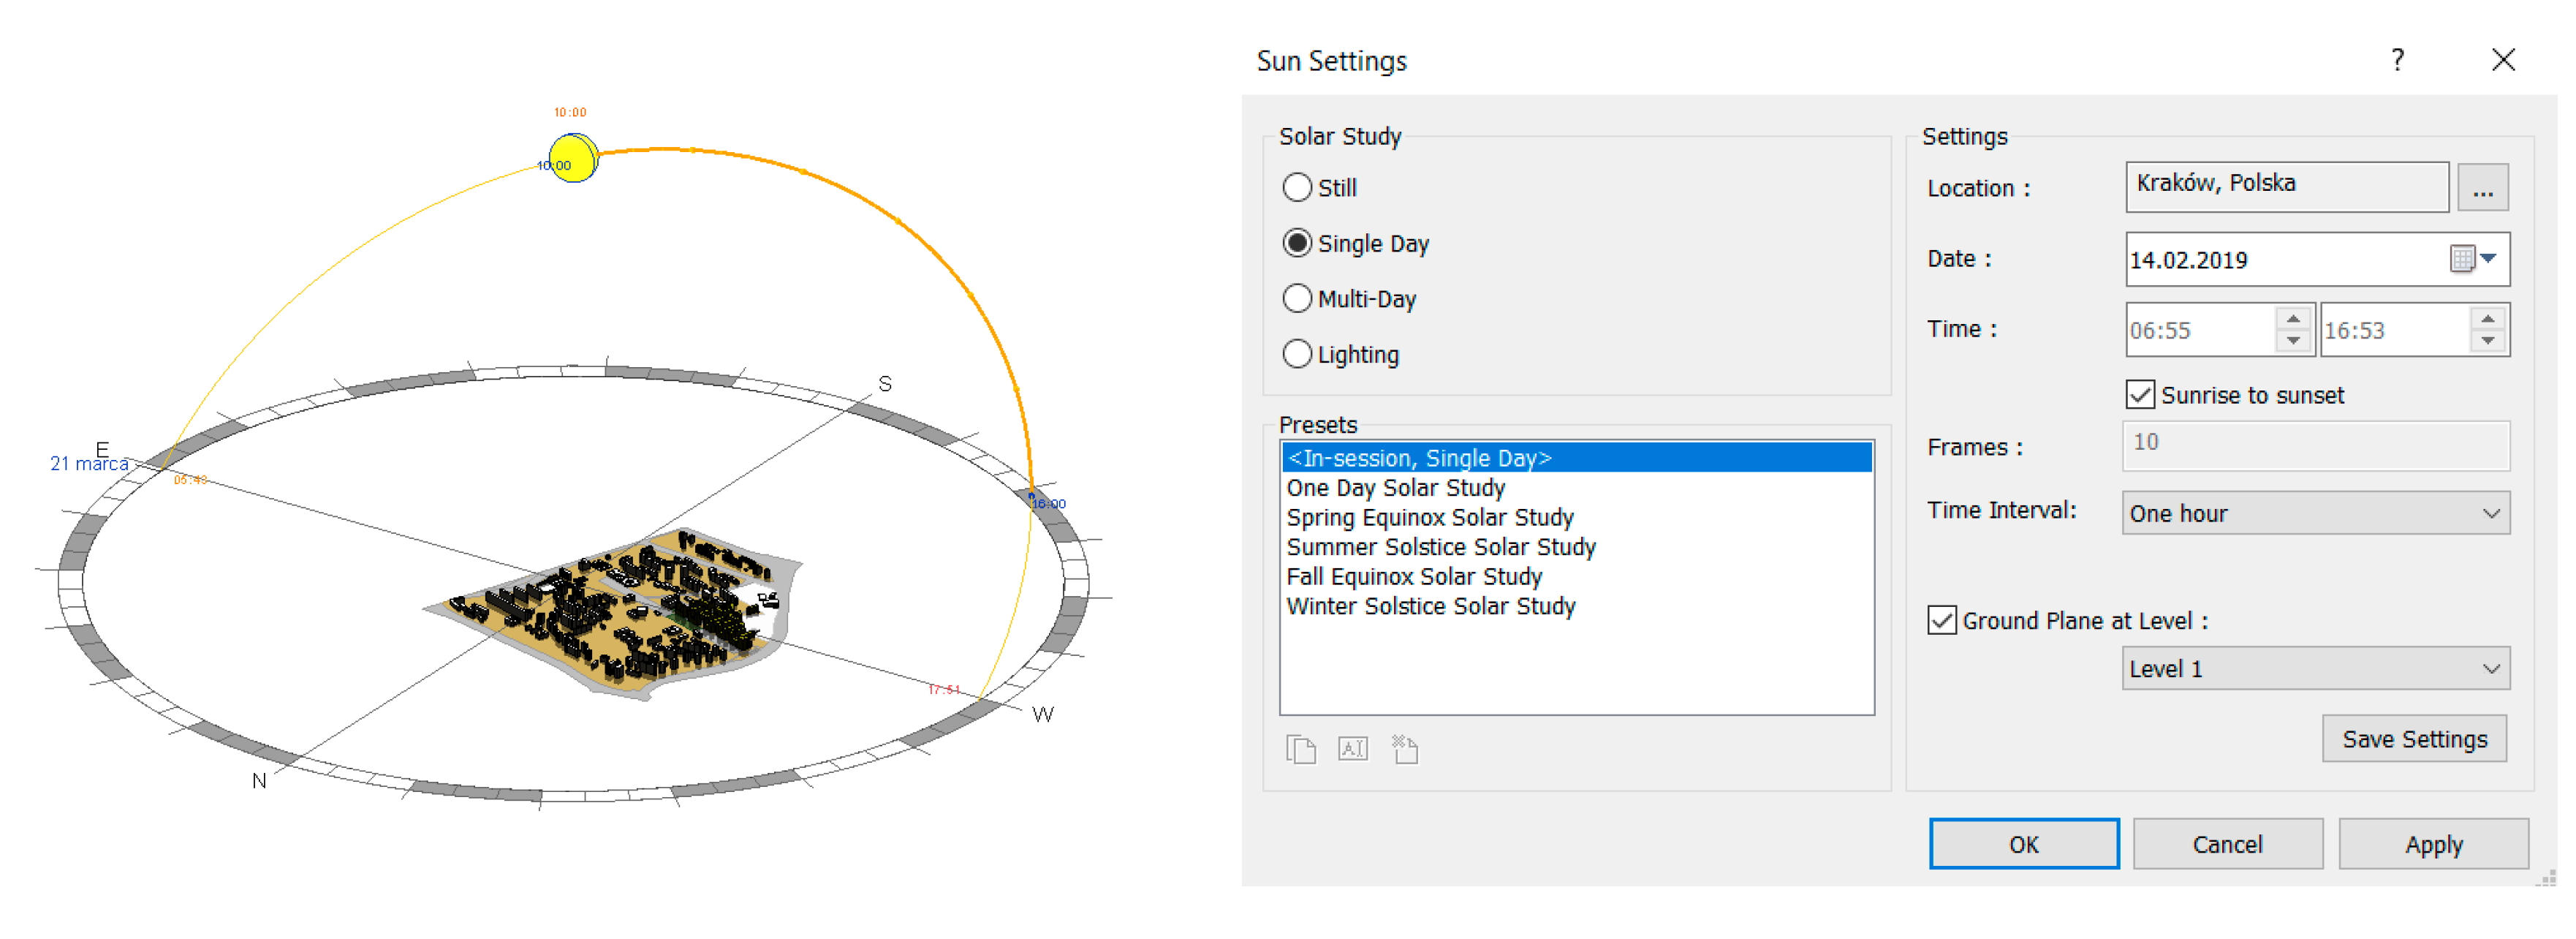
28] the analysis is carried out on the days of the equinoxes (21st March and 21st September). With the three-dimensional mock-up of a section of the city, the study analysed the shadowing in the Revit software (
Figure 7). The program enables the selection of the appropriate location, date and measurement intervals, then it is possible to scroll through the frames with generated shadows at individual intervals.
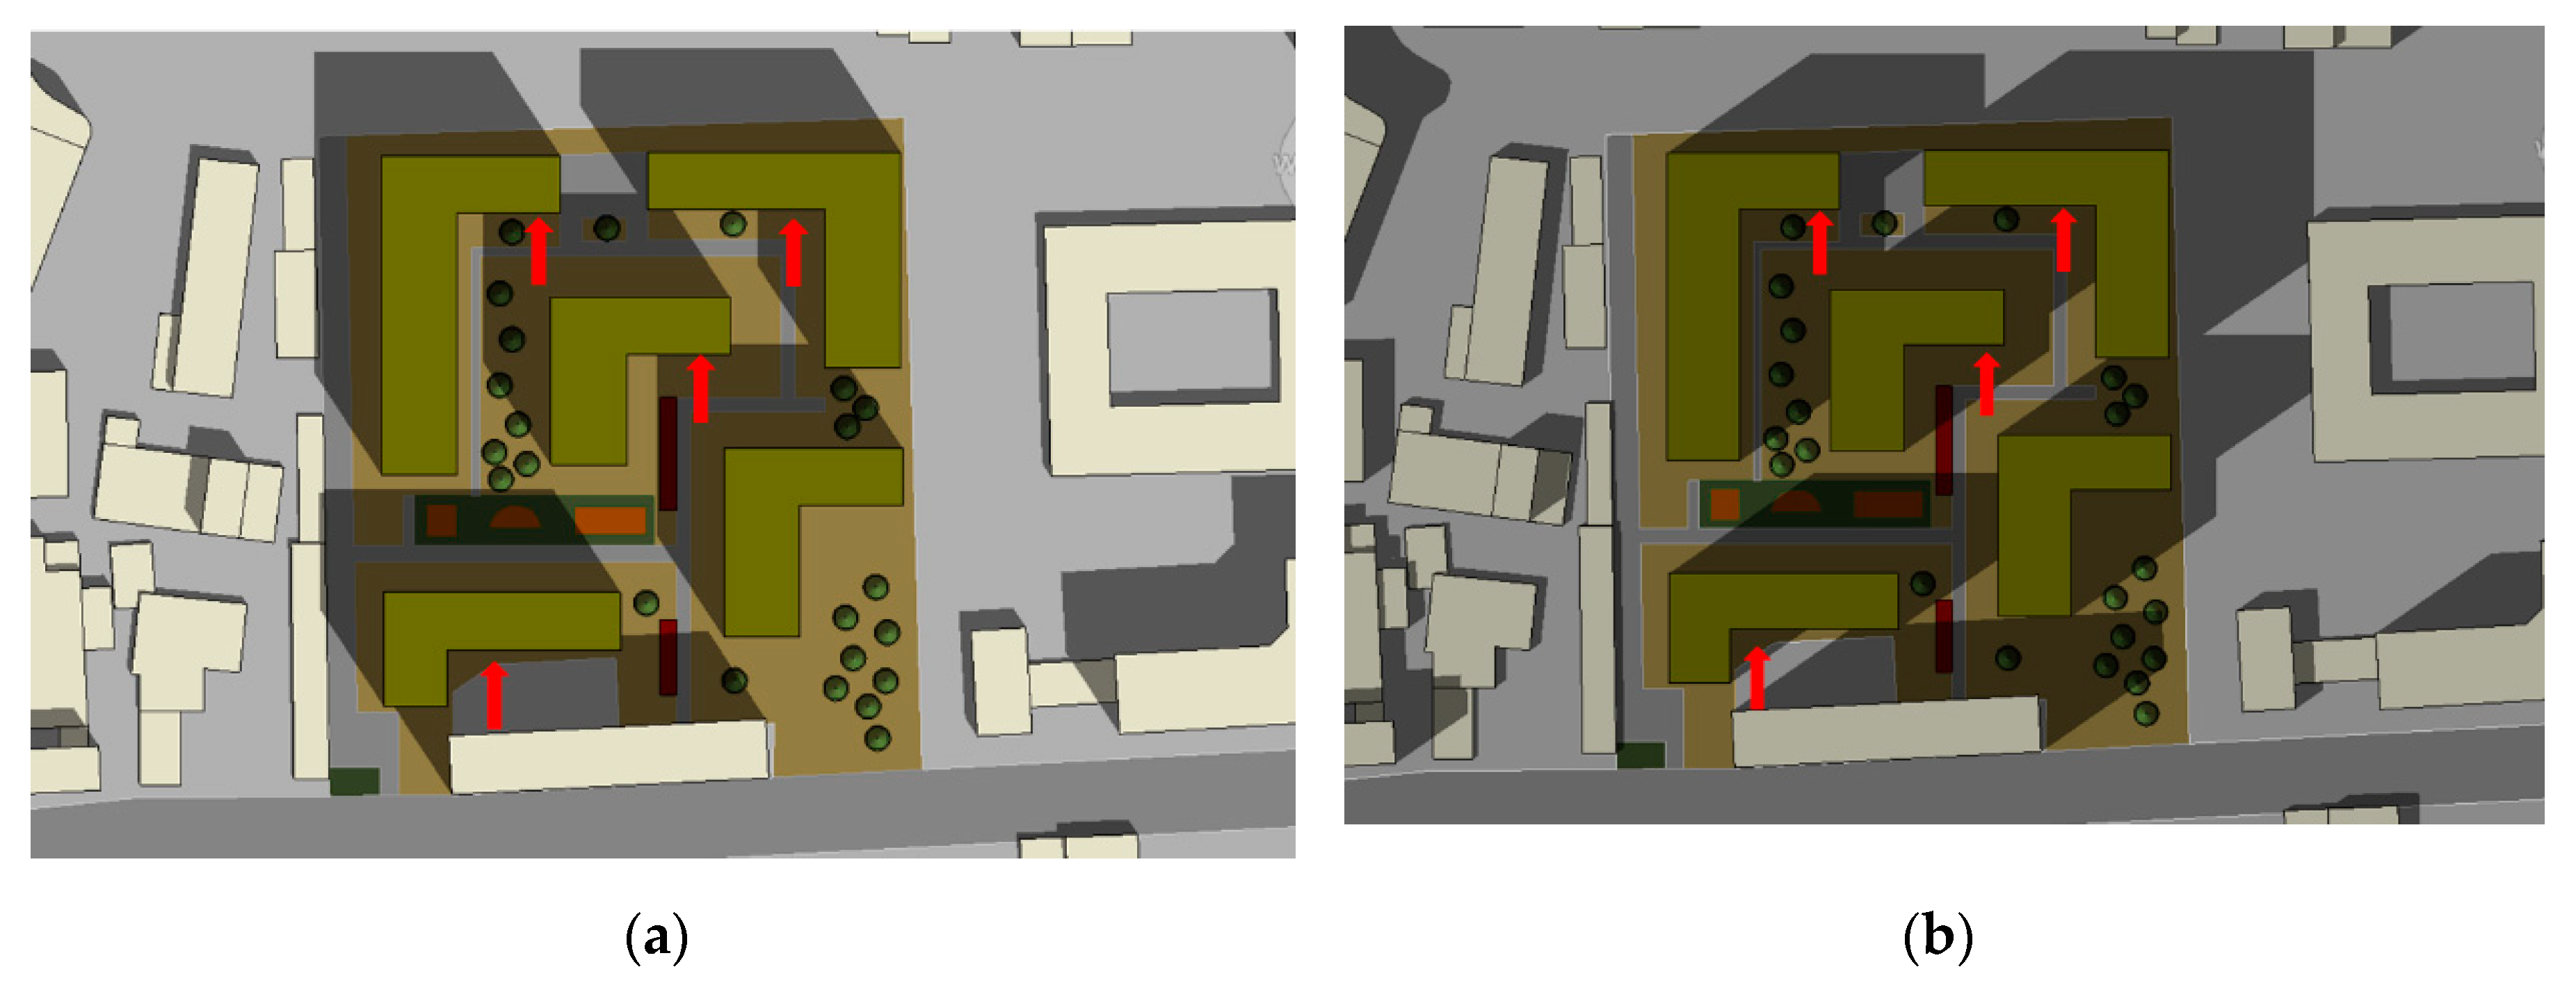
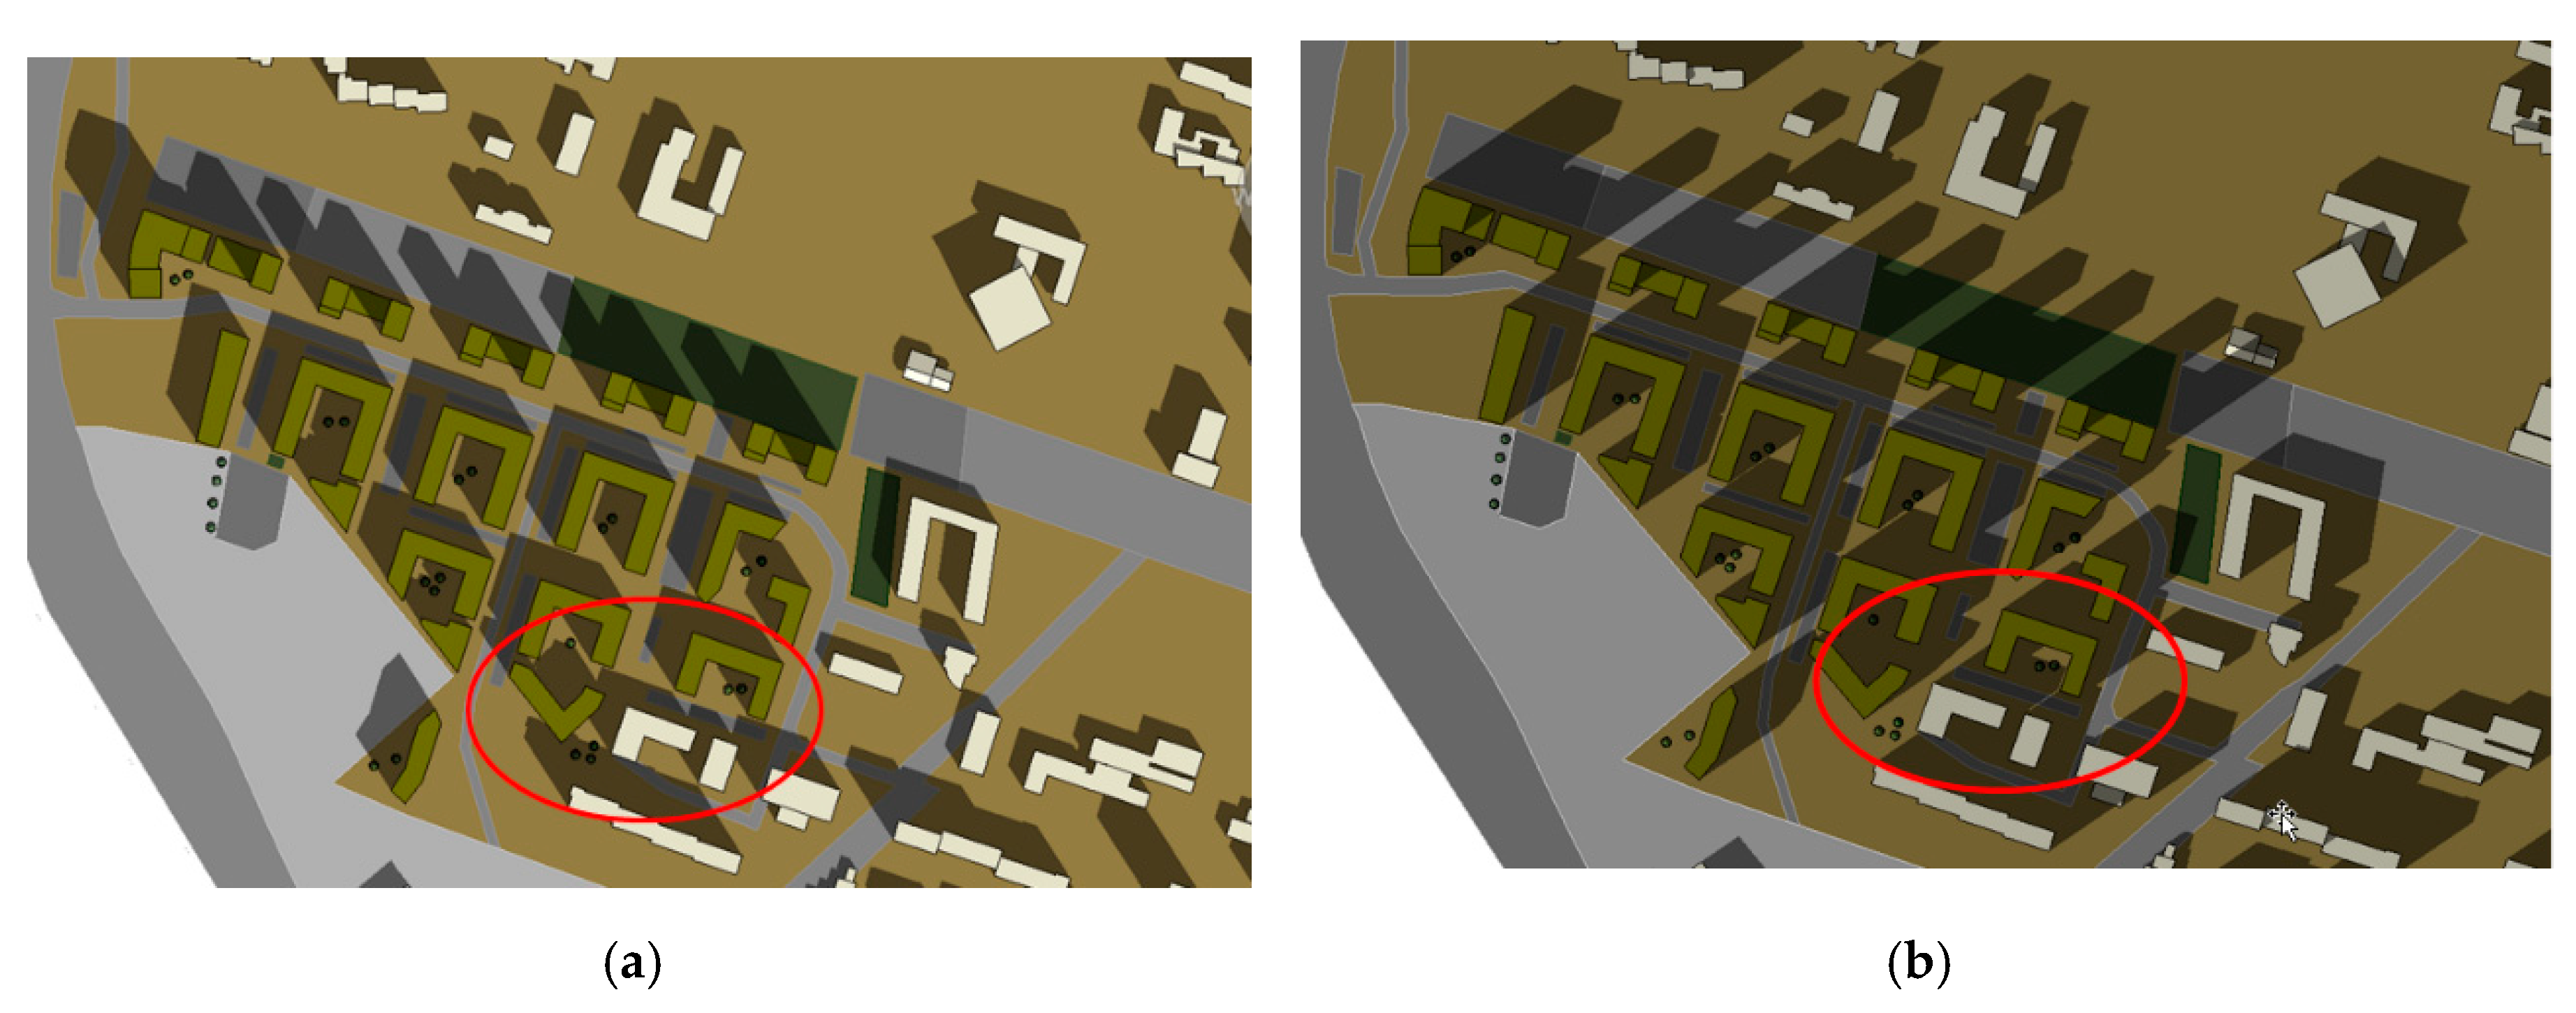
The initial simulation enables the analysis of the overall distribution of the impact of buildings in the test area, showing shadows cast by individual objects at different times of the day (
Figure 8). This allows to designate objects that are completely outside the shadowing area and select facades that are in a particularly disadvantaged position and are obscured for much of the day.
The diagram above shows the simulation result for Example 1 as of 21st March at 10 a.m. and also at 3 p.m. On the basis of the generated shadows, it was inferred that the erected buildings do not unduly obscure the adjacent buildings at that time, but do affect one other including the space intended for recreation, which at all times is obscured by the building located on the southern side.
In the case of a dense, high-rise development, a general analysis covering the whole of the estate may not be sufficient to justify access to the required amount of daylight. Then it would be necessary to analyse the sunlight in relation to individual facades.
Figure 9 and
Figure 10 indicate a section of the building that remains darkened from 11:00 a.m. for the rest of the day, although it is facing south. In accordance with the provisions of the Regulation [
28] “rooms intended for the collective residence of children in the crèche, kindergarten and school, with the exception of chemical, physical and plastic workshops, should be provided with a time of sunshine of at least 3 h on the days of the equinox (..) from 8 a.m. to 4 p.m., while living rooms from 7 a.m. to 5 p.m.” In the multi-room apartment located in the downtown building, it is permissible to reduce the hours of sunlight to 1.5 h, and for a one-room apartment no minimum hours of sunlight are specified.
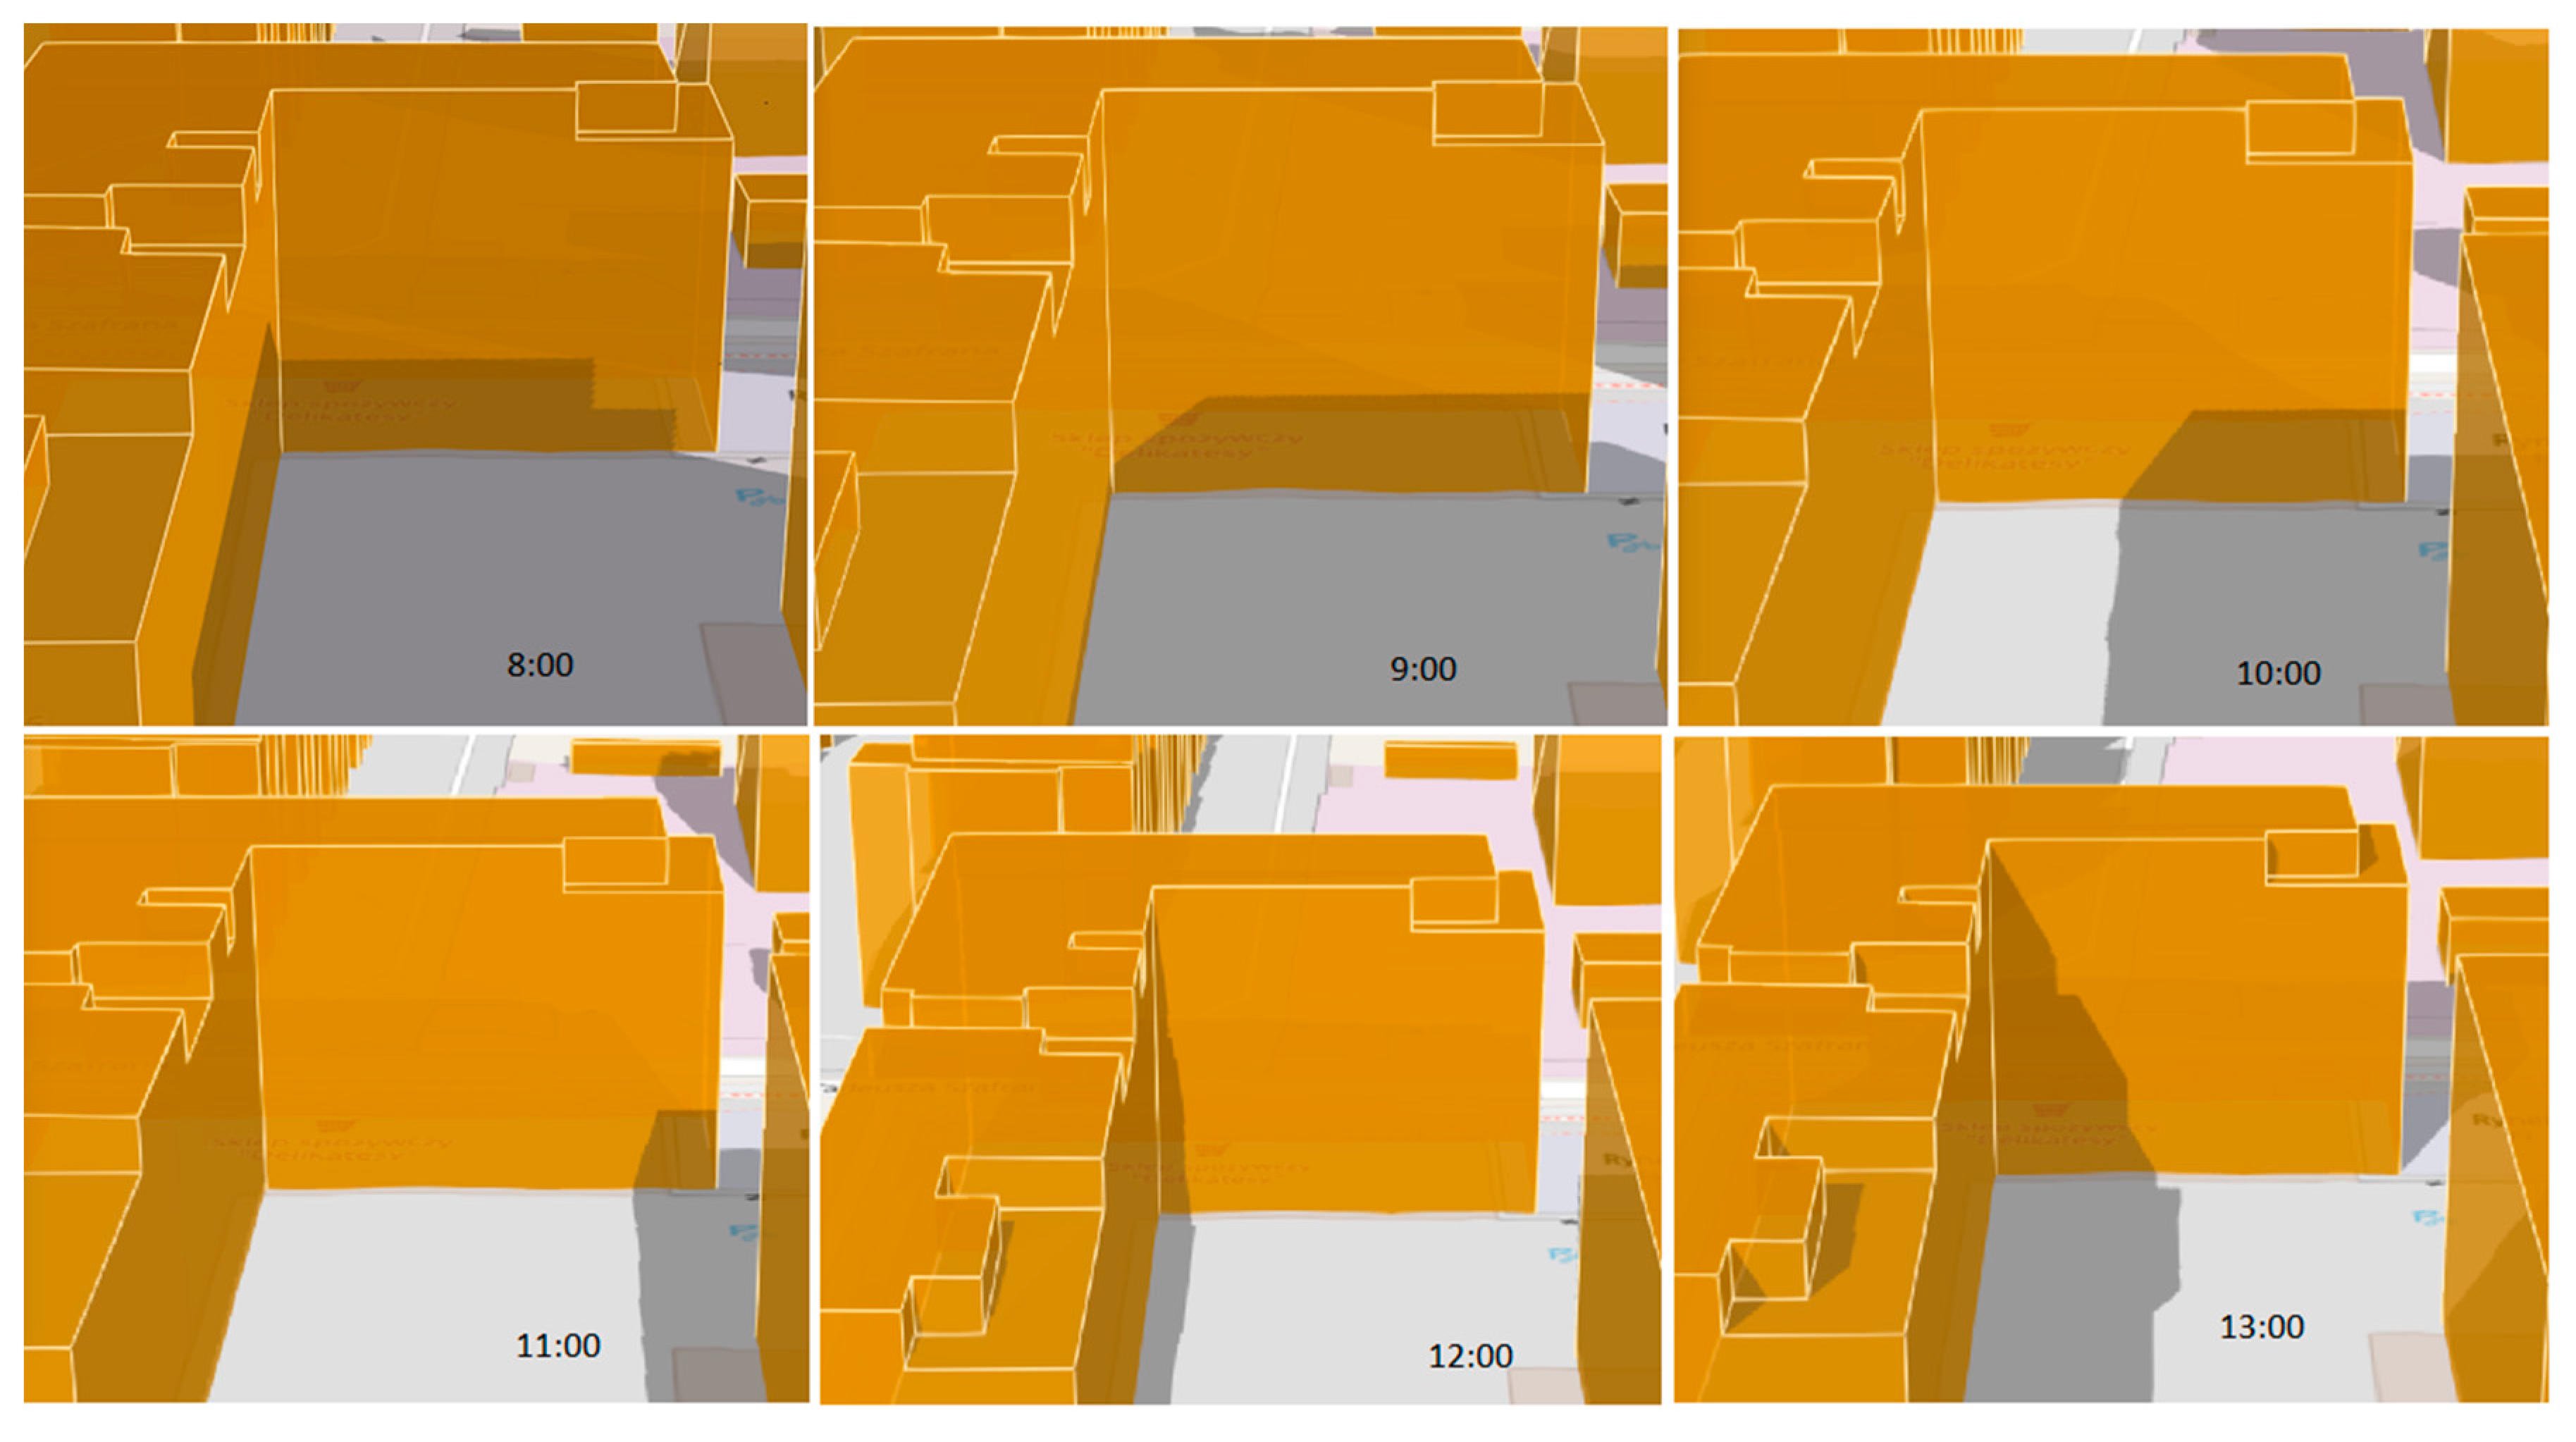
When analysing the hours of sunlight, the model of the southern facade of the worst-located building in Example 1 (
Figure 9) was created and the simulation of the sun was carried out for between eight and 13 h. As a research object, the windows located in the least favourable position on the ground floor were chosen, close to the corner of the building. Analysing
Figure 9, you will notice that the corners of the building benefit from maximum sunlight from 9:00 (when the shadow cast by the adjacent block subsides) until 12:00 (when the sun passes to the other side of the building).
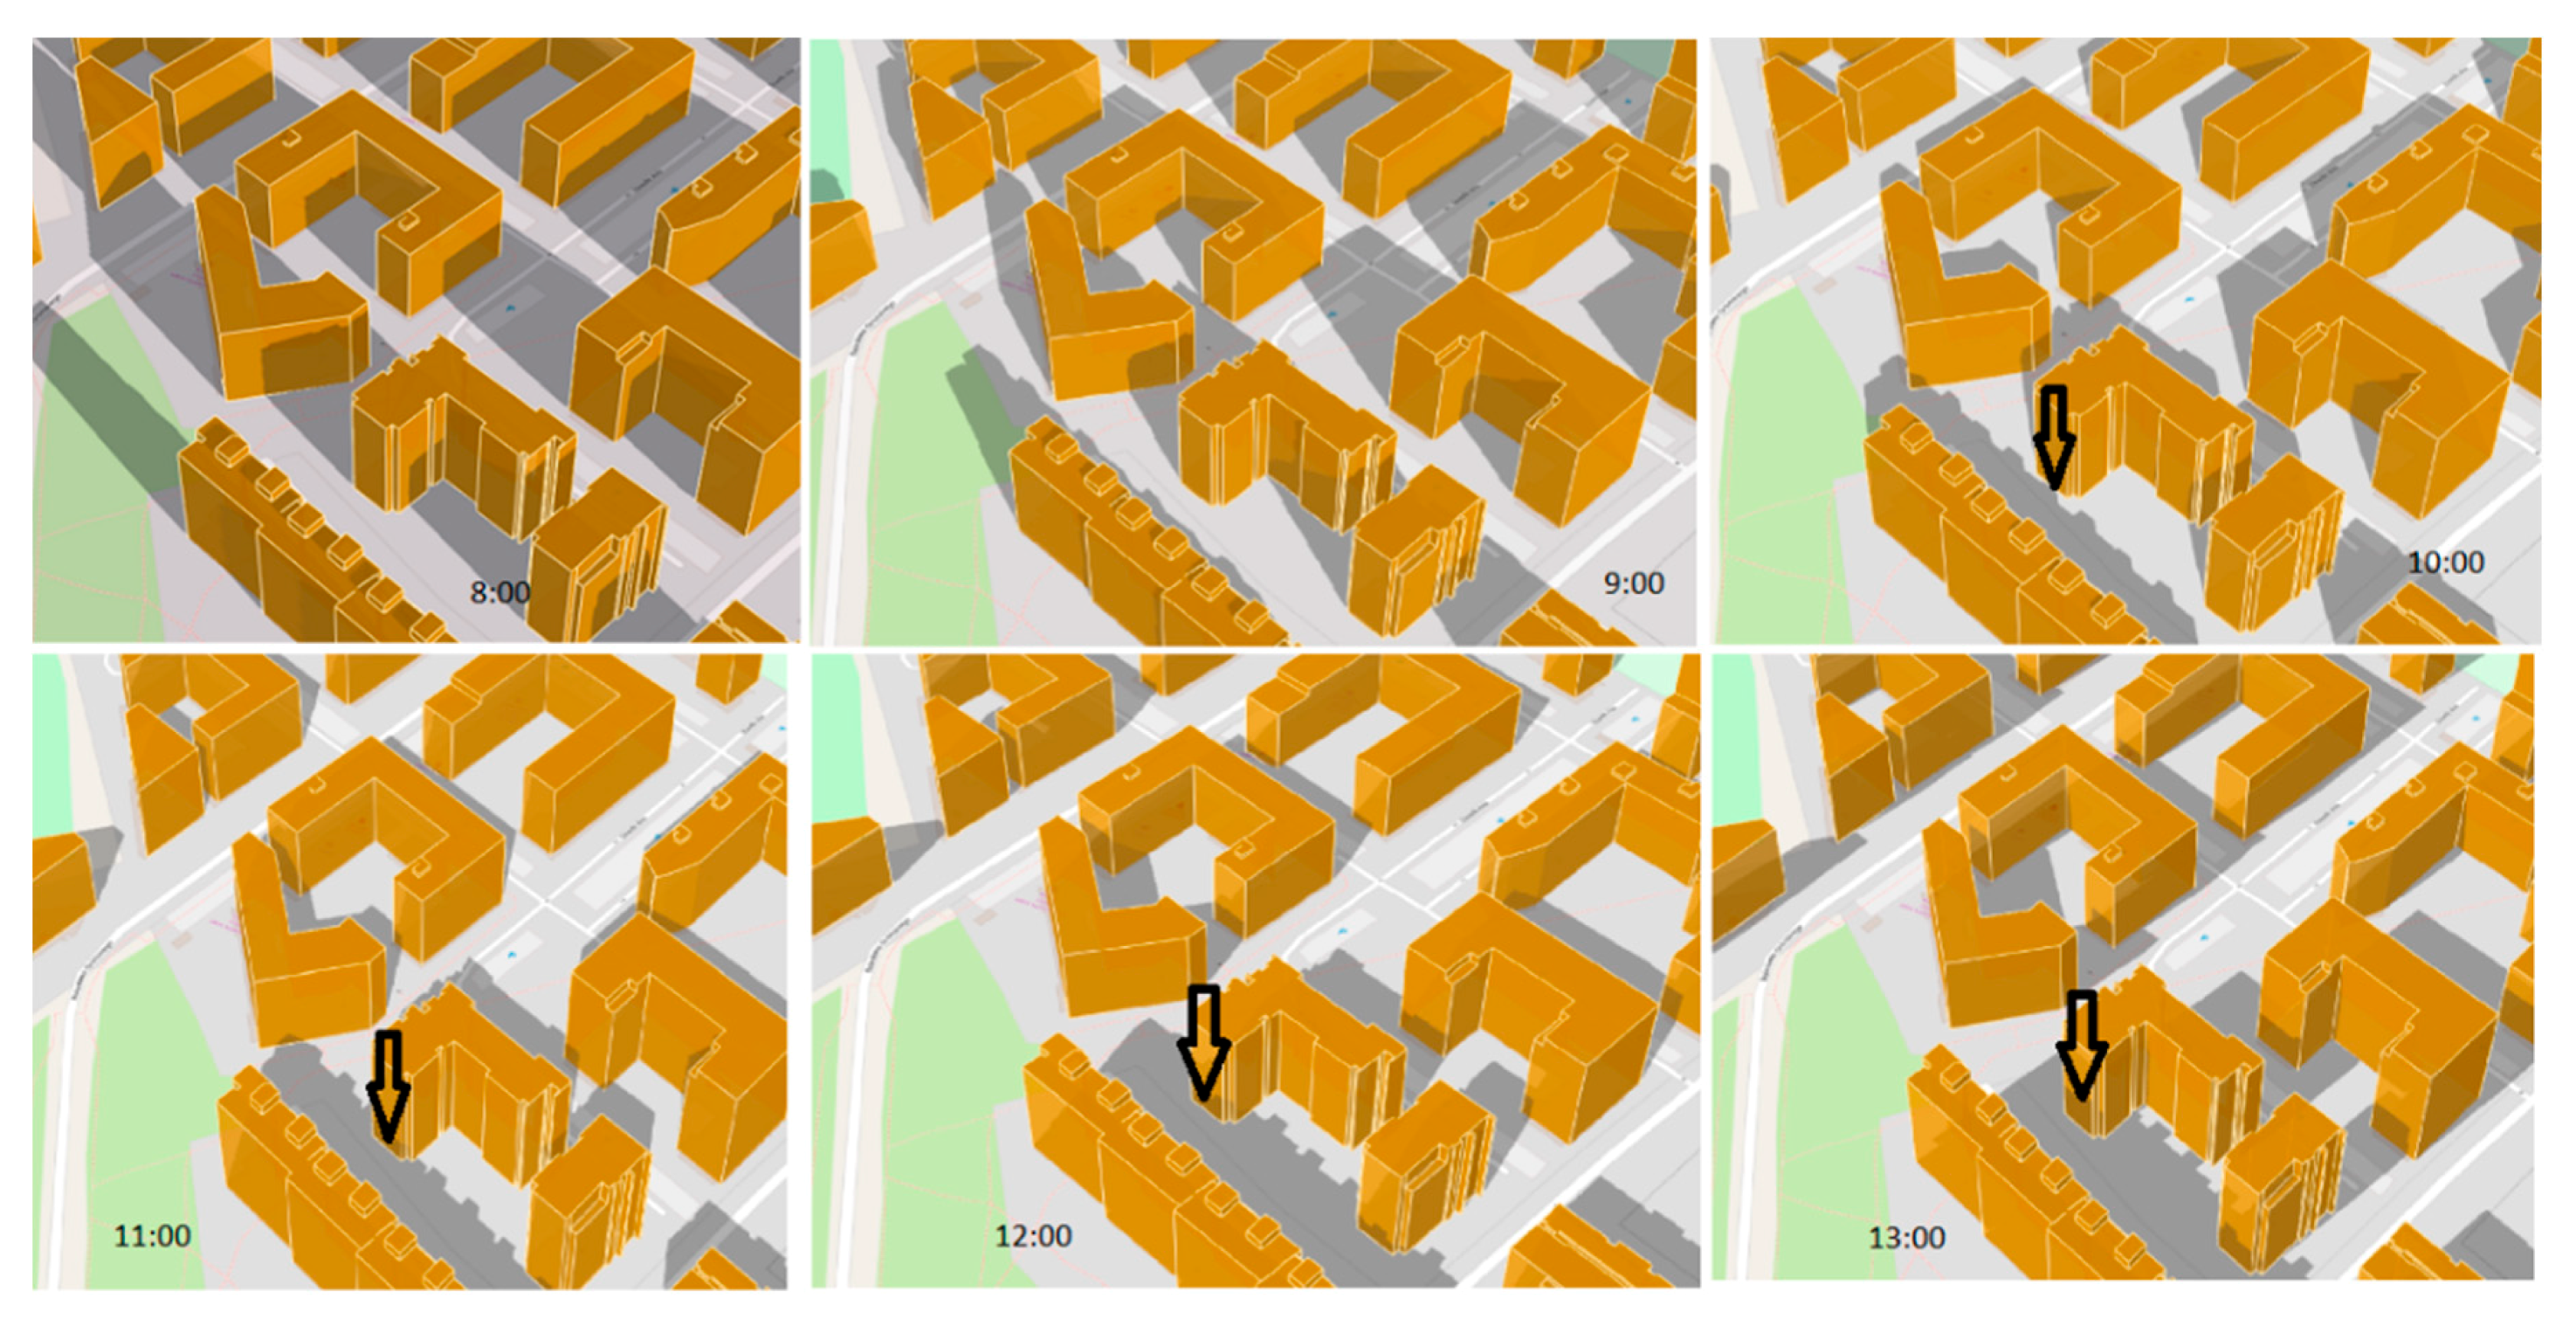
A similar analysis was performed for Example 2, (
Figure 10a,b). Within this development, the south-eastern section of the estate and the facades inside the courtyards of each U-shaped segment remain in the shade for most of the day due to dense, high-rise buildings. It is worth noting that the 15-storey buildings generate a particularly large shade zone, overshadowing an area dedicated to public greenery and a place of recreation; in the afternoon this shade zone covers the opposite side of the runway, where it obscures the existing building and the proposed location of other buildings within the same investment. Analysing this area of the development (
Figure 11), it is possible to see that part of the south facade (marked by an arrow on
Figure 11) is within the shadow of another building as early as 10:00 a.m. and remains in the shade zone for the rest of the day.
The developer of Example 1 offered prices from 4500 PLN (1011 euro) to more than 10,000 PLN (2248 euro) per square metre [
24] during the sale of apartments on the primary market. This discrepancy was due to the diversity of the standard of housing. Within the development were premises of an average standard, without furnishings and fully-furnished apartments. This was intended to attract the interest of both people with an average budget and those wishing to purchase accommodation of a higher standard, complete with fittings and furnishings.
Average offer prices were more than 6000 PLN (1348 euro) per square metre, which was close to the average unit price in Krakow at the time. It should be noted that, despite the use of modern, ecological solutions, the prices of typical apartments at the construction stage did not differ significantly from other developments in the city; this means that it is possible to use funds effectively to create a space that is part of the ideology of a smart city and accessible to the average population. Awareness of this on the part of developers and buyers is essential.
Ready-to-use apartments, despite their higher than average prices, enjoyed considerable interest. Although Poles prefer apartments at the construction stage on the real estate market, there are more and more buyers who value time and who expect to purchase ready-to-use housing. These are mainly buyers of premises for investment purposes and people buying second and subsequent apartments, who are aware of the logistical challenge of finishing the apartment.
House prices on the primary market in the initial stages of Example 2 investment were below the average prices of apartments on the market at a similar time. Some developers, wanting to meet the demand for apartments with a lower than average unit price for the city, have focused on the rapid construction of developments of average standard and densely populated. This may result in a lower quality of investment.
3. Results
For the purpose of analysing the transaction prices of the primary real estate market [
26,
29], a section of the database of the Register of Prices and Real Estate Values for the districts of Podgórze and Czyżyny, covering the period from September 2016 to August 2017 was obtained, in which the sale of apartments in both Example 1 and 2 was carried out. The data obtained from the register were compiled, outliers were eliminated and each property contained in the database was described in terms of the following characteristics: area, floor, number of chambers, unit price [
23].
The following are the numerical characteristics of the database. After rejecting outliers and incomplete viewings, approximately 1000 transactions were separated across the district, of which 166 were from Example 1; 1299 transactions occurred in the second selected district, 375 of which involved Example 2 investments (
Table 1). On the basis of the database created, a number of statistical analyses were carried out on data sets from individual investments and entire districts in which they are located.
On the basis of the information available from the acquired database of real estate from the Register of Prices and Property Values, the attributes of the different apartments in the collection were distinguished [
24]. Due to the very similar location and surroundings of the properties studied, the features that were distinguished were: the area, the number of rooms and the number of storeys. An additional attribute examined was also the transaction date. After providing basic descriptive statistics, a correlation coefficient between the attributes and the unit price was specified (
Table 2). These dependencies were calculated using the Pearson correlation factor, which is used to analyse linear relationships between the variables studied. The values indicated that factors of 0.05 were statistically significant.
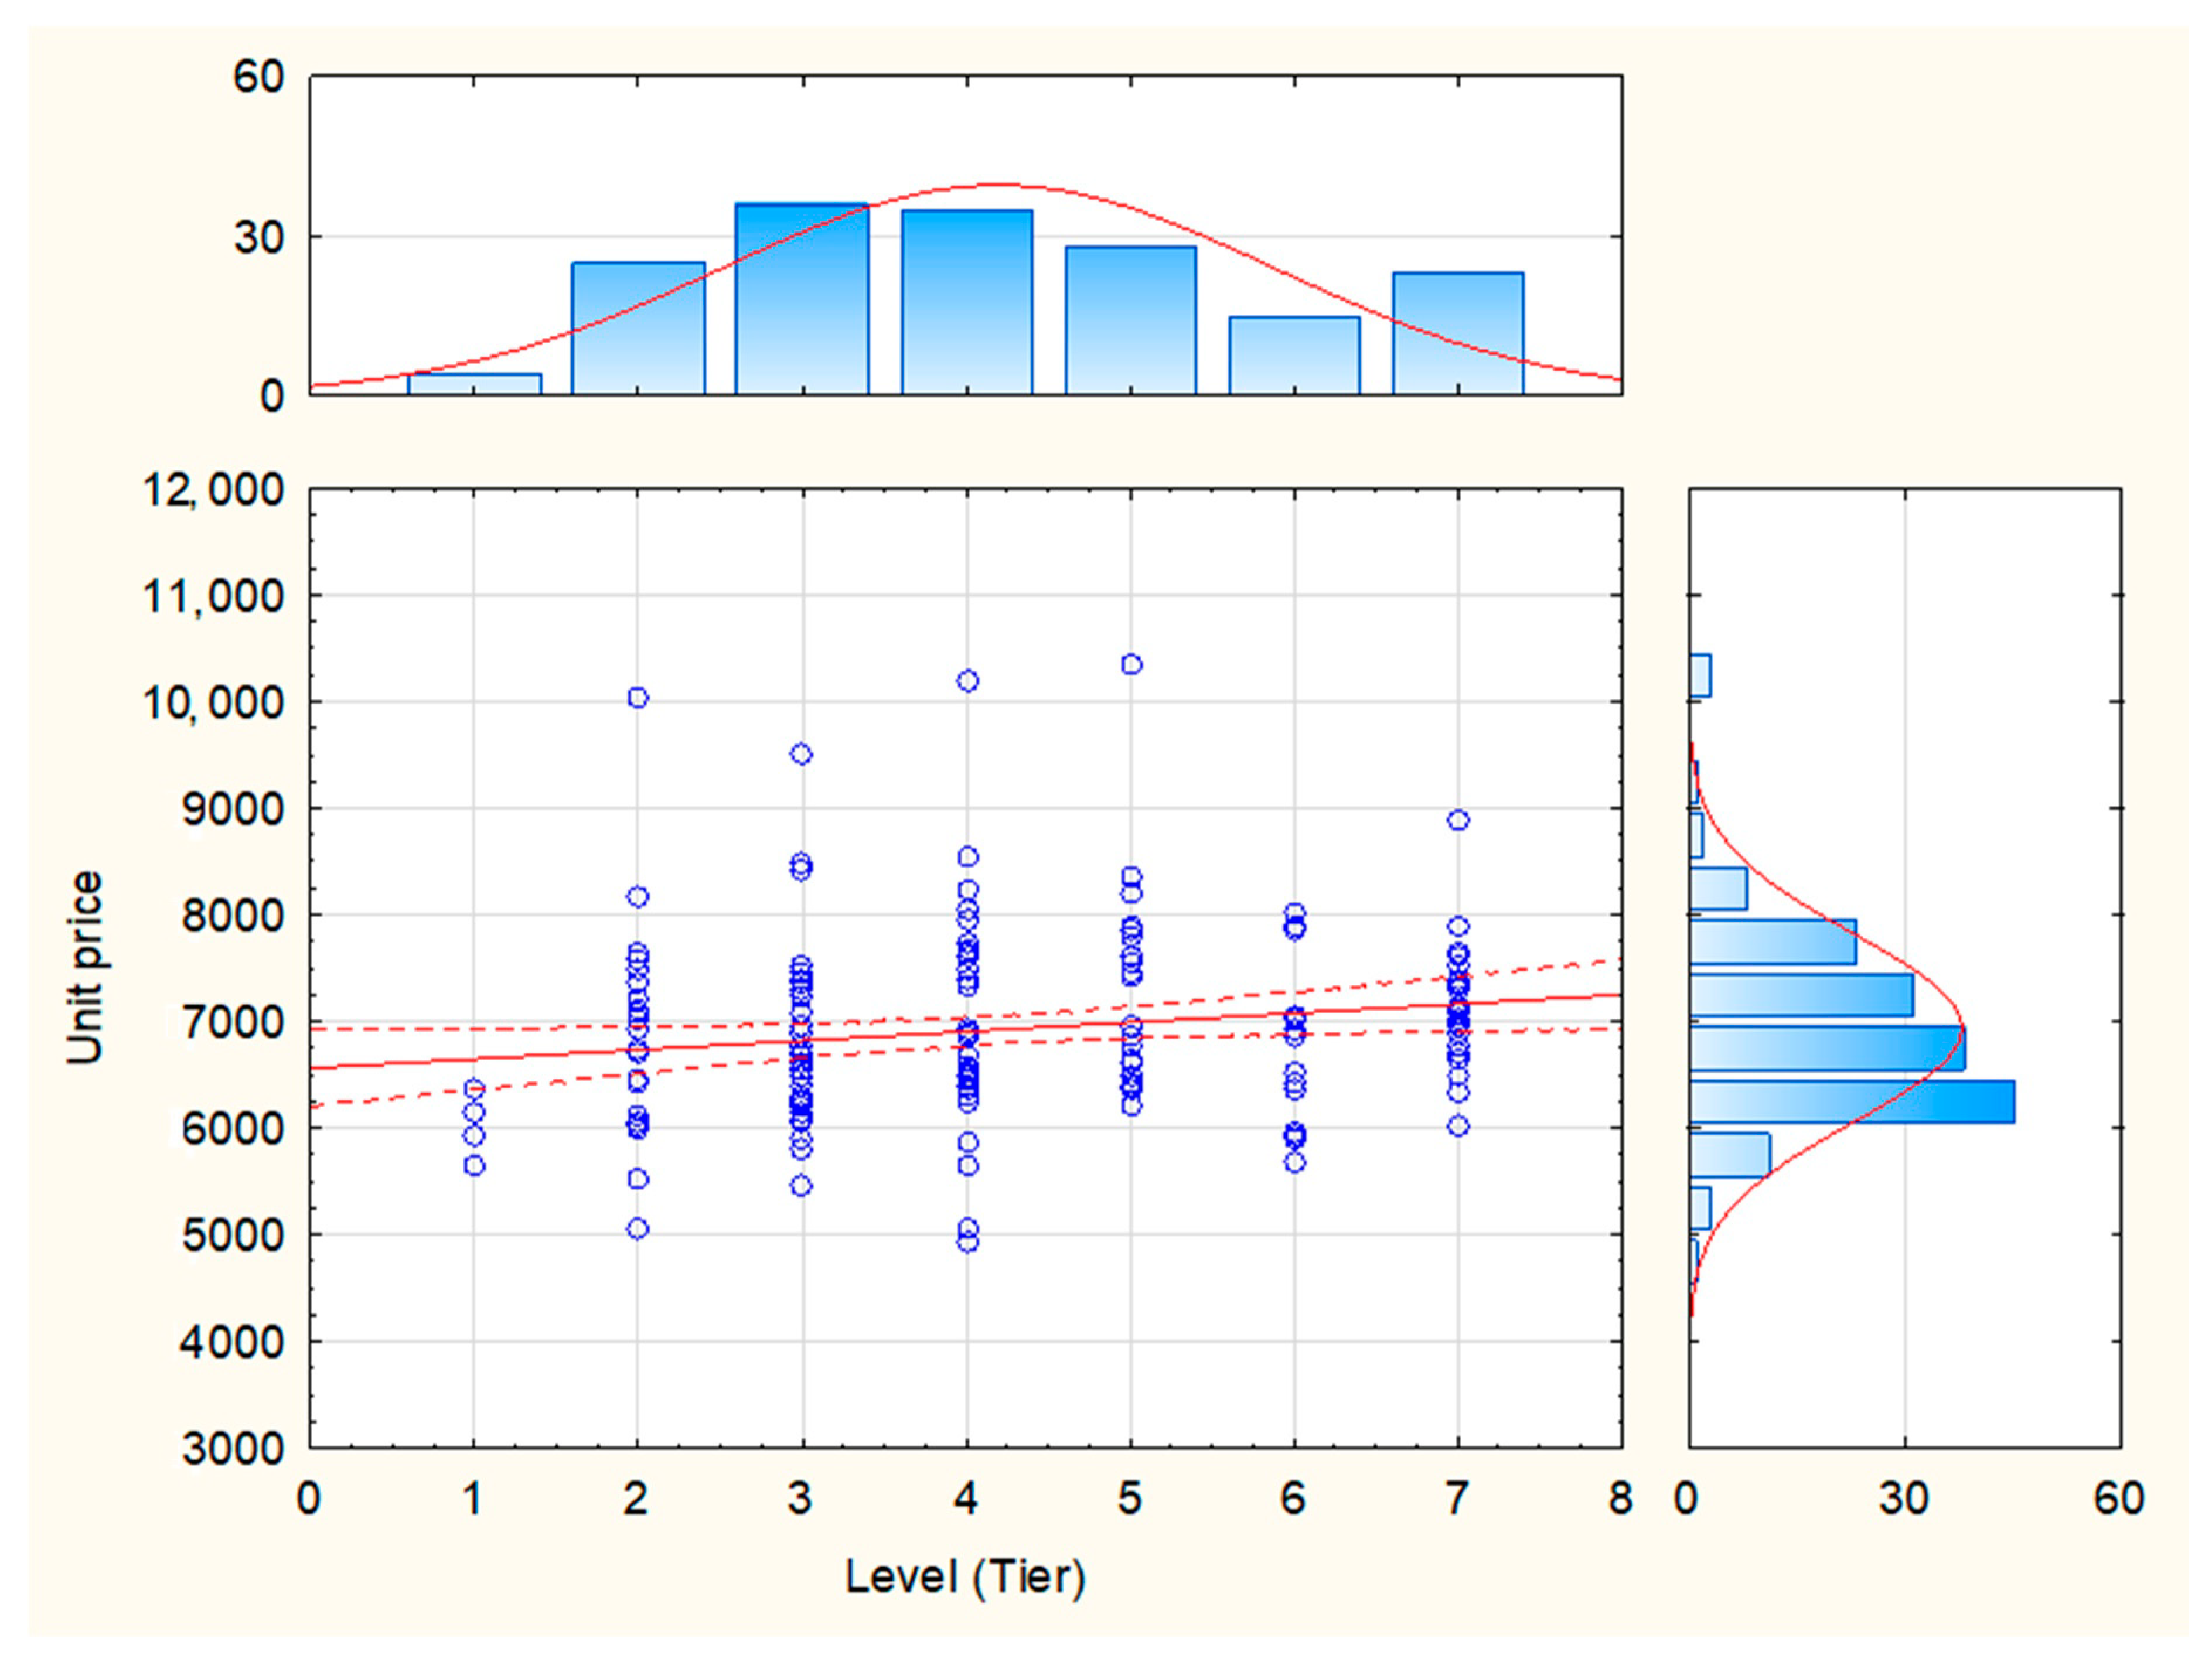
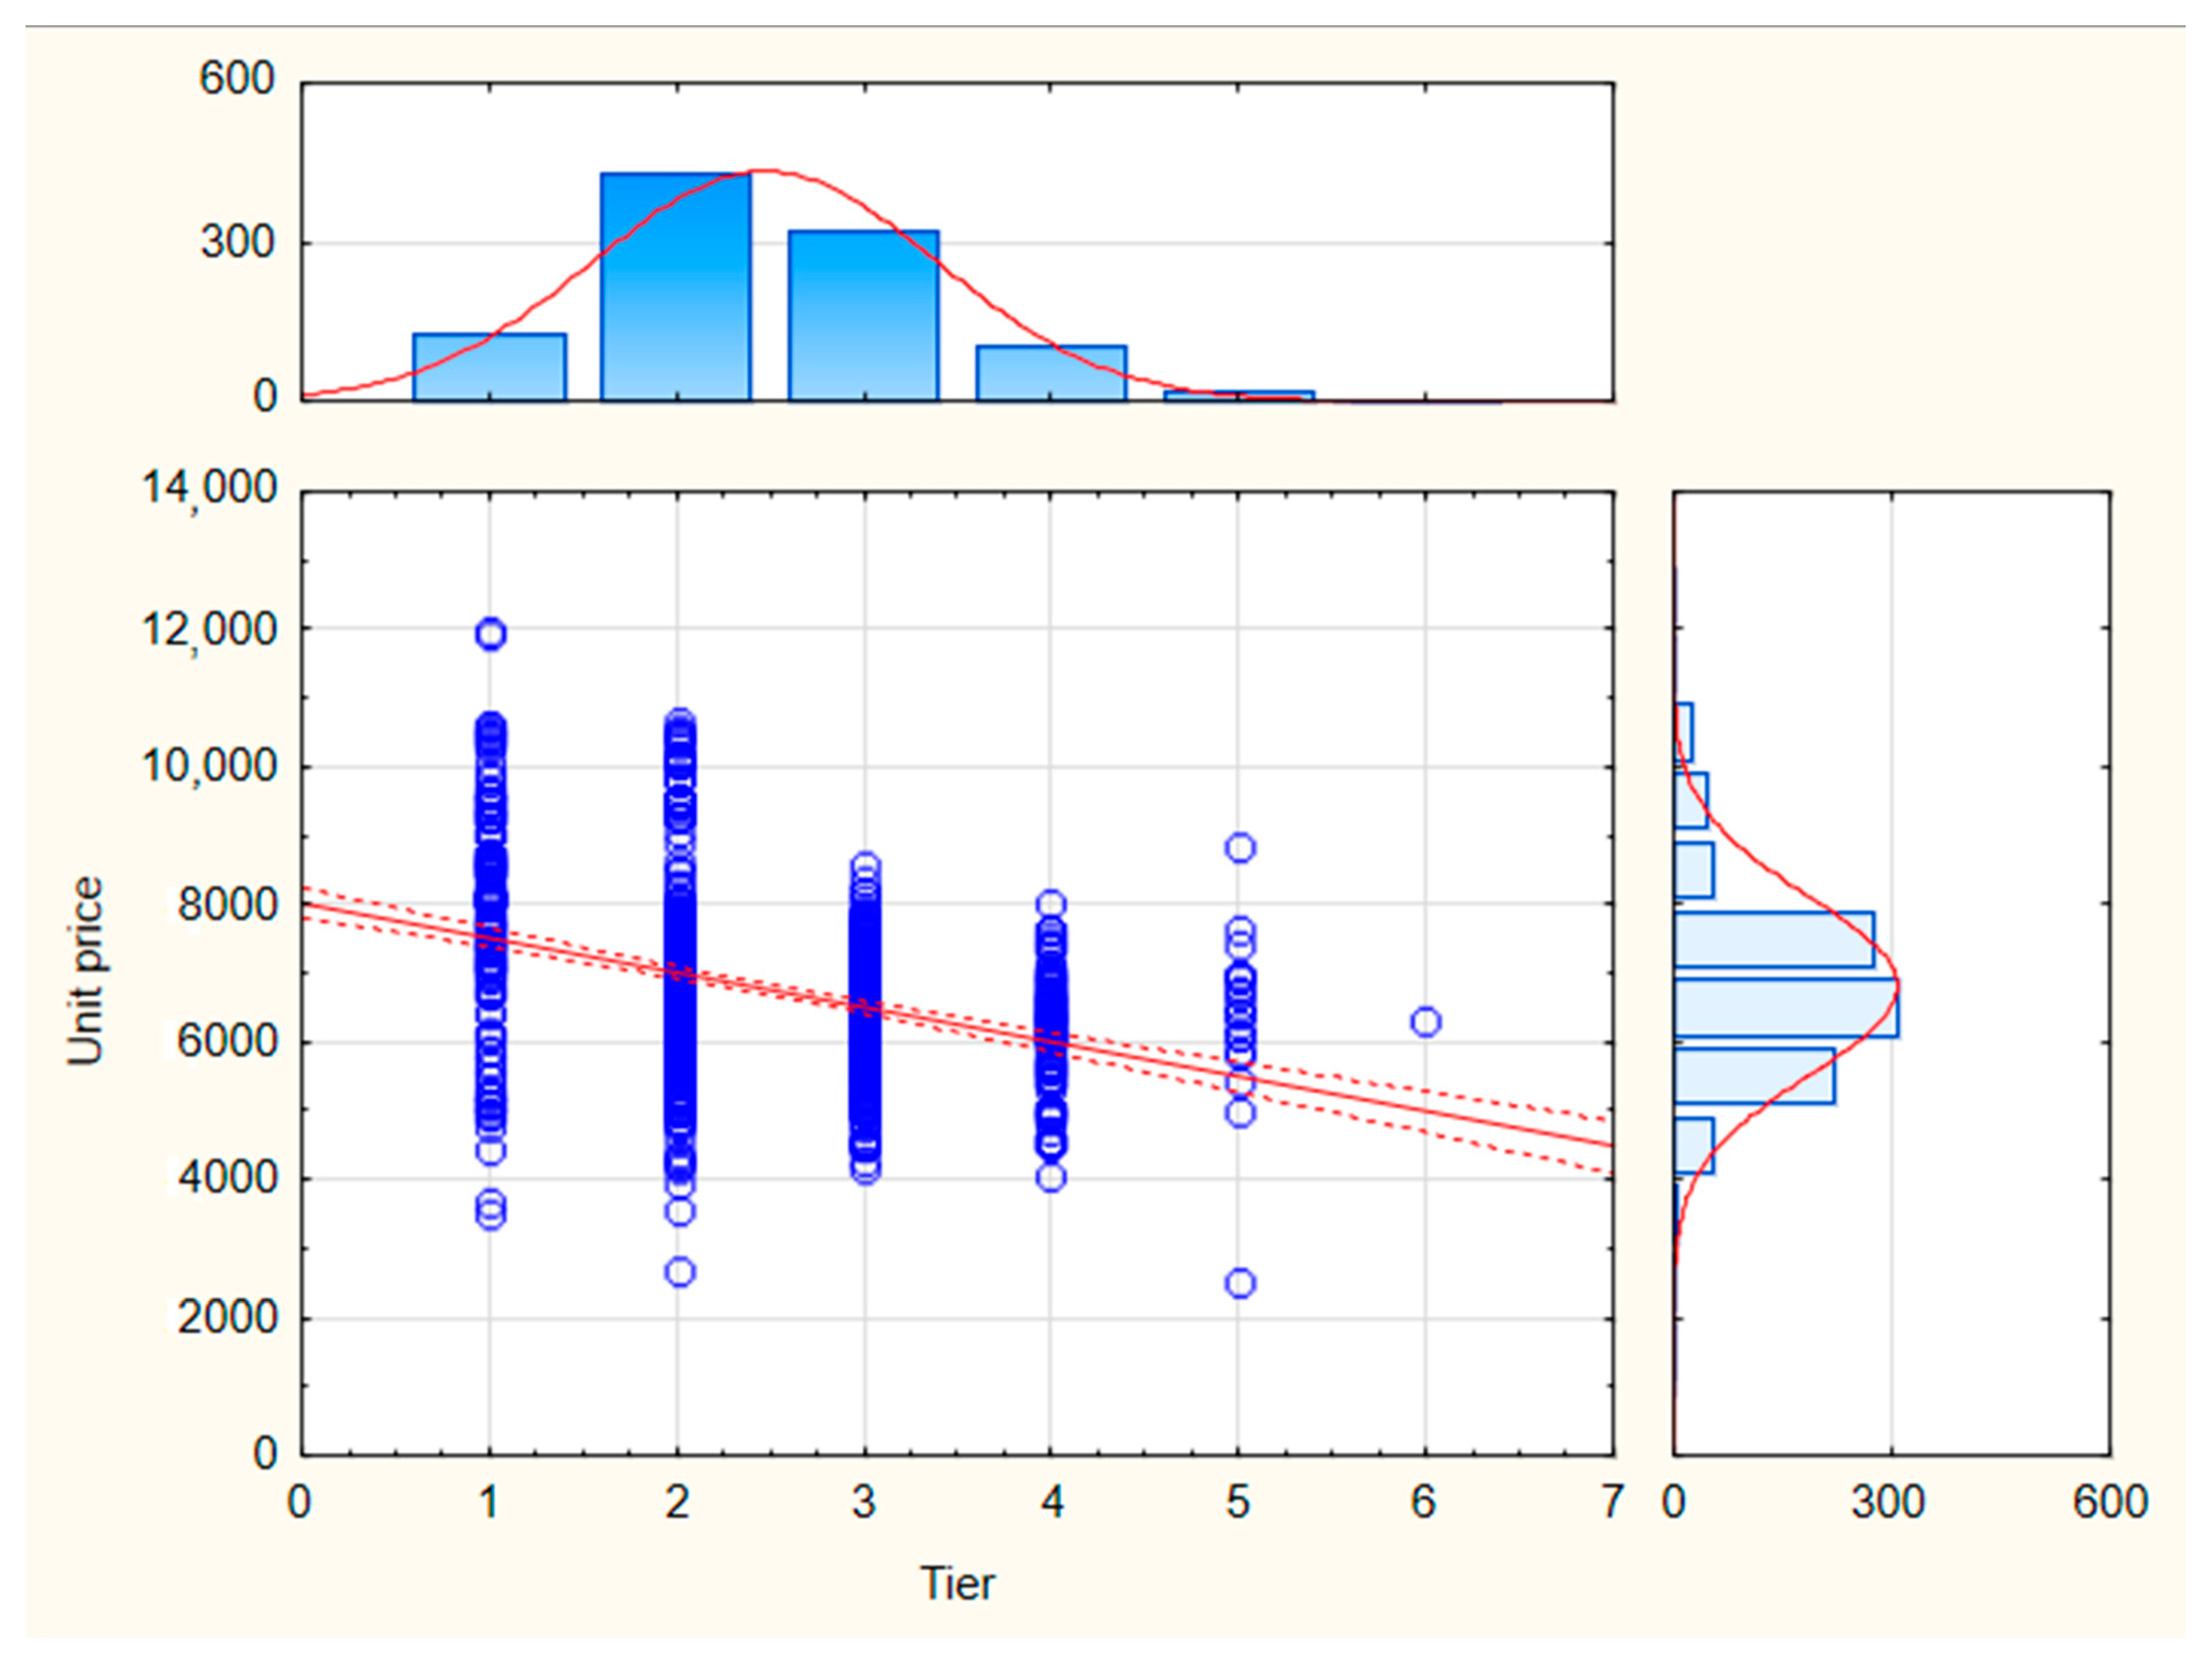
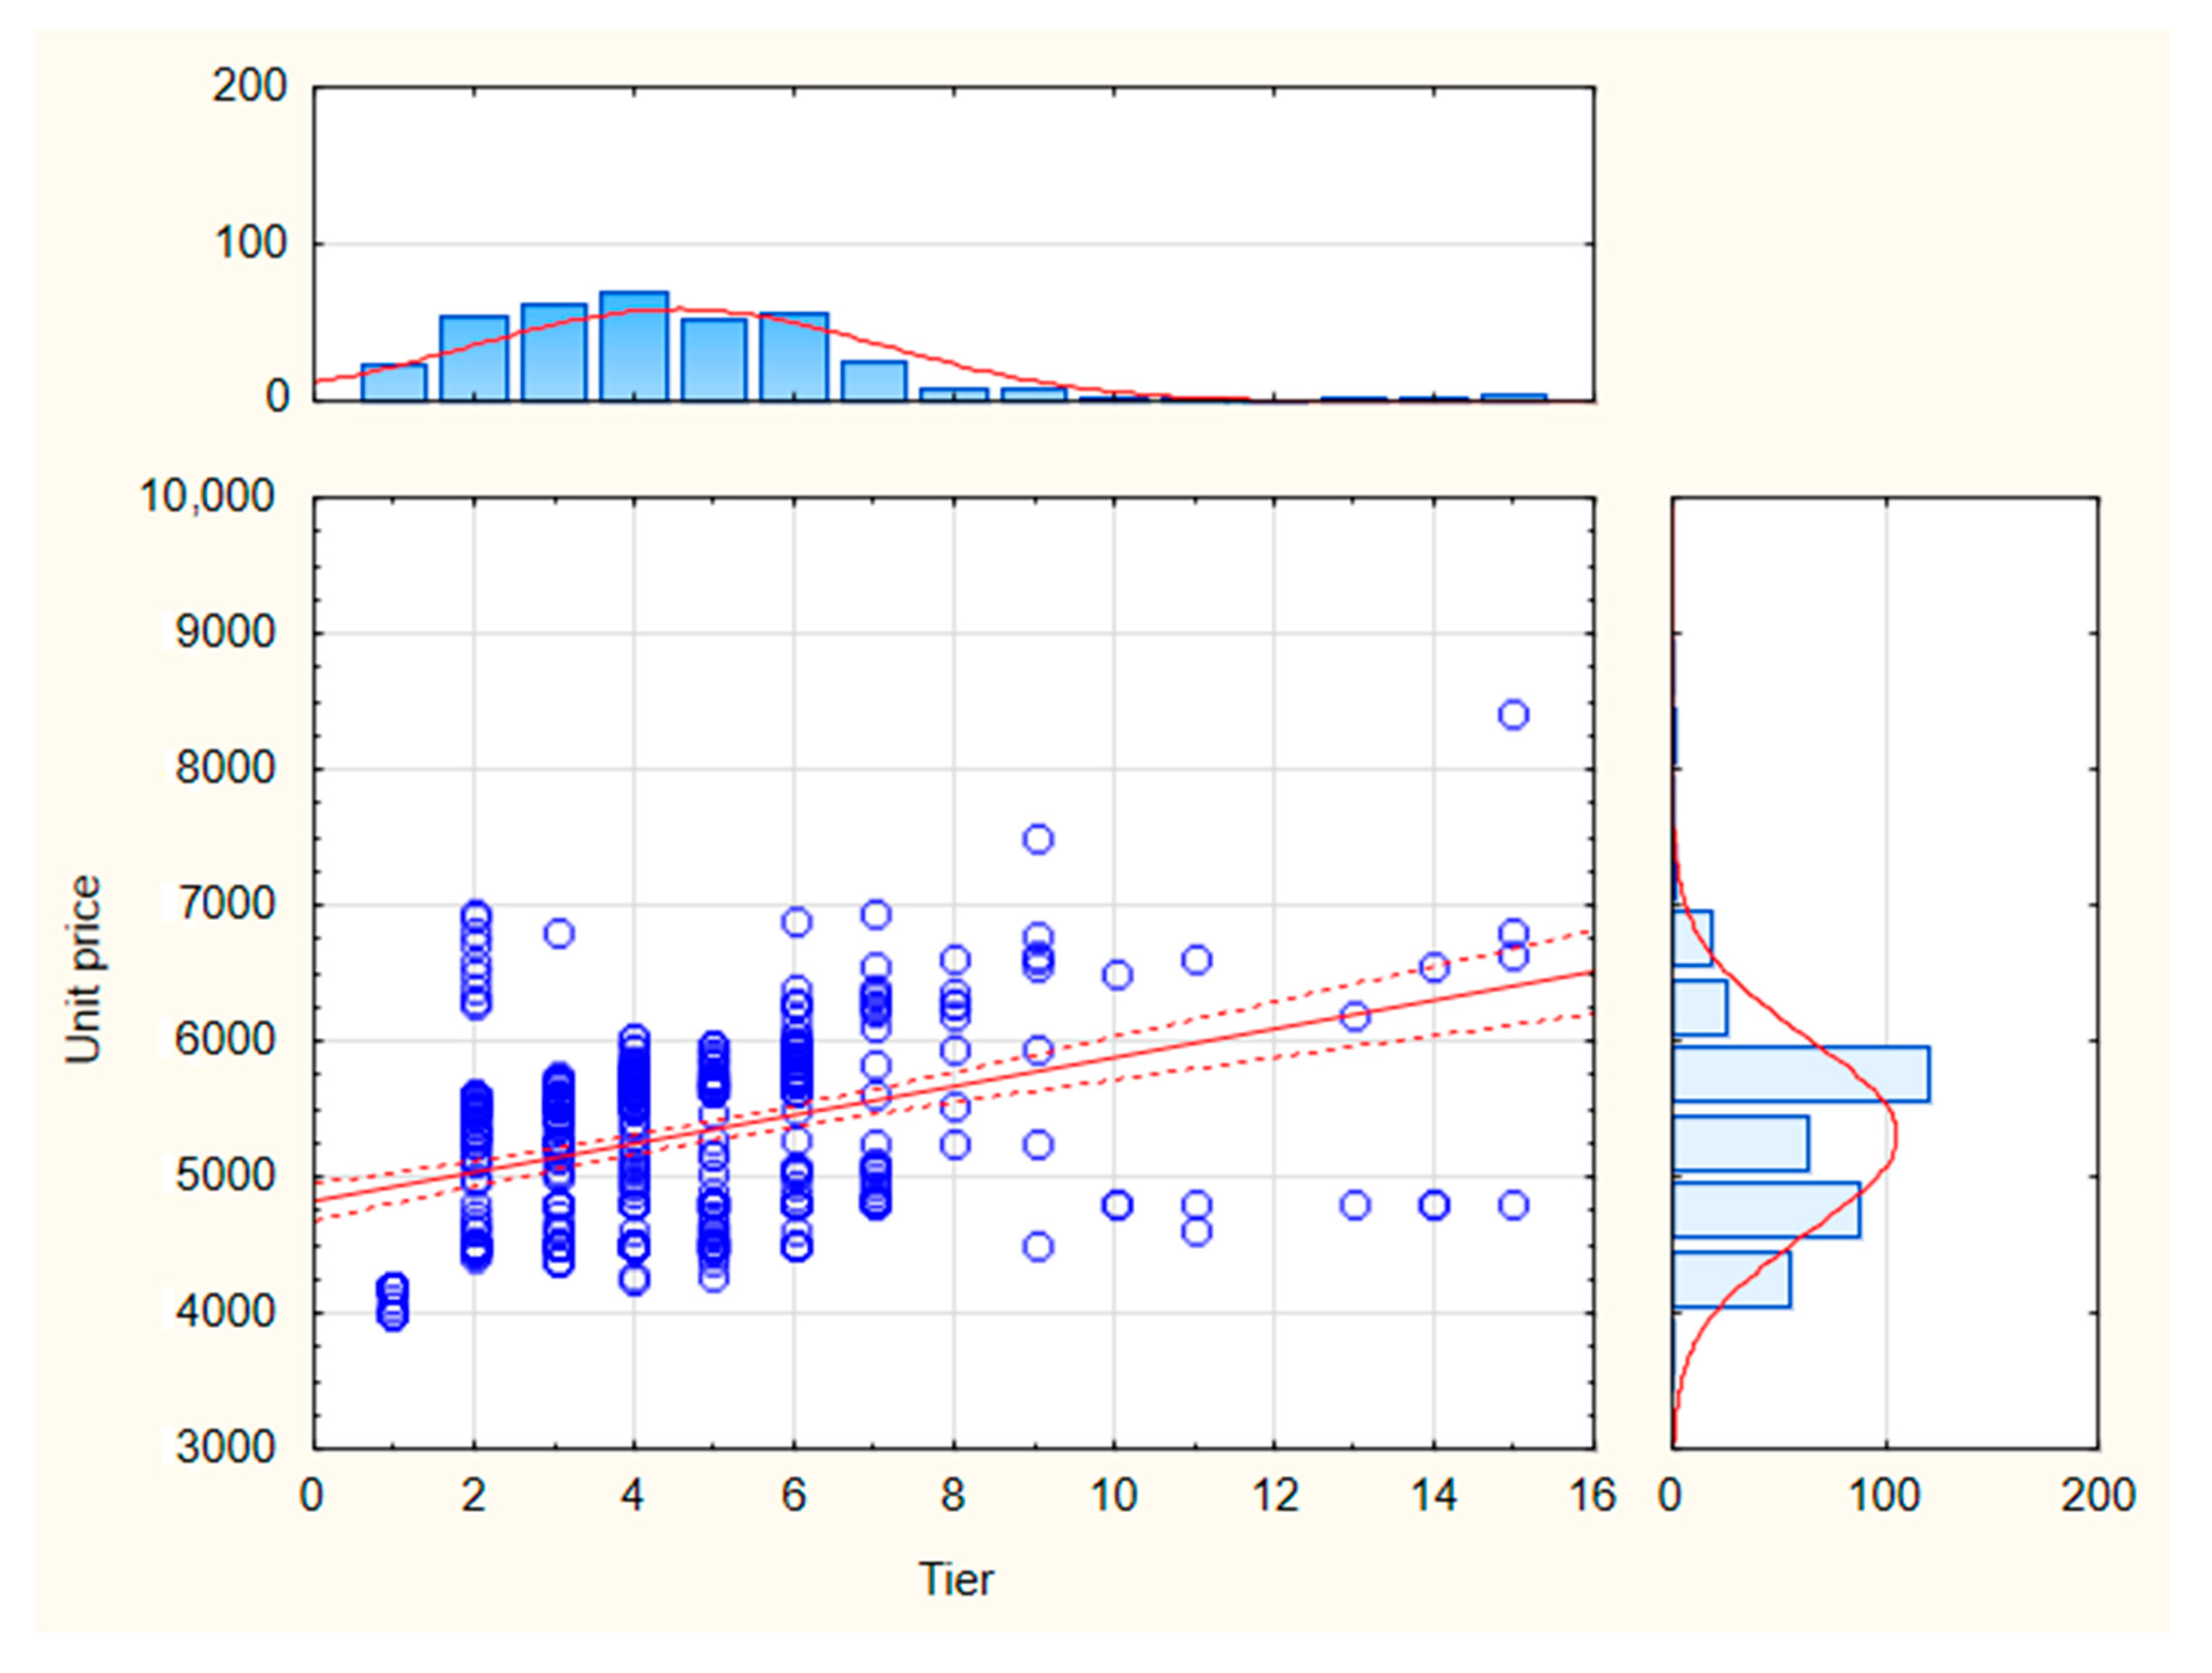
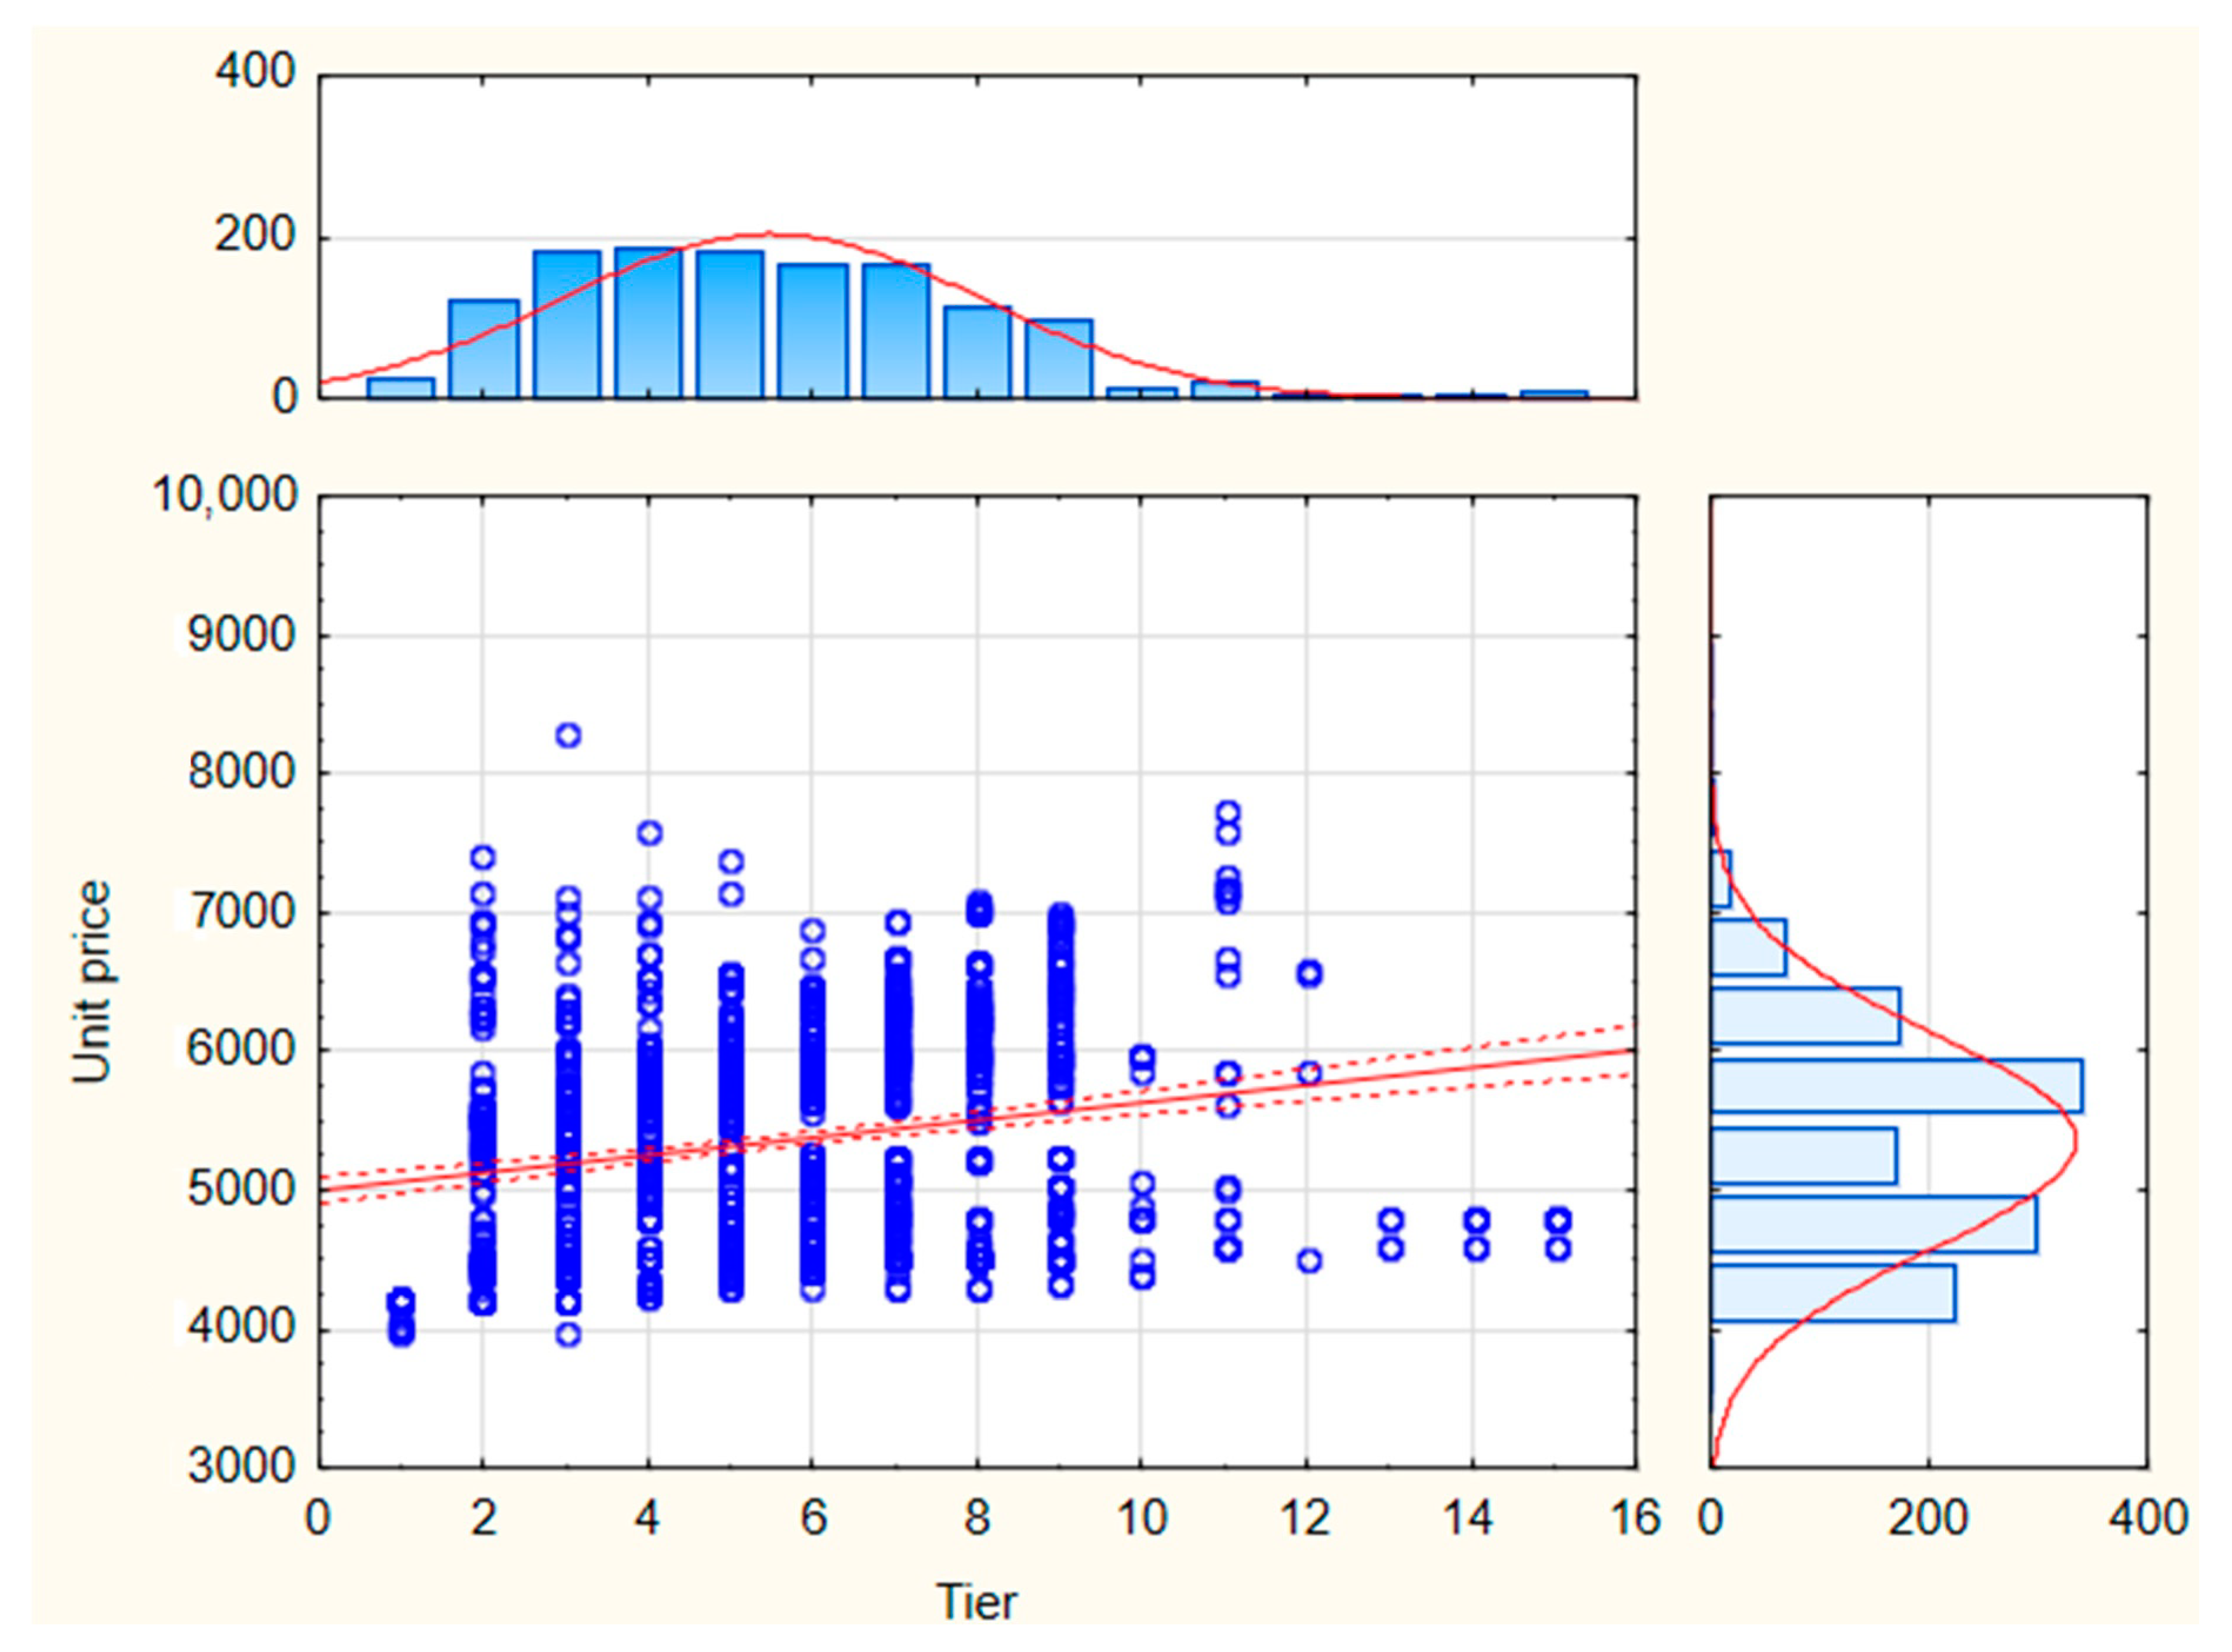
Detailed results of the survey of the relationship between tier and unit price are presented below (Example 1 and its surroundings
Figure 12 and
Figure 13, for Example 2 and its surrounding area, graphs are shown in
Figure 14 and
Figure 15) discussing the impact of each characteristic in the area of the investments studied and the whole district.
During examination of the relationship between the number of rooms and the unit price, a similar trend was observed as when the relationship between the area and the unit price was examined—a decrease in the unit price was found with an increase in the number of chambers; only in the Czyżyny district was this trend is reversed, however, the correlation coefficient was not statistically significant. This trend was most visible in the Podgórze district but on the basis of the analysis carried out, it can be concluded that in this area, the unit price was highest for one-room properties with a small area. In this district, there is also a negative correlation between the floor on which the premises are located and its unit price. In this case, the trend is reversed, the higher the floor, the lower the price. This is not due to the mutual shifting of the buildings, more to associating high-rise buildings with the inconvenience of too many inhabitants per square meter of housing estates [
30].
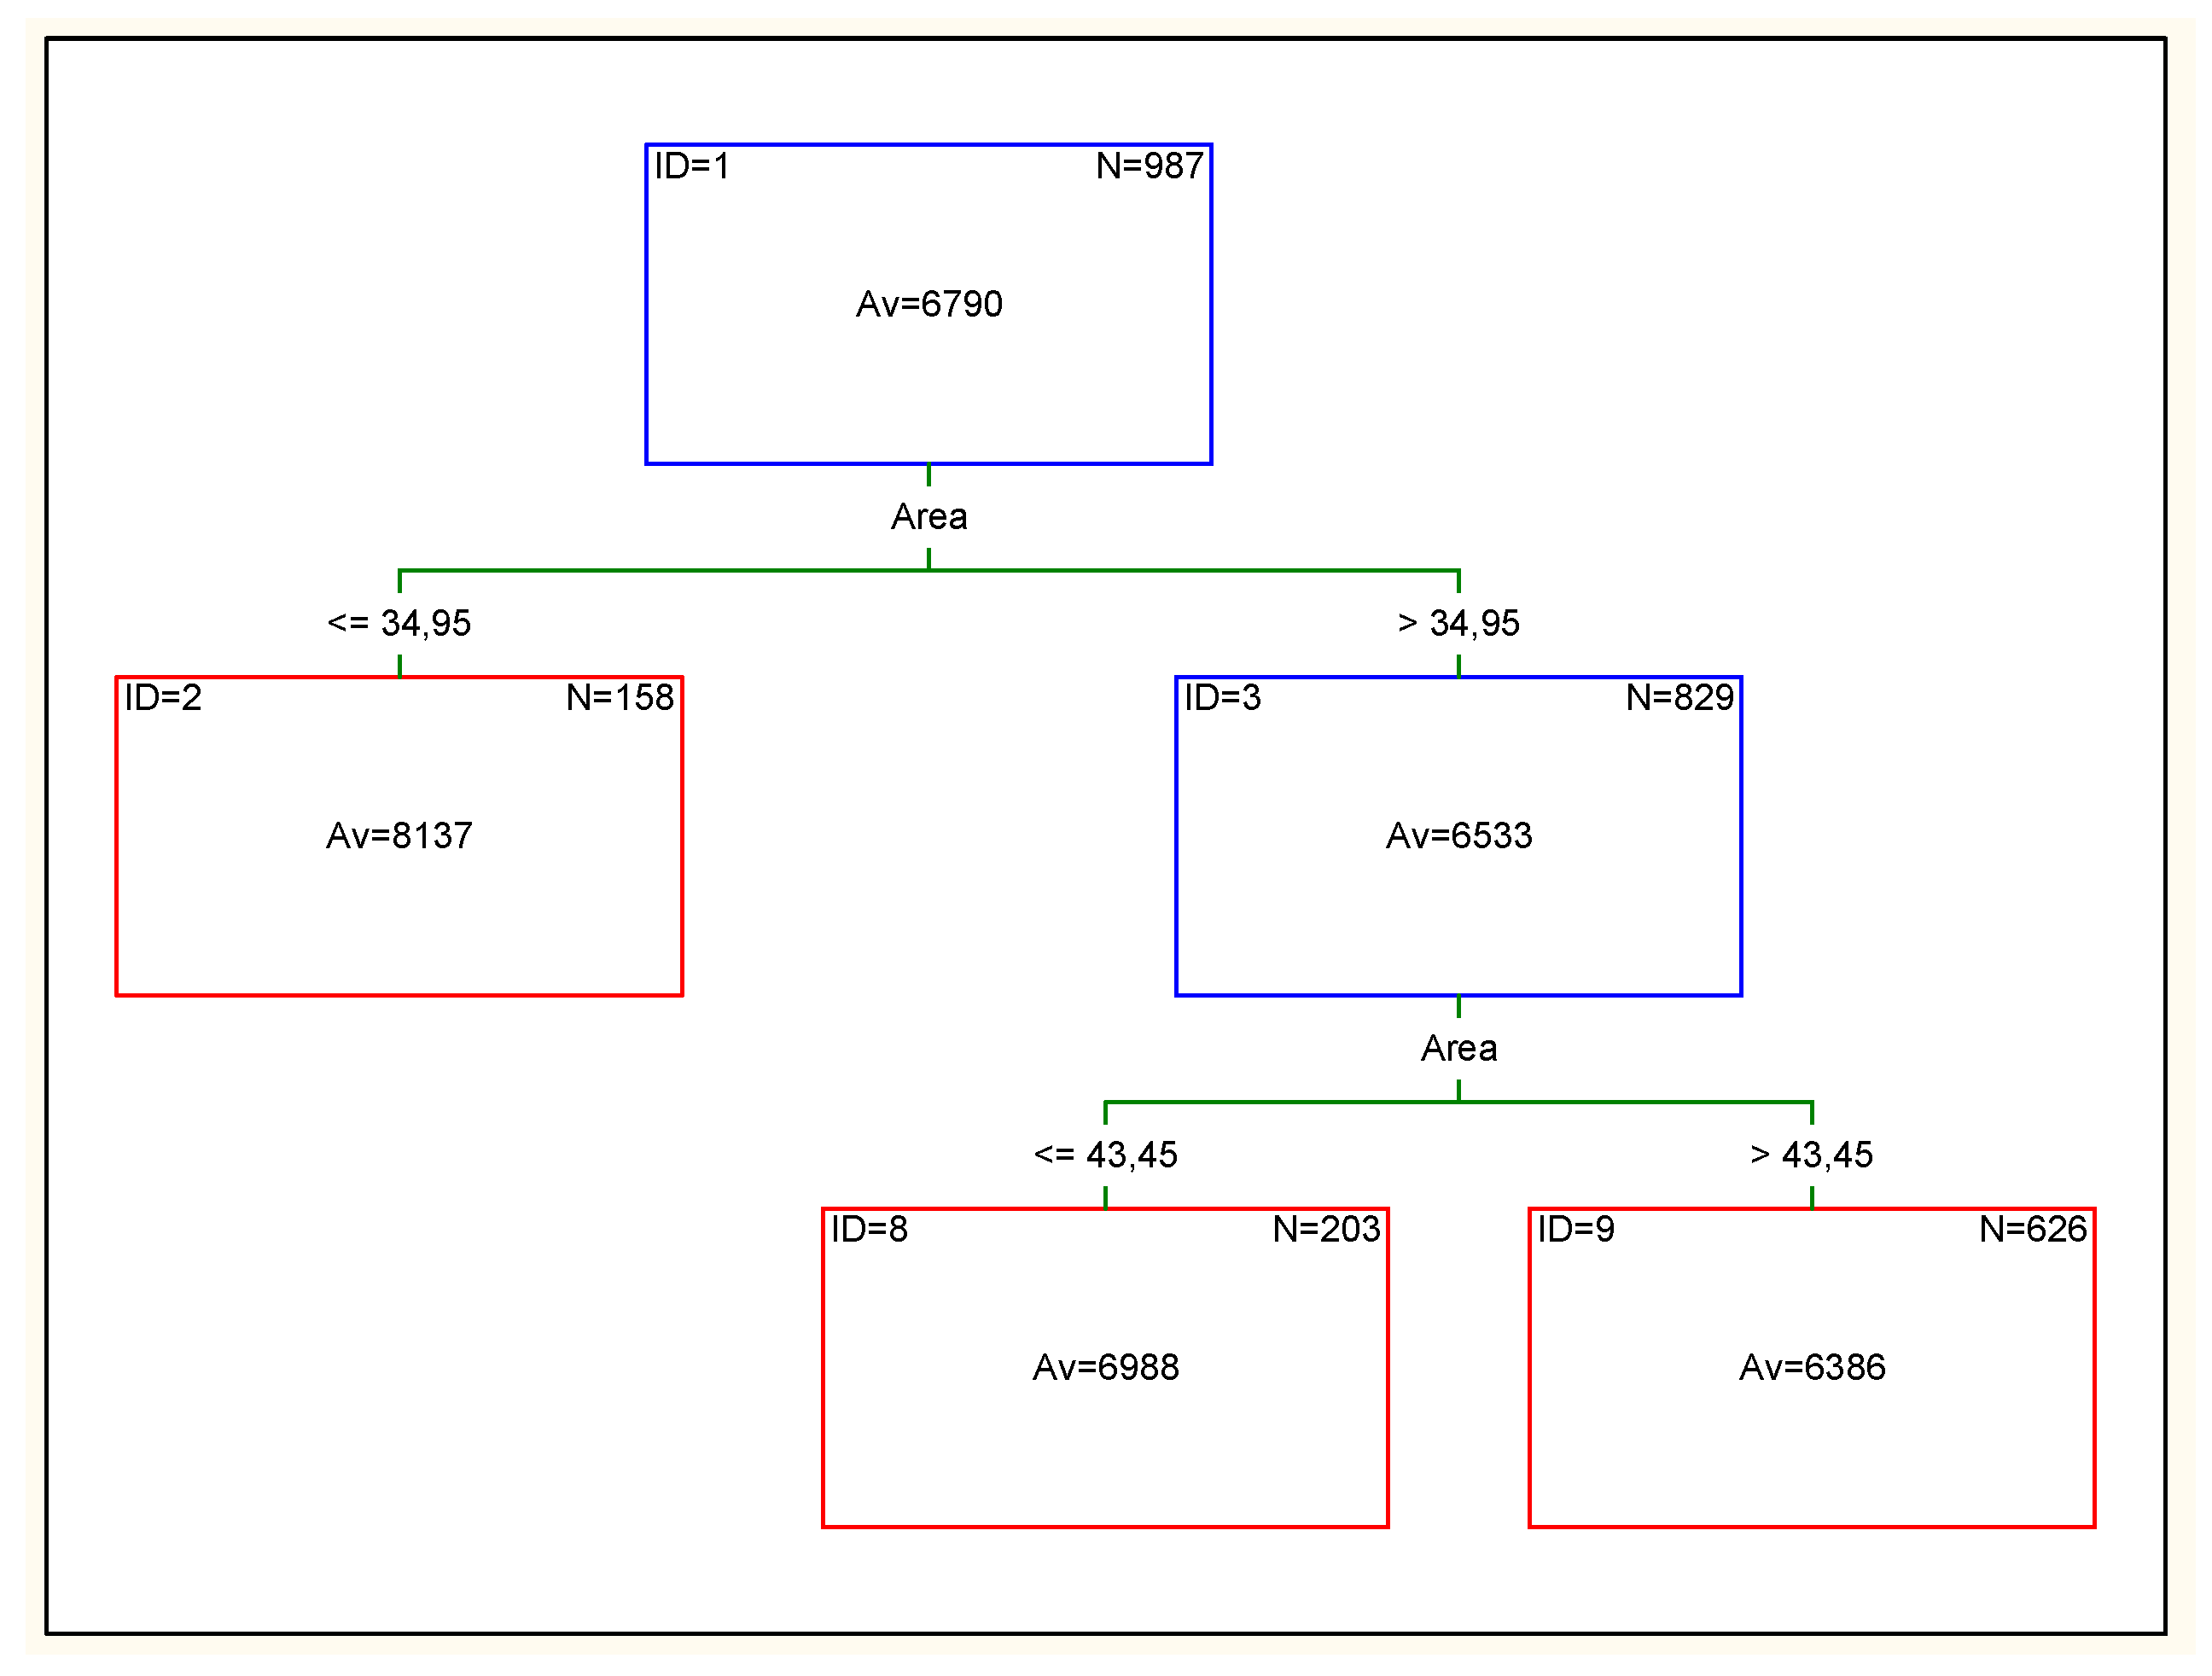
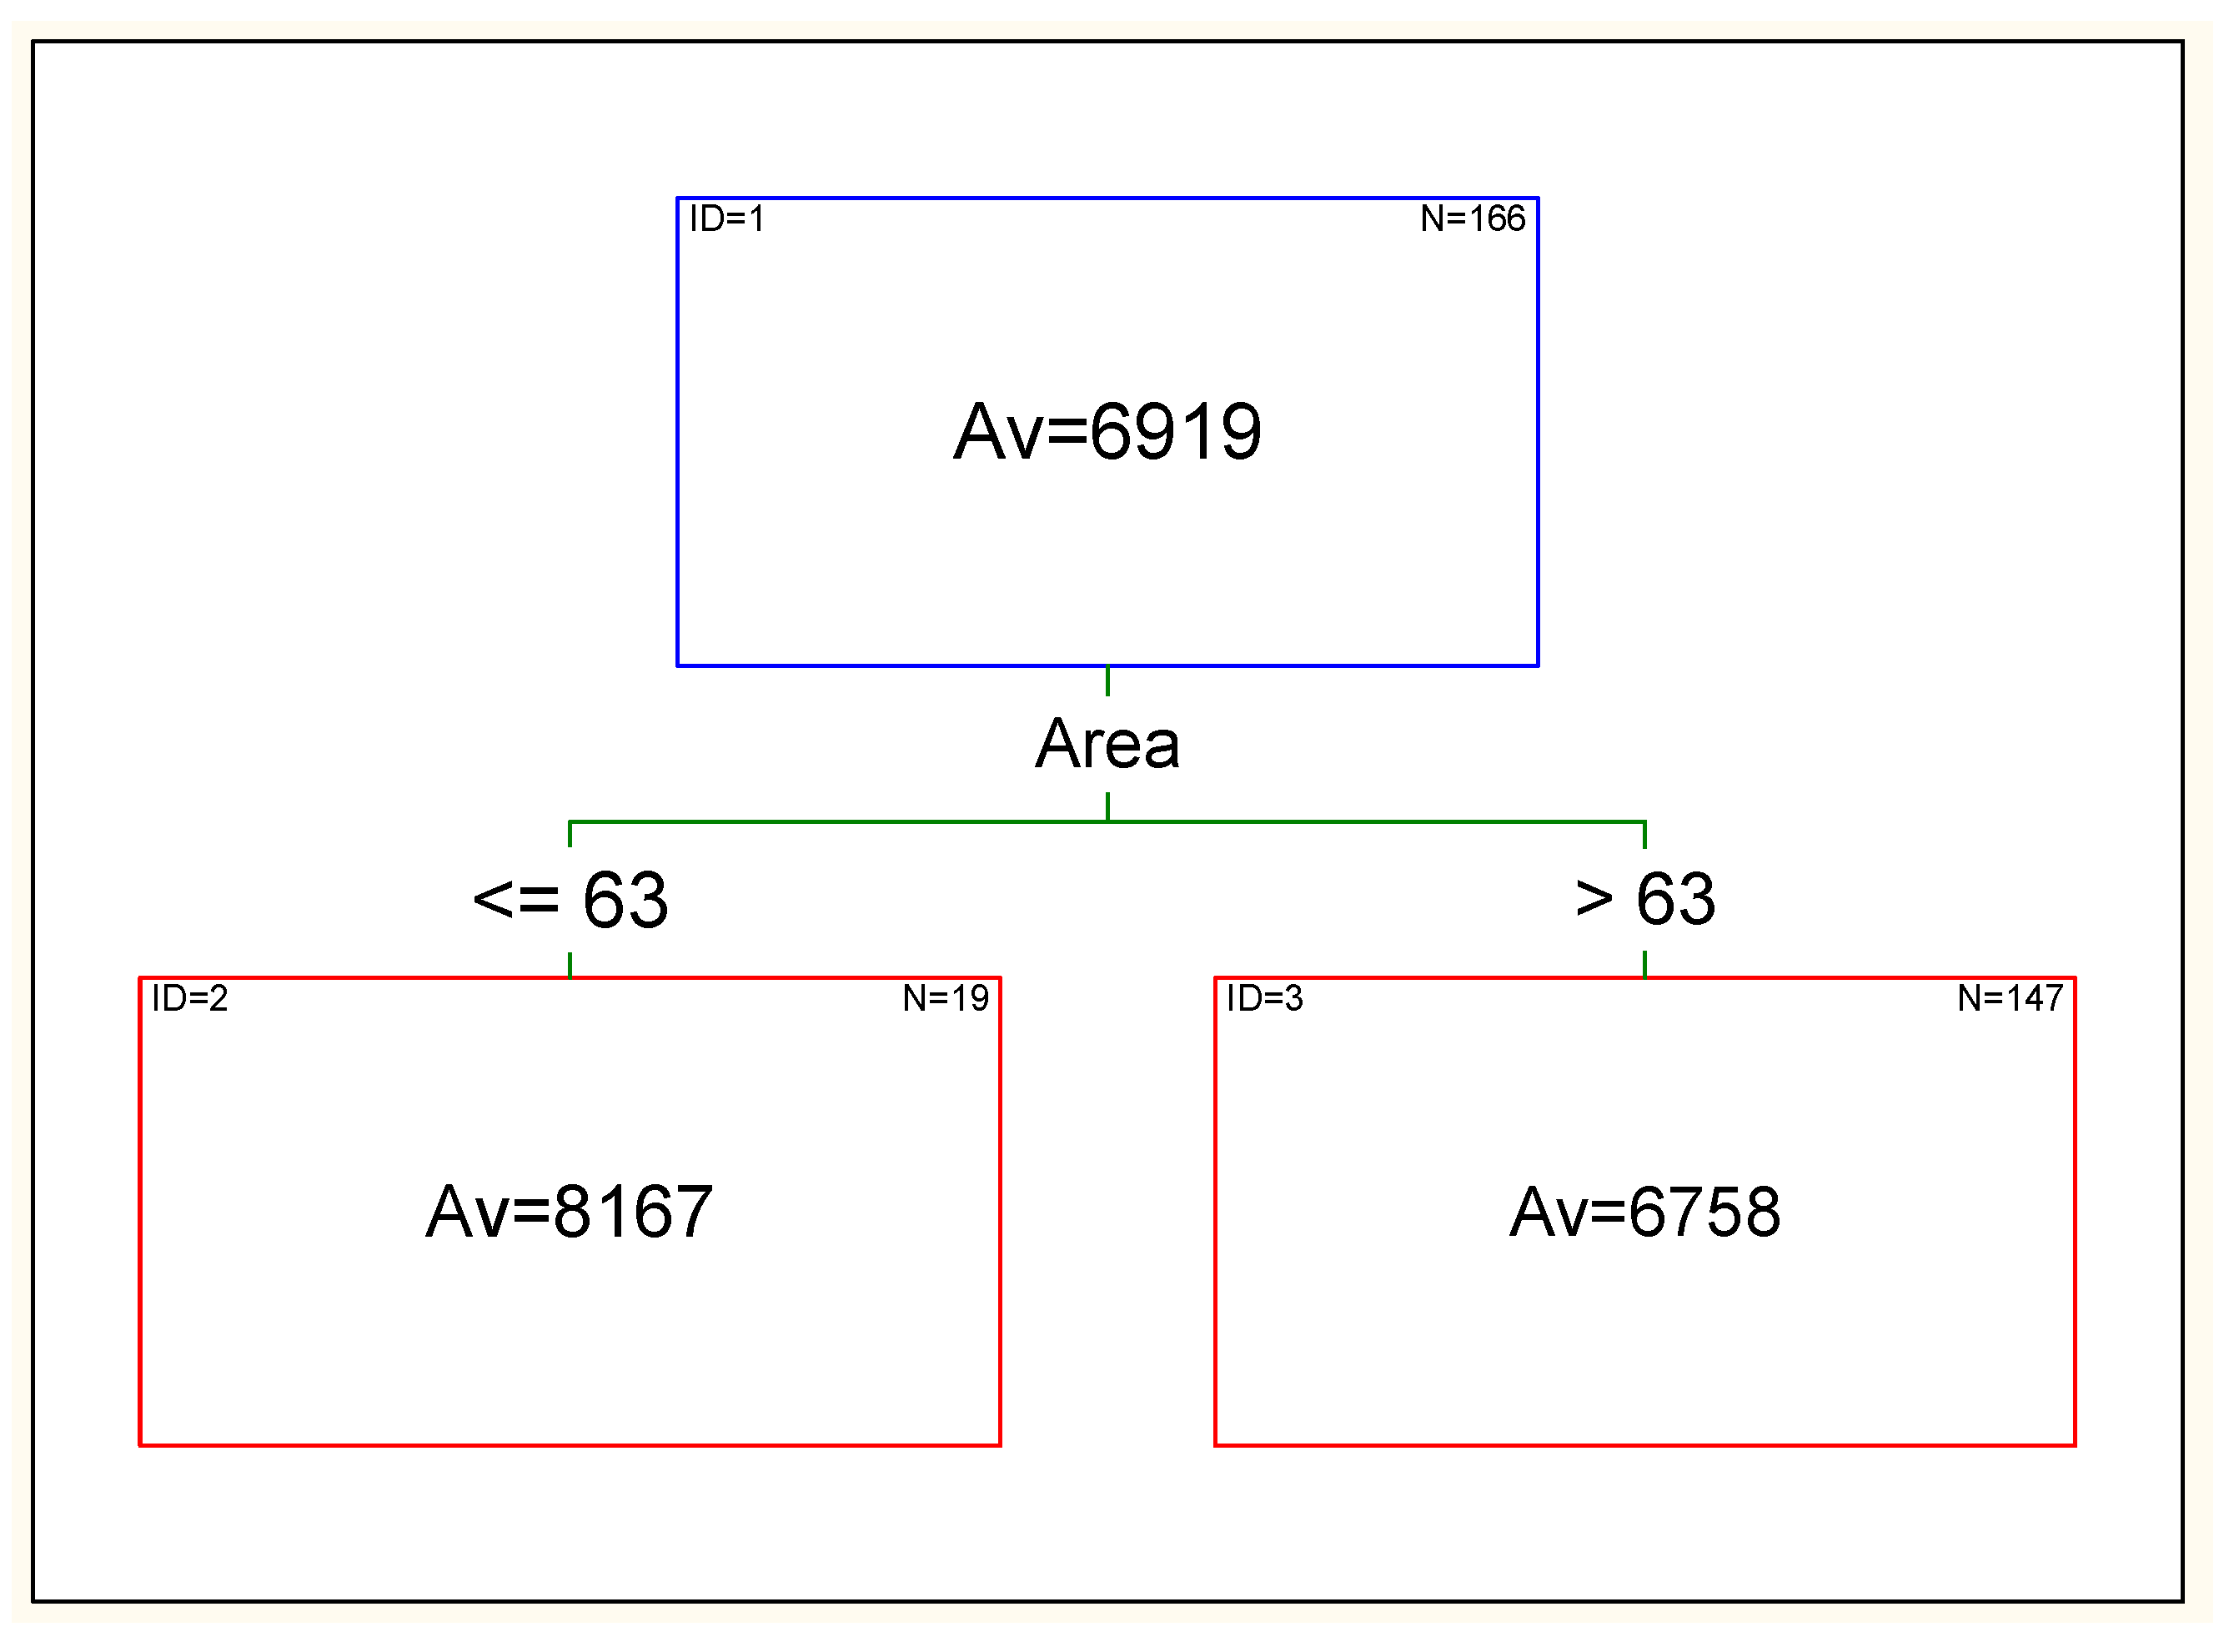
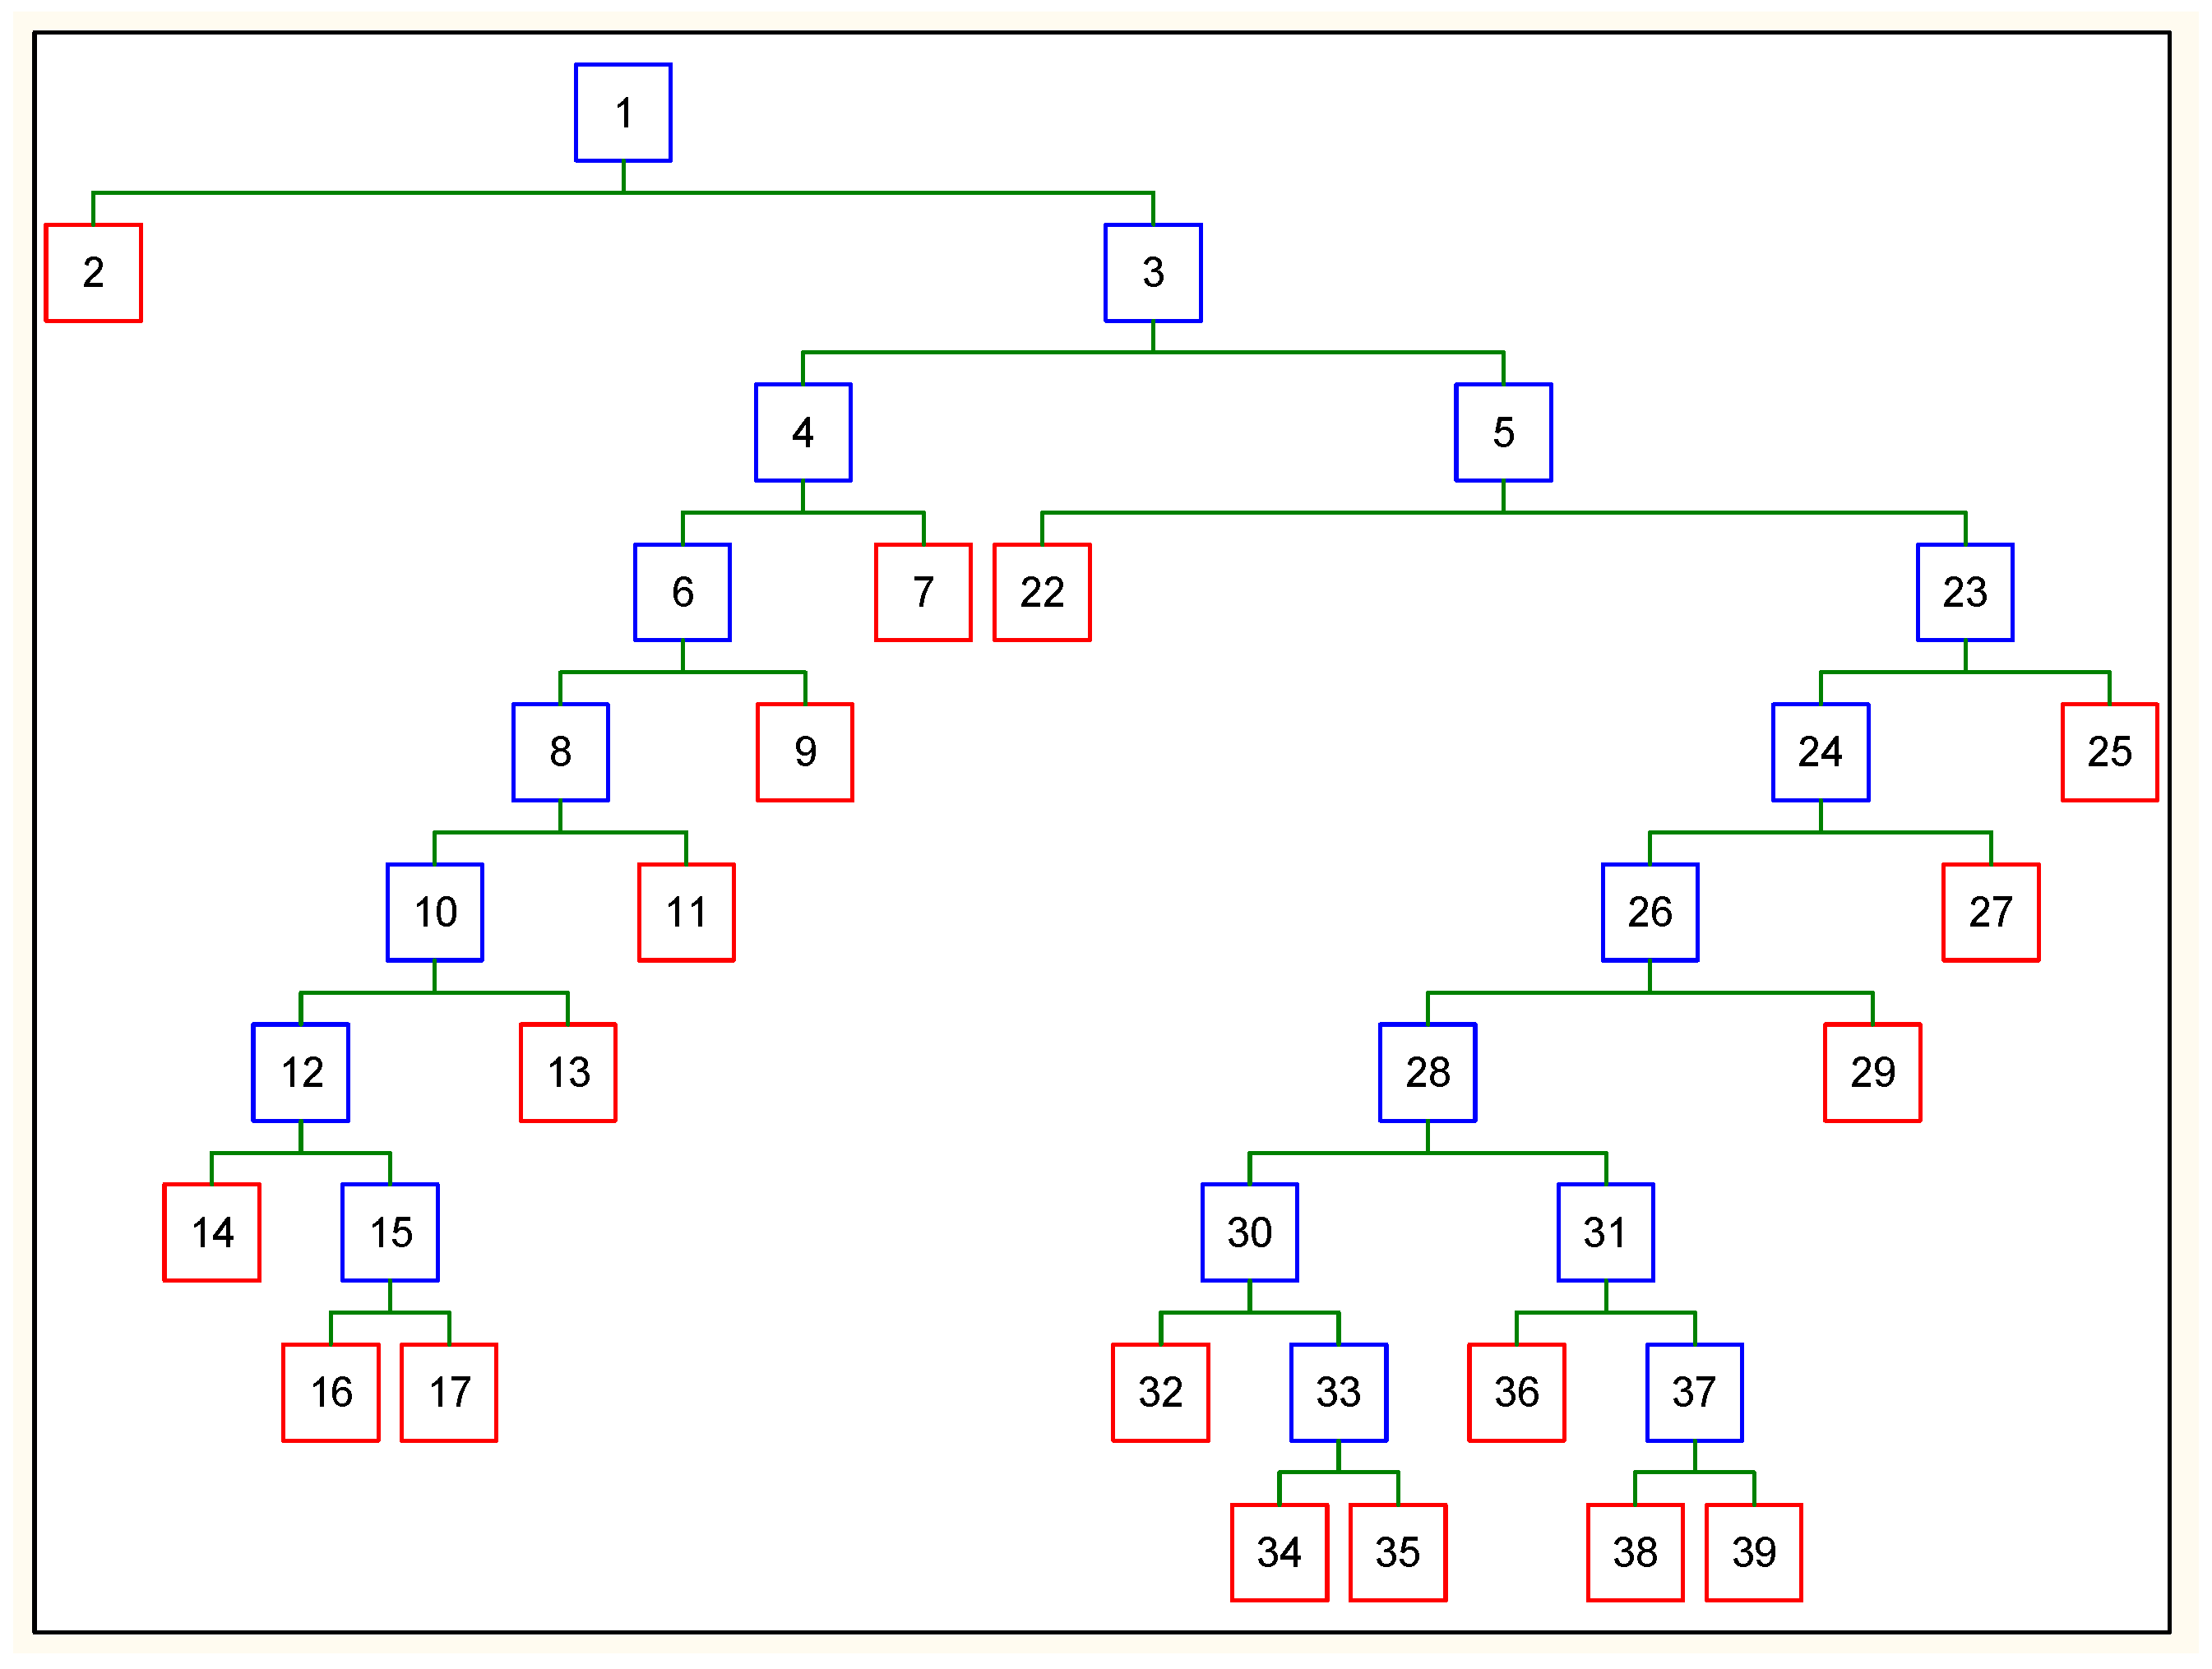
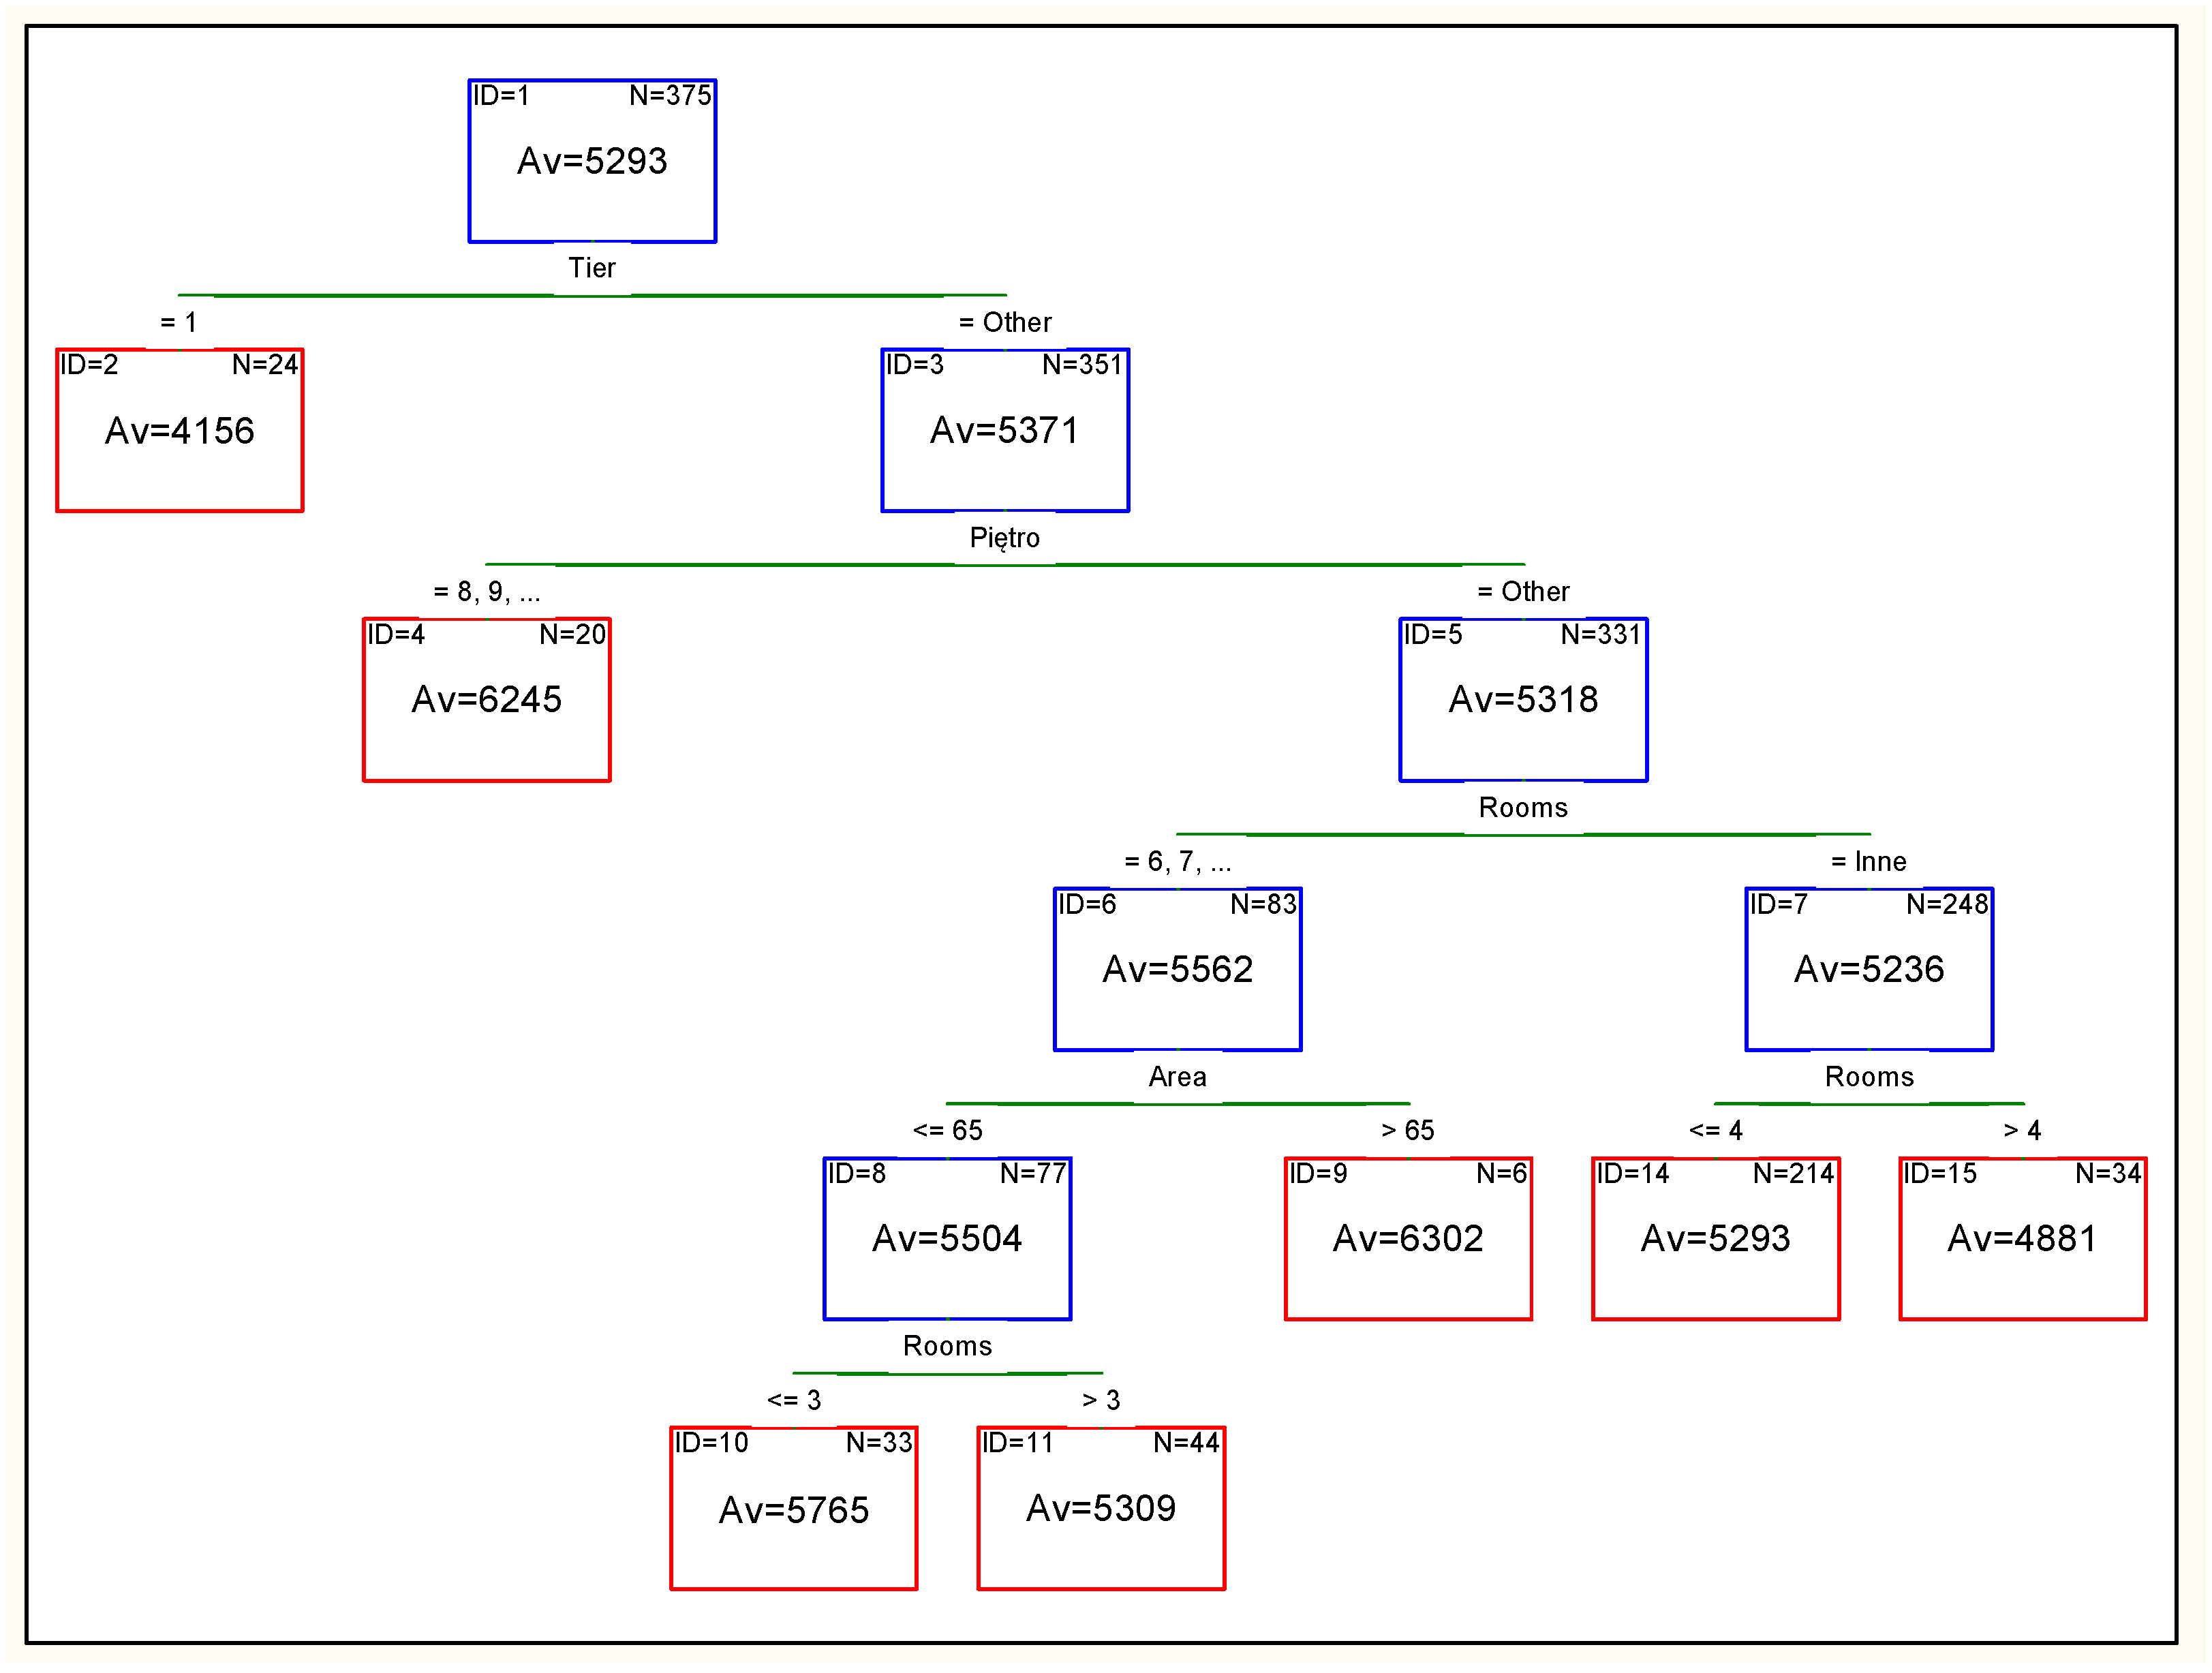
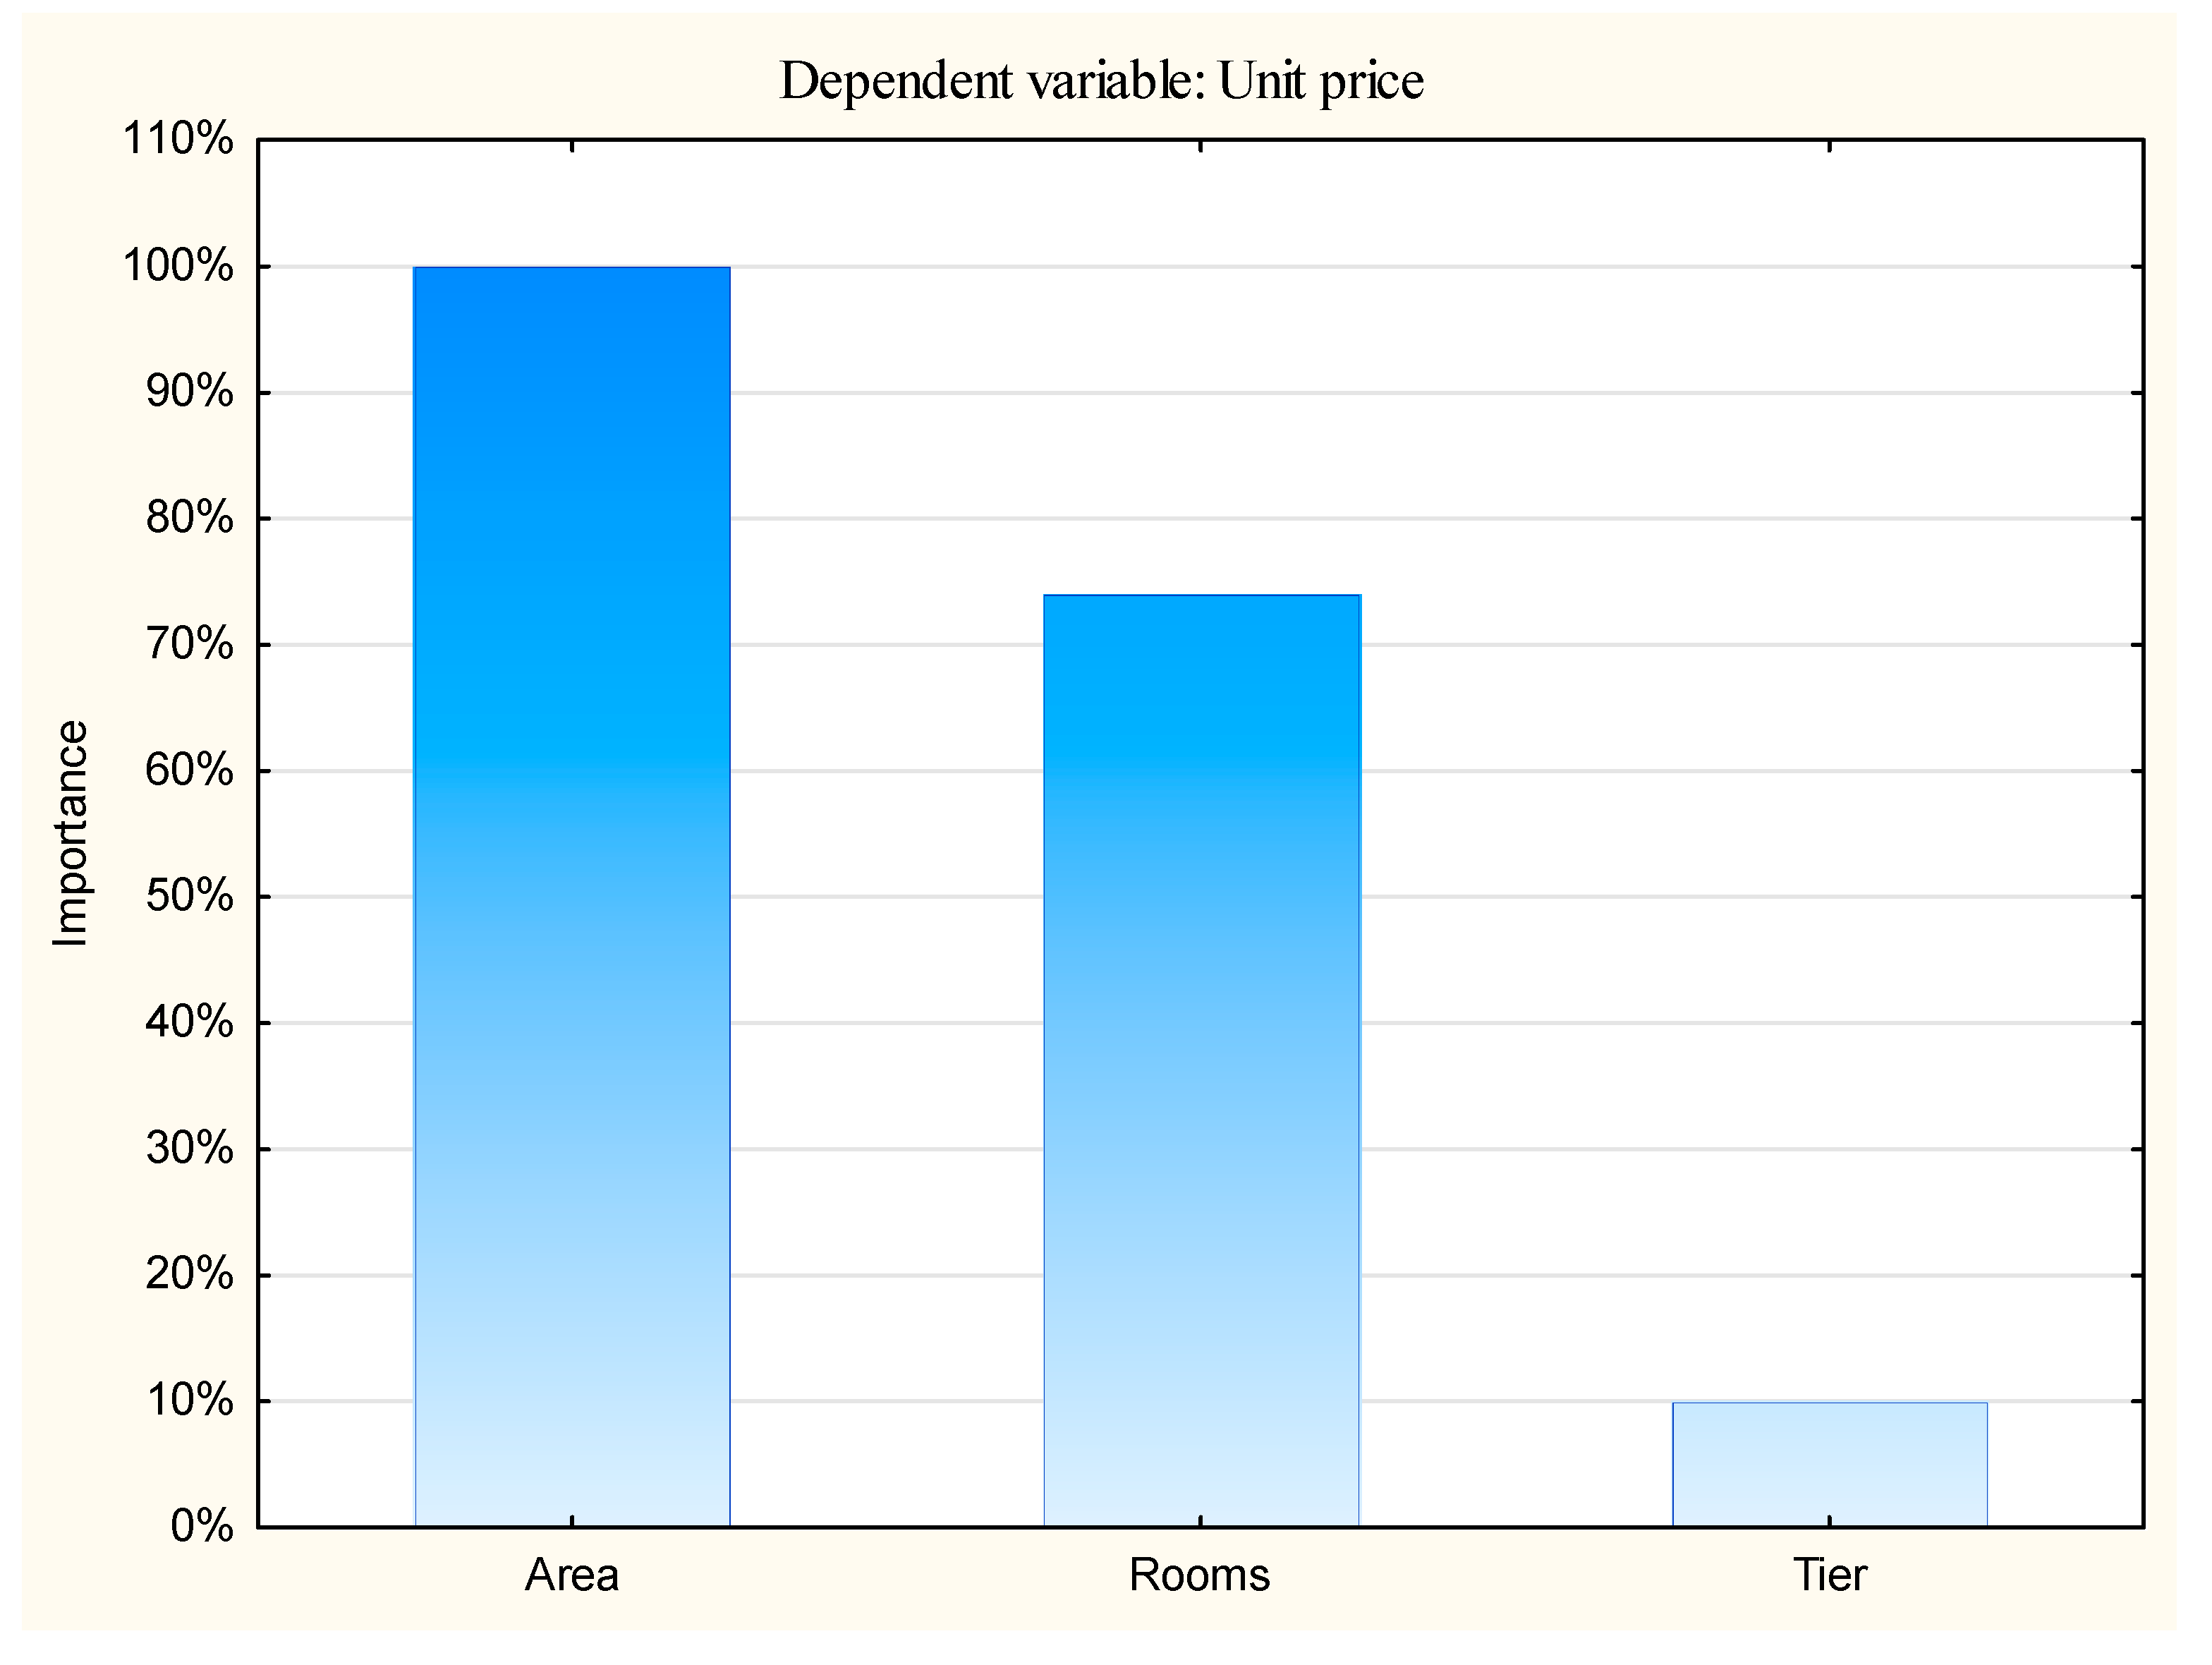
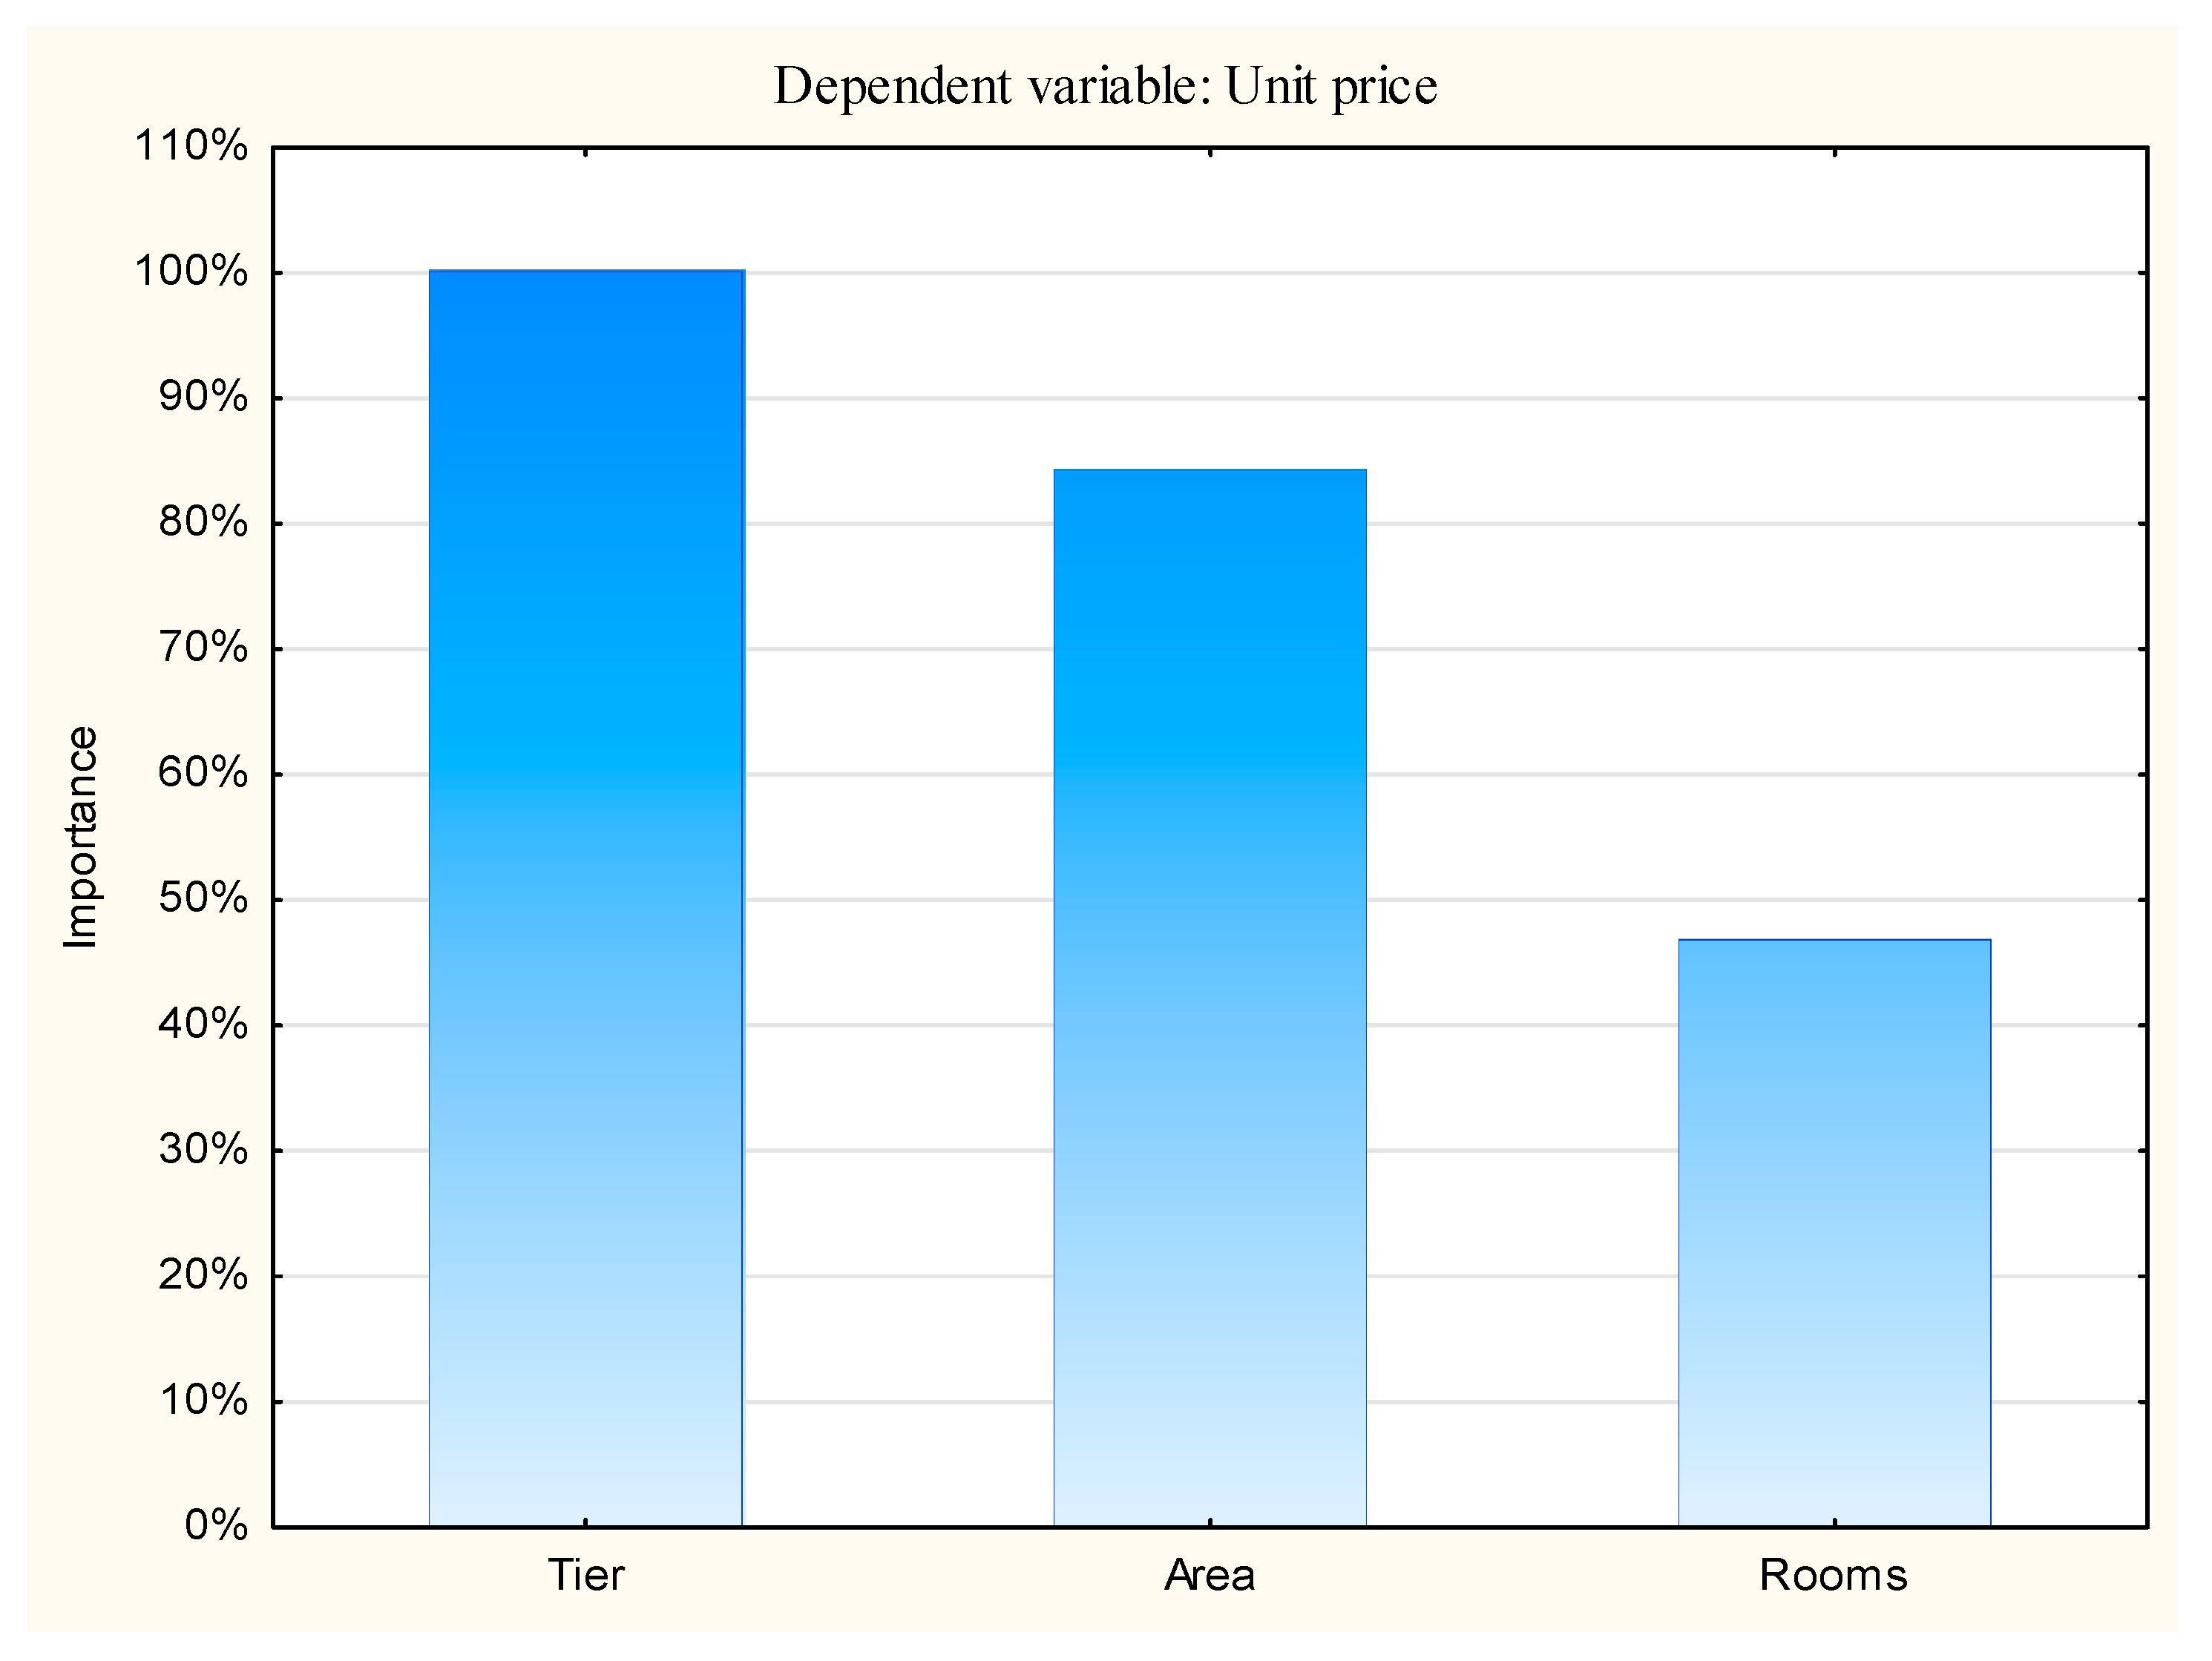
An additional analysis was the creation of C&RT (classification and regression trees, using TIBCO Statistica v 13 software), which used an iterative model for dividing the set into disjointed groups relative to the mean value. The pivoted result is a tree selected in the process of evaluating the model with a 10-fold cross test, as shown in
Figure 16 and
Figure 17 for Example 1,
Figure 18 for the entire Czyżyny district and
Figure 19 for Example 2 exclusively. This solution was used so that the floor attribute could be used as a qualitative feature. This assumption allows you to select attractive floors, ignoring the linear nature of the feature. Classic approach-only approximation by the correlation coefficient [
31].
The trees created for Example 1 had a simple structure, the main dividing criterion was the area and it was easy to designate two groups of three, characterized by the average price given in
Figure 14 and the standard deviation of 1 thousand PLN (250 Euro). In the case of Example 2, the division was no longer so unambiguous. More groups should be selected, mainly based on the area and floor.
5. Conclusions
The presented work addressed the issue of the use of urban space, using as an example previously undeveloped areas in two districts within the city of Kraków. Housing investments in these areas were investigated. The analysis used LiDAR data (CAPAP) technology that provides efficient spatial information. The data were used to create a digital mock-up of part of the city. This technology allowed for an analysis of the impact of newly created buildings on existing ones. The use of these technologies for spatial planning provides a wide range of possibilities for simulations and design changes, thereby eliminating the potential negative effects of projects before they are implemented.
The areas of the first district studied, according to the assumptions of the study of spatial conditions, were intended for single-family and multi-family housing with low intensity. The building is not distinguished by its height from existing buildings, and traffic has been directed under the surface of the site, creating underground parking spaces. A life-friendly environment has been created to encourage potential buyers to purchase an apartment. A study of data from the original property market showed that the house prices in Example 1 were slightly higher than the average property prices within the district. Average unit prices were highest for apartments with the smallest area and for the number of chambers located on the top floor. The examination of unit price changes in relation to the transaction date showed that they increased over time, as did unit prices in the whole of District 1, which is in line with the current trend in the real estate market.
The development of Example 2 was located in areas not covered by any of the applicable Local Zone Plan. The analysis of the study of spatial conditions showed that most of the estate was located within areas intended for multi-family housing, however, the eastern area was in a location intended for public greenery. The newly built buildings were characterized by dense and high buildings, distinguished among existing buildings. The neighbourhood is known for its high superstructures. Such buildings are permitted by the general principles of law, but the maximum number of buildings in the area have been placed here, which has had a negative impact on the perception of the entire development. The result of the creation of new housing estates without a well-thought-out concept of adequate service facilities is an action contrary to the idea of effective management of urban space and constitutes a reduction in the wellbeing of residents. The simulation of sunlight hours for selected facades facilitates understanding of the difficulty of meeting requirements without direct access to daylight in a dense structure. As has been observed, even in buildings of less than 10 storeys surrounded by squares, their impact zone is so large, that they significantly restrict access to neighbouring objects. This factor leads to a situation in which not only the location of a building but also its height and the distance from the boundary of the plot or the impassable building line specified in the local zoning plan should be taken into consideration. An examination of the transactions from the original real estate market has shown that the investment developer had obtained property prices lower than the average market prices at the time, although the area consisted primarily of a building from the 1960s, which is technologically outdated and should not compete with new buildings. This action was triggered by the demand for properties with a unit price that met the criteria of the government’s housing support programme. The creation of a low-functional housing estate with lower than average unit housing prices has been reflected in the real estate market of the entire district. An examination of unit price changes in relation to the transaction date, showed a decrease in prices over time. This is the opposite trend to the Krakow real estate market, which indicates a decrease in the attractiveness of the district in the eyes of potential buyers.
It is clear that the urbanization process requires the acquisition of new buildings for development, but the way in which they are used, is often determined by the developers, who are often purely profit-oriented. However, the awareness of citizens who increasingly prefer intimate investments, created with care for the environment and the inhabitants, plays an important role. An inseparable element allied to the implementation of smart city objectives are people, their actions and their consistency, which in the future can contribute to improving the way the urban space is managed.
