1. Introduction
The transport sector consumes one of the largest shares of final energy (29% in 2017), according to the International Energy Agency [
1]. The energy sector is the largest source of greenhouse gas emissions, contributing 68% of total anthropogenic greenhouse gas emissions. Transport contributed approximately 24% of global CO
2-specific emissions in 2017, the second largest contributor after power and heat generation at 41% [
2]. The International Transport Forum projected that global passenger transport demand will increase three-fold between 2015 and 2050. Global freight demand is also expected to triple by 2050, with emerging countries such as China and India projected to be major determinants in the evolution of global freight flows [
3]. A statistical relationship is known to exist between gross domestic product (GDP) and transport demand, which means that developing countries are more likely to experience an increase in transportation demand due to their rapid increase in GDP [
3]. Rapid growth in the transport sector will bring challenges for sustaining energy systems and environmental quality.
Transportation is also responsible for about 25% of carbon monoxide (CO), 18% of black carbon (BC), and 20% of non-methane volatile organic carbons (NMVOC) emissions in 2010; the share of these air pollutant emissions globally in the transport sector has increased a lot since 1950 [
4]. Asia, led by China and India, is responsible for more than half of the total air pollution emissions annually.
Personal travel behaviors are reportedly important for reducing CO
2 and air pollutant emissions [
5,
6,
7,
8,
9]. This can include individual attitudes toward electrification of transportation and the promotion of high technology and public transportation. Transport mode decision models, linked with bottom-up integrated assessment models, can address transportation-related behaviors, which generally have relatively rich technological and behavioral representations in the transportation sector [
10]. Popular transport models include the global partial-equilibrium integrated assessment model, the Global Change Assessment model (GCAM) [
11], the linear programming Global Energy Transition model [
12], the least-cost linear optimization E4 model, and the Integrated MARKAL-EFOM System [
13]. In these models, transport demand is computed first, with the consideration of traffic activities, GDP per capita, and the exogenously or endogenously determined modal share. Instead of these bottom-up models, top-down integrated assessment models, represented by the Asia-Pacific Integrated Model/Computable General Equilibrium (AIM/CGE) [
14,
15,
16,
17], where the transportation sector is highly aggregated, make it hard to find out the relationship between specific transport behaviors and transport emissions. AIM/Transport is one of the bottom-up integrated assessment models where socioeconomic factors are derived from the AIM/CGE. In this model, transport demand is calculated with income, generalized cost of transport, and population. Market shares of each mode and technology are then calculated using the multinomial logit (MNL-type) equation. This model is widely used for impact assessment in the transportation sector [
7,
18,
19].
Recently, a number of studies have explored GHG and air pollutant mitigation scenarios. Akashi et al. [
20] explored GHG emission scenarios in Asia by using an integrated assessment model, and found energy intensity improvement contributes a lot to reducing CO
2 emission in the short term, while carbon intensity reduction and CO
2 capture have a critical role for further emission reduction. The technological feasibility of achieving a 50% reduction of global GHG emissions by 2050 is also proved, where carbon capture and storage, cleaner power generation, and biofuel account for 64% of the total GHG emission reduction [
21]. Vallés-Giménez et al. [
22] studied the effectiveness of environmental taxes in Spanish regions by using panel data and found environmental taxes can be a slight disincentive to generate emissions, while tougher measures are needed to meet EU commitments. Kishimoto et al. [
23] employed an integrated assessment model in China and found carbon price policy and a stringent emission standard are effective strategies for addressing air pollution.
Asian countries should be important targets for emission reduction policies, as they are projected to become major contributors to future CO2 and air pollutant emissions. Although earlier studies have suggested policies for transport sector emissions reductions, no literature specifically focuses on individual Asian countries and their differences. Here, we explore the impacts of transport, emission control, and climate policies on CO2 and air pollutant emissions across Asian countries. We then aim to provide policy implications for related stakeholders, such as policymakers and researchers, based on scenario analysis with different assumptions regarding climate, emission control, and transport policies.
2. Methodology and Data
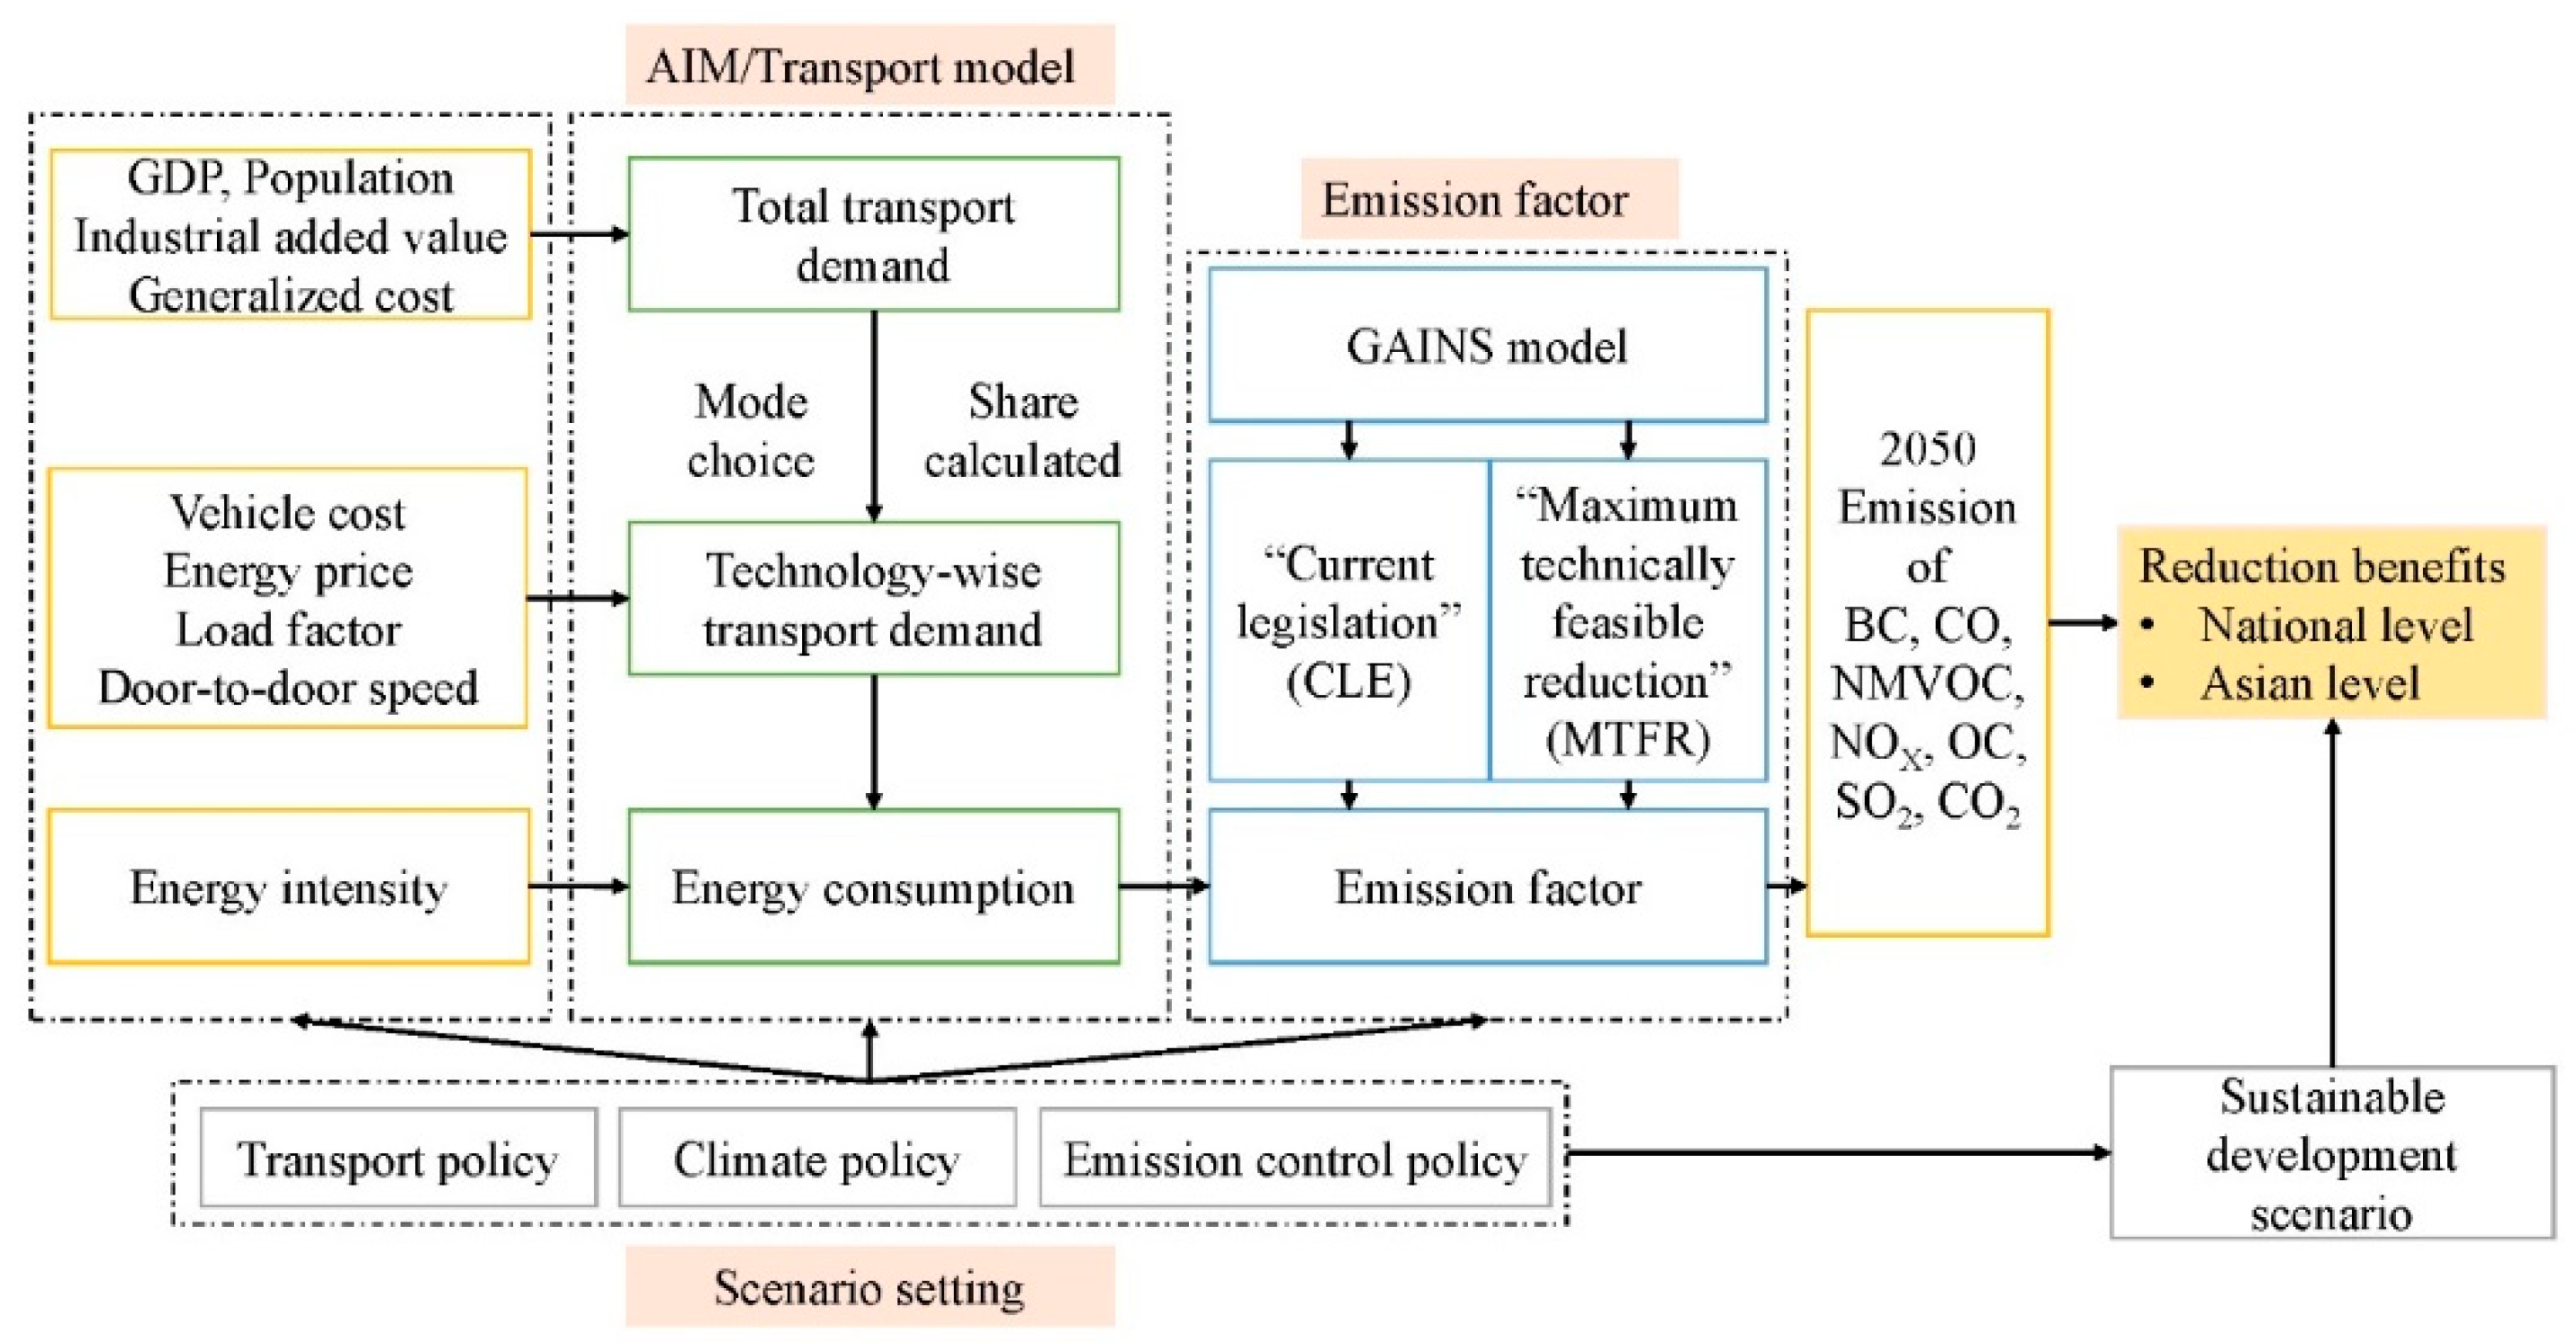
The modeling framework used in this study is shown in
Figure 1. Transport demand at distance level, mode level, size level, and technology level were estimated in the AIM/Transport model [
19]. Energy consumption and emissions were computed from the bottom up based on the energy intensity (energy consumption per activity level) and emission factors. Transport, climate, and air pollutant emission control policies were considered to develop the scenarios. We developed a sustainable development scenario, which incorporates combinations of all assumptions and explores emissions at both national and regional levels. We selected eight Asian countries as our research area, including China (CHN), Indonesia (IDN), India (IND), Japan (JPN), Korea (KOR), Malaysia (MYS), Thailand (THA), and Vietnam (VNM), considering their total transport demand, its energy consumption, population, and economic scales. The simulation from 2005 to 2050 was carried out by annual steps.
2.1. Transport Model
Basic Introduction
AIM/Transport [
19] is a bottom-up global transport model that has been developed for projecting global passenger and freight transport demand for each mode and technology. Currently, the model can be used on a global level (with 17 aggregated regions) or on a national level. AIM/Transport considers individual preferences and detailed technological choices. When provided with socioeconomic information such as GDP, population, and energy prices from AIM/CGE [
24], AIM/Transport calculates travel demand. It has four nesting structures in passenger travel and freight demand: distance, mode, size, and technology. The structure of AIM/Transport and the detailed division of distance, mode, and size layers are shown in SI Chapter 1. The technological nesting layer covers the main technologies used by each vehicle mode (e.g., conventional gasoline-powered vehicles, natural gas-powered vehicles, hybrid, plug-in hybrid, and EV). For each nesting structure, market shares are calculated using the multinomial logit (MNL-type) equation. Technology-wise energy consumption, CO
2 and air pollutant emissions are estimated by combining energy intensity and emission factors.
The main formulations of AIM/Transport are shown in SI Chapter 2. The total transport demand is associated with GDP per capita (in the freight sector, industrial value added per capita), generalized cost, and population. Distance-wise, mode-wise, size-wise, and technology-wise transport demand are calculated based on the market share of each group, which is calculated using MNL-type equations according to the levelized cost of technologies within each category and the monetized time cost. Monetized time cost is associated with income per capita, average working hours, and door-to-door speed. Technology-wise energy consumption is calculated by the travel demand of old and newly installed devices, multiplied by energy intensity. The depletion and operation rates are considered for the previous year’s already installed technologies and the newly installed technologies for the current year, respectively. Air pollutants and CO2 emissions are computed by technology-wise energy consumption and emission factors.
2.2. Data Source and Parameter Assumptions
2.2.1. Basic Socioeconomic and Technological Data
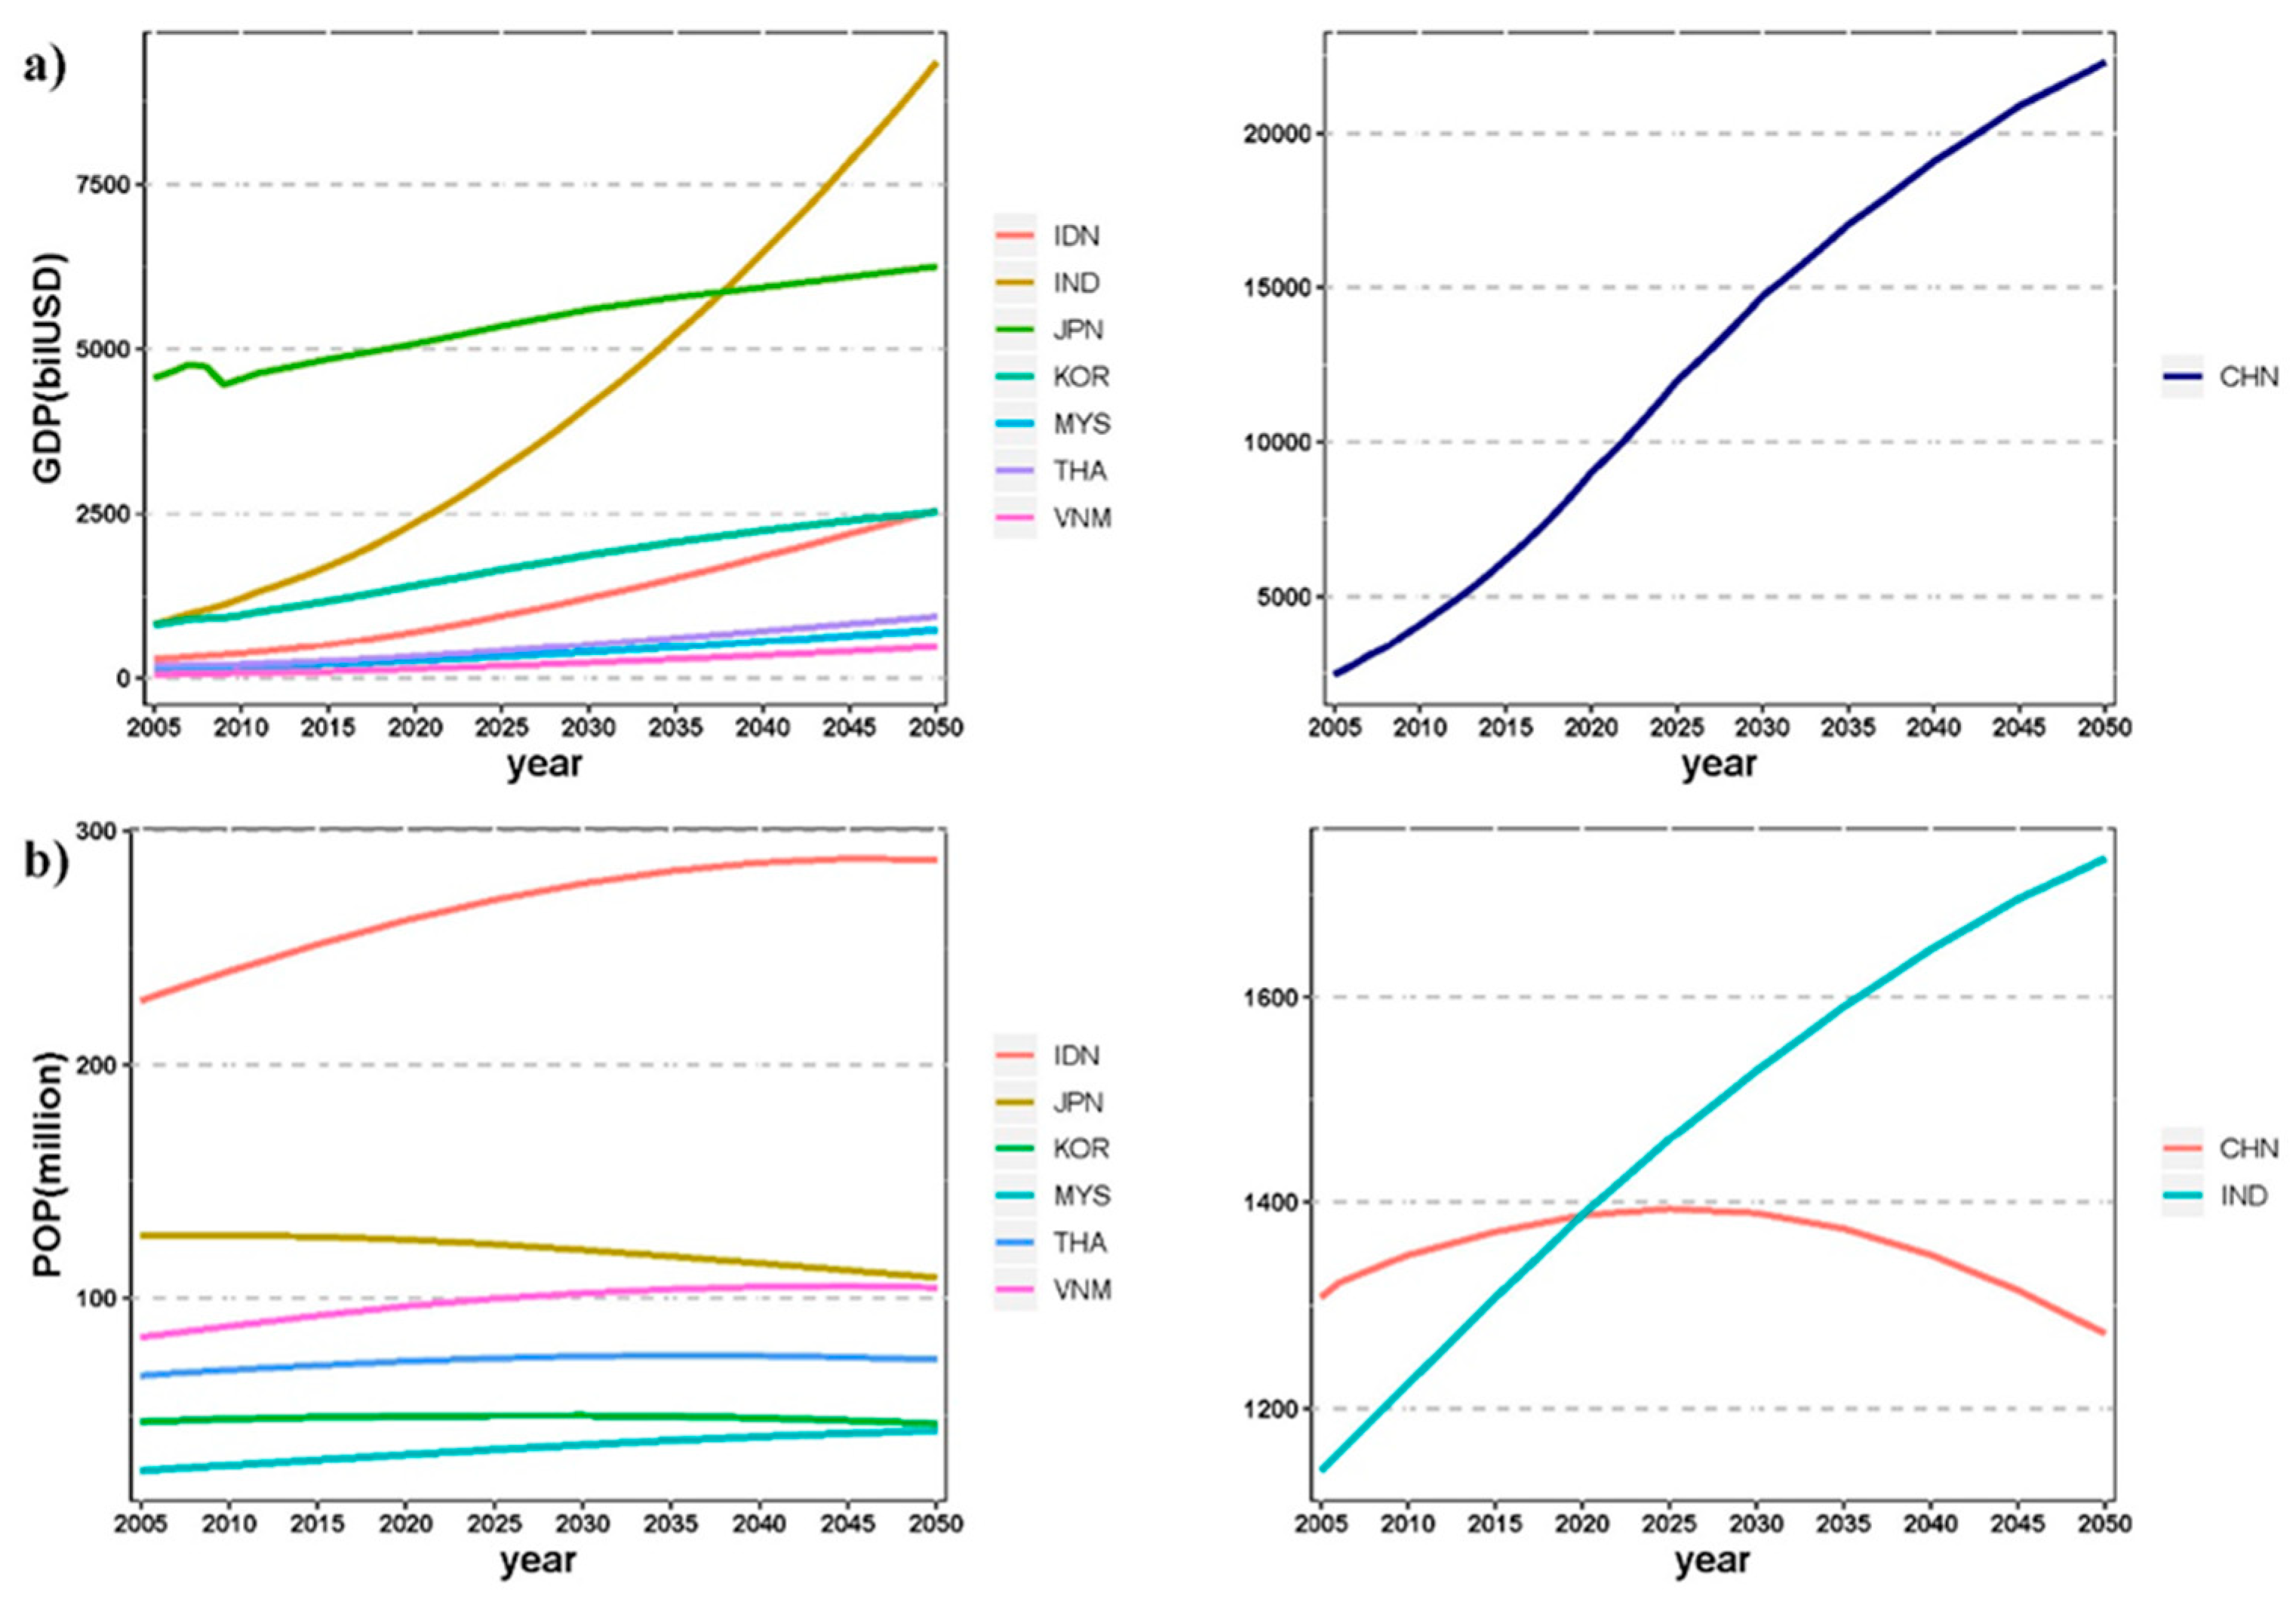
In AIM/Transport, socioeconomic parameters, including GDP and population, are taken from the shared socioeconomic database [
25]; Shared Socioeconomic Pathways 2 (SSP2) was adopted in this study. This narrative describes a future with medium challenges to mitigation and adaptation [
26]. Load factor (passengers per vehicle) and door-to-door speed are derived from the GCAM [
27] and vehicle cost and energy intensity are taken from the AIM/Enduse model [
22]. GDP and population assumption are shown in
Figure 2. The assumptions of other key parameters in AIM/Transport are shown in SI Chapter 3.
2.2.2. Emission Factors
In this study, emission factors of air pollutants were derived from the Greenhouse Gas-Air Pollution Interactions and Synergies model, developed by the International Institute for Applied Systems Analysis (IIASA) [
28,
29]. This dataset includes energy-related emission factors for 26 regions based on current policies and technological possibilities for BC, CO, NMVOC, NO
X, organic carbon (OC), and sulfur dioxide (SO
2). Two sets of emission factors in this dataset are defined. One is “Current Legislation”, a scenario in which regions implement current environmental legislation until 2030; emission factors in this set are based on fleet average level and consider the operating age of equipment in a given year. The other set is “Maximum Technically Feasible Reduction”, in which all existing technologies are utilized well, regardless of cost, considering lifespan and accessibility in specific regions. Emission factors are further classified into three groups based on the alternative assumptions for future pollution controls proposed by Rao et al. [
30]: strong, central, and weak, in which emission factors are consistent with the SSP narratives. Emission factors in the “strong” group are mapped with SSP1 and SSP5 narrative, which assume a faster growth of pollution control technology development, with greater effectiveness achieved compared with emission factors in the “central” group mapped with SSP2 scenario. CO
2 emission factors are considered stable over time in this study. Detailed assumptions regarding air pollutants and CO
2 emission factors can be found in SI Chapter 4.
2.3. Scenario Setting
We simulated nine scenarios that could be classified into three groups. The detailed scenario framework of this study is shown in
Table 1. The first group comprised the baseline scenario. Second, seven single-policy scenarios were included, where parameters were systematically altered among scenarios. Five of the seven scenarios assume transport behavior or technological policy assumptions; the other two assume changes in carbon pricing policy and air pollutant legislation. The final group comprised the Sustainable Development (SD) scenario, which simultaneously incorporates all policies mentioned above.
The baseline scenario assumes that the transport sector will continue to change dynamically, based on the assumptions of GDP and population consistent with the SSP2 narrative. The mode preference parameters in developing countries will converge to those of the average values in the United States and Japan in 2100, which are regarded as typical car-oriented and public-transit societies, respectively. Load factor shows vehicle occupancy, which will decrease due to enhanced passenger vehicle ownership, but will remain constant with respect to freight vehicle ownership.
The five transport behavior or technological policy scenarios in the second group that we adopted were similar to those used by Mittal et al. [
18], including the Ene_Efficiency_High scenario, Mass_Transit scenario, Speed_High scenario, Advanced_Tech_High scenario, and Occupancy_High scenario. The Ene_Efficiency_High scenario assumes that the energy efficiency improvement rate will double in new light duty vehicles from the baseline scenario. The Mass_Transit scenario assumes that people prefer to choose public transportation and that Japan’s mode preference will be achieved by 2100. The average traffic speed (specifically, bus and railway) in the Speed_High scenario will increase at a faster rate, compared to the baseline scenario. The detailed speed is shown in SI Chapter 5. The Advanced_Tech_High scenario assumes that advanced technologies are highly promoted. The Occupancy_High scenario increases the load factor of passenger cars, converging to two people in 2100. It is worth noting that the Mass_Transit scenario and Speed_High scenario affect only the passenger sector, while other scenarios affect both passenger and freight sectors.
For the emission control policy, the APS_Strong scenario is developed with the emission factors of the strong group, which implies stricter emission control and emission standard, and a faster rate of pollution control technology development with greater effectiveness. The Carbon_Pricing scenario, corresponding to the carbon pricing policy, imposes a carbon tax to achieve 50% total anthropogenic greenhouse gas emissions reductions by 2050. In this scenario, GDP losses due to carbon pricing and carbon price in each country are computed by the AIM/CGE model, which are shown in
Table 2.
The SD scenario incorporates all single-policy scenarios to evaluate the effectiveness of each policy at the national and regional levels.
3. Results
3.1. Main Indicators in Baseline Scenario
3.1.1. Transport Demand and Energy Consumption
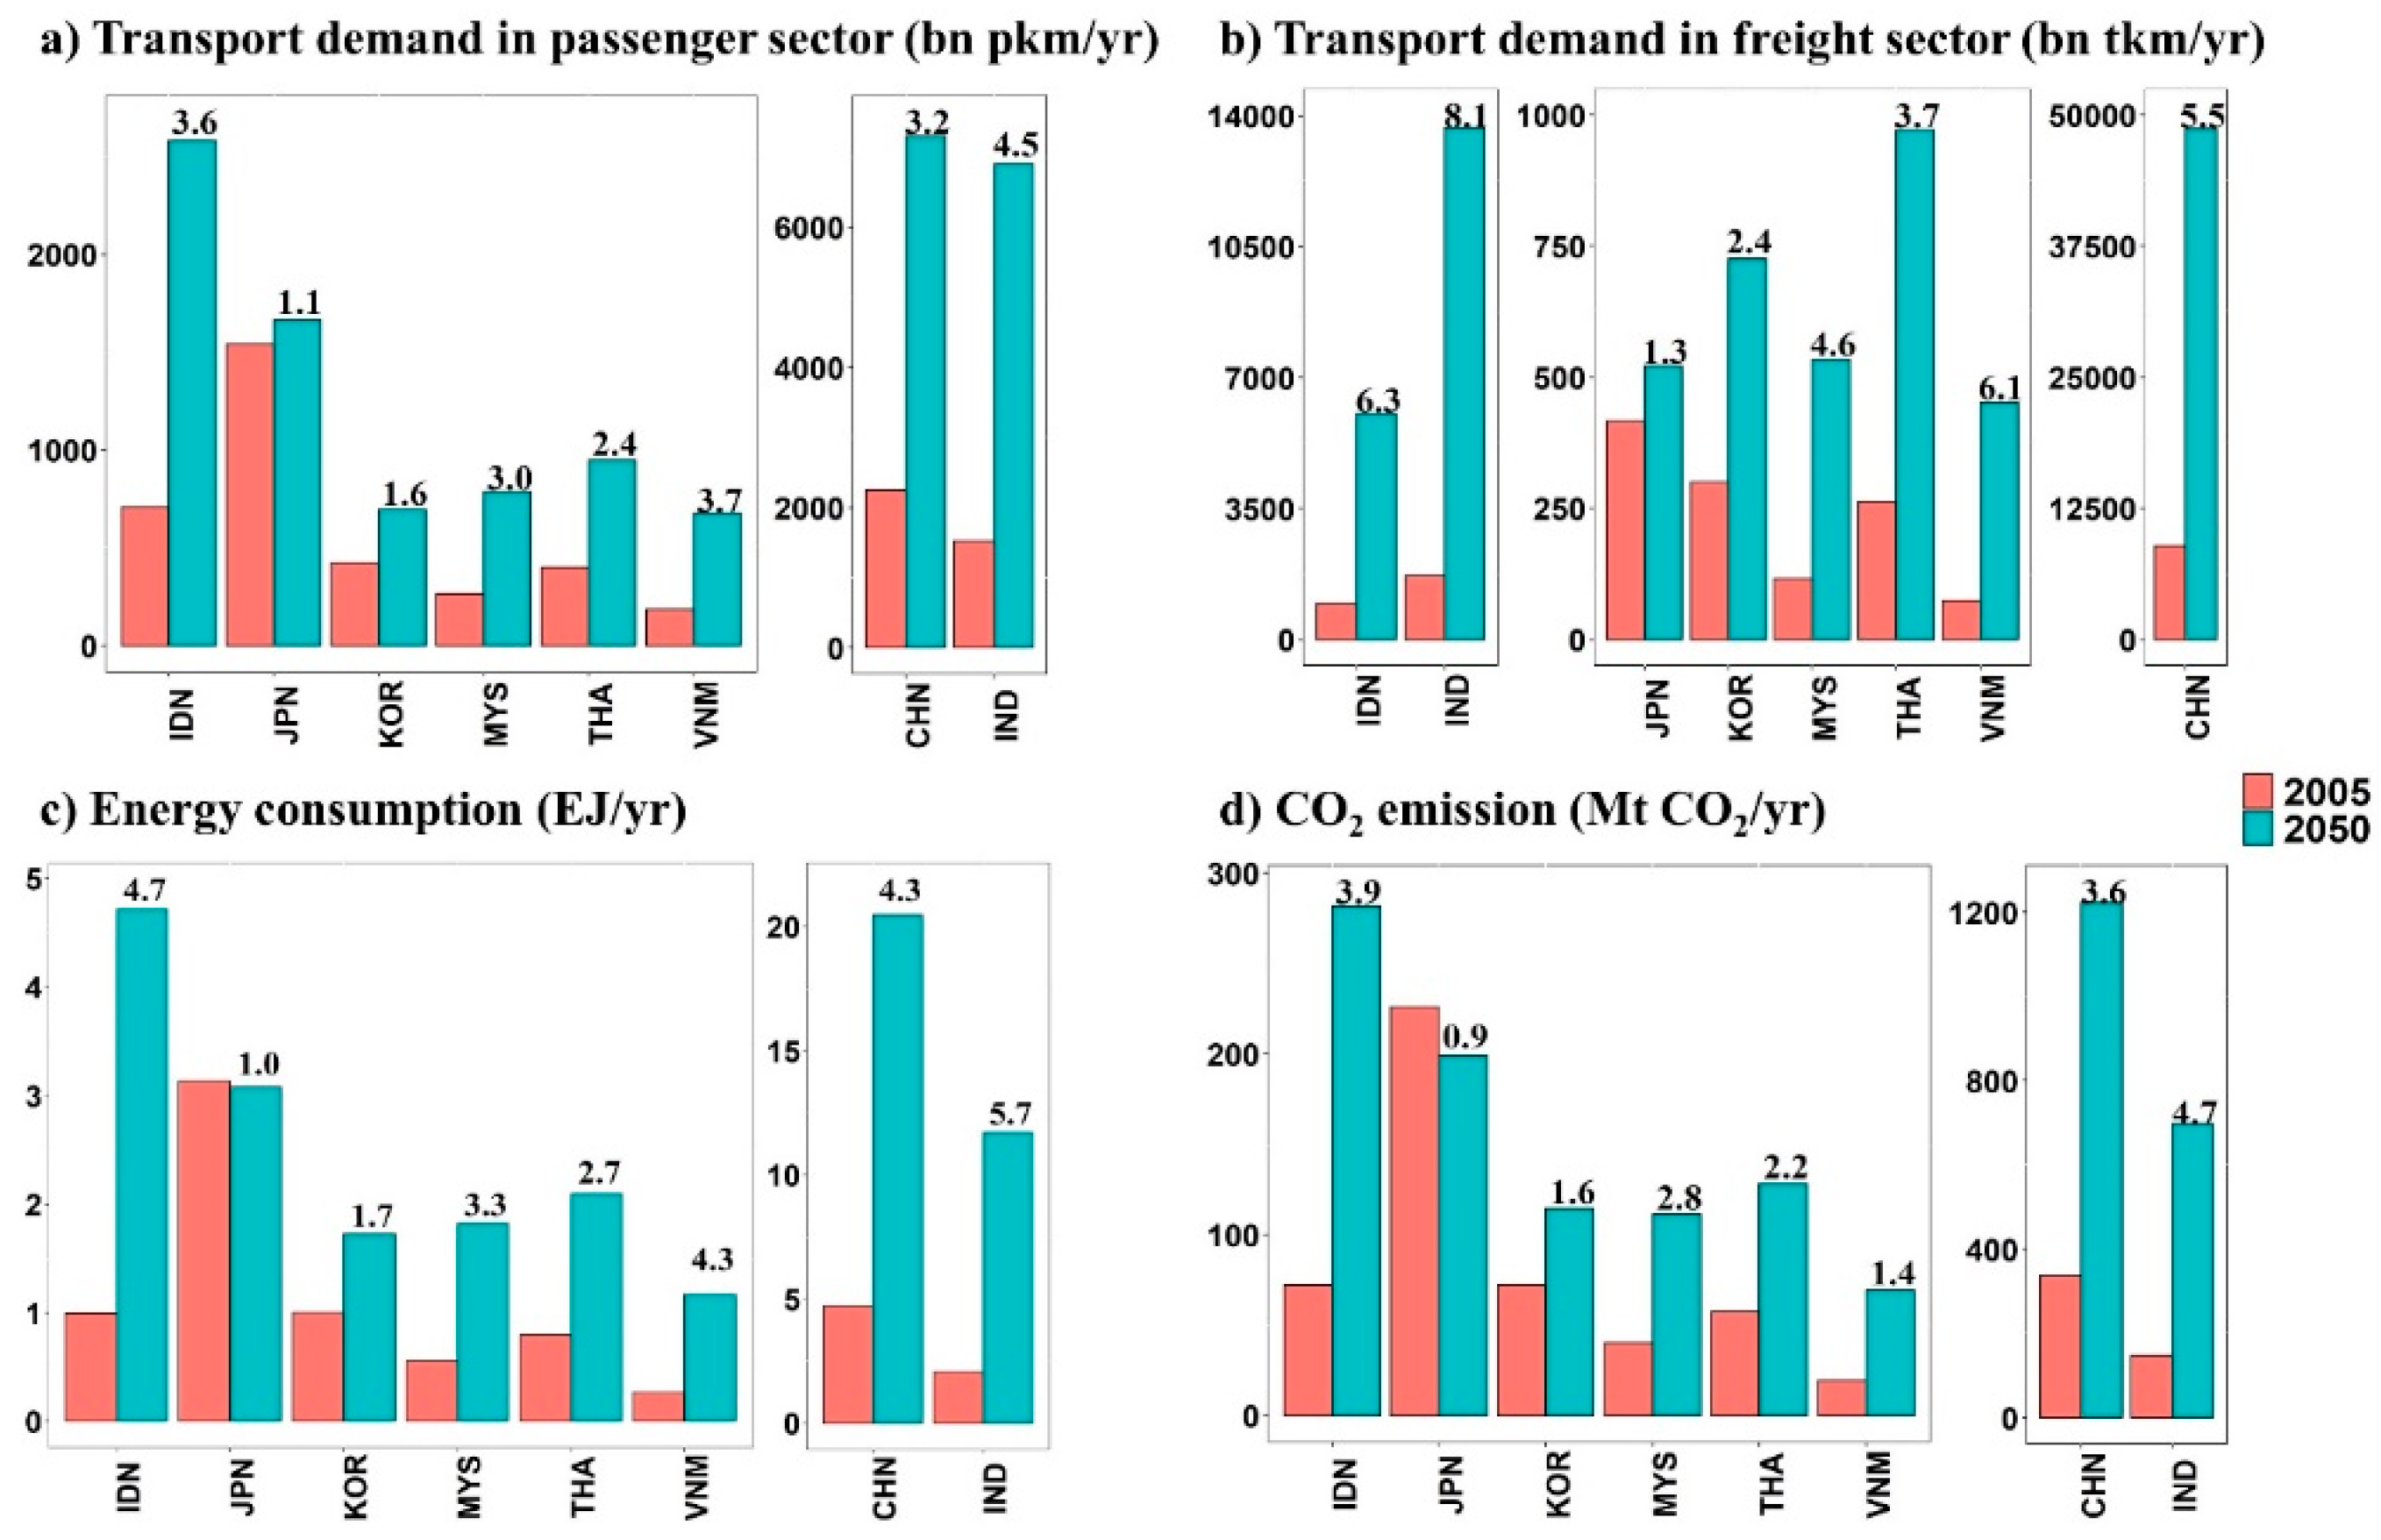
Transport demand for passenger and freight sectors, energy consumption, and CO
2 emissions in the baseline scenario are shown in
Figure 3a–d, respectively. The numbers above bars show multiples of 2050, relative to 2005. By 2050, the transport demand both in passenger and freight sectors in developing countries, which are measured by passenger km travelled (pkm) and ton km travelled (tkm), increases to 2 to 6 times compared to 2005. Transport demand in Japan and Korea also increases slightly. Along with a significant increase in transport demand, energy consumption and CO
2 emissions are also facing a growing trend, but at a lower growth rate. Japan is the only exception, with a reduction in energy consumption and CO
2 emissions by 2050 due to a declining population and changes in transport and energy structure.
3.1.2. Air Pollutant Emissions
Table 3 shows air pollutant emissions in the baseline scenario in 2005 and 2050, and the annual change rates, respectively. Most air pollutant species show a reduction over time, despite small elevations in BC and OC emissions in some countries. Reduction rates range from 0.3% (NO
X in Korea) to 6.1% (SO
2 in Malaysia), with different absolute emissions among countries. China and India have much greater air pollutant emissions levels than other countries in both years.
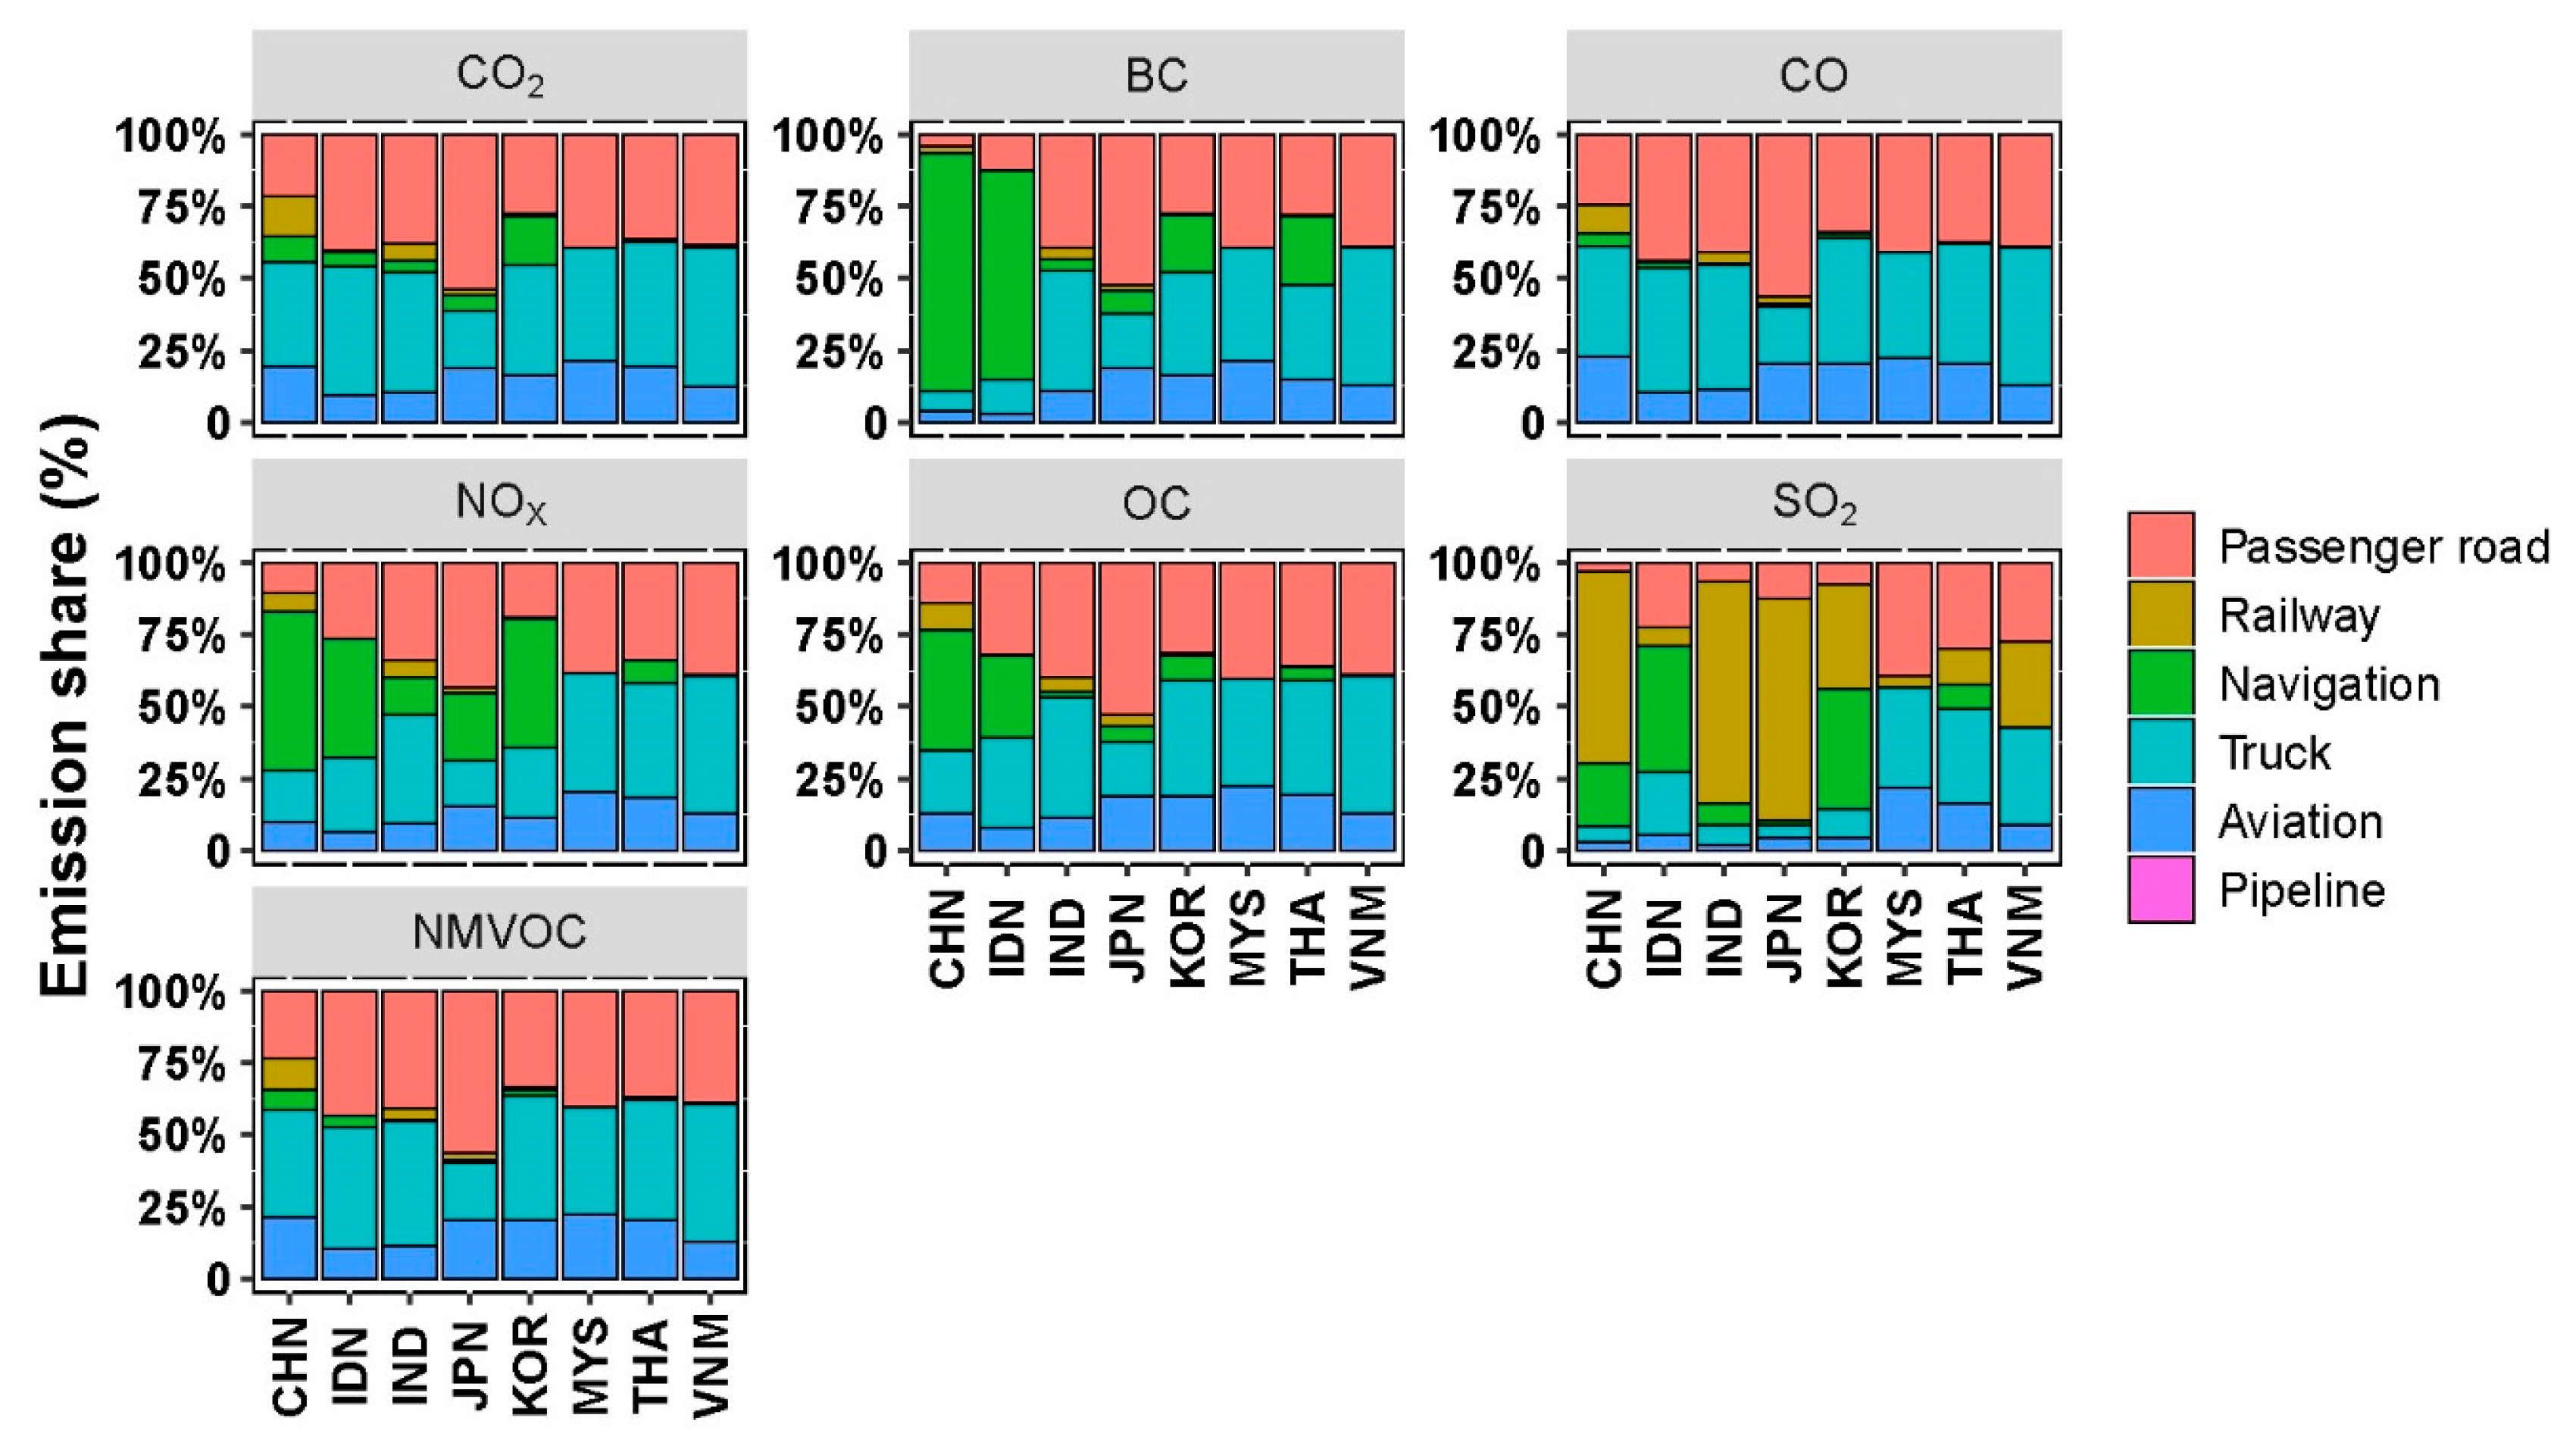
Figure 4 shows the baseline scenario’s mode-wise emission shares in 2050. Truck and passenger roads are major contributors to most air pollutants and CO
2 emissions. Additionally, navigation is a large contributor to NO
X and BC emissions, especially in China, Indonesia, Japan, and Korea, where the transport volume of navigation constitutes a relatively larger proportion. The high emission factor of diesel trains makes it a major contributor of SO
2 in some countries.
3.2. Results in Single-policy Scenarios
3.2.1. Final Energy
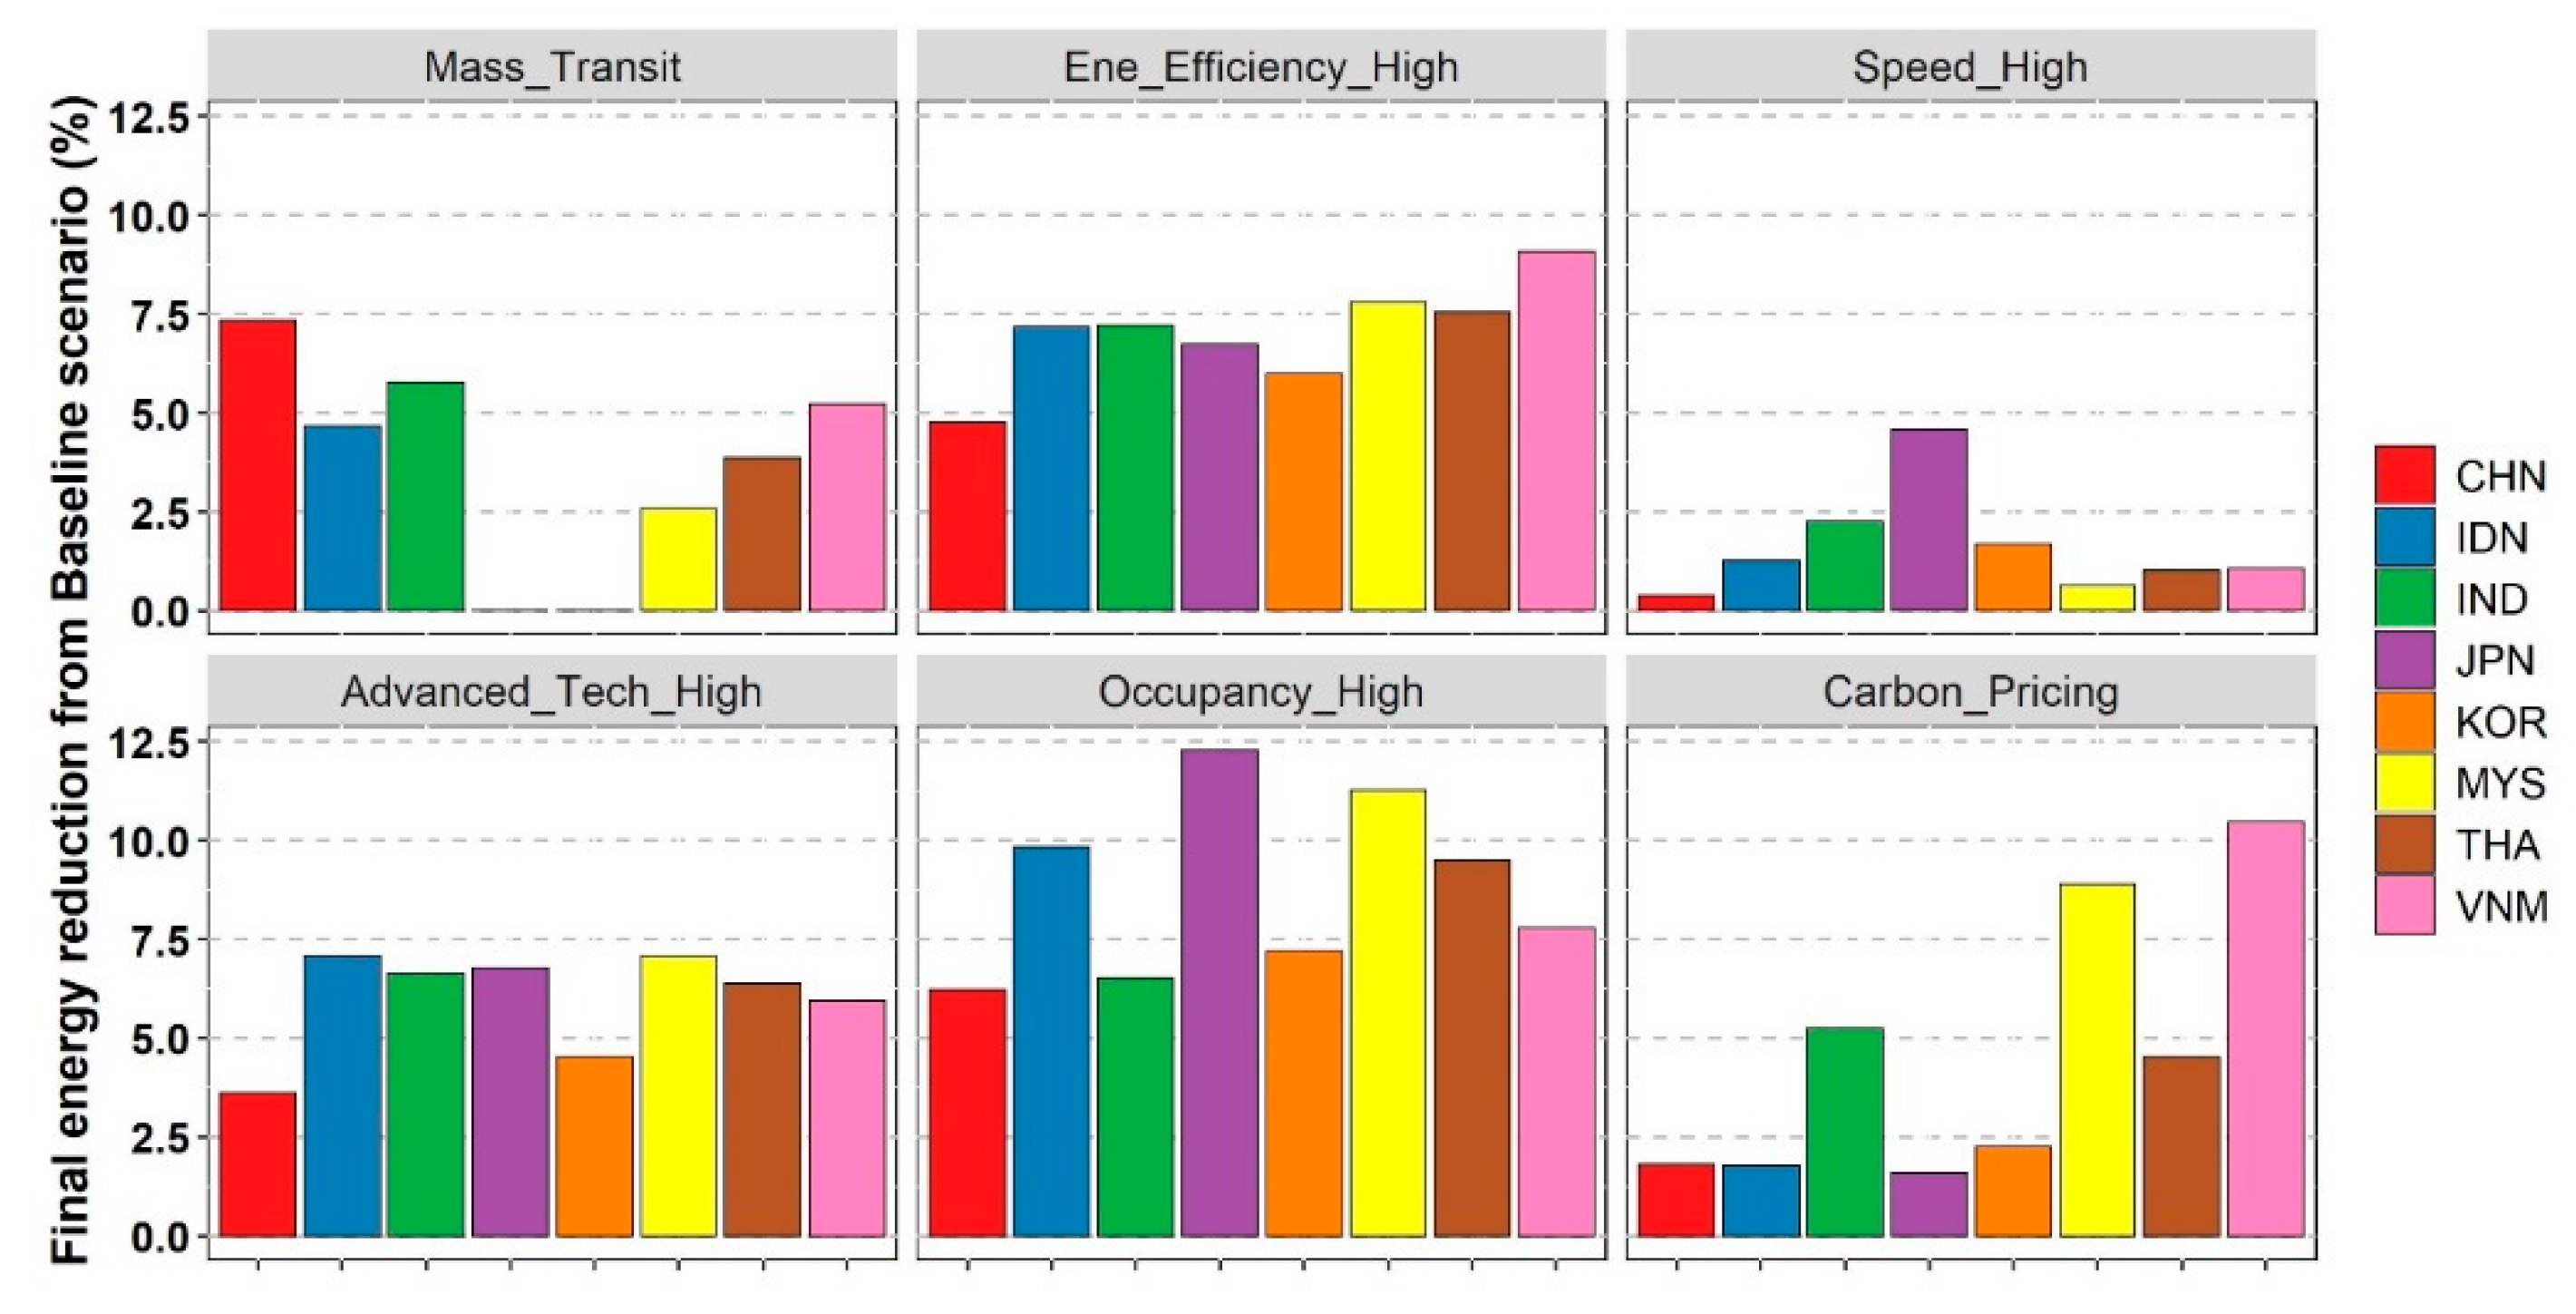
Figure 5 shows the final energy reduction rates in single-policy scenarios in 2050, compared with the baseline scenario. We excluded APS_Strong scenario here because it does not affect transport demand and energy consumption. Notably, reduction rates differ among countries and scenarios. The Mass_Transit scenario, Ene_Efficiency_High scenario and Advanced_Tech_High scenario have similar reduction rates, varying from 2.5% to 10.0%. In the Mass_Transit scenario, the change of preference parameter leads to an increase of the share of public transportation, and it is only effective in developing countries because of the stable modal structure in developed countries. In the Ene_Efficiency_High scenario, stronger fuel economy is achieved to improve energy efficiency. In the Advanced_Tech_High scenario, the preference parameter of advanced technologies affects the share of each technology and then changes the energy structure. The Speed_High scenario is less effective than other scenarios, with reduction rates of less than 5%. Among countries, Japan has the highest reduction rate due to the high time sensitivity. The Occupancy_High scenario shows the greatest reduction rates in most countries (6% to 12.5%), which reveals the significant effect of increasing the load factor of passenger cars on reducing energy consumption. The function of the Carbon_Pricing scenario varies among countries. China, Indonesia, Japan, and Korea exhibit reduction rates of less than 2.5%, whereas India, Thailand, Malaysia, and Vietnam experience reduction rates of 5% to 10%. Change in the carbon intensity due to the carbon tax leads to the reduction of energy consumption.
3.2.2. Emissions
Figure 6 shows emission reduction rates in single-policy scenarios in 2050, compared with the baseline scenario.
Figure 6 presents the results of CO
2, NO
X, and SO
2, and other pollutants show a similar tendency, which can be found in SI Chapter 6. In general, the Carbon_Pricing and APS_Strong scenarios are most effective. The Carbon_Pricing scenario achieves emission reduction rates of up to 30%, especially in India and Vietnam, and the APS_Strong scenario results in emission reduction rates of up to 80%. The reduction benefits in transport-based policy scenarios (i.e., Mass_Transit scenario, Ene_Efficiency_High scenario, Speed_High scenario, Advanced_Tech_High scenario, and Occupancy_High scenario) are similar across emission species with reduction benefits less than 10%. This is because transport-based policy scenarios do not change the emission factors, thus, relationships among emission species are relatively fixed. In the Carbon_Pricing scenario, reduction rates of different emission species in the same country show similar values. The differences across countries in this scenario can mainly be attributed to GDP losses in order to achieve a 50% reduction in greenhouse gas emissions, and the change of average carbon content when a carbon tax is implemented. The reduction rate in the APS_Strong scenario differs across emission species and countries, depending on the extent of changes in the emission factor.
3.3. Results in Sustainable Development Scenario
The SD scenario simultaneously adopts a series of transport policies, an emission control policy, and a carbon pricing policy. To understand the synergy of various policies and clarify the contribution of each policy, we compared the reduction rates of energy and emission in the SD scenario and the sum of single policies, and used residual to show the discrepancy between the reduction rates in the SD scenario and the sum of reduction rates of each policy. Each single scenario corresponds to a dimension factor. Specifically, the Carbon_Pricing scenario, APS_Strong scenario, Ene_Efficiency_High scenario, Mass_Transit scenario, Advanced_Tech_High scenario, Occupancy_High scenario, and Speed_High scenario correspond to carbon pricing, emission control, energy efficiency, modal shifts, advanced technology, load factor, and speed, respectively.
3.3.1. National Level
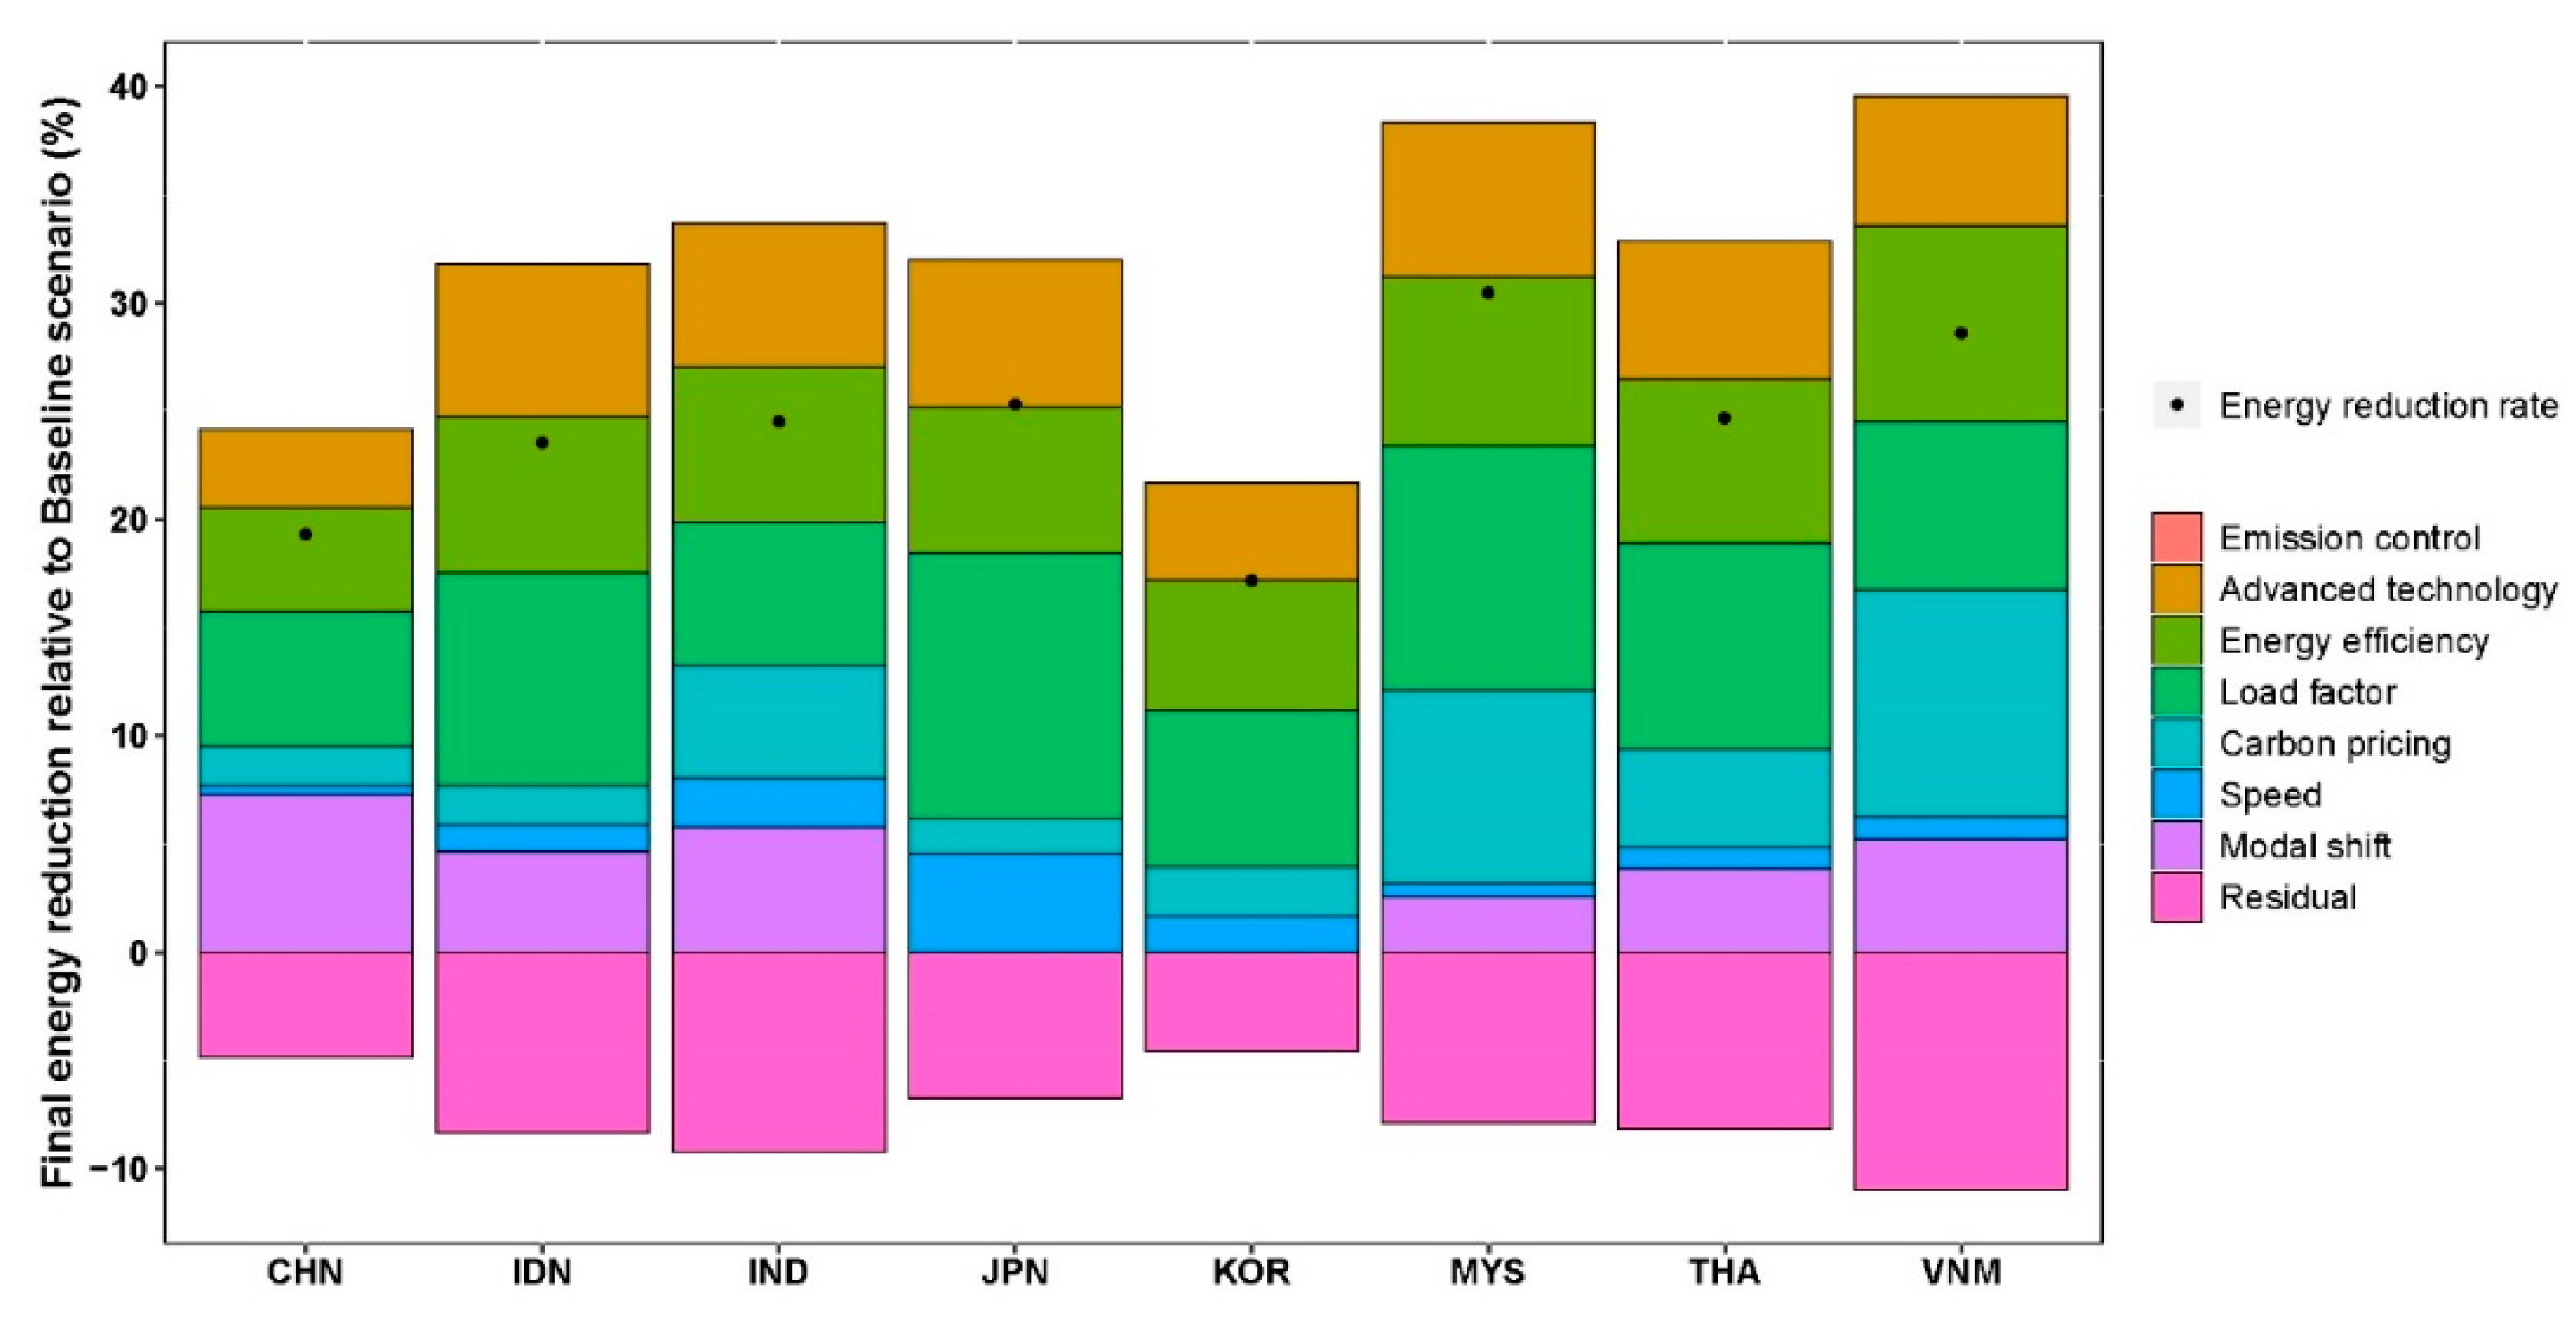
The contribution of each factor in national energy and emission reduction rates in 2050, compared with the baseline scenario, are presented in
Figure 7 and
Figure 8, respectively. Black points show the reduction rate in the SD scenario. Residual shows the discrepancy between the SD scenario and the sum of single-policy scenario. Energy reduction rates in the SD scenario range from 17.1% in Korea to 30.5% in Malaysia. Load factor and energy efficiency are the two largest contributors to energy reduction. Carbon pricing is most effective in India (5.3%), Malaysia (8.9%), and Vietnam (10.5%), where GDP losses are larger than in other countries.
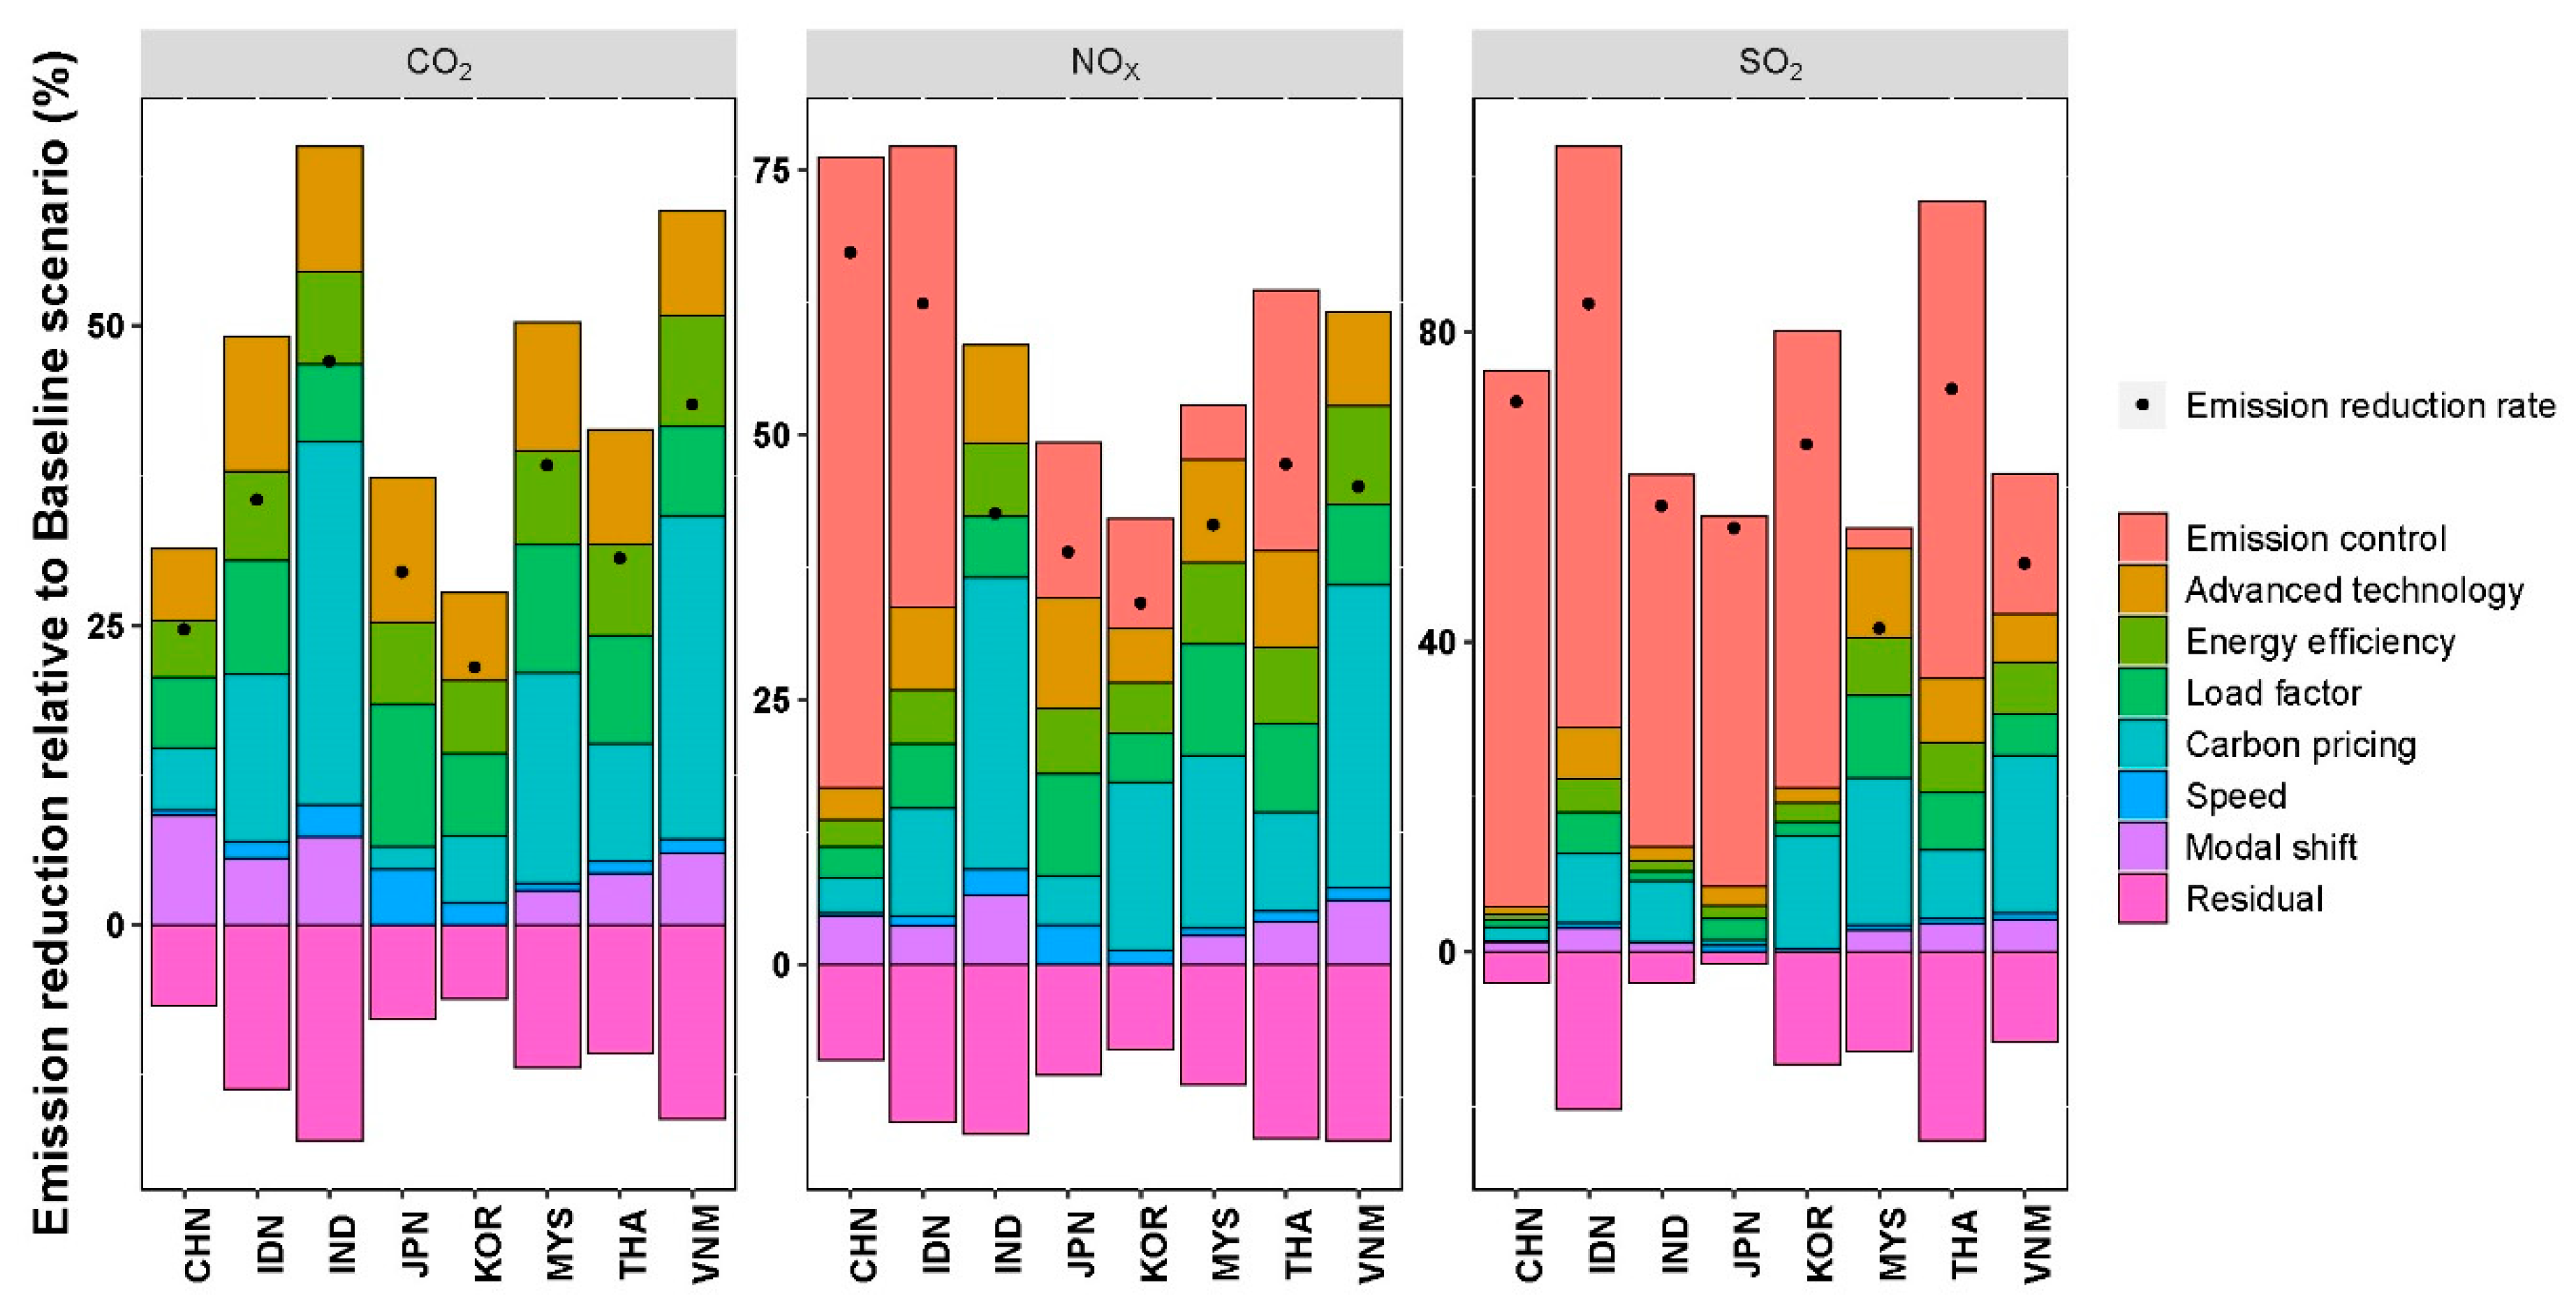
Figure 8 shows the emission reduction results of CO
2, NO
X, and SO
2. Other pollutants have similar results and can be found in SI Chapter 6. The emission reduction benefits in the SD scenario came up to 83% in Indonesia (SO
2). The reduction rates of CO
2 range from 21% in Korea to 48% in India. The effectiveness of these scenarios in each country depends on the energy structure and the discrepancy of scenario setting between the baseline scenario and these scenarios. Although the contributions of emission control in air pollutants emissions reduction vary across countries and emission species, emission control dominates the reduction results for China, Indonesia, Japan, Korea, Malaysia, and Thailand (more than 80% of total emission results), while carbon pricing is the largest contributor to CO
2 emission reduction in most countries. Differences among countries are similar to the results of energy reduction.
3.3.2. Regional Aggregates
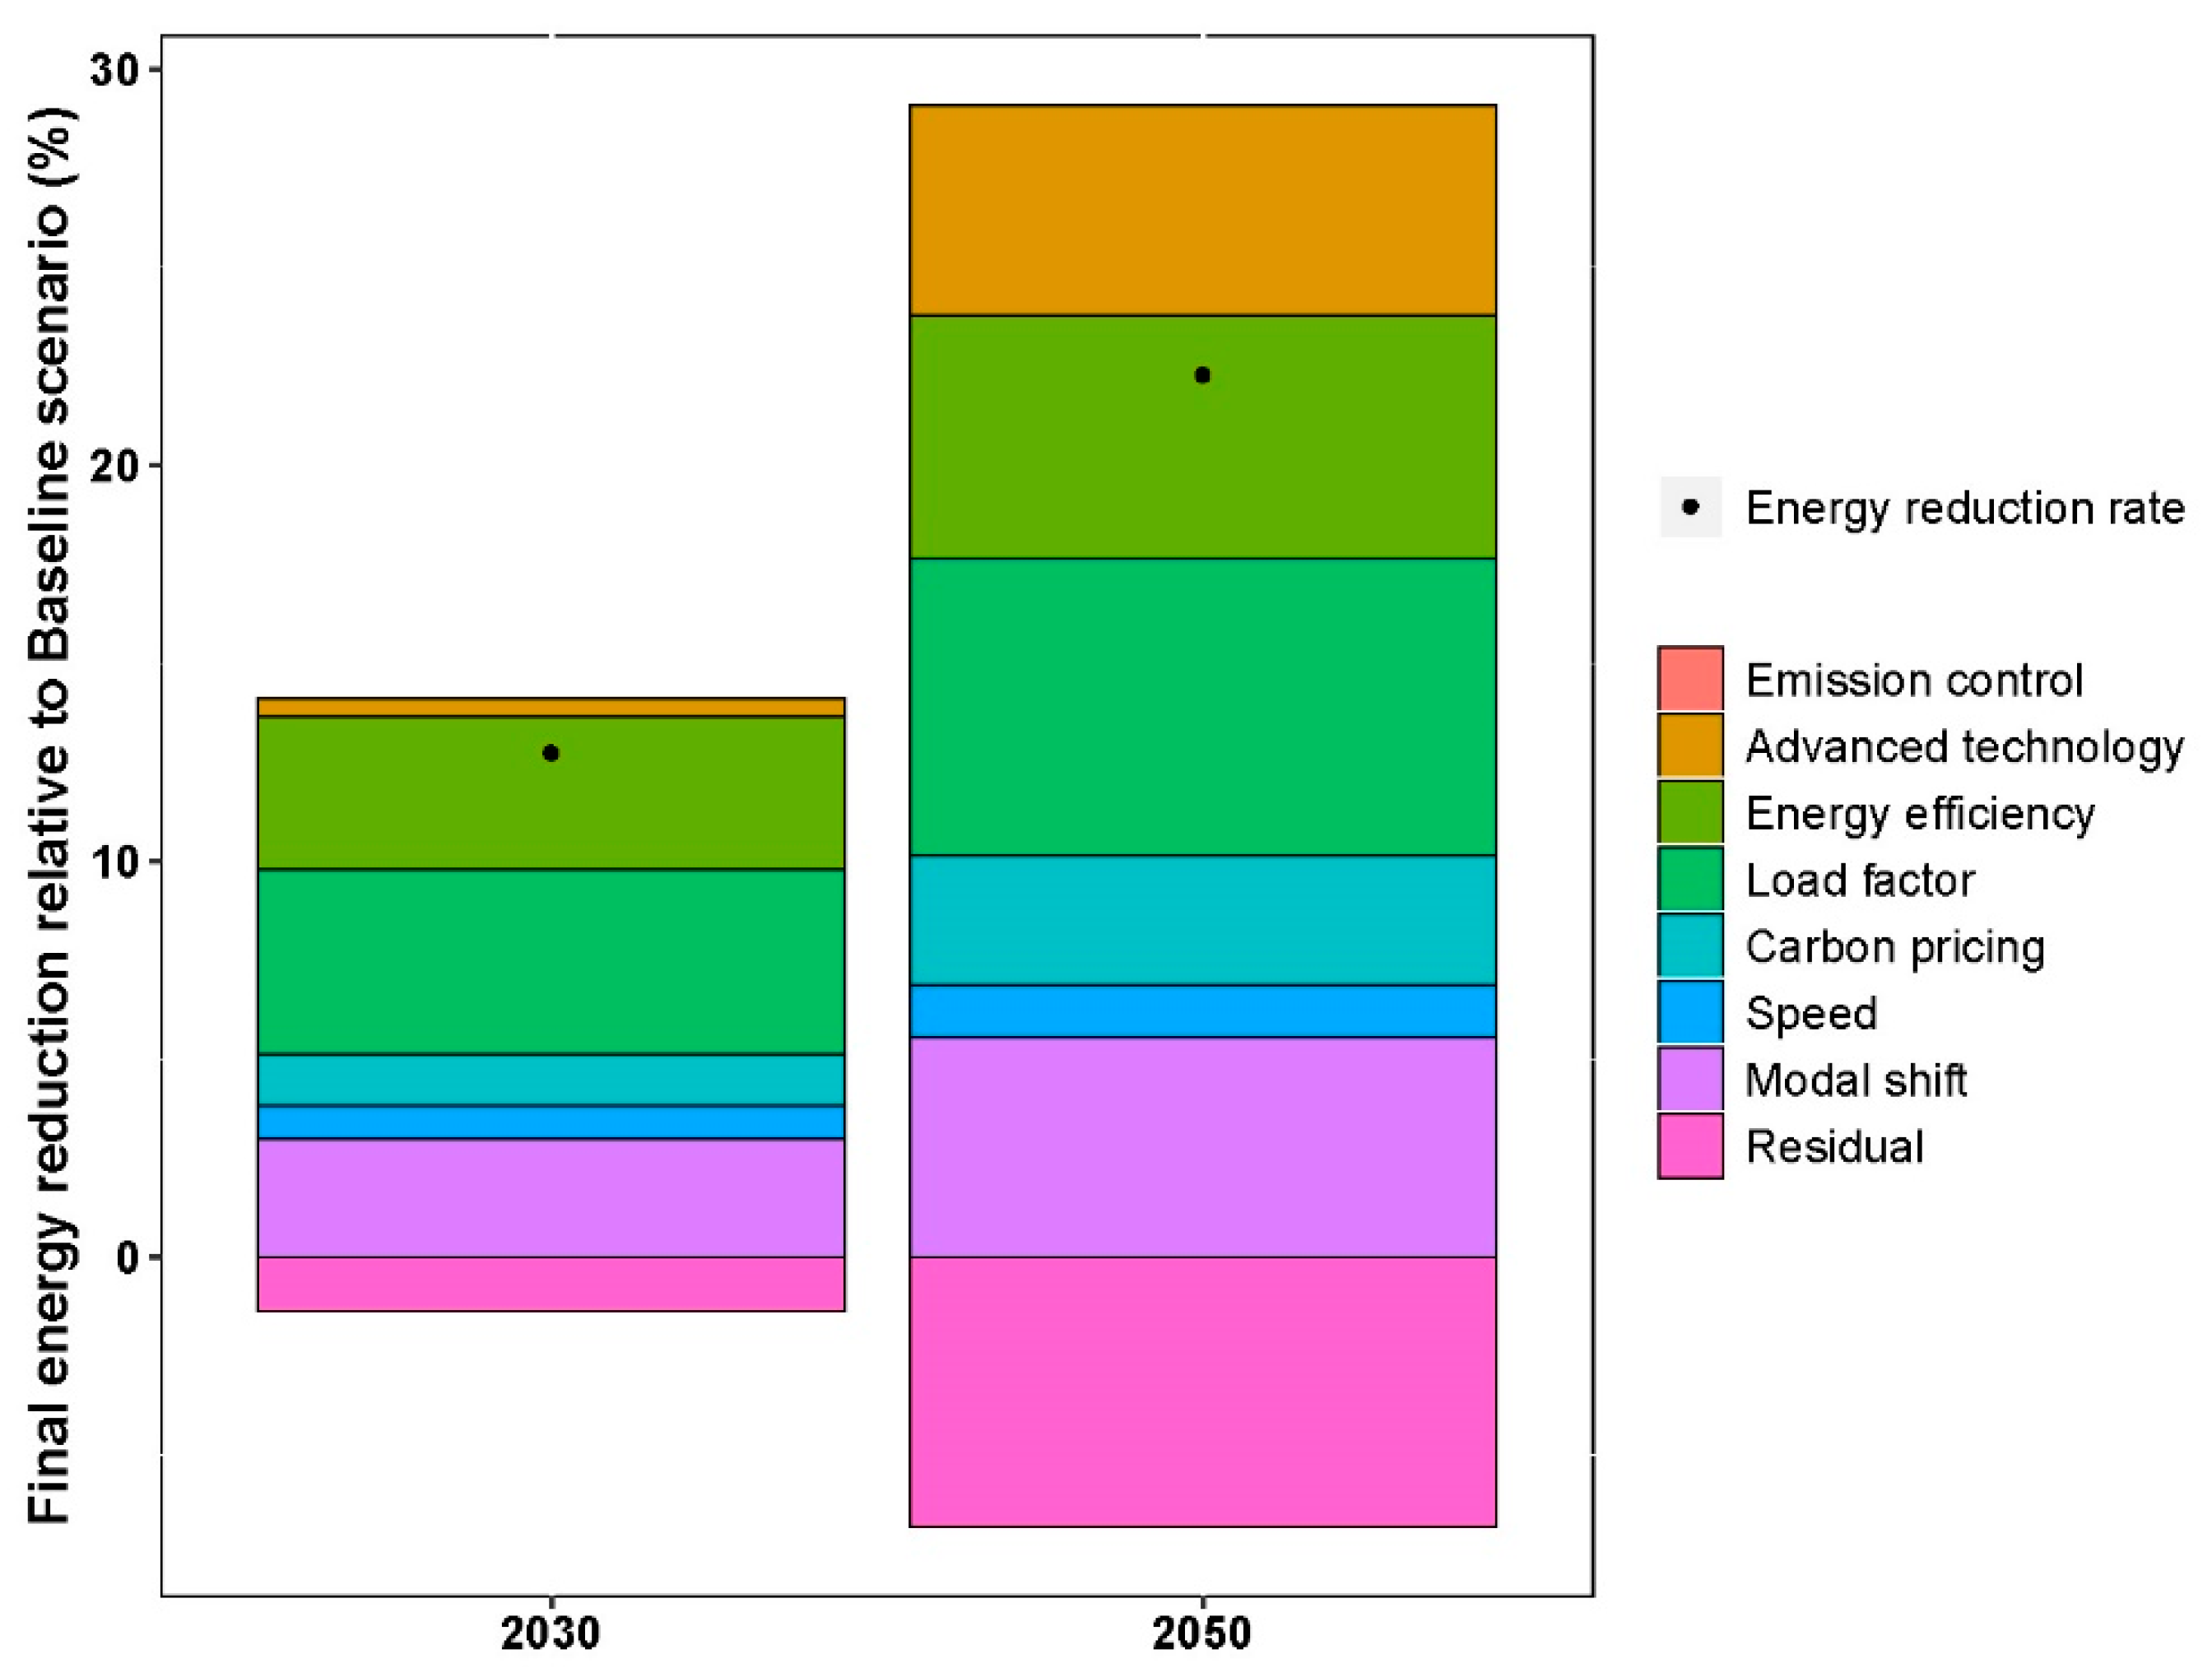
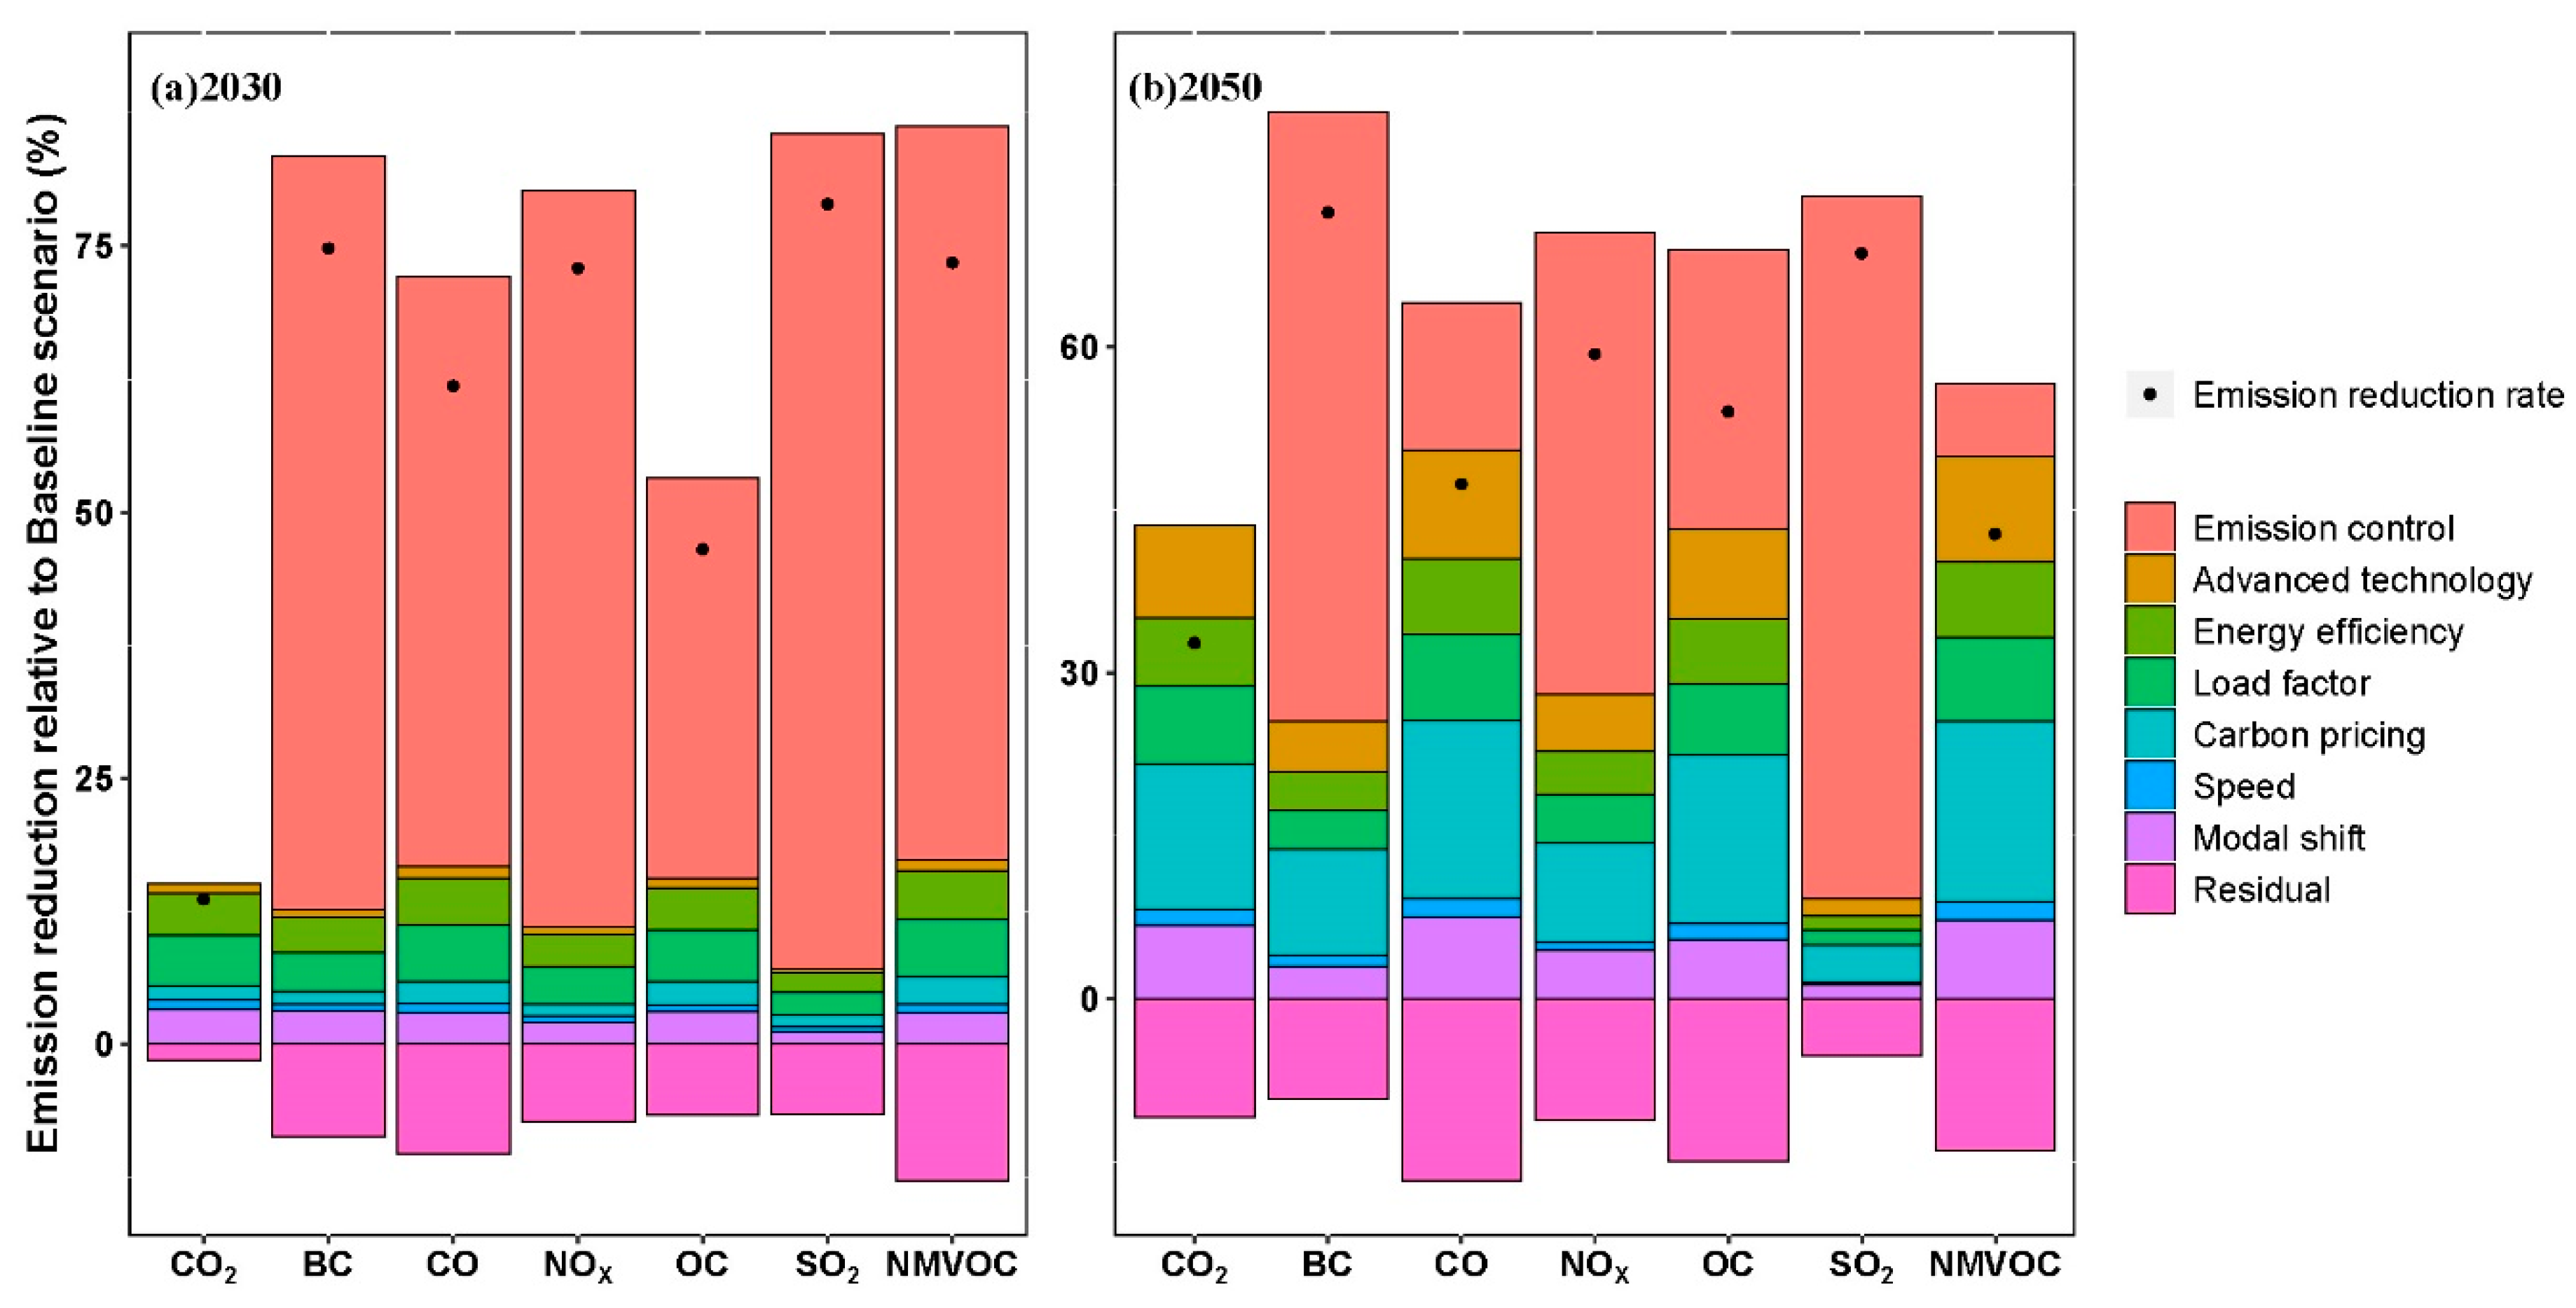
In this sector, reduction rates of eight selected countries are aggregates to show the regional reduction benefits. The contributions of each factor in energy and emission reduction rates, compared with the baseline scenario in 2030 and 2050, are shown in
Figure 9 and
Figure 10. Similar to
Figure 8 and
Figure 9, black points show the reduction rate in the SD scenario. Residual shows the discrepancy between the SD scenario and the sum of single-policy scenario. The reduction benefits in the SD scenario are lower than the sum of the single-policy scenario, so the residuals in
Figure 9 and
Figure 10 are negative.
In
Figure 9, the SD scenario shows energy reduction rates of 12.7% and 22.3% in 2030 and 2050; energy efficiency, load factor, and modal shift are the main factors for energy saving in 2030, and these factors will continue to play a role in 2050 (with a slight increase). The effects of advanced technology and carbon pricing are not obvious in the short term, and they will bring greater reduction benefits by 2050. The energy reduction benefits due to higher speed are not impressive both in 2030 and 2050.
In
Figure 10, CO
2 emission reduction rates in the SD scenario by 2050 are 32.7%; those of BC, CO, NO
X, OC, SO
2, and NMVOC are estimated to be 72.4%, 47.4%, 59.3%, 54.0%, 68.6%, and 42.8%, respectively. For most air pollutants, emission control is the largest contributor to air pollutant reductions, specifically those of OC, NO
X, BC, and SO
2. Carbon pricing is the second largest contributor, with reduction rates ranging from 3.5% of SO
2 to 15.6% of NO
X. Advanced technology, energy efficiency, load factor, and modal shift contribute to reduction rates of approximately 10%, while speed policy is relatively less effective for all pollutants and CO
2, with a reduction rate of approximately 1%. Carbon pricing is the largest contributor to CO
2 reductions, with a reduction rate of 13.3%, followed by advanced technology with a reduction rate of 8.5%. Carbon pricing and five transport policy-related factors show similar reduction benefits across pollutants, except for SO
2 (reduction benefits are largely reduced). Notably, the railway sector is the largest source of SO
2 emissions in some countries, due to the high emission factor of traditional internal combustion trains (
Figure 4). Emission control has an overwhelming advantage in SO
2 emission control.
Importantly, the contributions of specific factors vary greatly between 2030 and 2050. The tendency is similar with results in energy reduction, shown in
Figure 9. In 2030, carbon pricing and advanced technology have relatively lower contributions to reduction, relative to other factors; they contribute only 1.1% to 2.3% and 0.4% to 1.0%, respectively. Conversely, both policies have large impacts on reductions in 2050, contributing 3.5% to 16.6% and 1.6% to 10.0%, respectively. Energy efficiency, load factor, and modal shift show similar contributions to reduction in 2030 and 2050, with rates of 1.2% to 7.0%, 1.4% to 7.8%, and 1.1% to 7.2%, respectively. Speed policy has a small impact on emission reductions; less than 2% in 2030 and 2050. This is presumably because, although the impacts of all scenarios increase each year, annual changes in carbon price and preference parameters of advanced technologies are more obvious and emissions are more sensitive to these two parameters. The impacts of the emission control policy also vary across emission species and periods, from 0% for CO
2 to 78% for SO
2, due to differences in emission factor rate changes. In 2030, the emission control policy has an overwhelming advantage compared with other policies; in 2050, with the reduced cleanness rate of emission factors for some pollutants, the contribution of the emission control policy decreases and other policies begin to have a greater impact.
4. Discussion
The results in the SD scenario imply that the emission control policy is most effective for reducing air pollutant emissions, which can be realized by implementing strong legislation or introducing advanced low-emissions technologies that are currently available in developed countries. The short-term effect is greater than the long-term effect; the short-term effect constitutes more than 80% of the associated reduction. In long-term analysis, carbon pricing shows greater benefits. Based on these findings, policymakers may want to prioritize specific policies over time. A carbon pricing policy has certain reduction effects on CO2 emissions, but is limited. Changing transport behavior plays another important role in reducing CO2 emissions. Notably, the effects of these policies vary among countries. The differences in the energy structure and policy status of each country determine the effectiveness of these policies in each country.
Residuals in the SD scenario decomposition were small, compared to the total percentage of emissions changes. However, they might not be small, compared with other policy effects (e.g., non-emissions control policies). Thus, this analysis indicates that the effects of the emissions control policy would be large, while other policies can be affected by decomposition in air pollution. This residual is a cross-sectional effect; it does not indicate that other policies lack effectiveness. For CO2, similar conclusions can be drawn regarding the carbon pricing policy, rather than the emissions control policy.
The scenarios in this study represent a single possibility. Unfortunately, good information is unavailable for the region or for individual countries. A comparison with global estimates (shown in the SI Chapter 7) indicated results similar to those of other studies, in terms of total transport demand and associated energy consumption, suggesting that our scenarios are realistic. However, we encourage other modeling teams to perform similar assessments.
Several aspects of this study can be improved in future analyses. First, this study only considered downstream emissions (tank to wheels), whereas upstream emissions (well to tank)—including energy extraction, energy storage, energy transportation, fuel transportation, storage, and distribution—should also be considered. Second, the time cost in the freight sector was assumed to be zero in this study, due to a lack of data, and would benefit from further investigation. Third, the cost of infrastructure (e.g., airports, railway stations, and navigation ports) for some modes was not fully included here, although it may affect modal share. Finally, this study mainly assessed the effectiveness of measures to reduce either emissions or energy in the transport model. However, policy implementation or behavioral change may be costly. Because it is difficult to identify such costs, policymakers need to consider balancing effectiveness and costs.
5. Conclusions
We examined scenarios using the AIM/Transport model to analyze the impacts of behaviors, emission control, and carbon pricing policy on transport-related emission reductions through 2050 for eight major Asian countries, both individually and in aggregate. Our analysis found that emission control policies have a major effect on air pollution reduction, especially with respect to short-term reduction. Carbon pricing policies also have significant emission reduction benefits and should be prioritized for mid-term reduction, both for carbon and for air pollutants overall. The reduction benefits of public transportation, higher energy efficiency, higher load factor, and advanced technology are similar and noticeable; however, the effects differ among individual countries. In general, promotion of clean energy and advanced technology can lead to large emission reduction benefits in all countries, both for air pollutants and CO2, and should be regarded as primary policy solutions in all countries. Modal shift to public transportation in developing countries can also have a significant impact on emission reduction and should receive greater attention. Increasing fleet speed is most effective in Japan, but the effect is quite limited and can only be used as a supplementary policy.
Author Contributions
Conceptualization, S.B., S.F., and K.O.; methodology, S.F., S.B., O.N., S.F., K.O., and R.Z.; software, R.Z.; validation, S.B., S.F., and K.O.; formal analysis, S.B. and S.F.; investigation, S.B., S.F., and K.O.; resources, O.N., S.F., and K.O.; data curation, S.B., O.N., S.F., K.O., and R.Z.; writing—original draft preparation, S.B.; writing—review and editing, S.F., K.O.; visualization, S.B.; supervision, S.F., and K.O.; project administration, S.F.; funding acquisition, S.F., and K.O. All authors have read and agreed to the published version of the manuscript.
Funding
This research was funded by Environment Research and Technology Development of the Environmental Restoration and Conservation Agency of Japan, fund grant number JPMEERF20192008, and the Sumitomo foundation.
Conflicts of Interest
The authors declare no conflict of interest.
References
- IEA. Data & Statistics. Available online: https://www.iea.org/data-and-statistics?country=WORLD&fuel=Energy+consumption&indicator=Share+of+total+final+consumption+%28TFC%29+by+sector (accessed on 1 February 2020).
- IEA. CO2 Emissions from Fuel Combustion Highlights 2019; International Energy Agency: Paris, France, 2019. [Google Scholar]
- ITF. ITF Transport Outlook; OECD Publishing: Paris, France, 2019. [Google Scholar]
- Hoesly, R.M.; Smith, S.J.; Feng, L.; Klimont, Z.; Janssens-Maenhout, G.; Pitkanen, T.; Seibert, J.J.; Vu, L.; Andres, R.J.; Bolt, R.M.; et al. Historical (1750–2014) anthropogenic emissions of reactive gases and aerosols from the Community Emissions Data System (CEDS). Geosci. Model Dev. 2018, 11, 369–408. [Google Scholar] [CrossRef]
- Brand, C.; Goodman, A.; Ogilvie, D. Evaluating the impacts of new walking and cycling infrastructure on carbon dioxide emissions from motorized travel: A controlled longitudinal study. Appl. Energy 2014, 128, 284–295. [Google Scholar] [CrossRef]
- Wang, Z.; Liu, W. Determinants of CO2 emissions from household daily travel in Beijing, China: Individual travel characteristic perspectives. Appl. Energy 2015, 158, 292–299. [Google Scholar] [CrossRef]
- Zhang, R.; Fujimori, S.; Hanaoka, T. The contribution of transport policies to the mitigation potential and cost of 2 °C and 1.5 °C goals. Environ. Res. Lett. 2018, 13, 054008. [Google Scholar] [CrossRef]
- Scheiner, J. Interrelations between travel mode choice and trip distance: Trends in Germany 1976–2002. J. Transp. Geogr. 2010, 18, 75–84. [Google Scholar] [CrossRef]
- Ashiabor, S.; Baik, H.; Trani, A. Logit models for forecasting nationwide intercity travel demand in the United States. Transp. Res. Rec. J. Transp. Res. Board 2007, 2007, 1–12. [Google Scholar] [CrossRef]
- Edelenbosch, O.; Mccollum, D.; Van Vuuren, D.P.; Bertram, C.; Carrara, S.; Daly, H.; Fujimori, S.; Kitous, A.; Kyle, P.; Broin, E.Ó.; et al. Decomposing passenger transport futures: Comparing results of global integrated assessment models. Transp. Res. Part D Transp. Environ. 2017, 55, 281–293. [Google Scholar] [CrossRef]
- Kyle, P.; Kim, S.H. Long-term implications of alternative light-duty vehicle technologies for global greenhouse gas emissions and primary energy demands. Energy Policy 2011, 39, 3012–3024. [Google Scholar] [CrossRef]
- Grahn, M.; Azar, C.; Williander, M.I.; Anderson, J.; Mueller, S.A.; Wallington, T.J. Fuel and vehicle technology choices for passenger vehicles in achieving stringent CO2 targets: Connections between transportation and other energy sectors. Environ. Sci. Technol. 2009, 43, 3365–3371. [Google Scholar] [CrossRef]
- Zhang, H.; Chen, W.; Huang, W. TIMES modelling of transport sector in China and USA: Comparisons from a decarbonization perspective. Appl. Energy 2016, 162, 1505–1514. [Google Scholar] [CrossRef]
- Fujimori, S.; Kainuma, M.; Masui, T.; Hasegawa, T.; Dai, H. The effectiveness of energy service demand reduction: A scenario analysis of global climate change mitigation. Energy Policy 2014, 75, 379–391. [Google Scholar] [CrossRef]
- Fujimori, S.; Masui, T.; Matsuoka, Y. Gains from emission trading under multiple stabilization targets and technological constraints. Energy Econ. 2015, 48, 306–315. [Google Scholar] [CrossRef]
- Fujimori, S.; Masui, T.; Matsuoka, Y. Development of a global computable general equilibrium model coupled with detailed energy end-use technology. Appl. Energy 2014, 128, 296–306. [Google Scholar] [CrossRef]
- Hasegawa, T.; Fujimori, S.; Shin, Y.; Takahashi, K.; Masui, T.; Tanaka, A. Climate change impact and adaptation assessment on food consumption utilizing a new scenario framework. Environ. Sci. Technol. 2013, 48, 438–445. [Google Scholar] [CrossRef] [PubMed]
- Mittal, S.; Dai, H.; Fujimori, S.; Hanaoka, T.; Zhang, R. Key factors influencing the global passenger transport dynamics using the AIM/transport model. Transp. Res. Part D Transp. Environ. 2017, 55, 373–388. [Google Scholar] [CrossRef]
- Zhang, R.; Fujimori, S.; Dai, H.; Hanaoka, T. Contribution of the transport sector to climate change mitigation: Insights from a global passenger transport model coupled with a computable general equilibrium model. Appl. Energy 2018, 211, 76–88. [Google Scholar] [CrossRef]
- Akashi, O.; Hijioka, Y.; Masui, T.; Hanaoka, T.; Kainuma, M. GHG emission scenarios in Asia and the world: The key technologies for significant reduction. Energy Econ. 2012, 34, S346–S358. [Google Scholar] [CrossRef]
- Akashi, O.; Hanaoka, T. Technological feasibility and costs of achieving a 50% reduction of global GHG emissions by 2050: Mid- and long-term perspectives. Sustain. Sci. 2012, 7, 139–156. [Google Scholar] [CrossRef]
- Valles-Gimenez, J.; Zárate-Marco, A. A dynamic spatial panel of subnational GHG emissions: Environmental effectiveness of emissions taxes in Spanish regions. Sustainability 2020, 12, 2872. [Google Scholar] [CrossRef]
- Kishimoto, P.; Karplus, V.J.; Zhong, M.; Saikawa, E.; Zhang, X.; Zhang, X. The impact of coordinated policies on air pollution emissions from road transportation in China. Transp. Res. Part D Transp. Environ. 2017, 54, 30–49. [Google Scholar] [CrossRef]
- Fujimori, S.; Masui, T.; Matsuoka, Y. AIM/CGE [Basic] Manual; Center for Social and Environmental Systems Research, NIES: Tsukuba, Japan, 2012.
- IIASA. SSP Public Database Version 2.0. Available online: https://tntcat.iiasa.ac.at/SspDb/dsd?Action=htmlpage&page=10#v2 (accessed on 1 February 2020).
- Riahi, K.; van Vuuren, D.P.; Kriegler, E.; Edmonds, J.; O’Neill, B.C.; Fujimori, S.; Bauer, N.; Calvin, K.; Dellink, R.; Fricko, O.; et al. The shared socioeconomic pathways and their energy, land use, and greenhouse gas emissions implications: An overview. Glob. Environ. Chang. 2017, 42, 153–168. [Google Scholar] [CrossRef]
- Mishra, G.S.; Kyle, P.; Teter, J.; Morrison, G.M.; Kim, S.H.; Yeh, S. Transportation Module of Global Change Assessment Model (GCAM): Model Documentation; Research Report—(UCD-ITS-RR-13-05); Institute of Transportation Studies, University of California: Davis, CA, USA, 2013. [Google Scholar]
- Purohit, P.; Amann, M.; Kiesewetter, G.; Rafaj, P.; Chaturvedi, V.; Dholakia, H.H.; Koti, P.N.; Klimont, Z.; Borken-Kleefeld, J.; Gomez-Sanabria, A.; et al. Mitigation pathways towards national ambient air quality standards in India. Environ. Int. 2019, 133, 105147. [Google Scholar] [CrossRef] [PubMed]
- Li, N.; Chen, W.; Rafaj, P.; Kiesewetter, G.; Schöpp, W.; Wang, H.; Zhang, H.; Krey, V.; Riahi, K. Air quality improvement co-benefits of low-carbon pathways toward well below the 2 °C climate target in China. Environ. Sci. Technol. 2019, 53, 5576–5584. [Google Scholar] [CrossRef] [PubMed]
- Rao, S.; Klimont, Z.; Smith, S.J.; Van Dingenen, R.; Dentener, F.; Bouwman, A.F.; Riahi, K.; Amann, M.; Bodirsky, B.L.; Van Vuuren, D.P.; et al. Future air pollution in the shared socio-economic pathways. Glob. Environ. Chang. 2017, 42, 346–358. [Google Scholar] [CrossRef]
Figure 1.
Modeling framework.
Figure 1.
Modeling framework.
Figure 2.
(a) GDP and (b) population assumption.
Figure 2.
(a) GDP and (b) population assumption.
Figure 3.
(a) Transport demand in passenger sector, (b) transport demand in freight sector, (c) final energy consumption, and (d) CO2 emissions in the baseline scenario. Numbers above bars show multiples of 2050, relative to 2005.
Figure 3.
(a) Transport demand in passenger sector, (b) transport demand in freight sector, (c) final energy consumption, and (d) CO2 emissions in the baseline scenario. Numbers above bars show multiples of 2050, relative to 2005.
Figure 4.
Emission share by mode in 2050 in the baseline scenario. Passenger road sector includes passenger cars, buses, and 2-wheelers. Railway and aviation sectors include both passenger and freight sectors.
Figure 4.
Emission share by mode in 2050 in the baseline scenario. Passenger road sector includes passenger cars, buses, and 2-wheelers. Railway and aviation sectors include both passenger and freight sectors.
Figure 5.
Final energy reduction rates in single-policy scenarios in 2050, compared with the baseline scenario.
Figure 5.
Final energy reduction rates in single-policy scenarios in 2050, compared with the baseline scenario.
Figure 6.
Emission reduction rates in single-policy scenarios in 2050, compared with the baseline scenario.
Figure 6.
Emission reduction rates in single-policy scenarios in 2050, compared with the baseline scenario.
Figure 7.
Contribution of each factor to the national energy reduction in the Sustainable Development (SD) scenario in 2050, compared with the baseline scenario.
Figure 7.
Contribution of each factor to the national energy reduction in the Sustainable Development (SD) scenario in 2050, compared with the baseline scenario.
Figure 8.
Contribution of each factor to national emission reductions in the SD scenario in 2050, compared with the baseline scenario.
Figure 8.
Contribution of each factor to national emission reductions in the SD scenario in 2050, compared with the baseline scenario.
Figure 9.
Contribution of each factor to regional energy reduction in the SD scenario in 2030 and 2050, compared with the baseline scenario.
Figure 9.
Contribution of each factor to regional energy reduction in the SD scenario in 2030 and 2050, compared with the baseline scenario.
Figure 10.
Contribution of each factor to regional emission reductions in the SD scenario in (a) 2030 and (b) 2050, compared with the baseline scenario.
Figure 10.
Contribution of each factor to regional emission reductions in the SD scenario in (a) 2030 and (b) 2050, compared with the baseline scenario.
Table 1.
Scenario framework. “-” means it is the same as the baseline scenario.
Table 1.
Scenario framework. “-” means it is the same as the baseline scenario.
| Scenario Name | Energy Efficiency Improvement Rate | Mode Preference Parameter | Mode Speed | Advanced Technologies Preference Parameter | Load Factor | Emission Factor | Carbon Pricing | GDP & Population |
|---|
| Baseline | Constant | Converge to the average value of US and Japan in 2100 | Increase | Same as other technologies | Decrease | Central level | No | SSP2 |
| Ene_Efficiency_High | Double in new light duty vehicle efficiency from baseline | - | - | - | - | - | - | - |
| Mass_Transit | - | Converge to Japan’s value in 2100 | - | - | - | - | - | - |
| Speed_High | - | - | Increase with a higher rate | - | - | - | - | - |
| Advanced_Tech_High | - | - | - | High | - | - | - | - |
| Occupancy_High | - | - | - | - | Increase | - | - | - |
| APS_Strong | - | - | - | - | - | Strong level | - | - |
| Carbon_Pricing | - | - | - | - | - | - | Yes | SSP2 with GDP loss |
| Sustainable development (SD) | Double in new light duty vehicle efficiency from baseline | Converge to Japan’s value in 2100 | Increase with a higher rate | High | Increase | Strong level | Yes | SSP2 with GDP loss |
Table 2.
GDP loss rate and carbon price in Carbon_Pricing scenario in 2050 compared with baseline scenario.
Table 2.
GDP loss rate and carbon price in Carbon_Pricing scenario in 2050 compared with baseline scenario.
| Country | CHN | IDN | IND | JPN | KOR | MYS | THA | VNM |
|---|
| GDP loss rate | 5.21% | 1.59% | 6.34% | 0.41% | 4.08% | 3.34% | 5.14% | 28.87% |
| Carbon price (2005 USD/tCO2) | 103 | 102 | 207 | 83 | 339 | 99 | 105 | 84 |
Table 3.
Air pollutant emissions in the baseline scenario.
Table 3.
Air pollutant emissions in the baseline scenario.
| Gas | Item | CHN | IDN | IND | JPN | KOR | MYS | THA | VNM |
|---|
| BC (kt/yr) | 2005 | 50.3 | 5.8 | 28.3 | 8.4 | 5.6 | 2.3 | 3.5 | 1.1 |
| 2050 | 42.7 | 6.3 | 15.1 | 3.2 | 2.5 | 2.5 | 1.2 | 1.5 |
| Annual change rate | −0.4% | 0.2% | −1.4% | −2.1% | −1.8% | 0.2% | −2.5% | 0.7% |
| CO (Mt/yr) | 2005 | 41.0 | 12.4 | 15.3 | 5.5 | 3.3 | 5.7 | 8.0 | 2.7 |
| 2050 | 12.3 | 3.0 | 9.4 | 1.6 | 1.4 | 1.6 | 1.4 | 1.0 |
| Annual change rate | −2.6% | −3.1% | −1.1% | −2.6% | −2.0% | −2.8% | −3.8% | −2.2% |
| NOX (Mt/yr) | 2005 | 2.4 | 0.7 | 0.9 | 0.4 | 0.3 | 0.3 | 0.4 | 0.1 |
| 2050 | 1.6 | 0.3 | 0.4 | 0.1 | 0.1 | 0.1 | 0.1 | 0.0 |
| Annual change rate | −0.9% | −1.9% | −1.8% | −3.6% | −3.0% | −3.2% | −3.1% | −2.8% |
| OC (kt/yr) | 2005 | 140.2 | 25.3 | 177.0 | 14.5 | 8.9 | 15.3 | 21.9 | 7.4 |
| 2050 | 50.7 | 9.6 | 36.8 | 5.9 | 6.2 | 13.1 | 3.5 | 8.4 |
| Annual change rate | −2.2% | −2.1% | −3.4% | −2.0% | −0.8% | −0.4% | −4.0% | 0.3% |
| SO2 (kt/yr) | 2005 | 363.1 | 46.0 | 167.2 | 46.9 | 12.3 | 10.4 | 16.2 | 5.8 |
| 2050 | 101.9 | 6.6 | 21.7 | 4.8 | 2.3 | 0.6 | 2.1 | 0.5 |
| Annual change rate | −2.8% | −4.2% | −4.4% | −4.9% | −3.6% | −6.1% | −4.5% | −5.1% |
| NMVOC (Mt/yr) | 2005 | 5.2 | 2.4 | 3.4 | 0.8 | 0.5 | 1.1 | 1.6 | 0.6 |
| 2050 | 1.6 | 0.4 | 1.4 | 0.2 | 0.2 | 0.2 | 0.2 | 0.1 |
| Annual change rate | −2.6% | −4.0% | −2.0% | −2.6% | −1.8% | −3.5% | −4.8% | −2.9% |
© 2020 by the authors. Licensee MDPI, Basel, Switzerland. This article is an open access article distributed under the terms and conditions of the Creative Commons Attribution (CC BY) license (http://creativecommons.org/licenses/by/4.0/).
