Article

The Role of Education in Increasing Awareness and Reducing Impact of Natural Hazards

1
Centre of Natural Science Education, Institute of Ecology and Earth Sciences, University of Tartu, Vanemuise 46, 51014 Tartu, Estonia
2
Department of Geography and Geosciences, Salisbury University, 1101 Camden Avenue, Salisbury, MD 21801, USA
3
Department of Geography, Institute of Ecology and Earth Sciences, University of Tartu, Vanemuise 46, 51014 Tartu, Estonia
*
Author to whom correspondence should be addressed.
Sustainability 2020, 12(18), 7623; https://doi.org/10.3390/su12187623
Submission received: 29 July 2020 / Revised: 29 August 2020 / Accepted: 14 September 2020 / Published: 16 September 2020
(This article belongs to the Section Hazards and Sustainability)

Abstract

:
Education could play a role in decreasing and mitigating damages caused by natural disaster. By analysing relationships between level of education and components of the World Risk Index, this study demonstrated an education’s role in natural hazard awareness and mitigation. For this purpose, we analysed relationships between the components of WRI, created an education factor independent of WRI (based on PISA 2018 Science test results), analysed the frequency, magnitude and exposure of natural hazards of an extreme event character in selected countries and analysed the relationships between the education factor and WRI components among the countries. A detailed analysis was performed for 15 countries representing the full global range of natural hazards (frequency, magnitude and exposure to droughts, earthquakes, hurricanes, floods (not related to hurricanes), mass movements, volcanic eruptions, and tsunamis) and level of education. We found that the education factor (ranked and normalised to the maximal value among the considered countries) has significant negative correlation with the following WRI parameters: the Natural Hazard Factor (relative vulnerability, based on the difference between the relative and calculated WRI, ranked and normalised to the maximal value of WRI differences), susceptibility, lack of coping capacities and lack of adaptive capacities (all ranked and normalised to the maximal value). Results indicated that countries at low risk tend to be over-aware while countries at high risk are under-aware of natural hazards. Education can significantly increase awareness of natural hazards and reduce their impact.

1. Introduction

Although natural hazards and disasters occur in all parts of the world, their distribution is uneven in space and time [1,2]. Natural hazards can cascade, causing severe disasters [2,3]. Population is also concentrated unevenly [4], exposing citizens in some countries to natural hazards more than citizens in others. This, in turn, causes a variety of awareness levels among individuals and the society, and these differences influence disaster reduction measures and their efficiency. Increasing hazard awareness is one way to reduce negative impacts of natural disasters, as people aware of risks are more likely to reduce potential losses [5] (p. 349). When a hazard event takes a significant toll on human life or property, it becomes a natural disaster. A natural disaster is defined by United Nations International Strategy for Disaster Reduction [6] as a “result of the combination of: the exposure to a hazard; the conditions of vulnerability that are present; and insufficient capacity or measures to reduce or cope with the potential negative consequences” [6] (p. 9). There are two broad categories of natural hazards: tectonic and weather hazards. An exhaustive list of hazards includes drought, tropical cyclone, flood, mass wasting (includes landslide, avalanche, soil creep, mud slide, debris flow, etc.), sea level rise, dust storm, heat wave, thunderstorm, lightning, tornado, forest or wildland fire, heavy rain and snow, strong wind, volcanic eruption, tsunami and earthquake and asteroid impact [7] according to internet sources on EM-DAT data [8] and on NOAA data [9]. However, only storms (including tropical cyclones), floods, earthquakes, tsunamis, droughts and, in some cases, volcanic eruptions and mass wasting were considered for the purposes of this study.
Disasters may become more frequent and severe in the future because of population growth, climate change and migration to areas under greater risk, and people’s increased reliability on infrastructure [10]. There is a rising need for socio-ecological resilience to natural hazards and disasters [11]. For instance, in many coastal societies sea-level rise, land subsidence and sediment supply create an inevitable need for reliable hazard management and risk mitigation [12]. Adaptation to increasingly threatening natural hazards and disasters is one of most important strategies for mankind.
Globally, average temperatures have increased since the 1880s [10]. Consequently, weather hazards have increased with the temperatures [13]. Between 1992 and 2001, droughts, floods, tropical cyclones, hurricanes, storm surges, wildfires, landslides and other weather calamities have claimed the lives of more than 622,000 people while affecting more than 2 billion [7].
Demand for information on and understanding of natural hazard related risk on a global scale has grown in recent years. Such information is crucial for stakeholders who are working in the field of disaster risk reduction and spatial planning, as well as for insurance companies establishing premiums for natural-hazard insurance policies [14].
Education influences behavioural intention, which has been defined in relation to the individual as the “subjective probability that he or she will engage in a given behavior” [15]. Intention is seen as a precursor to behavioural action [16]. Therefore, intention is a good indicator of action [17]. While action is the response of individuals to and during a natural-hazard event [18], intention can be solicited in an artificial situation created to seek action [17]. Generally speaking, behavioural response intention is preparation before an event, while action is the behaviour during the natural hazard event. Prior research in educational approaches to teaching behavioural action suggests that teachers should not begin by teaching action related to specific natural hazards but by constructing a knowledge base from bottom-up to develop informed response [18]. Two major educational theories relate to behavioural action:
  • Reasoned action approach [19], which builds on Fishbein and Ajzen’s theory of reasoned action [20]. This relates to change of social behaviour to perceived behavioural control, attitude and perceived norms (e.g., social expectations).
  • Self-efficacy [21], which relates to the confidence and competence of an individual to take action/responsibility. Accordingly, a successful past experience but also educational accomplishment impact on self-efficacy.
Education, culture and government policies largely influence natural hazard awareness, which is location-specific [22]. For instance, awareness of tsunamis has increased since the Indian Ocean tsunami of 2004, most probably through the influence of the media [23]. Tsunami awareness seems much higher than that of other coastal flooding hazards. During typhoon Haiyan in the Philippines in 2013, residents had a low level of awareness with respect to storm surges [24].
A model first put forward by Esteban et al. [25] illustrates how natural-hazard awareness changes over time. Thus, a natural hazard event can quickly raise awareness. However, memory of a natural hazard event gradually fades with time unless significant investments in education and training are made to maintain heightened levels of natural-hazard awareness [26]. Several studies demonstrate that education plays an important role in society’s preparedness for extreme events of natural hazards such as earthquakes [27] and tornados [28]. Likewise, high school students’ knowledge of natural hazards and seismic risk perception is dependent on their educational level [28,29].
In this respect, several disaster and natural-hazard indexes have been developed. In a study by Davidson and Shah [30], the authors present an urban earthquake disaster risk index (EDRI). A disaster risk index to assess global exposure and vulnerability towards natural hazards was devised by Peduzzi et al. [31] utilising geographic information systems of factors influencing levels of human losses from natural hazards at a global scale.
The World Risk Index (WRI) proposed a new approach towards natural hazards, in which education is related to awareness and impact. WRI allows comparison of countries on a global scale [32]. WRI focuses on the understanding of risk, which is defined as the interaction of physical hazards and the vulnerability of exposed elements. The WRI is not a forecasting tool and therefore cannot be used as an early warning system announcing disasters due to natural hazards. Its aim is to demonstrate that “not only the magnitude or intensity of a natural event influence disaster risk” but that a multitude of different factors such as the political and institutional structures, the state of infrastructure, the nutritional situation and the economic and environmental conditions of a country determine whether a natural hazard will turn into a disaster [4,31,32,33].
Considering the potential of education as an indicator and influence on impact of natural hazards, an education factor independent of WRI could be used.
The objective of this study was to analyse the relationships between educational level and components of the WRI in order to create a quantitative basis for the evaluation of education’s role in enriching knowledge about natural hazards and thereby raising awareness and mitigation. In order to do this
(1)
relationships between the components of WRI were analysed,
(2)
an education factor independent of WRI was created,
(3)
the frequency, magnitude and exposure of natural hazards of extreme event character in selected countries were analysed, and
(4)
the relations between the education factor and WRI components among the countries were put forward to create the index.

2. Material and Methods

The main methodological steps in our study were the following:
(1)
analysis of WRI parameters determining relationships between components;
(2)
selection of countries for which all relevant information was available for the detailed analysis between the WRI, its components and the education factor;
(3)
analysis of exposure to and frequency and magnitude of natural hazards of extreme events in the selected countries;
(4)
creation of an education parameter independent of WRI;
(5)
analysis of the relationship between the WRI, its components and the education parameter.

2.1. World Risk Index

The World Risk Index (WRI) is calculated from 28 separate indicators. WRI grades the disaster risk for 171 countries based on five disaster types: cyclones, droughts, earthquakes, floods and sea-level rise [33]. WRI is composed of exposure, susceptibility, vulnerability, lack of coping capacities and lack of adaptive capacities.
Exposure is the share of population, built-up or total area or infrastructure vulnerable to one or more disaster types.
Susceptibility is the liability of experiencing harm from a natural hazard. It depends on the structure and framework of the society [33].
Lack of coping capacities is calculated as 1 minus coping capacities. The term “coping capacities” covers the ability of societies, especially its exposed segments, to minimise impacts of natural hazards through action and the available resources for relevant measures to reduce harm and damage in a disaster [33].
Lack of adaptive capacities focuses on measures and strategies dealing with, and attempting to address, the negative impacts of natural hazards and climate change in the future. Adaptation, unlike coping capacities, is understood as a long-term process that also includes structural changes [31,33].
Vulnerability is based on components of susceptibility, lack of coping capacities and lack of adaptive capacities [32] and relates these to the social, physical, economic and environmental factors which make people susceptible to the impacts of natural hazards.
The vulnerability index multiplied by the exposure index yields WRI. Risk is understood as the interaction between exposure to natural hazards (including the adverse effects of climate changes) and the vulnerability of societies [32,33].
Thus, WRI is calculated as the sum of exposure (E) and vulnerability (V) values [16]:
WRI = E + V
V is calculated as the sum of susceptibility (S), lack of coping capacities (LoC) and lack of adapting capacities (LoA) values:
V = S + LoC + LoA
S is the sum of fractured scores of public infrastructure, housing conditions, nutrition, poverty and dependencies and economic capacity and income distribution.
LoC is calculated as a sum of fractured scores of government and authorities, disaster preparedness and early warning, medical services, social networks and material coverage. LoA is a sum of fracture scores of education and research, gender equity, environmental status/ecosystem protection, adaptation strategies and investment. Numerical values of percentages for each sub-factor are given in the WRI 2016 report [33].

2.2. Selection of Countries for Detailed Analysis

The framework for country selection was based on the WRI database [33]. One of the selection criteria was to cover the full range of both exposure and vulnerability. The second criterion was availability of data. We screened about 70 countries with an anticipated high natural hazard risk and 40 countries with low risk. As expected, the most critical factor was availability of data on educational capacities, especially on the state school science curriculum standards with respect to natural hazards. In most of the countries, only limited reliable data on education aspects, or planning activities, was available. Therefore, we used the results from the internationally recognised test of the Programme for International Student Assessment (PISA), organised by the Organisation for Economic Co-operation and Development (OECD) since 1997 [34]. Finally, considering a wide spectrum of natural-hazards risk level, the following 15 countries were chosen: Bangladesh, Chile, Costa Rica, Estonia, Haiti, Indonesia, Ireland, Italy, Japan, Mongolia, New Zealand, Papua New Guinea, Philippines, Uganda and the USA.

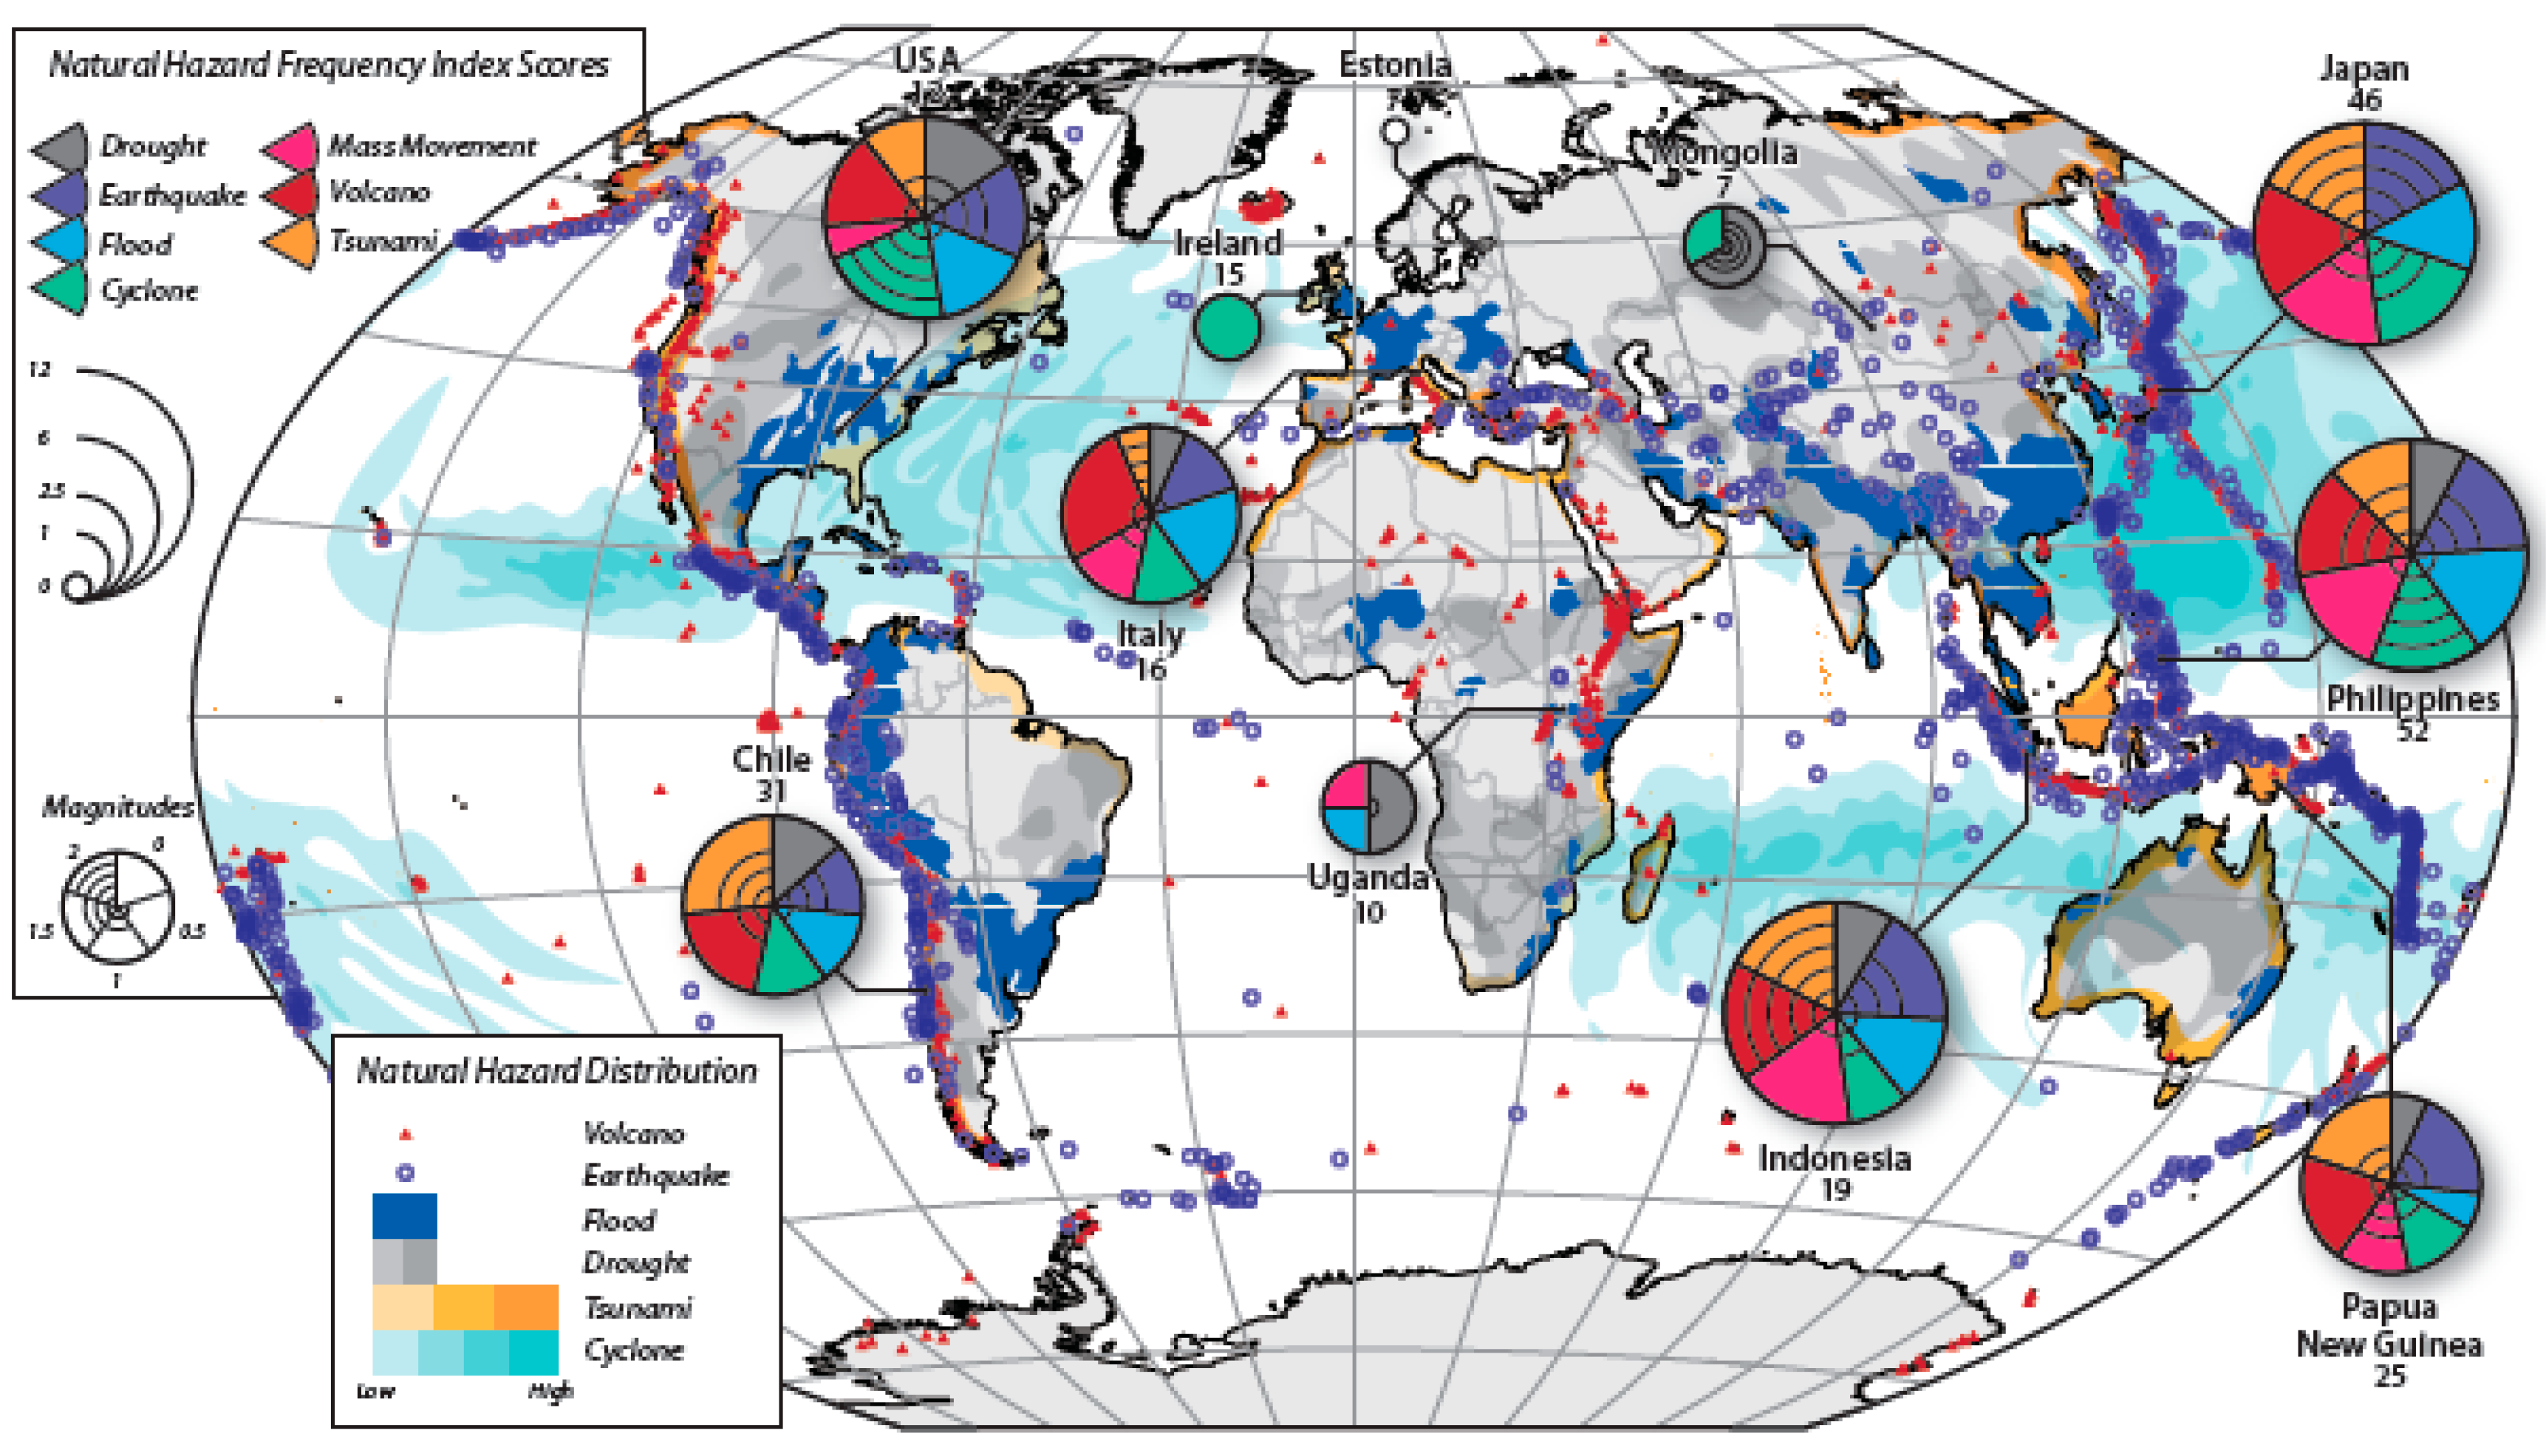
2.3. Frequency, Magnitude and Exposure to Natural Hazards

Four of the natural hazards of extreme character in the WRI—droughts, earthquakes, floods and hurricane—were considered, whereas a fifth one, sea-level rise, was not considered because of its long-term trend character even though, in several countries suffering from sea-level rise, especially island or archipelagic states, it is the only hazard factor. However, to cover the whole complexity of extreme events seven respective hazards were analysed: the four in the WRI system (listed above) plus mass movements, tsunamis and volcanic eruptions. Data on the magnitude of the latter hazards were obtained from the EM-DAT database [8], a search engine for frequencies of natural-hazard occurrence by country and year for the last one hundred years. For frequency data on tsunami and volcanic eruption, the NOAA natural hazard frequency database [9], a search engine for the frequencies of tsunami occurrences by country and year for the last hundred years, was utilised. In the EM-DAT database all disasters from 1900 to the present day, which met at least one of the following criteria, were included:
(1)
10 or more fatalities;
(2)
100 or more people affected;
(3)
declaration of a state of emergency;
(4)
a call for international assistance.
The NOAA database was derived from multiple sources, including events gathered from scientific and scholarly sources, regional and worldwide catalogues, tide gauge data, deep-ocean sensor data, individual event reports and unpublished works. Frequency data from the last 100 years (1918 to 2018) in both EM-DAT and NOAA were utilized.
In addition, multiple news articles reporting on the most powerful natural disasters in recent history were analysed for magnitude scores, for example, “the 25 worst earthquakes in recent history”.
Using the variety of sources and scaling factors, each of the 11 countries was assigned a score ranging between 0 and 2 (with 0.5 step values) for each of the 7 natural hazard categories covering both frequency and magnitude. The scores were then summed for both a total frequency and a total magnitude score. A higher score indicated a higher risk for natural hazards. For aggregation, an equal-weight approach was used, i.e., all attributes of the analysis were assumed equally important [35].
Exposure values were taken from the WRI database [33] preparedness of students (Supplementary Table S1).

2.4. Education Factor

We assumed that preparedness of students for dealing with natural hazards strongly depended on school education, especially science learning [36]. As a basis for the education factor, we used the results of the OECD’s PISA test for the ranking of countries according to their potential in natural hazards-related educational performances. The PISA studies measured 15-year-olds’ ability to use their reading, mathematics and science knowledge and skills to meet real-life challenges. For this study, scores from the PISA 2018 science test were used [34]. A lack of PISA test results did not, however, exclude a country from selection, as PISA test results correlated fairly well with per capita GDP (log R2 = 0.3), with Eastern Europe as the only notable exception; Table 1; Table S2). Thus, for a small number of selected countries, PISA test results were derived from per capita GDP.
For comparison, two datasets were used: (1) Education Rankings by Country 2019, published in the World Population Review [38], and (2) Education Index by Country 2018, UNDP Human Development Data 1990–2018 [39].

2.5. Relationship between WRI, Its Components and the Education Factor

A Pearson correlation analysis was provided for relationship analysis between the WRI, its components and the education factor. In each case the significance level p < 0.05 was applied.

3. Results and Discussion

3.1. Frequency and Magnitude of and Exposure to Natural Hazards

According to natural disaster frequency and magnitude, Bangladesh, Chile, Costa Rica, Haiti, Indonesia, Italy, Japan, New Zealand, Papua New Guinea, Philippines and the USA were grouped at the highest level of risk. This was not surprising as all countries at the highest risk of natural disasters were situated along the Pacific Ring of Fire or another tectonically unstable area. Estonia, Ireland, Mongolia and Uganda had the lowest levels of natural disaster frequency and magnitude. The results were as illustrated in Figure 1 and Table S3.
Large populations were concentrated around areas of high risk. For example, countries situated on fault lines and ocean shores were more likely to be exposed to the adverse effects of natural disasters. As population exposure increased, human experience with natural disasters increased, rendering citizens more aware of such disasters.
The Philippines and Japan had the largest population exposure, because they were situated on a typhoon belt and the Pacific Ring of Fire, exposing their populations to numerous tectonic and weather hazards [40]. Estonia, Uganda, Mongolia and the USA had the lowest levels of population exposure. In the case of the United States, despite it being a large country, a relatively small proportion of the population might be exposed to natural hazards, while in Mongolia and Estonia, the population density were low and there was an overall lack of natural hazards (Table S3). However, in a large country like the USA, the risk level can vary both in likelihood and type.

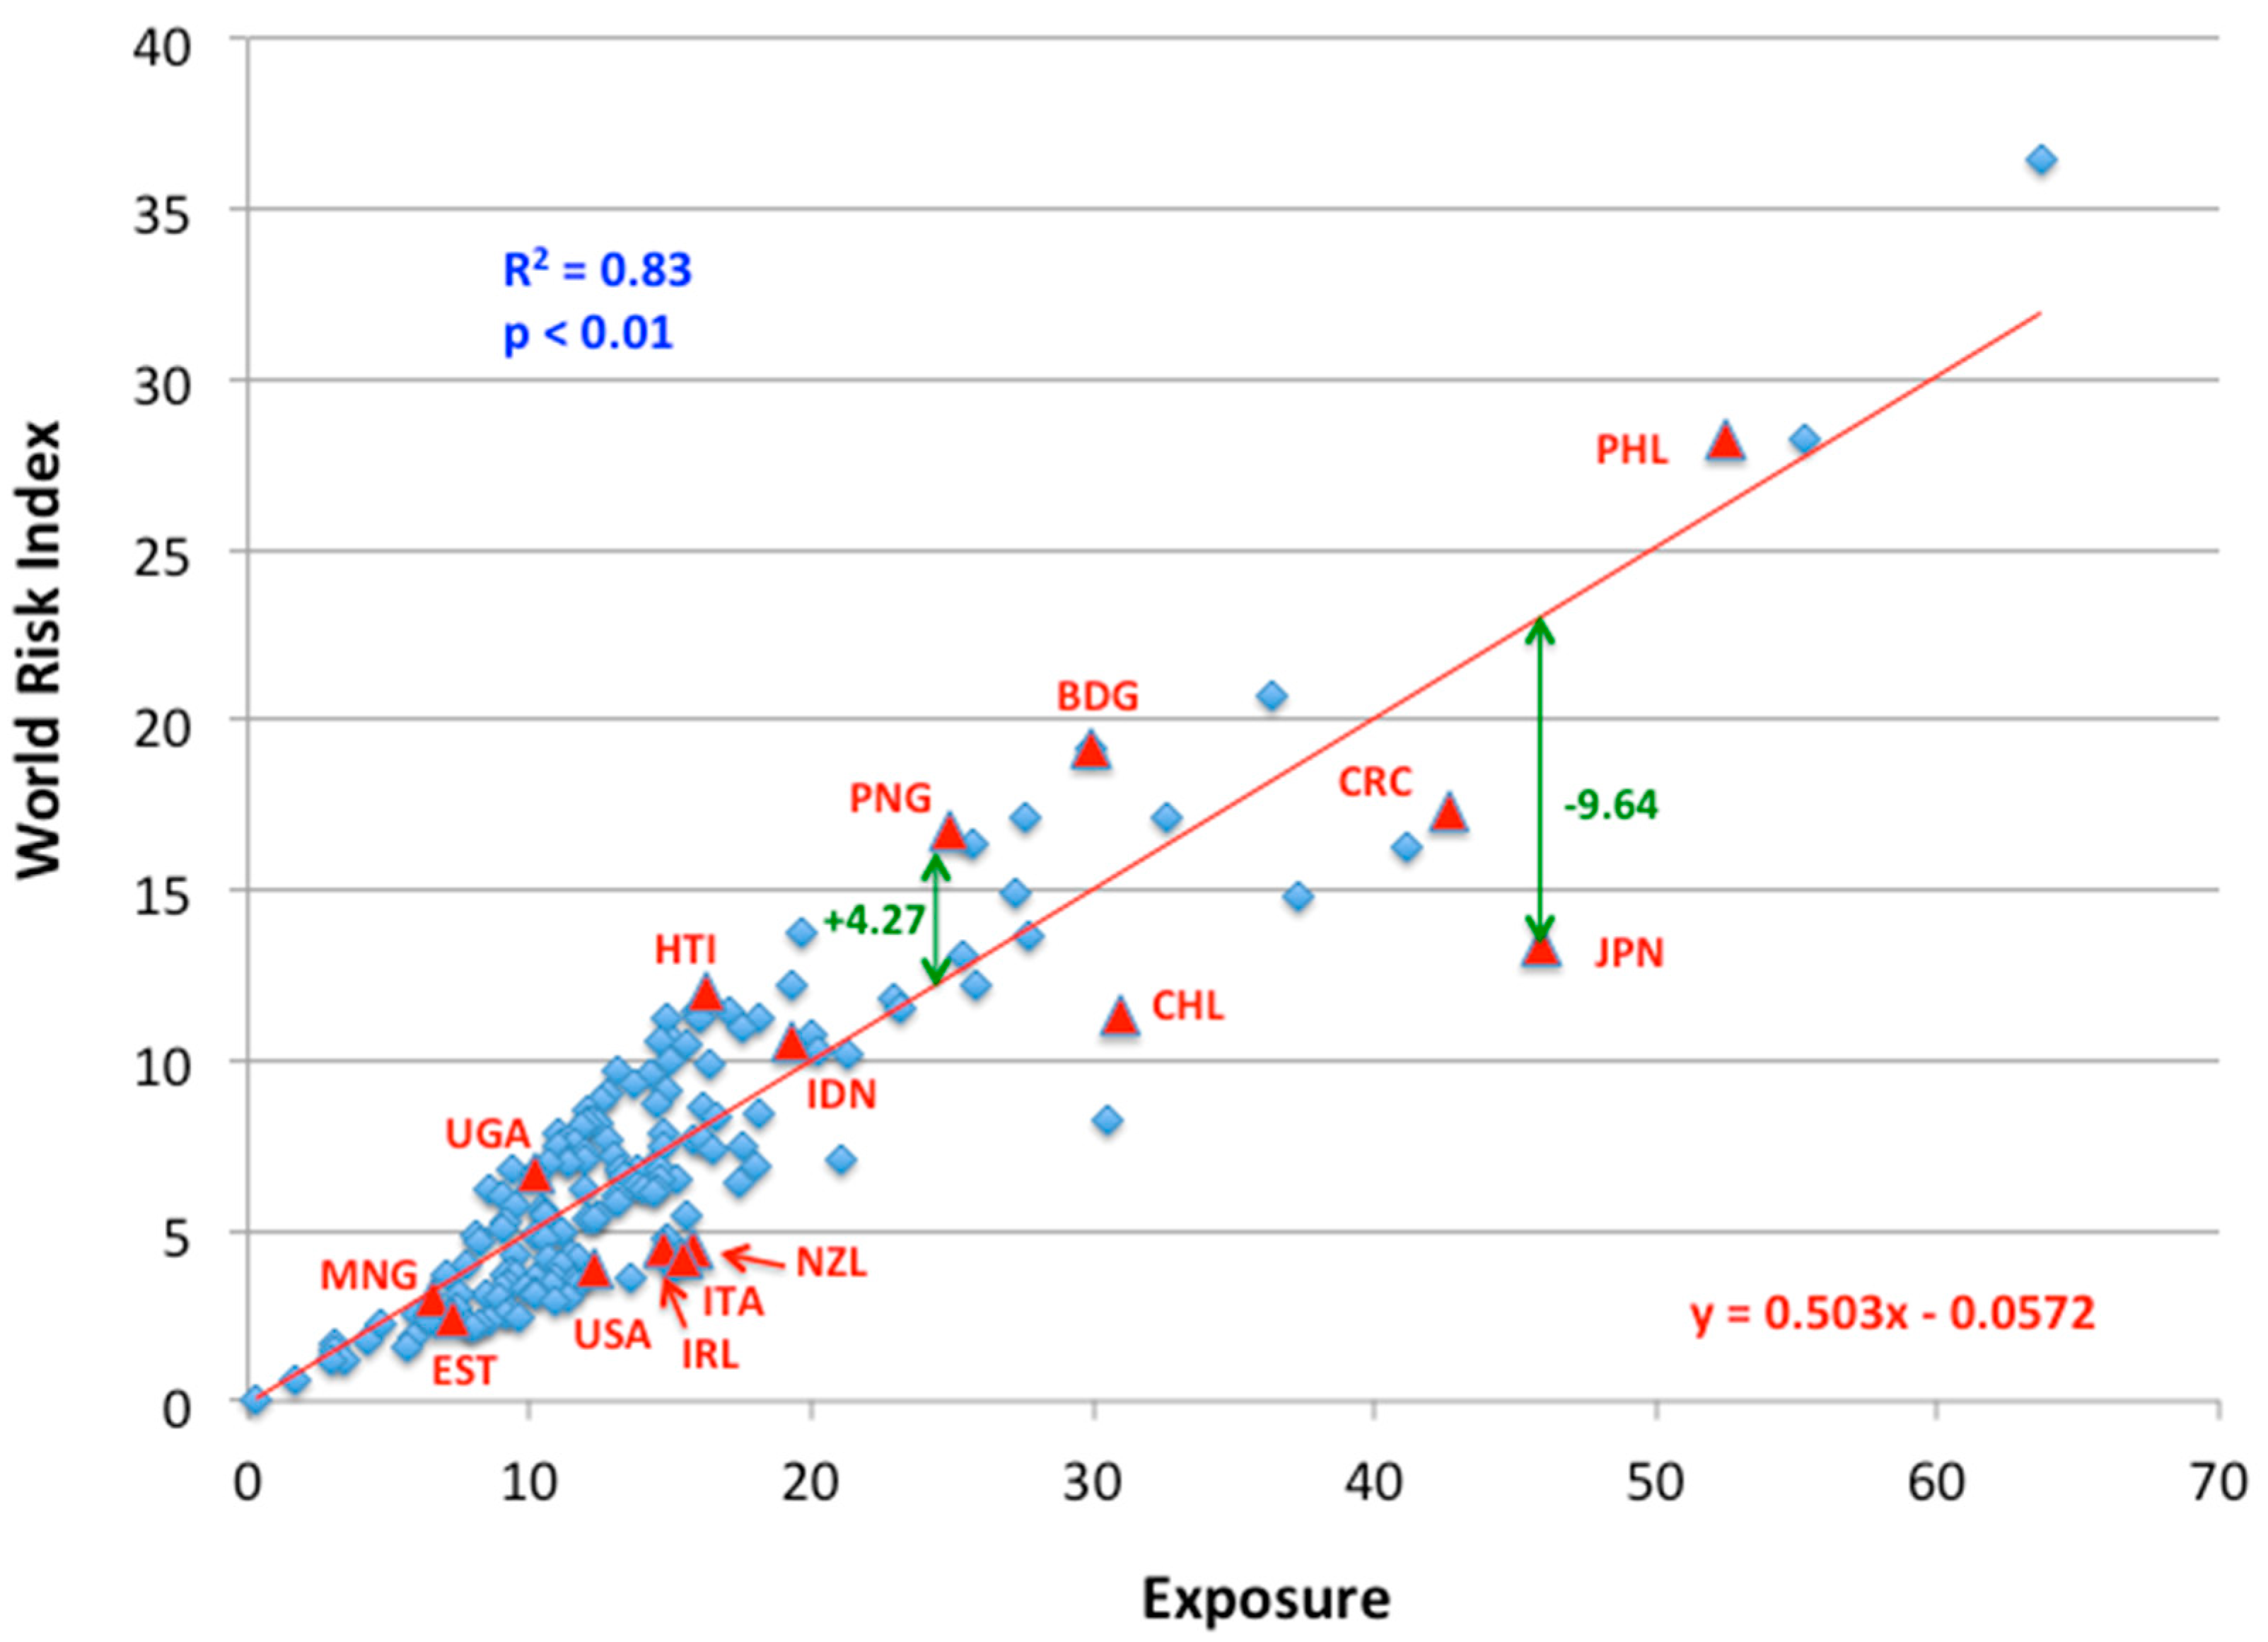
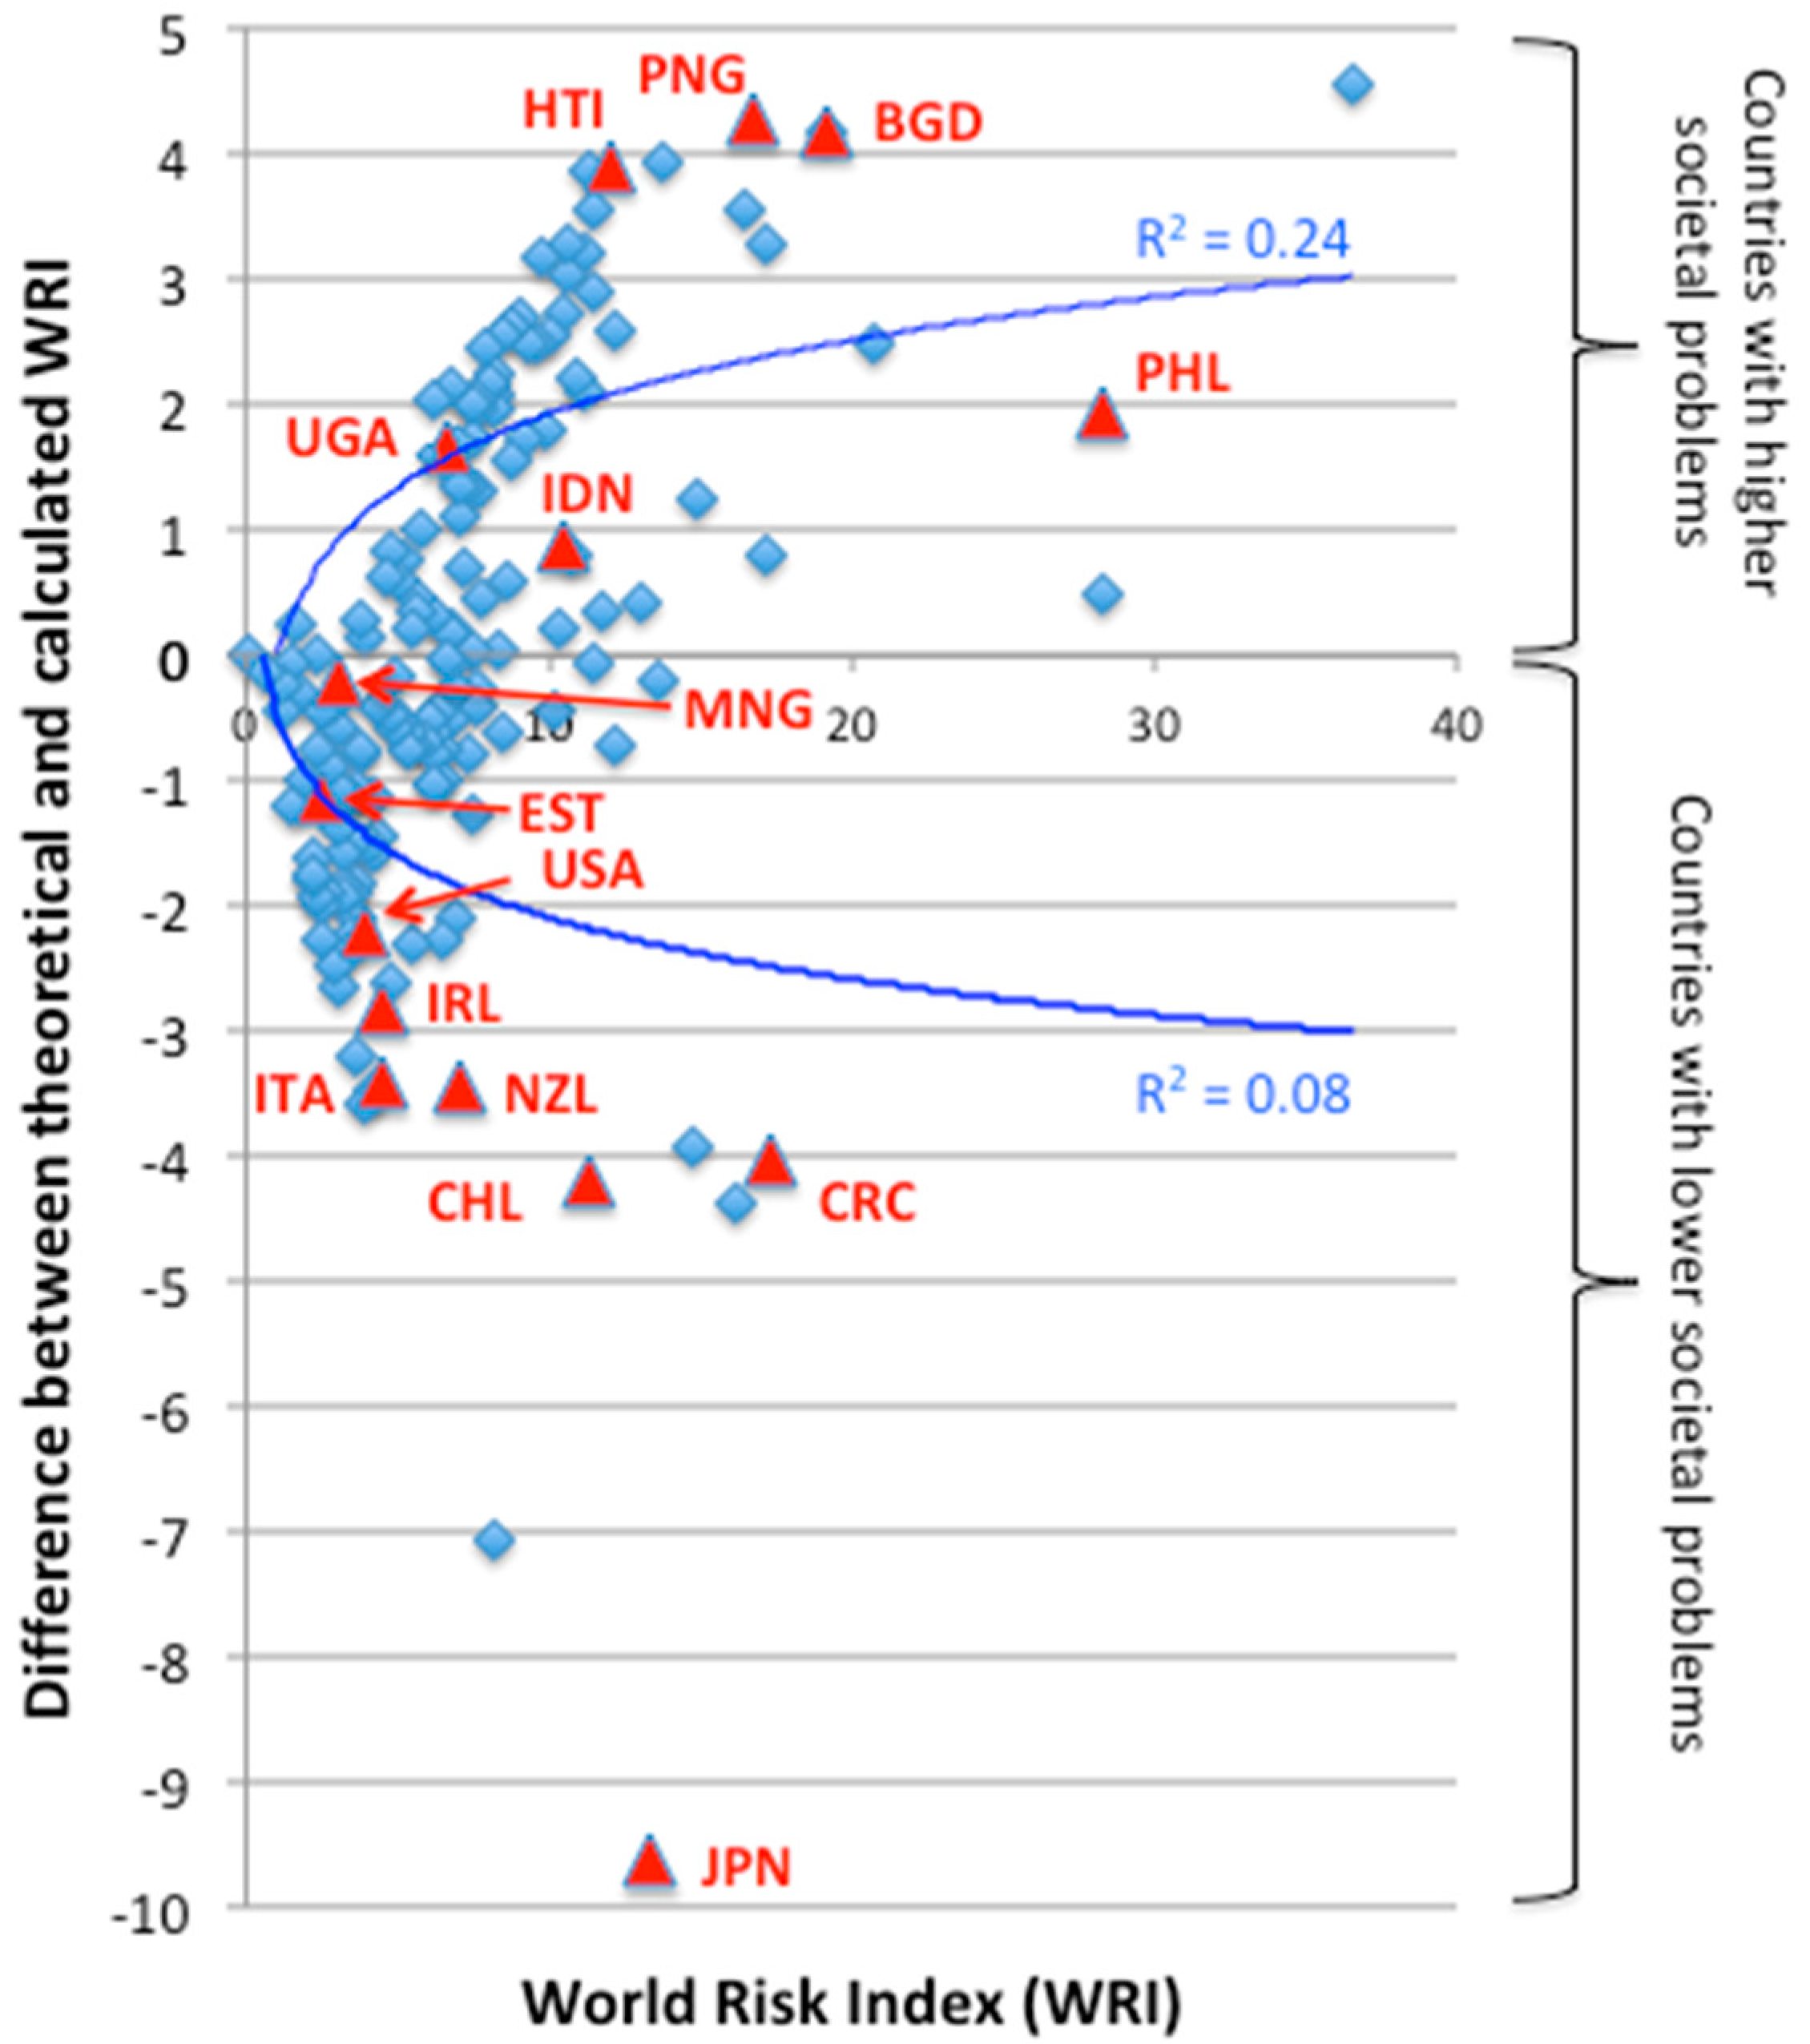
3.2. Relationship between the WRI and Its Components

A strong positive Pearson correlation was found between exposure and WRI values (R2 = 0.83, p < 0.01; Figure 2). Since the sum of exposure and vulnerability gives the WRI value [33], deviations from the regression line indicated the relative importance of vulnerability. In this case, Japan could be highlighted as a country with a relatively high exposure but lower vulnerability than other countries at the same level of WRI.
Likewise, vulnerability has strong positive correlation between the lack of adaptive capacities (R2 = 0.93; p < 0.001; Supplementary Figure S1), the lack of coping capacities (R2 = 0.94; p < 0.001; Figure S2) and the susceptibility (R2 = 0.92; p < 0.001; Figure S3). The first of these correlations was linear, whereas the other two were best described as curvilinear. The vulnerability vs LoA curve almost followed a 1:1 (y = x) line (Figure S1), while the vulnerability vs LoC curve (Figure 2) and the vulnerability vs susceptibility curve (Figure S3) mirrored each other on the opposite sides of the 1:1 line. This demonstrated that the LoA component, which depended on education and research, gender equity, environmental status/ecosystem protection, adaptation strategies and investment [33], was the main factor determining the vulnerability value. The LoC component (the sum of factors such as government and authorities, disaster preparedness and early warning, medical services, social networks and material coverage) and susceptibility (determined by the factors of public infrastructure, housing conditions, nutrition, poverty and dependencies, and economic capacity and income distribution) only ”fine-tuned” the vulnerability value. Among the countries considered in this study, the most vulnerable were Papua New Guinea, Uganda, Indonesia and the Philippines. In several alternative estimations, the Philippines was evaluated as the most vulnerable to natural hazards [40,41].
Other relationships between the WRI and its components were not found to be significant.
Analysing the deviations of exposure vs WRI (Figure 2), a new parameter regarded as relative vulnerability (RV) was defined, which expressed the difference between the relative WRI value (residual value of exposure vs WRI correlation) and the calculated values of WRI (Table S1). Figure 3 represented the relationship between the calculated WRI and the difference between the relative and calculated WRI whereby the positive and negative differences were subtracted. It adequately separated countries with lower technological capacities (positive relative vulnerability) and countries with better technological capacities to minimise natural disasters (negative values). The graph also indicated that countries at low risk tended to be over-aware, while countries under high risk were under-aware of natural hazards. A clearer illustration of this relationship was as presented in Figure 4.
The ranked and normalized value of the RV was defined as the new Natural Hazard Factor (NHF; Table 2). The table showed that Japan had the lowest value of the RV by far (Figure 4), which resulted in the lowest NHF value (Table 2). On the other hand, Papua New Guinea, which was located in similar natural-hazard conditions, was positioned at the other end of this scale.

3.3. Education Factor

Education scores were derived from the PISA 2018 science test [34]. The Education Factor (EF) was defined as the normalised rank value and was relative to Estonia, which achieved the highest score among the countries considered for the detailed analysis (Table 1; i.e., the highest score in 2018 among European countries and 2nd highest after Singapore; Table S2).

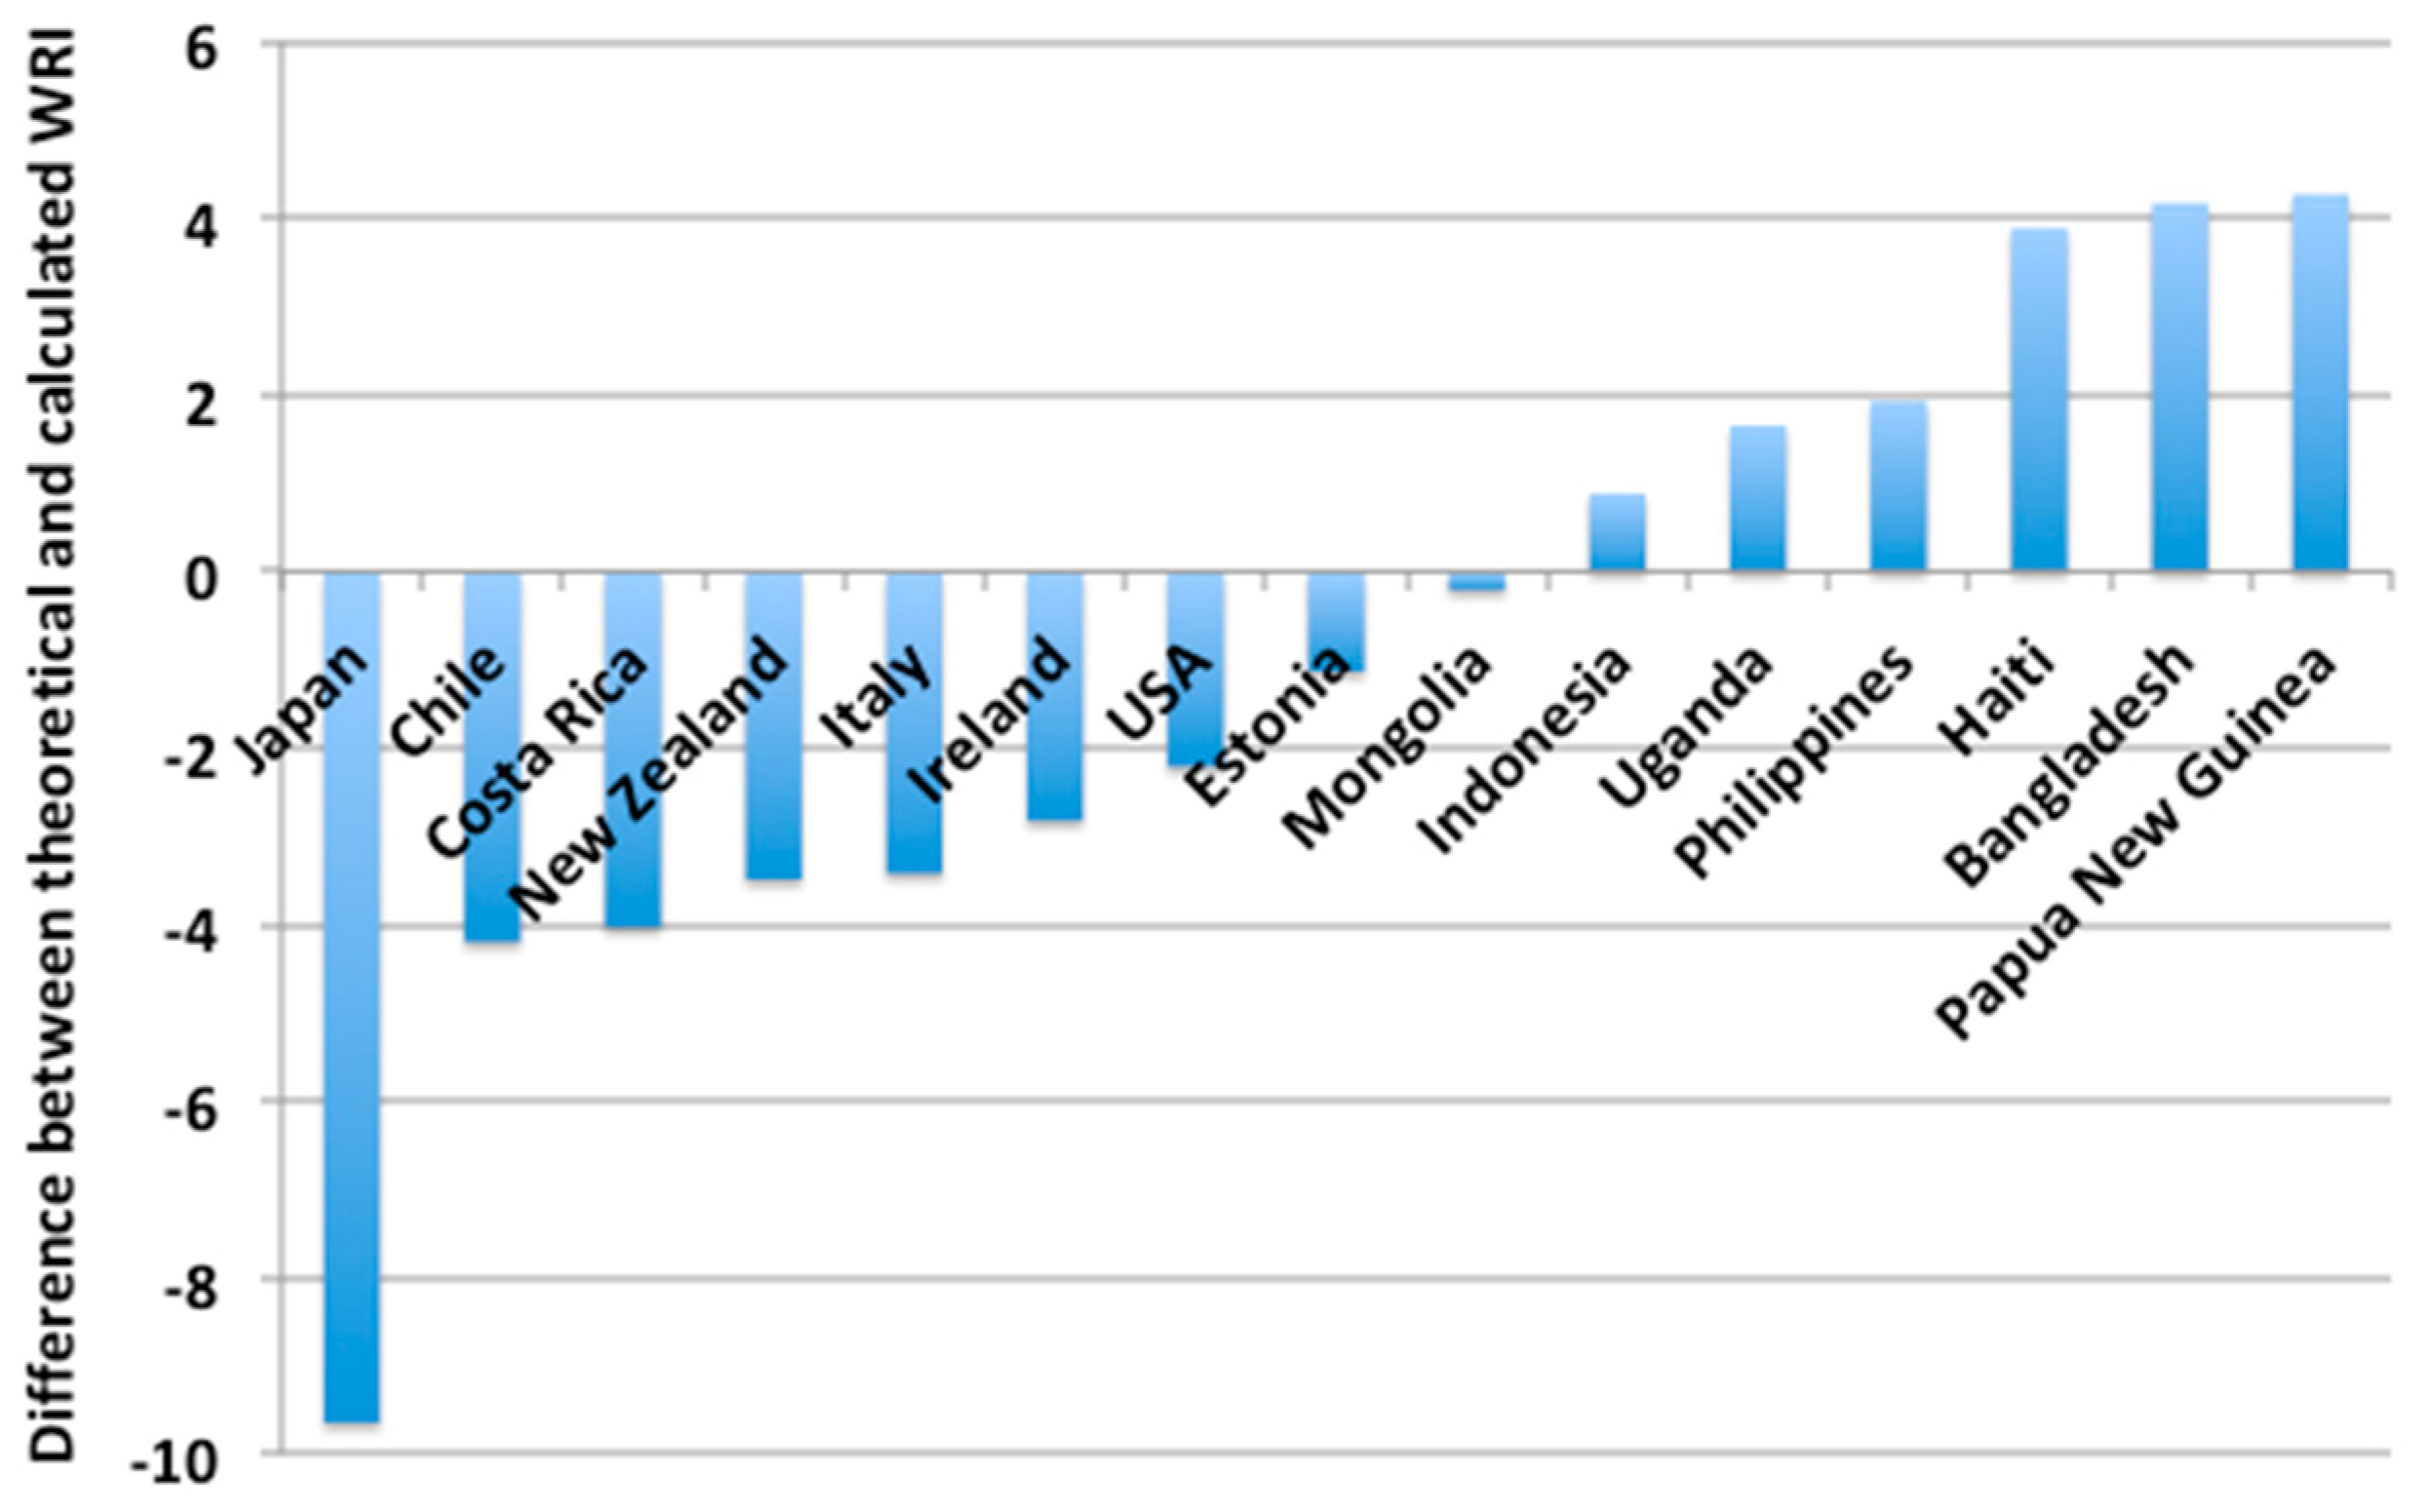
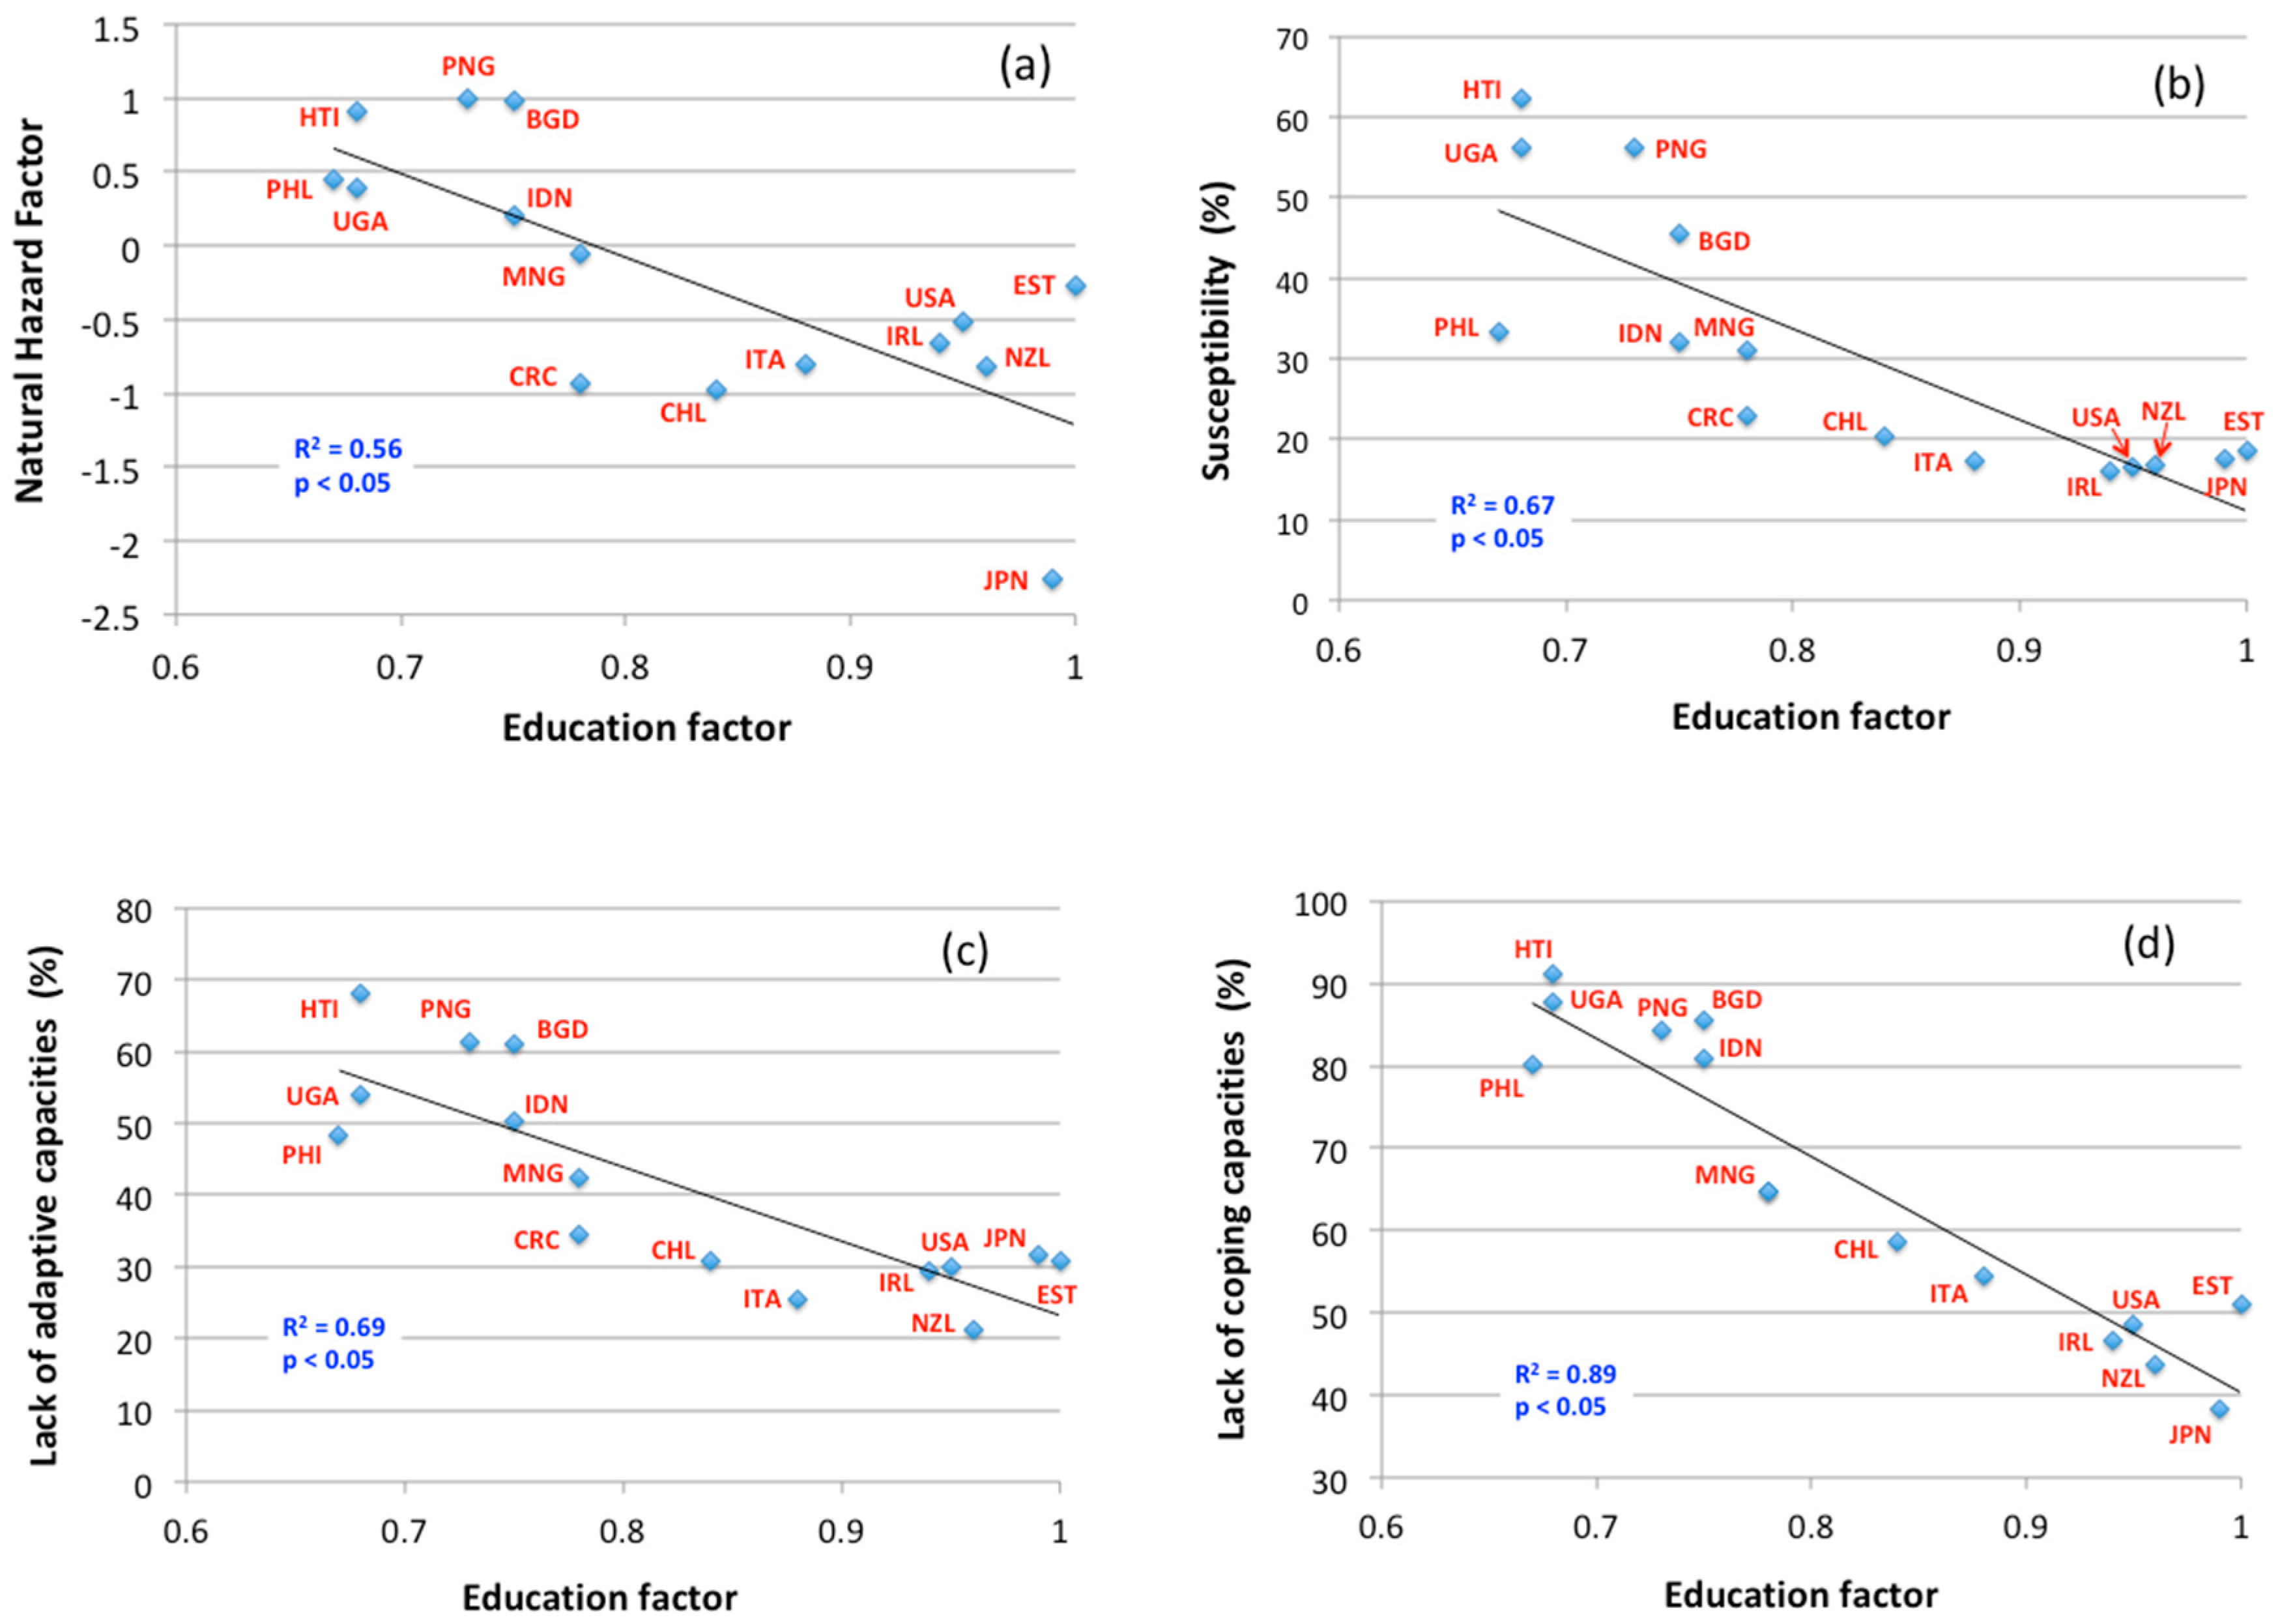
3.4. Relationship between the Natural Hazard Factor and Education Factor

EF significantly correlates with Natural Hazard Factor (NHF) (R2 = 0.56; p < 0.05; Figure 5a), susceptibility (R2 = 0.67; p < 0.05; Figure 5b), lack of adaptive capacities (R2 = 0.69; Figure 5c) and lack of coping capacities (R2 = 0.89; p < 0.05; Figure 5d). In all cases, a higher education factor caused lower natural hazard related factors. Since the ranking order for the lack of adapting capacities (LoA) in the WRI database (Table S1) was the same according to the separately calculated education factor, the EF vs LoA correlation was high (Figure 5c). The structure of WRI gave the education factor a central role in LoA [33]. However, our analysis showed that the impact of education was significant, not only for the LoA but causally also for other WRI parameters. For instance, it was even higher in the case of EF vs lack of coping capacities (Figure 5d).
It is not trivial to separate the role of education from the very aggregated country-level mixture of factors, which includes information about economic development, nutrition, etc. However, a strong correlation between the WRI categories (LoA and LoC) and independently PISA-based calculated education factor (Figure 5c,d) shows that we can confirm education’s potential in raising knowledge and awareness of natural hazards.
There was no significant correlation found between the NHF and education rankings by country 2019 [38] or education index (2018) by UNDP’s Human Development Data 1990–2018 [39].
To avoid strongly focusing on formal education and neglecting informal ways of learning, we tried to analyse the education factor in broader contexts including, also, the impact of media, which is nowadays a very important informal way of learning. However, availability of media sources on natural hazards was very different from country to country, which did not allow us to make a correct analysis. Therefore, we skipped this idea and focused on the secondary school education level, which is represented by PISA tests. We believe that PISA Science test is at least partly reflective of the impact of informal learning sources (family, friends, media, etc.).

4. Conclusions

In this study, the relationships between the level of education and components of the WRI were analysed in order to create a quantitative basis for the evaluation of education’s role in enriching knowledge on natural hazards and thereby raising awareness and consequences’ mitigation. We focused on the relationships between the components of WRI, created an education factor independent of WRI, analysed the frequency, magnitude and exposure of natural hazards of extreme event character in selected countries and analysed the relationships between the education factor and WRI components among the countries.
The study showed that the education factor calculated independently of the WRI methodology was significantly correlated with several components of WRI: Natural Hazard Factor or relative vulnerability (based on the difference between the relative and calculated WRI values), susceptibility, lack of coping capacities and lack of adaptive capacities. This suggested that education could decrease the number of casualties and mitigate potential damages caused by natural hazards. The analysis demonstrated that the impact of education was important, not only for the lack of adaptive capacities in which it was a direct sub-factor, but also indirectly for other WRI parameters. It should be taken into account that education was a factor that had both a quick effect through training and a wider long-term impact through increased competence, which contributed to personal and societal preparedness for any potential natural hazard. Therefore, further investment in education, especially in countries suffering from poverty and social problems, was seen as crucial in lowering the WRI and supporting natural hazard awareness.

Supplementary Materials

The following materials are available online at https://www.mdpi.com/2071-1050/12/18/7623/s1, Table S1: Values of World Risk Index (WRI) and its components for 171 countries. Derived from the World Risk Report 2016 [33]. Table S2: Mean scores of PISA 2018 Science test [34].; values of Word Risk Index (WRI) 2016 [33].and Gross Domestic Product (GDP; USD per capita [37]). Table S3: Values for frequency (F), magnitude (M) and exposure of natural hazards estimated for countries under consideration [8,9]. Exposure indicates the percentage of population affected (Table S1, [33]). Figure S1: Pearson correlation between vulnerability to natural hazards and lack of adaptive capacities for 171 countries. Data derived from the World Risk Report 2016 [33] (Table S1). Figure S2: Pearson correlation between vulnerability to natural hazards and lack of coping capacities for 171 countries. Data derived from the World Risk Report 2016 [33] (Table S1). Figure S3: Pearson correlation between vulnerability to natural hazards and susceptibility capacities for 171 countries. Data derived from the World Risk Report 2016 [33] (Table S1).

Author Contributions

Conceptualization, Ü.M., D.C.; methodology, Ü.M., D.C., A.K., J.H., M.S. and J.P.; software, R.A.; validation, Ü.M., J.H., J.P. and A.K.; formal analysis, Ü.M., J.H., A.K. and J.P.; investigation, D.C. and Ü.M.; resources, Ü.M.; data curation, D.C., Ü.M., A.K. and M.S.; writing—original draft preparation, D.C., Ü.M.; writing—review and editing, D.C., Ü.M., A.K., J.P. and J.H.; visualization, R.A. and Ü.M.; supervision, Ü.M. and J.H.; project administration, Ü.M. and J.H.; funding acquisition, Ü.M. All authors have read and agreed to the published version of the manuscript.

Funding

This study was supported by the Estonian Research Council (IUT2-16 and PRG352); the EU through the European Regional Development Fund (Centre of Excellence EcolChange, Estonia; grant number TK-131).

Acknowledgments

We thank Miia Rannikmäe for the conceptual advice.

Conflicts of Interest

The authors declare no conflict of interest.

References

  1. Gregg, C.; Houghton, B. Natural Hazards. In Disaster Resilience: An Integrated Approach; Paton, D., Johnston, D., Eds.; Charles C Thomas: Springfifield, IL, USA, 2006; pp. 19–39. [Google Scholar]
  2. Pescaroli, G.; Aexander, D. Critical infrastructure, panarchies and the vulnerability paths of cascading disasters. Nat. Hazards 2016, 82, 175–192. [Google Scholar] [CrossRef] [Green Version]
  3. AghaKouchak, A.; Huning, L.S.; Chiang, F.; Sadegh, F.; Vahedifard, F.; Mazdiyasni, O.; Moftakhari, H.; Mallakpour, I. How do natural hazards cascade to cause disasters? Nature 2018, 561, 458–460. [Google Scholar] [CrossRef] [PubMed] [Green Version]
  4. Birkmann, J.; Garschagen, M.; Mucke, P.; Schauder, A.; Seibert, T.; Welle, T.; Rhyner, J.; Kohler, S.; Loster, T.; Reinhard, D.; et al. World Risk Report 2014; Bündnis Entwicklung Hilft and UNU-EHS: Berlin, Germany, 2014. [Google Scholar]
  5. Dunbar, P. Increasing public awareness of natural hazards via the Internet. Nat. Hazards 2007, 42, 529–536. [Google Scholar] [CrossRef]
  6. United Nations International Strategy for Disaster Reduction. Terminology on Disaster Risk Reduction; UNISDR: Geneva, Switzerland, 2009; p. 30. [Google Scholar]
  7. Sivakumar, M. Impacts of Natural Disasters in Agriculture, Rangeland and Forestry: An Overview. In Natural Disasters and Extreme Events in Agriculture; Sivakumar, M., Motha, R.P., Das, H.P., Eds.; Springer: Berlin/Heidelberg, Germany; New York, NY, USA, 2005; pp. 1–22. [Google Scholar]
  8. Emergency Events Database (EM-DAT). The International Disaster Database. Available online: http://www.emdat.be/advanced_search/index.html (accessed on 28 July 2020).
  9. National Oceanic and Atmospheric Administration. Natural Hazards Data, Images and Education. Available online: https://ngdc.noaa.gov/hazard/hazards.shtml (accessed on 16 September 2020).
  10. Stocker, T.F.; Qin, D.; Plattner, G.-K.; Tignor, M.; Allen, S.K.; Boschung, J.; Nauels, A.; Xia, Y.; Bex, V.; Midgley, P.M. (Eds.) Intergovernmental Panel on Climate Change. Summary for Policymakers. In Climate Change 2013: The Physical Science Basis. Contribution of Working Group I to the Fifth Assessment Report of the Intergovernmental Panel on Climate Change; Cambridge University Press: Cambridge, UK; New York, NY, USA, 2013. [Google Scholar]
  11. Adger, W.N.; Hughes, T.P.; Folke, C.; Carpenter, S.R.; Rockström, J. Social-ecological resilience to coastal disasters. Science 2005, 309, 1036–1039. [Google Scholar] [CrossRef] [PubMed] [Green Version]
  12. Temmerman, S.; Meire, P.; Bouma, T.J.; Herman, P.M.J.; Ysebaert, T.; De Vriend, H.J. Ecosystem-based coastal defence in the face of global change. Nature 2013, 504, 79–83. [Google Scholar] [CrossRef] [PubMed]
  13. Ribeiro, R.R.R.; Sulaiman, S.N.; Bonatti, M.; Sieber, S.; Lana, M.A. Perception of natural hazards in rural areas: A case study examination of the influence of seasonal weather. Sustainability 2020, 12, 2251. [Google Scholar] [CrossRef] [Green Version]
  14. Welle, T.; Birkmann, J. The World Risk Index—An approach to assess risk and vulnerability on a global scale. J. Extrem. Events 2015, 2, 1. [Google Scholar] [CrossRef]
  15. International Organization for Migration. Committee on Communication for Behavior Change in the 21st Century. In Improving the Health of Diverse Populations. Speaking of Health: Assessing Health Communication Strategies for Diverse Populations; National Academy Press: Washington, DC, USA, 2002. [Google Scholar]
  16. Paton, D.; Houghton, B.; Gregg, C.; Gill, D.; Ritchie, L.; McIvor, D.; Larin, P.; Meinhold, S.; Horan, J.; Johnston, D. Managing tsunami risk in coastal communities: Identifying predictors of preparedness. Aust. J. Emerg. Manag. 2008, 23, 4–9. [Google Scholar]
  17. Paton, D.; Bajek, R.; Okada, N.; McIvor, D. Predicting community earthquake preparedness: A cross-cultural comparison of Japan and New Zealand. Nat. Hazards 2010, 54, 765–781. [Google Scholar] [CrossRef]
  18. Oyao, S.; Holbrook, J.; Rannikmäe, M.; Pagunsan, M. A Competence-based Science Learning Framework illustrated through the Study of Natural Hazards and Disaster Risk Reduction. Int. J. Sci. Educ. 2015, 37, 2237–2263. [Google Scholar] [CrossRef]
  19. Fishbein, M.; Ajzen, I. Predicting and Changing Behavior: The Reasoned Action Approach; Psychology Press: New York, NY, USA, 2010; p. 538. [Google Scholar]
  20. Fishbein, M.; Ajzen, I. Belief, Attitude, Intention and Behavior: An Introduction to Theory and Research; Addison-Wesley: Reading, MA, USA, 1975; p. 575. [Google Scholar]
  21. Bandura, A. Self-Efficacy: The Exercise of Control; W.H. Freeman and Company: New York, NY, USA, 1997; p. 604. [Google Scholar]
  22. Esteban, M.; Tsimopoulou, V.; Mikami, T.; Yun, N.; Suppasri, A.; Shibayama, T. Recent tsunami events and preparedness: Development of tsunami awareness in Indonesia, Chile and Japan. Int. J. Disaster Risk Reduc. 2013, 5, 84–97. [Google Scholar] [CrossRef]
  23. Esteban, M.; Bricker, J.D.; Arce, R.O.S.C.; Takagi, H.; Yun, N.Y.; Chaiyapa, W.; Sjoegren, A.; Shibayama, T. Tsunami awareness: A comparative assessment between Japan and the USA. Nat. Hazards 2018, 93, 1507–1528. [Google Scholar] [CrossRef] [Green Version]
  24. Esteban, M.; Valenzuela, V.; Namyi, Y.; Mikami, T.; Shibayama, T.; Matsumaru, R.; Takagi, H.; Thao, N.; de Leon, M.; Oyama, T.; et al. Typhoon Haiyan 2013 evacuation preparations and awareness. Int. J. Sustain. Future Hum. Secur. 2015, 31, 37–45. [Google Scholar] [CrossRef]
  25. Leelawat, N.; Mateo, C.; Gaspay, S.; Suppasri, A.; Imamura, F. Filipinos “views on the disaster information for the 2013 Super Typhoon Haiyan in the Philippines”. Int. J. Sustain. Future Hum. Secur. 2013, 2, 61–73. [Google Scholar] [CrossRef]
  26. Heller, K.; Alexander, D.B.; Gatz, M.; Knight, B.G.; Rose, T. Social and personal factors as predictors of earthquake preparation: The role of support provision, network discussion, negative effect, age, and education. J. Appl. Soc. Psychol. 2005, 35, 399–422. [Google Scholar] [CrossRef]
  27. Mulilis, J.-P.; Duval, T.S.; Bovalino, K. Tornado preparedness of students, nonstudent renters, and nonstudent owners: Issues of PrE-theory. J. Appl. Soc. Psychol. 2000, 30, 1310–1329. [Google Scholar] [CrossRef]
  28. Santos-Reyes, J.R.; Gouzeva, T. High School Students’ Knowledge and Seismic Risk Perception: The Case of Mexico City. In IEEE International Conference on Industrial Engineering and Engineering Management 2017-December; IEEE: Piscataway, NJ, USA, 2018; pp. 1227–1231. [Google Scholar]
  29. Davidson, R.; Shah, H. An Urban Earthquake Disaster Risk Index; The John A Blume Earthquake Engineering Center Stanford University: Stanford, CA, USA, 1997; p. 269. [Google Scholar]
  30. Peduzzi, P.; Dao, H.; Herold, C.; Mouton, F. Assessing global exposure and vulnerability towards natural hazards: The Disaster Risk Index. Nat. Hazards Earth Syst. Sci. 2009, 9, 1149–1159. [Google Scholar] [CrossRef]
  31. Lavell, A.; Oppenheimer, M.; Diop, C.; Hess, J.; Lempert, R.; Li, J.; Muir-Wood, R.; Myeong, S. Climate Change: New Dimensions in Disaster Risk, Exposure, Vulnerability, and Resilience. In Managing the Risks of Extreme Events and Disasters to Advance Climate Change Adaptation. A Special Report of Working Groups I and II of the Intergovernmental Panel on Climate Change; IPCC, Ed.; Cambridge University Press: Cambridge, UK; New York, NY, USA, 2012; pp. 25–64. [Google Scholar]
  32. Birkmann, J.; Welle, T.; Krause, D.; Wolfertz, J.; Suarez, D.-C.; Setiadi, N. World Risk Index: Concept and Results. In Bündnis Entwicklung Hilft, World Risk Report 2011; Bündnis Entwicklung Hilft (Alliance Development Works): Berlin, Germany, 2011; pp. 13–41. [Google Scholar]
  33. United Nations University—Institute for Environment and Human Security. World Risk Report. 2016. Available online: https://collections.unu.edu/eserv/UNU:5763/WorldRiskReport2016_small_meta.pdf (accessed on 16 September 2020).
  34. Schleicher, A. PISA 2018: Insights and Interpretations; OECD: Paris, France, 2019; p. 363. [Google Scholar]
  35. Tonmoy, F.N.; El-Zein, A.; Hinkel, J. Assessment of vulnerability to climate change using indicators: A meta-analysis of the literature. Wiley Interdiscip. Rev. Clim. Chang. 2014, 5, 775–792. [Google Scholar] [CrossRef] [Green Version]
  36. Cerulli, D.; Holbrook, J.; Mander, Ü. Devising an instrument for determining students’ preparedness for an Education through Science learning approach within the topic of Natural Hazards. Sci. Educ. Int. 2016, 27, 59–87. [Google Scholar]
  37. World Bank. List of Countries by GDP (Nominal). Available online: https://en.wikipedia.org/wiki/List_of_countries_by_GDP_(nominal) (accessed on 28 July 2020).
  38. World Population Review. Education Rankings by Country 2020. Available online: https://worldpopulationreview.com/country-rankings/education-rankings-by-country (accessed on 16 September 2020).
  39. United Nations Development Programme. Human Development Data 1990–2018. Education Index. Available online: http://hdr.undp.org/en/data (accessed on 28 July 2020).
  40. Symaco, L.P. Geographies of social exclusion: Education access in the Philippines. Comp. Educ. 2013, 49, 361–373. [Google Scholar] [CrossRef]
  41. Comte, A.; Pendleton, L.H.; Bailly, D.; Quillérou, E. Conceptual advances on global scale assessments of vulnerability: Informing investments for coastal populations at risk of climate change. Mar. Policy 2019, 99, 391–399. [Google Scholar] [CrossRef] [Green Version]
Figure 1. Frequency and magnitude of droughts, earthquakes, hurricanes, floods (not related to hurricanes), mass movements, volcanic eruptions and tsunamis in the studied countries (see values in Table S3). Background colours indicate distribution of natural hazards. Numbers below the country name indicate the World Risk Index (WRI) exposure values [33] (Table S1).
Sustainability 12 07623 g001
Figure 2. Relationship between the exposure and the World Risk Index for 171 countries of the World Risk Report 2016 [33]. Countries considered in this study: BDG—Bangladesh, CHL—Chile, CRC—Costa Rica, EST—Estonia, HTI—Haiti, IDN—Indonesia, IRL—Ireland, ITA—Italy, MNG—Mongolia, NZL—New Zealand, PHI—Philippines, PNG—Papua New Guinea, UGA—Uganda, USA—United States. The regression line served as a reference for calculating differences between the countries. The maximum differences among the countries considered for the detail analysis were −9.64 (JPN) and +4.27 (PNG).
Sustainability 12 07623 g002
Figure 3. Difference between the WRI and relative values of WRI for countries in World Risk Report [33]. Positive values indicated countries with lower technological capacities (higher susceptibility and lack of coping and adaptive capacities), and negative values showed countries with better technological opportunities (lower susceptibility and lack of coping and adaptive capacities). See abbreviations of countries considered in this study as presented in Figure 2.
Sustainability 12 07623 g003
Figure 4. Difference between relative and calculated World Risk Index (WRI) values (relative vulnerability) for countries considered in this paper. Positive values indicated countries with lower technological capacities, negative values showed countries with better technological opportunities (see Figure 3).
Sustainability 12 07623 g004
Figure 5. Impact of education on the risk of natural disasters and their components in countries considered in this study. (a): Relationship between the education factor (ranked and normalised according to the maximal PISA 2018 science score among the considered countries (Estonia, [34], Table S2) and the Natural Hazard Factor (NHF or relative vulnerability, based on the difference between the calculated World Risk Index (WRI: Table 1), and the relative WRI value, ranked and normalised according to the maximal value of WRI differences (Papua New Guinea; see Figure 1 and Table 2)). NHF showed the potential of realisation of damages caused by the natural hazards. (b): Correlation between the education factor and the susceptibility values (Table S1). (c,d): Correlation between the education factor and the values of the lack of adaptive capacities and between the education factor and the lack of coping capacities, respectively (Table S1). See abbreviations of countries given in Figure 2.
Sustainability 12 07623 g005
Table 1. Scores of the OECD’s Program for International Student Assessment (PISA) Science 2018 test and the education factor.
CountryPISA Science Scores 2018RankEducation Factor (EF)
Bangladesh 1399100.75
Chile44470.84
Costa Rica41680.78
Estonia53011.00
Haiti 1358140.68
Indonesia396110.75
Ireland49650.94
Italy46860.88
Japan52920.99
Mongolia 141190.78
New Zealand50830.96
Papua New Guinea 1386120.73
Philippines357150.67
Uganda 1359130.68
USA50240.95
1 Missing in PISA 2018 science database and calculated based on the log correlation between the 73 countries’ PISA test results [34] and their GDP value by World Bank 2019 [37]. See details in Table S2.
Table 2. Natural Hazard Factor (NHF) for considered countries based on relative vulnerability (RV: difference between the World Risk Index (WRI) and relative WRI values calculated based on the linear regression line between Exposure and WRI; Figure 2). The NHF was calculated as ranked and normalised (according to the maximal value of WRI difference, Papua New Guinea; Figure 2 and Figure 3, Table S1) RV values.
CountryRelative Vulnerability (RV)RankNatural Hazard Factor (NHF)
Bangladesh4.1720.98
Chile−4.2014−0.98
Costa Rica−4.0313−0.94
Estonia−1.138−0.27
Haiti3.8930.91
Indonesia0.8860.21
Ireland−2.8210−0.66
Italy−3.4211−0.80
Japan−9.6415−2.26
Mongolia−0.217−0.05
New Zealand−3.4912−0.82
Papua New Guinea4.2711.00
Philippines1.9340.45
Uganda1.6550.39
USA−2.219−0.52

