1. Introduction
The analysis of educational data has been an area of interests for researchers as it reveals information that leads to channelize the efforts of both acquiring and imparting knowledge. Immense effort has been made to analyze learning for finding any hidden information from the streams of data continuously being produced from educational systems [
1]. Initial level programming courses are specifically significant as these courses make the basis of higher-level courses in computer science and related study domains. However, most of the students find difficulties in learning the concepts taught in these courses [
2]. Learning analytics thus play a vital role to examine the new facets of these courses that could be utilized for improvements in the related domains. Despite the continuous attempts to analyze various aspects of these courses [
3], efforts are still required for more granular level analysis covering the detailed aspects of learning in contrast to the analysis relating to the broader aspects. The learning analysis performed through assessment data is mostly anecdotal where the impact of analysis is examined on final exams or grades [
4,
5] while less work is done to find impact of analysis on subsequent stages of the course covering one or more concepts [
6,
7]. Furthermore, concept analysis is performed to examine learning at various levels of cognition by applying Bloom’s taxonomy [
8,
9]; however, work is still required in the direction of analyzing the cognitive propagation of learning of the subsequent higher-level concepts of programming. The precise efforts are needed to explore how cognitive levels of learners on set of concepts could relate to the learners’ cognition on relatively advanced level programming concepts. One of the main hurdles in this direction is the lack of defined structure and connection between the components and stages of the course which are covering different concepts. This study presents a framework for cognitive learning analytics that links components of courses to examine cognitive learning on related concepts. The framework utilizes the technique of concept mapping to provide structure to the course concepts and provides a basis for exploring the cognitive learning relations of the concepts [
10]. Furthermore, the framework provides a systematic and structured mechanism for transforming the continuously producing data through assessments of programming courses to find any meaningful information that could be useful for improvements.
The framework is evaluated using the assessment data of two programming courses to predict the cognitive performance of students as they relate to higher level programming concepts. The assessment data are generated at various levels of cognition by applying the revised Bloom’s taxonomy [
11], which was originally presented with different sets of verbs and nouns to assess and classify students’ cognition [
12]. Another taxonomy of cognitive skills called Structure of the Observed Learning Outcome (SOLO) describes complexities through quantitative and qualitative measures and classifies students’ cognition on the basis of one or more aspects of learning [
13]. We chose to use the revised version of Bloom’s taxonomy as in our opinion it presents a comprehensible guide to assess and classify the cognitive progression of learners in terms of lower to higher level thinking.
The rest of this paper has been organized in the following manner.
Section 2 highlights the related work while
Section 3 presents the cognitive learning analytics framework.
Section 4 describes the case study for evaluating the framework. The discussion has been provided in
Section 5 while the limitations are elaborated in
Section 6. Finally, the conclusion and future implications are presented in
Section 7.
2. Related Work
The main motivation behind this study is to discover a framework-based approach for examining the cognitive propagation of learners on related concepts that emphasizes granularity of analysis. We examined literature, most of which relates to the initial level programming courses and perused the coverage of aspects related to this work.
2.1. Frameworks of Learning Analytics and Cognitive Assessment
Various frameworks of learning analytics are presented to analyze learning generally as well as specifically on different cognitive levels. The authors in [
14] devised a learning analytics framework, which is comprised of six dimensions: Stakeholders, internal limitations, external constraints, instruments, objectives, and data. The stakeholders include students, teachers, and institutions, internal limitations are based on factors like competencies, external constraints relate to educational conventions and norms, and instruments are used to tailor information that could be used for analysis. Different types of data can be used for analysis, which mainly emerge from the students’ interactions with the system. All the specified dimensions of learning analytics are significant and are applied in their precise forms while evaluating the framework presented in this article. The proposed framework serves as a platform that has potential to analyze learning for examining both reflective and predictive objectives as presented in the related work. The work in [
15] presented a framework to analyze learning from different aspects of facilitating the stakeholders. The aspects highlighted for instructors include knowledge assessment, types of errors, engagements, expectations, experimentation, and course design while the student-related aspects include planning, monitoring, and improvements. Tool support is provided to give an insight into the stated aspects by exploring different parameters like submitted assignments, and time spent on certain sections of the tool. The presented approach was based on tool-based analysis, which would help stakeholders to perform their respective roles. The research in [
16] proposed a framework for cognitive assessments, which is based on Bloom’s taxonomy. The framework was meant to examine student learning at various cognitive levels of programming concepts. The significance of assessing learners on specific concepts at various levels of cognition was highlighted. This work complements our approach, which emphasizes the role of various cognitive levels to precisely assess students’ cognitive learning on specific concepts by applying the Bloom’s taxonomy. However, our proposed framework is augmented with the use of a concept map, which establishes an organized structure of concepts, taught at various stages of programming courses. Through this approach, the cognitive dependencies of related concepts could precisely be analyzed at various levels using assessment data.
2.2. Learning Analytics and Predictions in Programming Courses
Learning analytics in programming courses have been performed from various dimensions to find useful information that could be utilized for the improvements of related environments. The data sources of learning analytics and predictions in programming courses generally relate to the students enrolled in courses taught at various institutes where the students’ data of one or more institutes are used in prediction and analysis studies [
6,
7,
17]. Various types of data have been used for analysis of programing courses, which include past academic record [
6], social learning data like number of comments and posts [
7], log data of submissions and attempts of answering questions [
18], and programming data like compilation states and errors [
19]. The assessment data of students’ performance in assignments, in-class activities, and mid-term exam is perused to identify a stronger predictor of final exam performance where the performance in mid-term exam turned out to be the strongest predictor among the others [
15]. Moreover, the assessment data of peer reviews and comments has also been used for analysis [
20]. Furthermore, the cognitive and non-cognitive factors have been examined to find the appropriate set of determinants of students’ performance [
21]. Analysis studies, which lead to predict students’ performance, generally, examine impacts of analysis on final exams or grades [
17,
20,
21]. Very few studies target performances on subsequent weeks or forthcoming assignments to examine impact of analysis. The authors in [
6] presented an automated predictive model to predict students’ weekly performance. The study in [
7] analyzed programming to predict performance by perusing the impact of analysis on students’ assignments.
2.3. Conceptual Analysis
Studies are conducted to analyze programming concepts from various perspectives. The analysis dimensions of programming concepts include investigation of the threshold concepts [
22], difficulties students face in understanding specific concepts [
23,
24], and the choice of programming concepts applied while solving the problems [
25]. Difficulty of concepts as one of the investigating areas for devising course related activities is highlighted in [
15]. The analysis of individual concepts could give more precise findings than analyzing course data and generalizing the findings for all concepts of the course. The difficult concepts, from the students’ end, need to be examined early so that effective interventions could be planned before teaching the subsequent higher-level concepts.
2.3.1. Cognitive Analysis of Concepts and Related Assessment Data
Assessment data generated by applying Bloom’s taxonomy reflect different levels of learners’ cognition. Studies examined the students’ cognition, through Bloom’s taxonomy, for different purposes. The research in [
26] presented rules for auto-identifying the demonstrated cognitive levels of students through their programs. The developed programs were mapped to different cognitive levels on the basis of devised rules. The study was conducted on the concepts of selection, repetition, and modularity. The study in [
23] precisely assessed students learning on the concept of programming loops at different levels of cognition. This study helped in identifying students’ weaknesses on the given concept. The study finds an increase in students’ motivation through the specified approach as it helped them in understanding the more detailed insight into their knowledge. The authors in [
9] examined the relationship of written assessment with Bloom’s taxonomy-based final exams and found a strong correlation between the two variables. The work in [
27] perused assessment items developed to assess learners on different level of cognition and find most effective assessment items that could assess students learning by analyzing the data of different tests conducted on the basis of developed assessment items.
Although assessment data and cognitive analysis has been examined from various dimensions, yet rare work is seen that examines the cognitive propagation analysis of related programming concepts, which makes an area that needs attention. In this article, we have presented a structured approach of assessing cognitive propagation on a number of programming concepts, which emphasize the granularity and specificity of learning analytics using Bloom’s taxonomy-based assessment data.
2.3.2. Concept Mapping
Establishing linkages between the concepts taught at various stages of conducting the course is significant to analyze the effect of learning a concept on the related concepts. In the literature, the concept mapping technique has been used to link the concepts taught at various stages of the course. The authors of [
8] examined the development of higher level thinking on the programming concepts of Abstraction, Decomposition, and Encapsulation. They perused the concept mapping technique to assess learning through peer review process. The authors in [
28] analyzed the use of concept mapping in computer science courses through systematic mapping study. The application of concept mapping technique to support teaching and learning by organizing the knowledge has been highlighted. Moreover, the increasing diversity of using concept map in the courses of programming and software engineering is also observed. The concept map is used as an assessment instrument by examining the way students link various concepts. The work in [
29] examined personalized learning approaches through pre-requisite concept maps of learners by identifying the learning gaps of specific concepts. The work in [
30] used concept mapping technique to find students understanding about the I/O topic. The concept maps for hardware components and I/O communication were developed and used as standard approaches to assess whether students are able to link various concepts appropriately. The research in [
31] perused the application of concept map to develop a programming task. The developed concept maps were based on the set of concepts that are required to solve specific programming problem. This technique would help in determining the understanding of all the concepts involved in solving a given problem. The authors in [
32] examined the use of concept mapping in teaching physics. The linking phrases among the concepts were kept blank, which were required to be filled in by the students. The concept mapping was identified as a useful technique for removing the misconceptions. The study in [
33] presented a survey on the concept map scoring by exploring ways to rank learning through the developed concept maps. Most of the studies used concept map as assessment tool to examine students’ learning while performing some class activities in which students are required to create, review, or refine the concept maps. The work in [
8] examined the learners’ cognition at a high level of thinking by letting them improve the created concept map. The authors in [
34] used the concept map-based model of object-oriented programming course to check concept effect analysis. The concept effect propagation was analyzed by scrutinizing the understanding of students on set of related concepts required to solve test items in exams. The demonstrated knowledge of the learners was used to examine the extent of achieving the learning outcomes. The research in [
35] perused the technique of scoring the students’ knowledge through parameters like linkages of concepts established in the concept maps and patterns of correct and semi-correct propositions established for making the linkages. However, no specific standard is established to rate students’ knowledge through their developed concept maps [
28].
Despite using the concept mapping technique to analyze learning, efforts are required to examine how concept mapping can be used to analyze cognitive relationships among various concepts. Since learning a programming concept depends on the learners’ cognition on one or more related concepts, the structuring of conceptual data is specifically significant in programming courses. The proposed framework structures the concepts data using the technique of concept mapping and then applies the demonstrated cognitive levels of learners acquired from assessments on the concept map. The resulting structure would then be used to examine learning from different dimensions. This approach will serve as a basis for more granular and dynamic analysis of learning.
3. Framework for Cognitive Learning Analytics Using Assessment Data
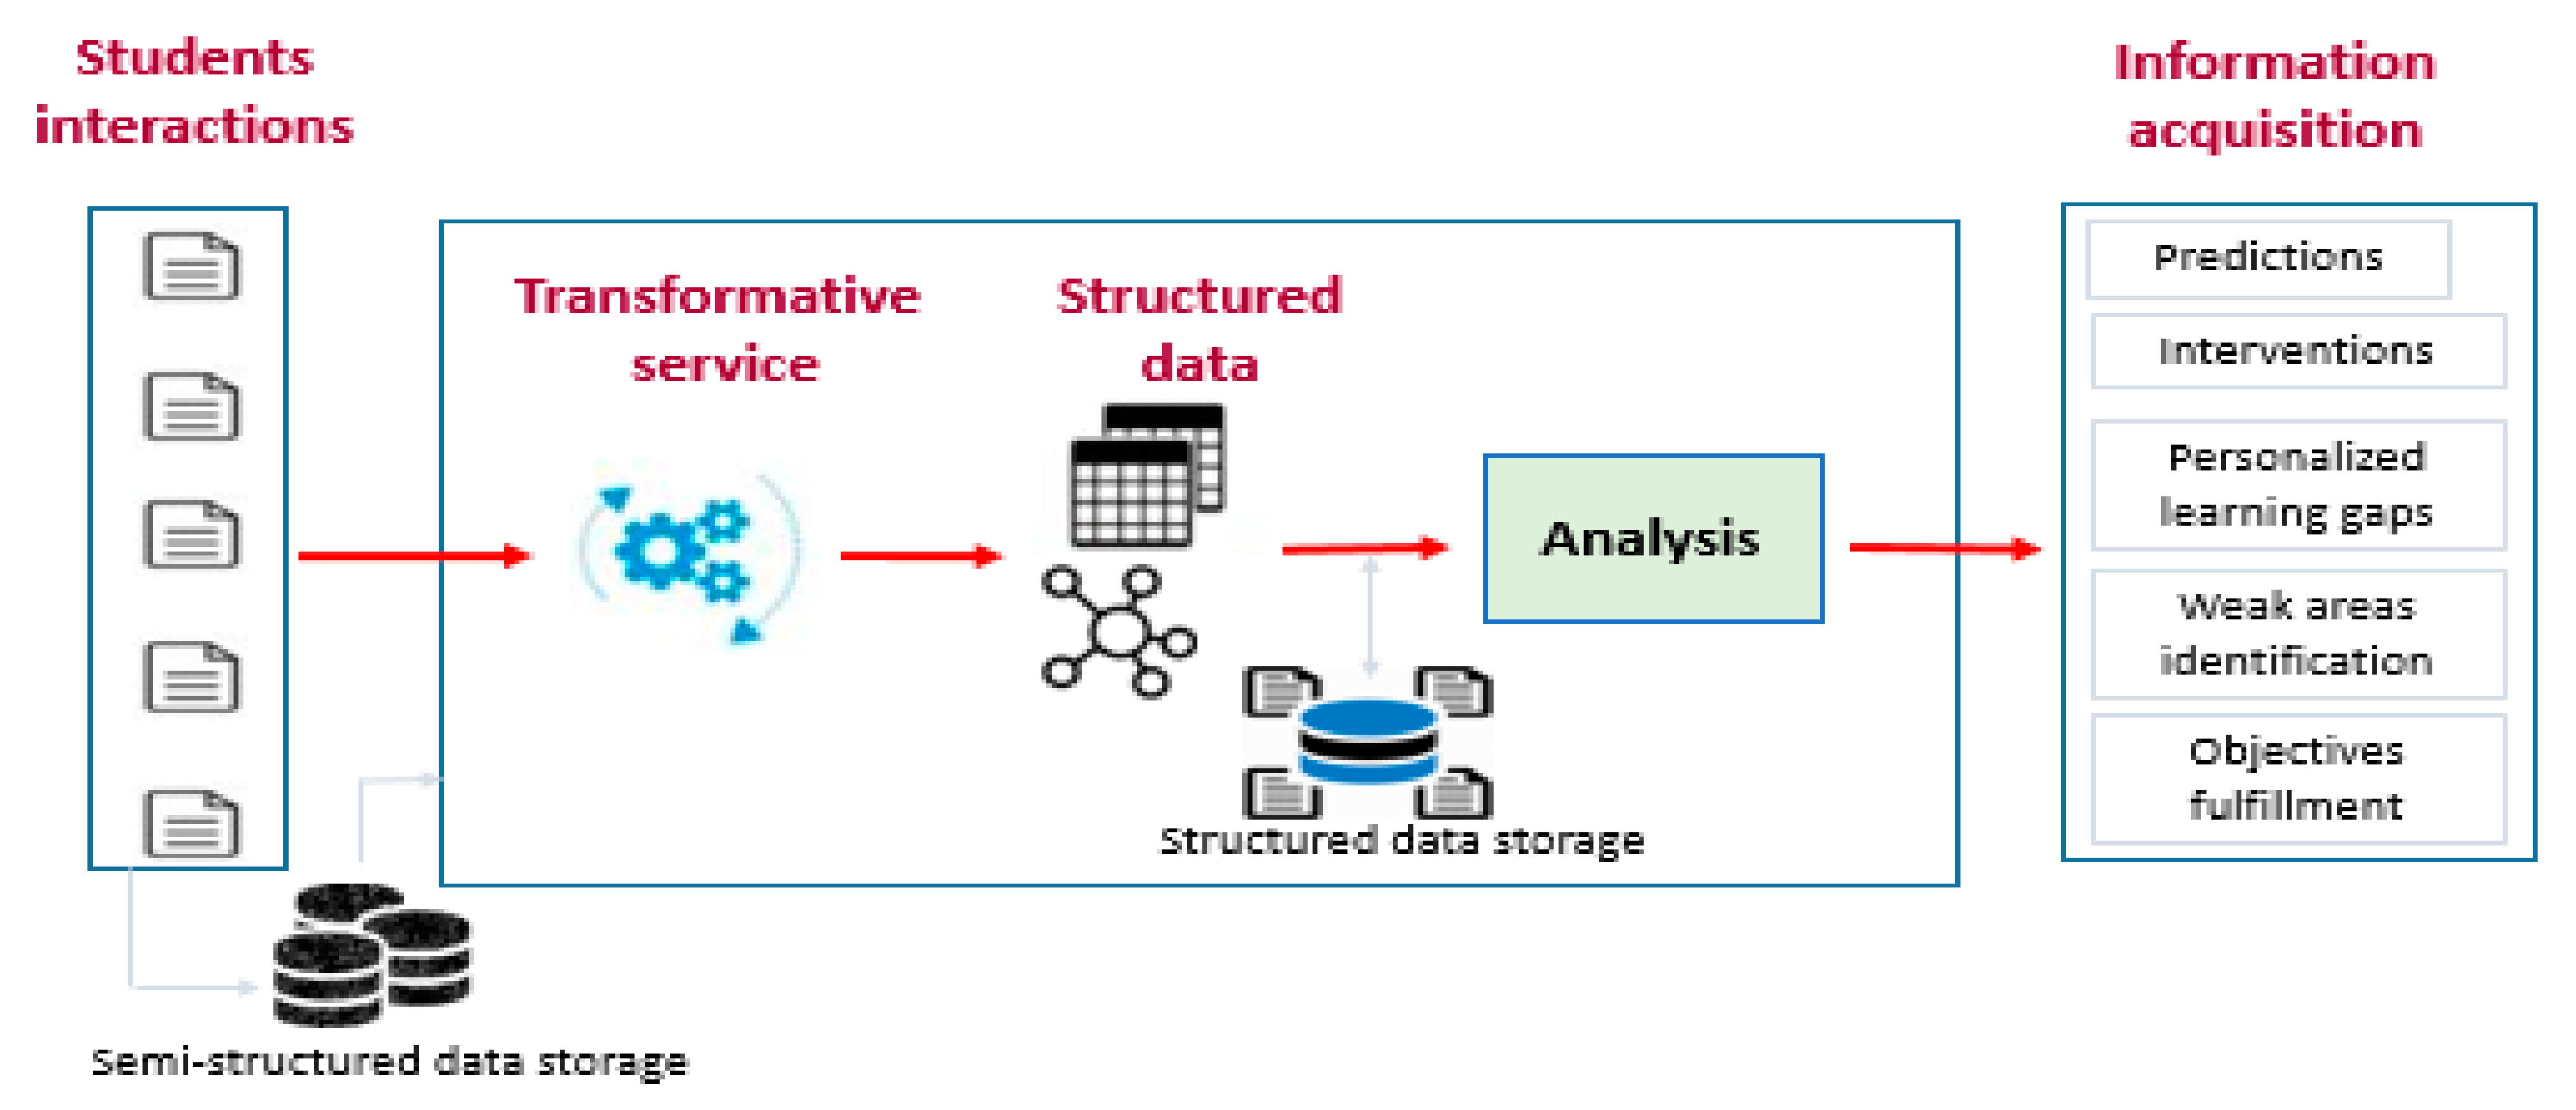
One of the main motivations behind devising the framework is exploring a systematic approach of transforming the semi-structured data of students’ interactions with the educational system into an organized structure.
Figure 1 presents the high-level abstraction of learning analysis aspects that will be covered by the presented framework.
Students’ interactions with education systems are generally produced in semi-structured form. Some transformative services are therefore required to convert the semi-structured data in the form that could be usable for systematic analysis of learning. The intent is to use the structure for finding new information that could be utilized by the stakeholders for improving the related learning or teaching processes. The systematic approach of transforming the data into an organized structure will pave the way of utilizing the continuously producing streams of students’ interactions data that are being generated from various iterations of related courses [
36]. The cognitive learning analysis framework is augmented with the use of concept map where the relations of various stages of course are established by linking the concepts taught at various stages of course. This structure serves to examine the learners’ knowledge gain on more granular levels. The framework is presented in
Figure 2. It is compartmentalized into three layers where each layer plays specific role in analyzing the course data.
3.1. Course Conduct Layer (A)
This layer handles the course material that is used to conduct the course and the data that are generated by performing assessment activities. The concepts data include the set of concepts that are used to teach the course.
The lecture material presents the ways concepts are taught to the students. Assessment data include assessment items and learners’ attempts. The concepts data generally do not expand on various iterations of courses whereas the assessments data keep on growing, as a new set of data appears on every iteration of course, resulting in continuous increase in the volume of big data.
3.2. Transformation and Mapping Layer (B)
This layer transforms and structures the concepts data by establishing linkages of concepts using the technique of concept mapping. The assessment rules for ranking the learning are devised and applied to the learners’ attempts. An appropriate set of assessment rules representing the threshold values that grades learners’ performances, needs to be devised. These rules are required to be applied to learners’ attempts to find out the demonstrated cognitive levels of learners on various concepts. The learners are thus examined at various cognitive levels as per Bloom’s taxonomy where remember is the lowest level and synthesis is the highest level of cognition. For the proposed framework, it is required that the assessment data include the assessment items addressing different cognitive levels of the related concepts. Therefore, the following conditions (1 and 2) related to assessment data need to be fulfilled. Consider
a super set that contains all assessment items of a given course and
as a set of assessment items for a given concept
c, then
Also,
is the set of assessment items of cognitive level
i for a given concept
c, then
where
Lmax is the maximum cognitive level of assessing the learners. The concept map of course augmented with the demonstrated cognitive levels of the learners lead to the personalized cognitive maps of the learners. This transformation of concept map to the personalized cognitive level map is represented in
Figure 3.
3.3. Knowledge Discovery and Analysis Layer (C)
This layer is meant to identify the hidden information from the cognitive maps obtained from the previous layer. The cognitive level maps of learners will be used in this layer for knowledge discovery. Educational data mining techniques, which include descriptive and predictive analysis, could also be applied to discover knowledge through streams of data producing from the educational systems [
37]. The analysis dimensions for instructors would help instructors determine, for example, the cognitive outcomes of the related concepts obtained by performing some teaching activities during the course execution. This would help in identifying whether related activities or teaching methodologies and materials may need to be continued for the next iterations of the courses. Also, if there are any unexpected outcomes, then those areas of the course would specifically be analyzed. The learners, through this proposed framework, would be able to identify weak areas of their understanding levels e.g., if a particular learner demonstrated good performance up to the level of “apply” as per Bloom’s taxonomy but are unable to perform good on the levels beyond that, which sub-concepts he/she needs to improve. This framework will help course evaluators, who are responsible for quality assurance and enhancement purposes. This would help them in identifying for example, whether the intended course objectives based on students’ cognitive learning are achieved up to the expected levels and the specific iterations of the courses in which the course objectives were achieved above or below the expected levels.
4. Case Study: Cognitive Performance Prediction
To evaluate the proposed framework, the data of two instances of CS2 course, titled Object Oriented Programming (OOP), are used. The courses at both institutes relate to the semester-based system where each semester spans over 16 weeks.
4.1. Course Conduct (First Layer-A)
The first layer is based on the components related to conducting the course. These components are finalized while planning the course conduct activities and pre-exist in the system. The courses were conducted at two different institutes in the semester of Spring 2019 and have an enrollment of 53 students at institute 1 and 48 students at institute 2. This layer mainly presents the concepts data as well as the data of conducted assessment.
4.1.1. Concepts Data
A number of concepts are included in the both instances of the OOP course. However, based on the past data of the respective courses, the commonly identified concepts on which students’ performances were observed as weaker than the other course concepts, were selected for analysis. The shortlisted concepts include some higher-level concepts and some basic programming concepts that are prerequisites of OOP course. The shortlisted programming concepts for this study include polymorphism, inheritance, class, overloading, overriding, abstract class, concrete class, methods, variables, scope, signature, and data type.
4.1.2. Assessment Data
The assessment data are generated at various cognitive levels of all the concepts involved in analysis. Unlike most of the related studies, which analyzed students learning at maximum of 2 or 3 concepts involving all levels of Bloom’s taxonomy [
23,
26], this case study analyzed students on 12 concepts, therefore, we are limiting the application of Bloom’s taxonomy until the fourth level. The assessment items are devised to examine students’ cognition at the first four levels of Bloom’s taxonomy: Remember, understand, apply, and analyze. The remember level relates to recalling, recognizing, or retrieving of knowledge; the understand level depicts comprehending, classifying, explaining, and comparing the concepts or aspects; the apply level examines executing or implementing knowledge; and the analyze level is linked to attributing, differentiating, and organizing the concepts, ideas, or aspects [
38]. Considering various approaches of developing and classifying the assessment items for different levels of Bloom’s taxonomy [
23,
26,
39], the following approach is observed for developing the assessment items against the respective cognitive levels of Bloom’s taxonomy:
Remember: For the cognitive level of remember, the assessment items were developed to examine the recalling of the specified programming concepts in which students generally need to answer through narration or basic syntax recall.
Understand: In case of the assessment items for understand, students were required to answer by comprehending the respective concept or related programming aspect.
Apply: For the cognitive level of apply, the assessment items were developed to solve programming problems by applying programming concepts or providing information about the working of the program.
Analyze: The assessment items for the cognitive level of analyze were developed to identify and correct errors by analyzing the given code.
The assessment items were reviewed by two different instructors where the reviewers were required to rate assessment items’ capabilities of assessing students’ cognition at specified levels. The Kappa analysis was performed to find the inter-rater reliability, which turned out to be 0.79, which represents a high degree of correlation.
To assess each target concept at institute 1, the descriptive assessment items of uniform marks were developed for all the four cognitive levels. Hence, a total of 48 assessment items, of descriptive type, were developed to assess 12 concepts at each of the four cognitive levels. In addition to the descriptive type of assessment items, the Multiple-Choice Questions (MCQs) are considered fairly appropriate to assess students learning in programming courses [
40] at different levels of Bloom’s taxonomy [
39]. To assess the target concepts at institute 2, four MCQs of 1 mark each were created to examine a particular cognitive level of a given concept. Since the cognitive learning at four levels were required to be examined, 16 MCQs for each concept were prepared. Hence, a total of 192 assessment items were developed to test students’ cognition at first four levels of Bloom’s taxonomy in 12 concepts. The learner’s cognition on the target concepts were assessed through a planned series of quizzes conducted at regular intervals during the course. Since lower-level concepts in the concept map are taught early in the course, the quizzes of these concepts are conducted before the subsequent higher-level concepts. As part of the data cleansing process, the data of students who had not attempted all quizzes were removed from the dataset. Hence, the data of 77 students were finalized for analysis. It includes 40 students from institute 1 and 37 students from institute 2.
4.2. Transformation and Mapping (Second Layer-B)
The second layer performs a two-step transformation; first by transforming the semi-structured data of concepts into the organized structure of concept map, and second by converting the concept map into personalized cognitive level maps of individual learners. This step is performed by devising and applying the assessment rules on students’ attempts and mapping the demonstrated cognition of students to the concept map.
4.2.1. Constructing Concept Map
The hierarchical technique is used to construct the concept map for the shortlisted concepts of OOP course for analysis. A hierarchical concept map follows top-down approach of structuring concepts where more general concepts are on top and more specific concepts are at the bottom [
41]. This technique for concept map constructions is adopted as programming concepts are based on one or more set of lesser complex concepts e.g., the concept of class is developed through the lesser complex concepts of methods and variables. Similarly, the concept of variables is developed through the concepts of data types and scope. Furthermore, the concepts are arranged according to the way these concepts are taught in the specific OOP course. This means that lesser complex concepts lie on lower levels of the concept map and have been taught at earlier stages of the course as compared to the relatively higher level concepts, which are taught at later stage of the course. The concept map developed for OOP course, that structures the targeted concepts for analysis, is presented in
Figure 4.
The presented concept map is built and finalized for experimentation after going through a multi-cycle review and refinement process performed among two instructors who have been teaching OOP course in different institutes. Some of the sub-concepts are taught as part of the higher concepts like abstract, concrete classes, and inheritance. In some cases, the sub-concepts are taught as a whole before teaching the higher-level concepts like methods and variables before class.
4.2.2. Devising and Applying Assessment Rules
The demonstrated cognitive levels of learners are determined by deploying the devised assessment criteria on student’s attempts of assessment items. In case of descriptive assessment items of a given concept, the criteria for grading students attempt were devised by giving weightage to the sub-concepts (of the concept map) or aspects of programing involved for solving the problem. The grading of answers was assessed through Cronbach’s alpha test [
42]. It was performed by randomly picking and re-evaluating 10 assessment items where alpha value depicts greater than 0.77, which represents an acceptable number [
43]. In case of MCQs, there was only one correct choice, and the marks are given for selecting that among the given choices.
4.3. Knowledge Discovery and Analysis (Third Layer-C)—Cognitive Performance Prediction
The cognitive level maps obtained through layer 2 of the framework is used to examine learners’ cognition from various aspects. For this case study, the metrics are devised to examine and predict the learners’ performance at subsequent stages of the course covering relatively higher-level concepts. In this regard, we defined the metrics of 1) Cognitive Score (CS), 2) Aggregate Cognitive Score (ACS), and 3) Aggregate Level-wise Cognitive Sore (ALCS). The CS is calculated against each concept through the involvement of learners demonstrated cognitions of various levels. It is the sum of weighted percentage of the demonstrated cognitive levels of students on particular concept. The motivation behind establishing the CS metric is to consider students’ cognition at various cognitive levels, instead of one particular cognitive level, while ranking their knowledge gain on particular concepts. Cognitive score of a given concept is the sum of weighted % of marks obtained at each cognitive level. Consider a given concept
x, the CS of
x will be calculated as (3).
The value of n ranges from 1 to 6 where 1 represents lowest level of cognition (remember) and 6 represents the highest level of cognition (create) as per Bloom’s taxonomy. In the courses under experiment, the concepts are assessed until the fourth level of Bloom’s taxonomy; therefore, the maximum number of n for these courses is 4.
ACS of a concept
y is calculated as (4). It is based on the CS of immediate predecessors of
y. The motivation behind devising this metric is to examine the ability of sub-ordinate concepts to predict performance of higher-level concepts by involving students’ cognition at various levels. ACS is calculated as the sum of weighted cognitive scores of immediate predecessor sub-concepts
k. The
m is the number of immediate predecessor concepts, which could range from one to less than the total number of concepts in the course.
On the basis of cognitive performance of low level concepts, the ACS is calculated to predict performance at subsequent higher level concepts e.g., to calculate ACS for the concept of Class, it first needs to calculate the cognitive score of each of the immediate predecessor sub-concepts of Class (Methods and Variables) in the concept map. The ACS of Class is then calculated by multiplying cognitive score of Methods and Variables by half. Considering the concept of Class has two immediate predecessor sub-concepts, the value of m is 2.
ALCS of a concept
y is calculated through its immediate sub-concepts in the concept map. It is calculated by adding the weighted obtained %marks at particular cognitive level
L of all the sub-concepts of
y. Let
%MS1 is % of obtained marks in sub-concept 1 of concept
y,
%MS2 is % of obtained marks in sub-concept 2, and so on; then, ALCS of a concept
y at first cognitive level will be calculated as (5), where
u could be any number from 2 to one less than the total number of concepts in the course and
L presents the cognitive level 1 (remember). Similarly, the ALCS for level 2 (understand), 3 (apply), and 4 (analyze) will be calculated. The weight is driven by the value of
u and calculated as
1/u.
The ALCS of concept of class at remember level is calculated by adding % of marks obtained in the sub-concepts of methods and variables on the same level where the value of u is 2. ALCS is calculated where there exist more than one sub-concept as immediate predecessors.
Application of Metrics to Predict Performance on Relatively Higher-Level Concepts
The ACS and ALCS are examined as predictors to predict performance of individual cognitive levels of higher-level concepts. The linear regression technique has been used for prediction because it is considered as one of the most appropriate approaches in terms of predicting the value of one variable through the other. The prediction studies used different techniques, to calculate the prediction accuracies, which include root mean square error [
20], precision, recall, F1 score [
17,
44], and variance [
7]; however, we calculated the prediction accuracies through Mean Absolute Error (MAE) as it is considered as one of the simplified and comprehensible measures in terms of identifying the differences of actual and predicted values. The prediction accuracies acquired through both ACS and ALCS were compared to determine the cognitive level of target concepts (among the four cognitive levels i.e., remember, understand, apply, analyze) that exhibit lesser MAE or higher accuracy. After calculating the ACS and ALCS for cognitive performance prediction of seven target concepts (inheritance, polymorphism, class, overloading, overriding, methods, and variables), the values of MAE are calculated and examined. The MAE1 is calculated on the complete data while MAE2 presents improvements acquired by removing the extreme values from the dataset.
Table 1 presents the overall prediction accuracies of both institutes acquired from ACS and ALCS. In case of ACS, the overall prediction accuracy ranges from 67.9% to 86.40% while it is observed as 74.43% to 89.88% after improvements acquired through MAE2. The ALCS presents overall prediction accuracy ranges between 60.41% to 86.36%, which is obtained as 64.81% to 90.86% through MAE2.
Figure 5 presents the comparison of prediction accuracies acquired at various cognitive levels of target concepts. In case of ACS, cognitive learning analysis of two concepts demonstrated maximum prediction at each of the cognitive level of remember, understand, and apply while for one concept, the maximum prediction accuracy is presented at the cognitive level of analyze.
The improvements in ACS predictions shifted the maximum prediction accuracy of one concept from remember to analyze and one from understand to remember. In the case of ALCS, MAE1 of three out of seven concepts presented maximum prediction accuracy at cognitive level of remember, two of the concepts at the level of analyze, and one concept for each of the cognitive levels of apply and understand. The findings are almost similar in case of MAE2 for ALCS except for two concepts in which the maximum accuracy of prediction is shifted from remember to apply and analyze.
The prediction accuracies, acquired through ACS and ALCS, were further analyzed individually for each of the institutes.
Table 2 illustrates the prediction accuracy acquired by applying ACS to the course data of each institute separately.
For the course of institute 1, the MAE1 ranges from 11.59 to 41.69, which makes the range of prediction accuracy from 58.31% to 88.41% considering all cognitive levels of target concepts. For same course, the accuracy of ACS acquired through MAE2 ranges from 65.48% to 92.44%. For the course at institute 2 the MAE1 through ACS is from 6.88 to 34.44 making the range of prediction accuracy 65.56% to 93.12% while through MAE2, the prediction accuracy for the same course turned out to be 71.74% to 96.54%.
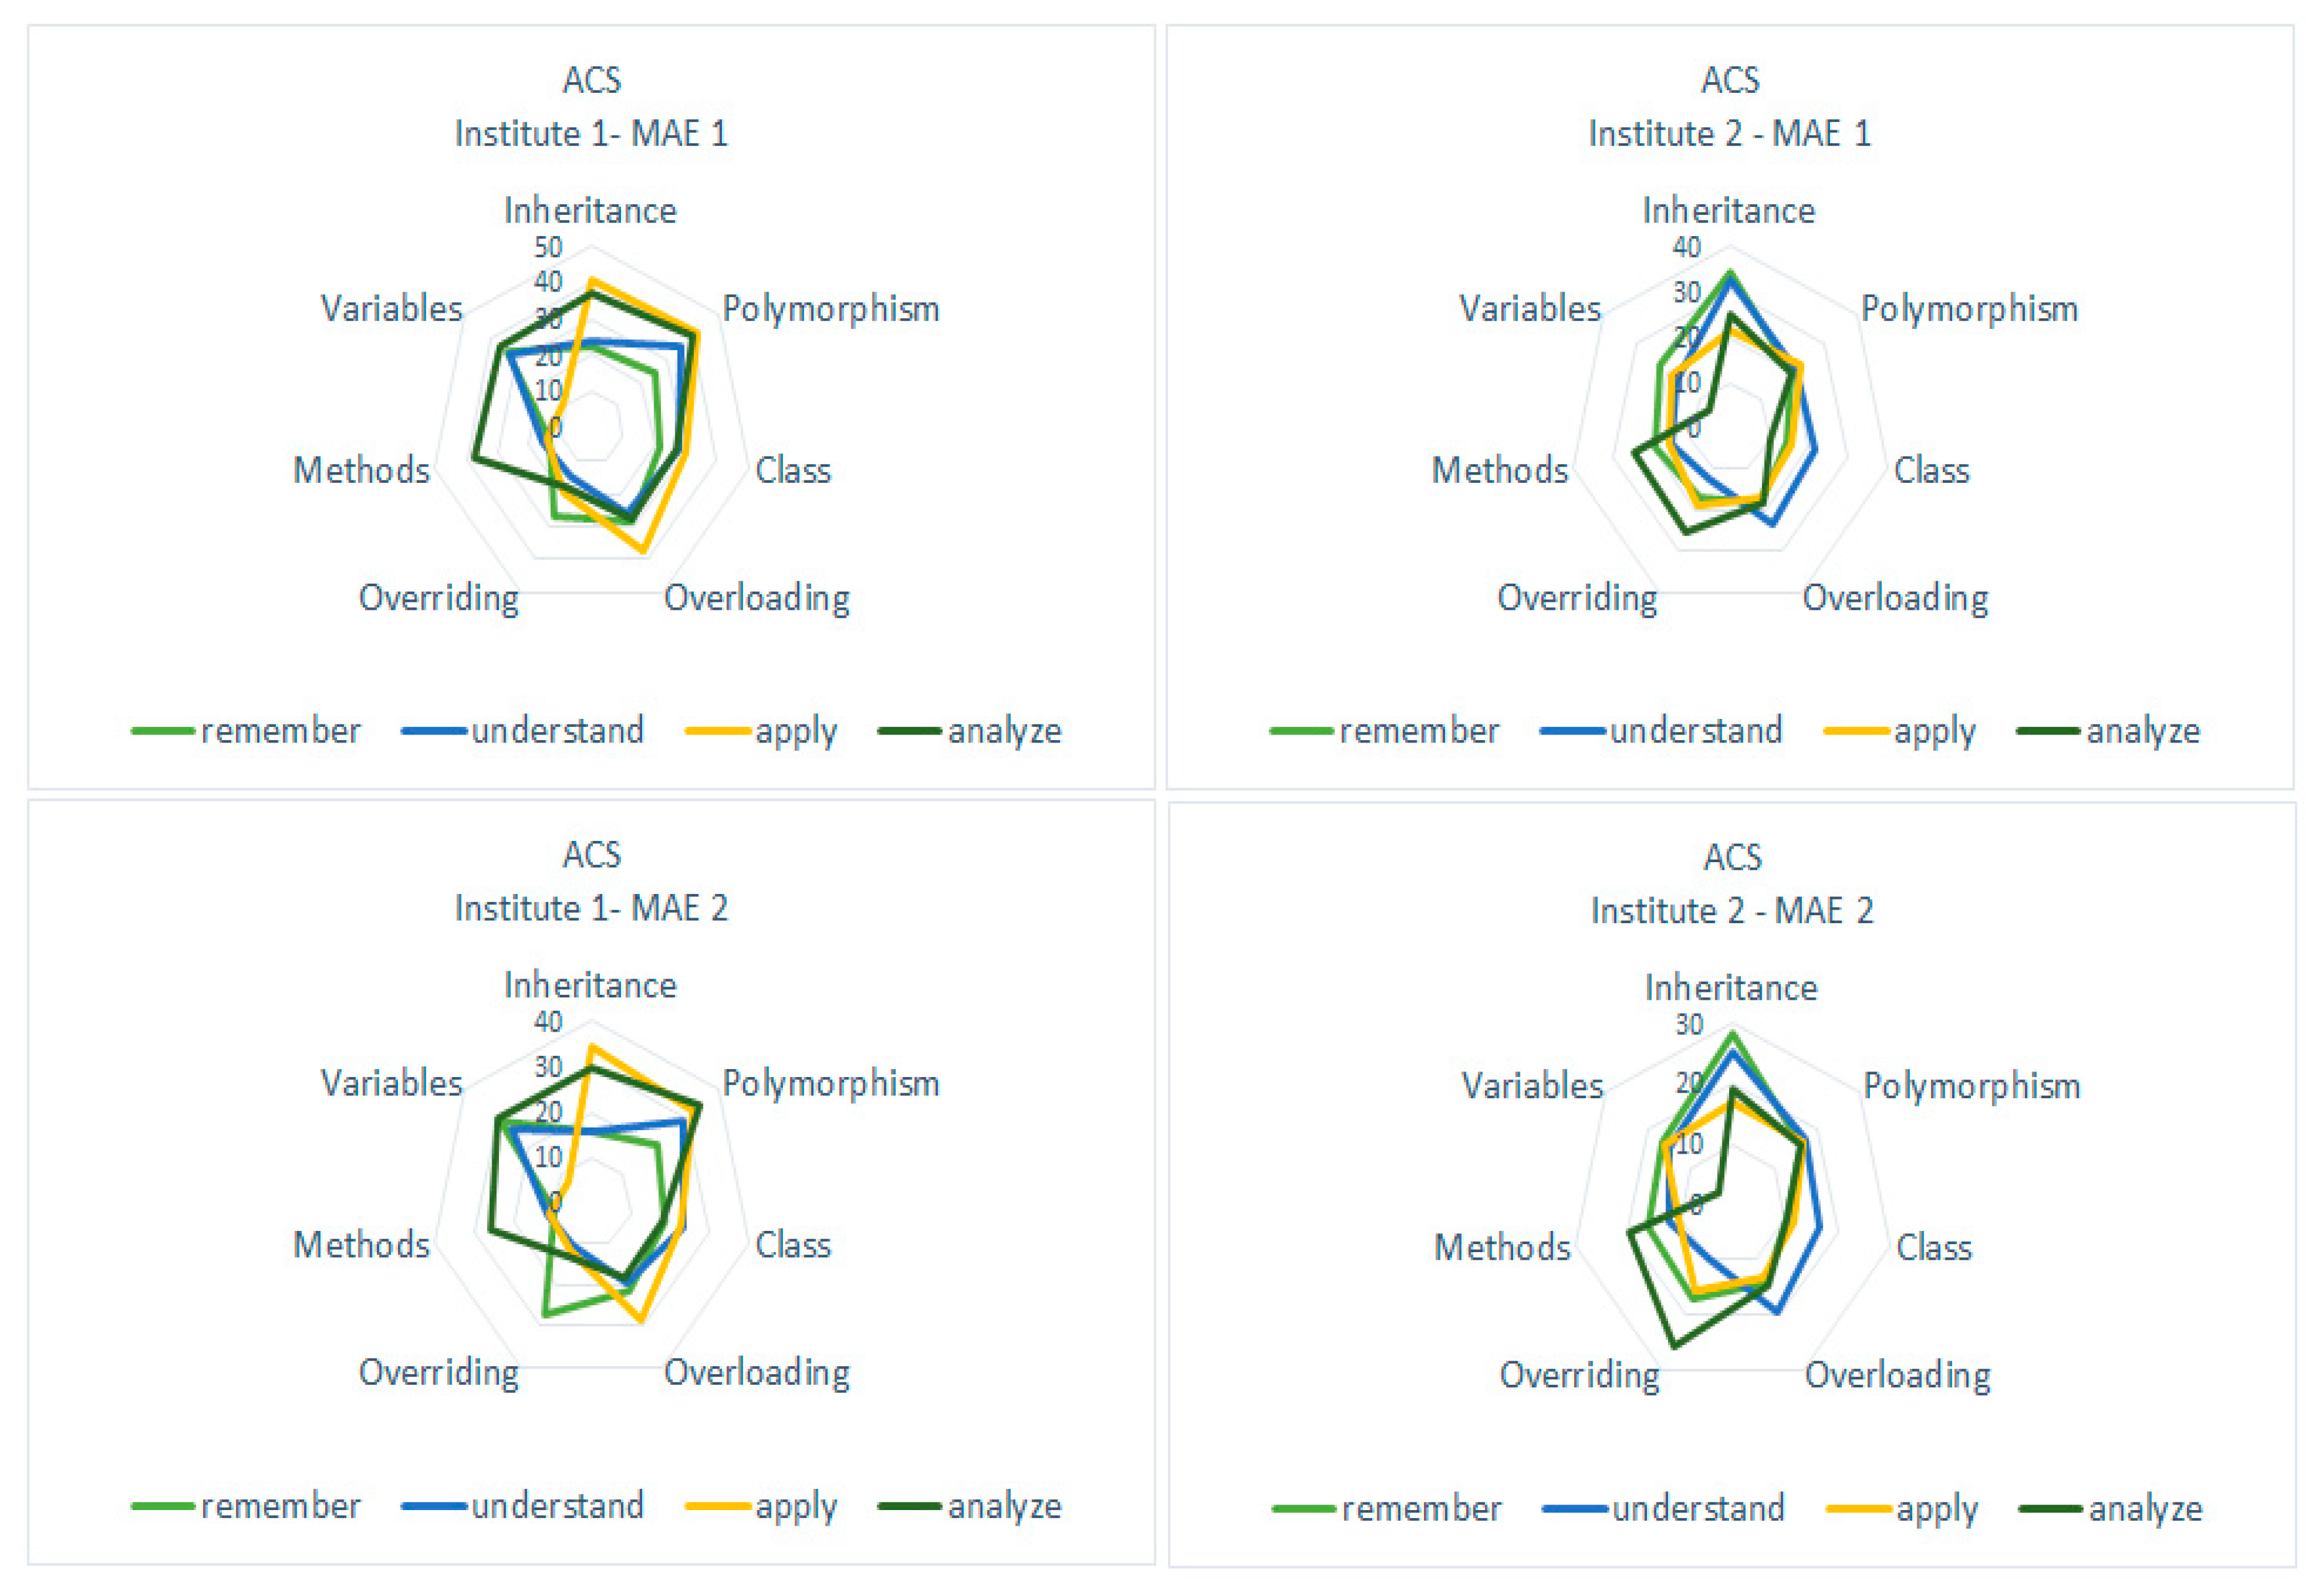
Figure 6 presents the cognitive prediction accuracy of target concepts acquired through ACS.
In case of institute 1, the ACS could be able to predict the cognitive performance of inheritance, polymorphism, class, and methods with maximum prediction accuracy acquired at the cognitive level of remember. The maximum cognitive prediction accuracy in overloading and overriding is obtained at the cognitive level of understand while for the concept variables, it is obtained at the cognitive level of apply. Refinements through MAE2 did not change the findings as far as the maximum predictable cognitive level of target concepts is concerned except for the concepts of inheritance and class, which becomes the levels of understand and analyze, respectively. In case of institute 2, the analysis of ACS reflects arbitrary results in terms of maximum prediction accuracies acquired at various cognitive levels of target concepts. The concepts of polymorphism and class presented maximum accuracy at remember while overriding and methods depicted the maximum accuracy at the level of understand. The concepts of inheritance and overloading presented maximum accuracy at the level of apply where variables presented the maximum accuracy at analyze. The MAE2 analysis depicts that the situation remains same as far as maximum predictable cognitive level is concerned except for polymorphism and method, which shifted to analyze and apply, respectively.
Table 3 presents the individual results obtained by applying ALCS for each of the institute. For institute 1, through ALCS the MAE1 ranges from 9.18 to 40.78, which makes the prediction accuracy range 59.22% to 90.82% at all cognitive levels of target concepts while through MAE2 the range is from 59.55% to 96.02%. For the course at institute 2, through ALCS the MAE1 ranges from 8.57 to 39.98 which makes the prediction accuracy range 60.02% to 91.43% while through MAE2 the range of prediction accuracy acquired is 60.96% to 95.09%.
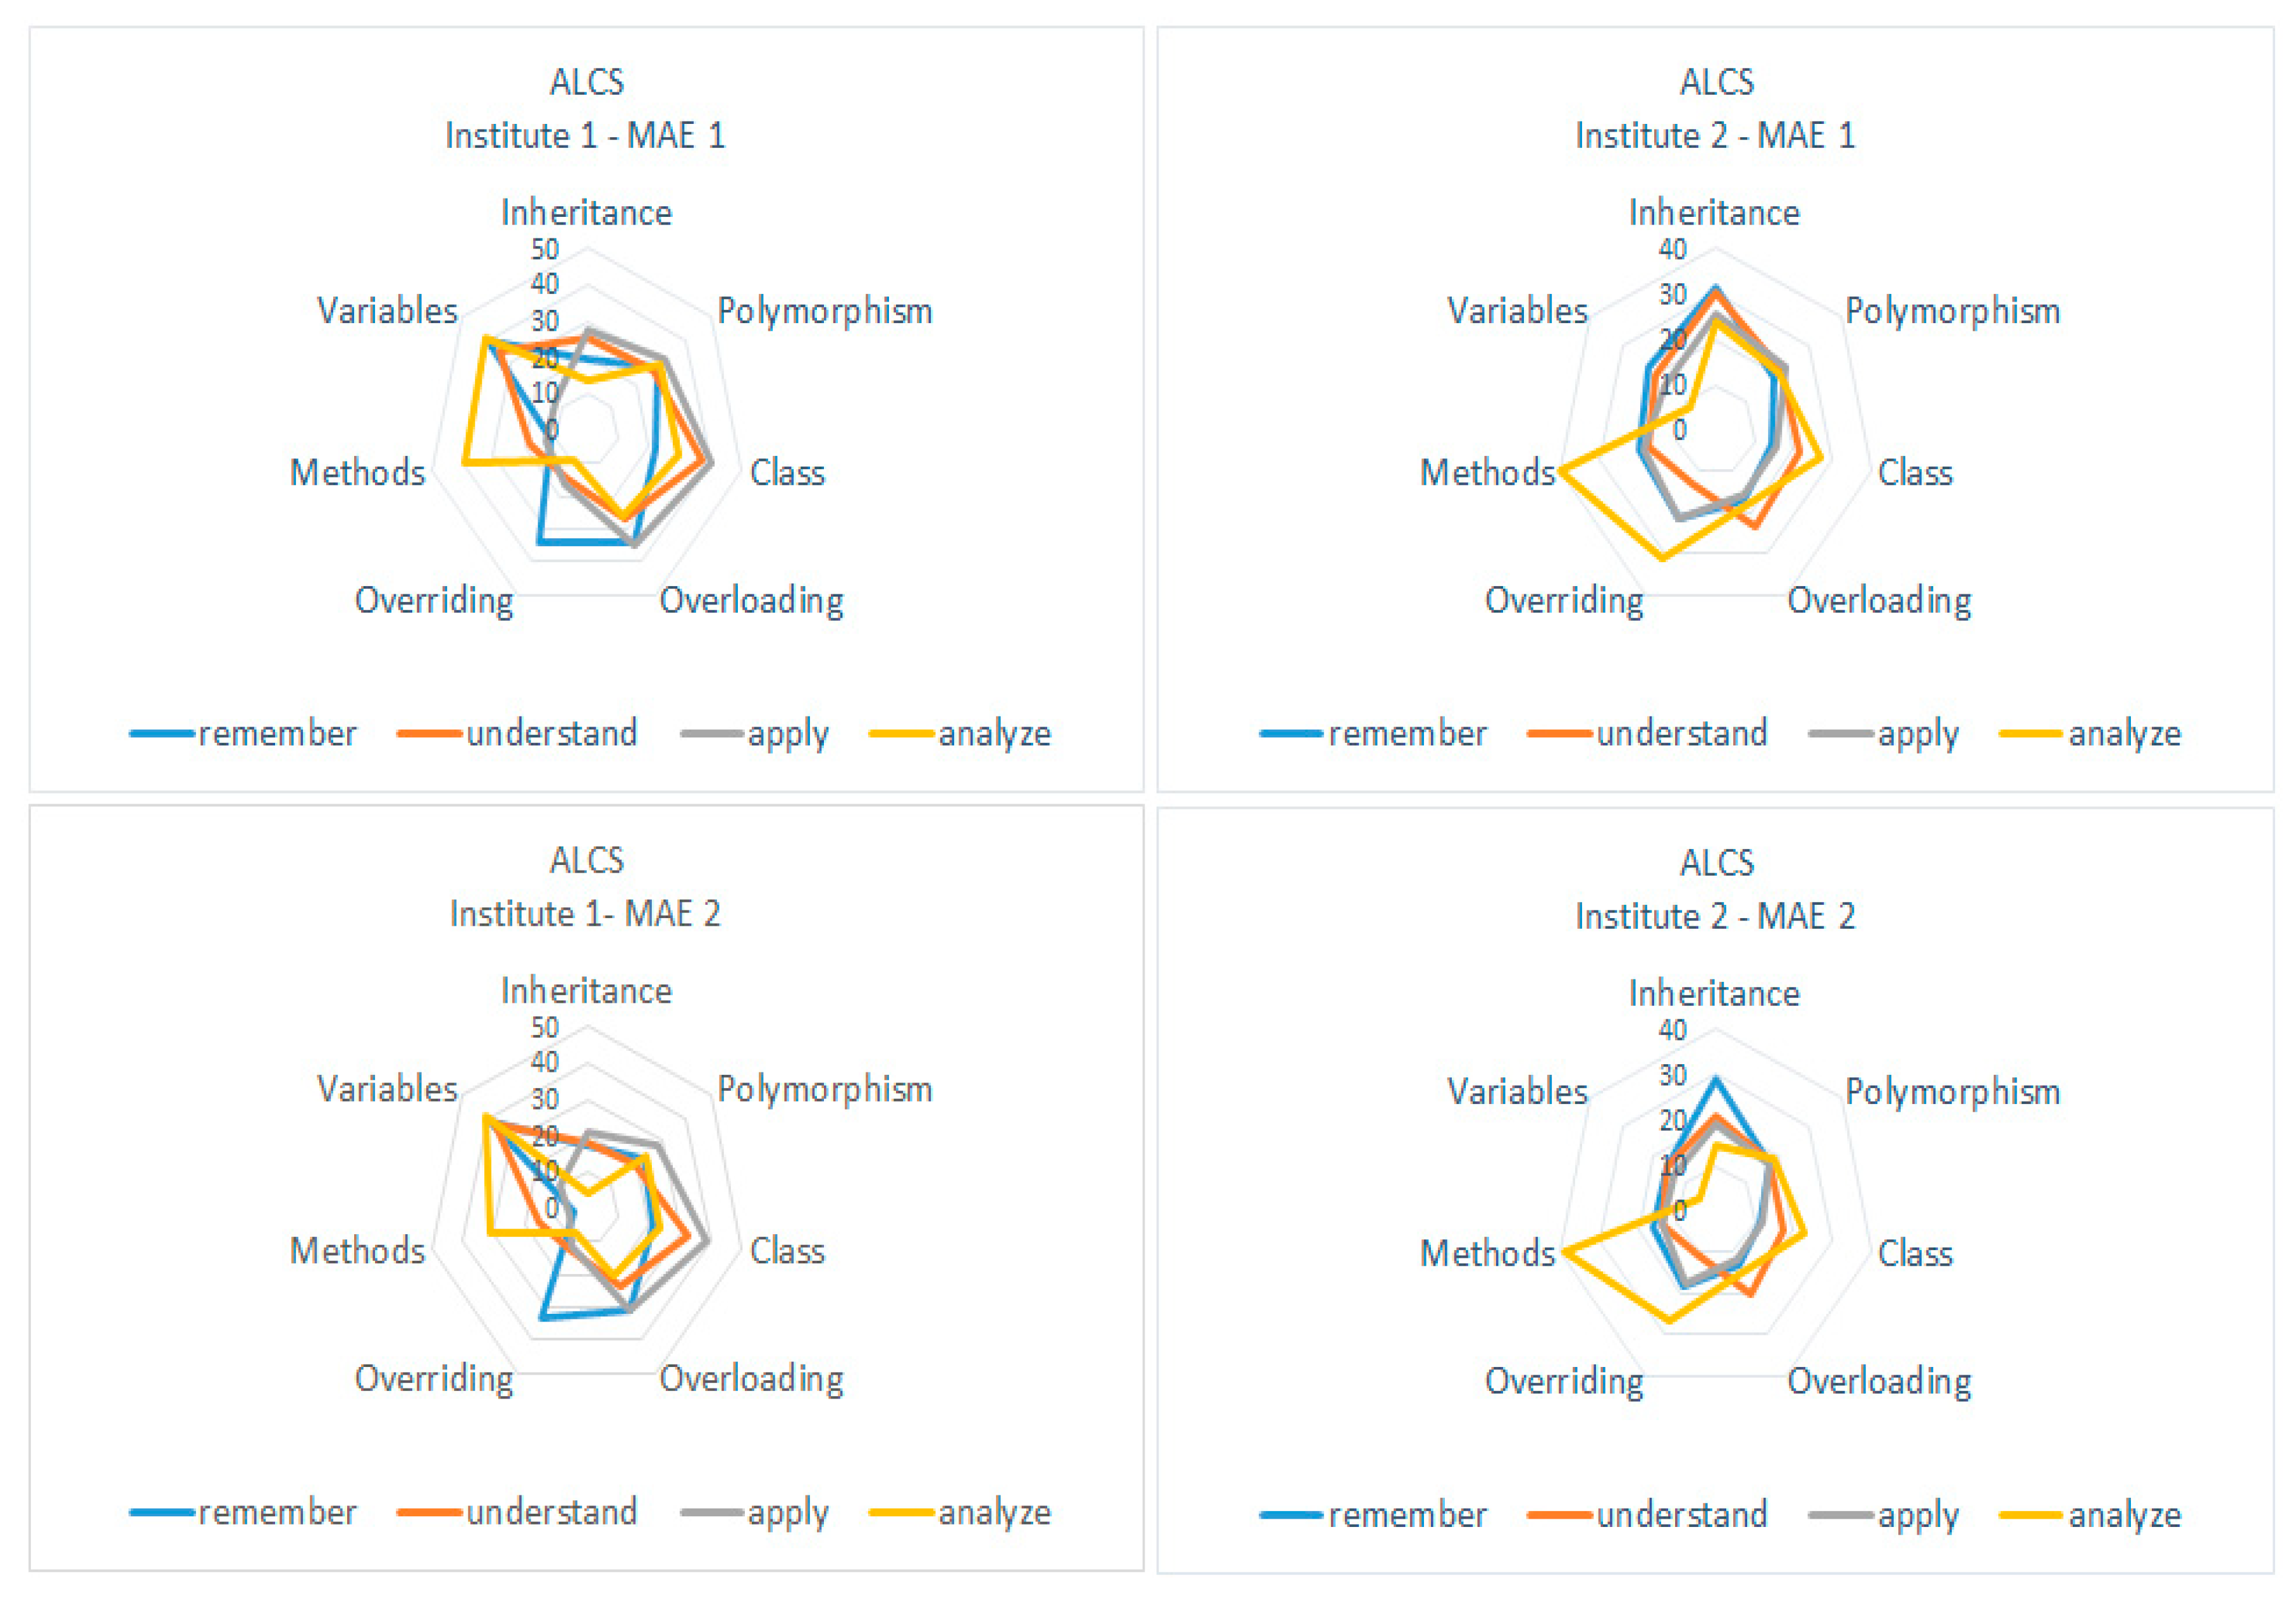
Figure 7 presents the cognitive prediction accuracy of target concepts obtained through ALCS. In the case of institute 1, the ALCS for the cognitive performance prediction in the concepts of inheritance, overloading, and overriding showed maximum prediction accuracy at cognitive level of analyze, for class and methods the maximum accuracy is observed at cognitive level of remember. For variables it turned out to be apply and for polymorphism the maximum accuracy is acquired at understand. For MAE2, maximum predicting level becomes apply in case of methods where the other findings turned out to be similar as MAE1.
In the case of institute 2, the ALCS for the cognitive performance prediction on inheritance and variables showed maximum prediction accuracy at cognitive level of analyze while the cognitive performance prediction on the concepts of polymorphism and class showed maximum accuracy at the level of remember. The concept of overloading presented it at apply and method at understand. For MAE2 the findings are almost the same except for methods in which the maximum prediction accuracy has been shifted to the level of apply with very minute difference, which was understand in case of MAE1.
5. Discussion
The role of education is essential for sustainable development of the related environments [
45]. Initial level programming courses are specifically significant in computer science and related disciplines as these courses provide basis to various other courses in undergraduate study programs. Due to high dropout rates, the sustainability of these courses is a concern and therefore makes it an area that needs to be examined from various dimensions [
3]. Learning analytics studies are being conducted for initial level programming courses to unveil any hidden aspect that could be used to optimize the efficiencies of related learning environments. However, more granular analytical techniques still need to be explored in order the find detailed aspects that could be utilized for the betterment of related systems. Since learning higher-level programming concepts depends on the understanding of lesser complexed concepts, the early prediction of performance can be explored through the performance of lesser complexed programming concepts. This will pave the way for more meaningful predictions, which would help in devising the effective interventions [
46]. In case of programming course, it will specifically assist instructors by giving an insight into the learning gaps before teaching more complex programming concepts. In the literature, most of the studies performed analysis and prediction through anecdotal approaches where the effect of analysis is examined on final stages of the course [
17,
20,
21]; however, information is rarely given on the topic of assessment items in the final exams and the cognitive levels of the assessment items. In this article, we presented a framework-based approach for cognitive learning analytics to peruse students learning more precisely and predict students’ cognitive performances at higher-level programming concepts taught at subsequent stages of the courses. The presented framework emphasizes cognitive learning analytics by going through two transformation steps of semi-structured course data: a) Transforming the concepts data into organized structure of concept map and b) the mapping of concept map and students demonstrated cognitive learning acquired through the assessment data, which resulted into the structure of cognitive maps of learners
The conceptual structure of cognitive map is used to examine cognitive propagation of learning on related higher-level programming concepts. It supported devising two metrics ACS and ALCS, which were analyzed as predictors of cognitive performance of learners on higher-level programming concepts. The cognitive predictions are examined on four levels of Bloom’s taxonomy in the two instances of an OOP course conducted at two different institutes. ACS and ALCS were examined to check how cognitive learning propagates at various levels of cognition of target concepts. The accuracy of predictions is examined through MAE1 and the improvements are performed by removing the extreme values, which give improved accuracy presented as MAE2. It was identified that the devised metrics performed better than most of the related studies; however, there is no particular cognitive level of higher-level programming concepts, which could more precisely be predicted among the others.
We examined the capability of presented metrics to predict cognitive performance by investigating:
- (1)
How precisely the devised metrics could predict cognitive performance of learners at higher level concepts?
For ACS, the overall prediction accuracy ranges from 67.9% to 86.40% while it is observed as 74.43% to 89.88% after improvements acquired through MAE2. In the case of ALCS, the overall prediction accuracy was observed between 60.41% to 86.36% which is obtained as 64.81% to 90.86% through MAE2. No significant difference is observed on comparing the overall prediction accuracies obtained through ACS and ALCS. The prediction accuracies in the related studies include ranges of 55% to 81.03% [
6], 70% to 96% [
17], 36% to 67% [
19], and 80% to 85% [
47]. Results presented in the related work and those acquired through ACS and ALCS are comparable where ACS and ALCS showed better prediction accuracies in many cases. This finding encourages to replicate and explore the applicability of the study in the similar scenarios.
- (2)
Are their specific cognitive levels of higher-level concepts that could more precisely be predicted?
No specific cognitive level is identified as the most predictable cognitive level of the target concepts. However, in most of the target concepts, the prediction accuracies at various cognitive level present minute differences, therefore the level depicting maximum accuracy does not reflect any obvious differences among the other levels. The overall ranges of prediction accuracy of all the cognitive levels could thus be considered for performance predictions accuracies of specific higher-level concepts.
6. Limitations
The developed concept map includes those concepts on which we aim to evaluate the framework through cognitive propagation analysis of initial level programming courses. More concepts could be included into the concept map; however, we chose the concepts, identified as common weak concepts, from the data of the previous iterations of the same course. We followed the hierarchical approach of developing concept map, which is based on top-down technique of linking the concepts in which more complexed concepts are placed at higher levels and lesser complexed concepts are placed towards bottom of the concept map. The development process of the concept map includes review cycles conducted by two different reviewers who have been teaching the initial level programming courses at different institutes.
Both descriptive and MCQs types of assessment items were used for assessing students at different levels of cognition. To devise assessment items, the maximum cognitive level up until which course concepts are taught needs to be considered. The developed assessment items were reviewed by two instructors who ranked each assessment item based on its capability of assessing learners on specific level of cognition. The Kappa analysis for inter-rater reliability turned out to be 0.79, which represents a good value to consider the developed assessment items for assessing students at various levels of cognition. However, a better inter-rater correlation value could lead to results with improved precision.
Since a great number of assessment items needed to be developed in order to analyze learners’ cognition at various levels of a number of concepts, we limited the cognitive analysis until the fourth level of cognition as per Bloom’s taxonomy. As solving a programming problem requires applying one or more programming concepts, the assessment items for higher level concepts are prepared in a way that mainly involve the specific sub-concepts in the concept map. The reliability of grading is assessed through Cronbach’s alpha test [
42]. It was performed by randomly picking and re-evaluating 10 assessment items. The value of alpha turned out to be greater than 0.77, which represents an acceptable number [
43].
7. Conclusions and Future Implications
Sustainability of initial level programming courses, in computer science and related study programs, is specifically significant due to the dependencies of subsequent courses on the programming concepts taught in these courses. Most of the learning analytics studies in these courses are anecdotal on the aspect of analyzing learners at various levels of cognition. The main objective of this work was to present a methodical approach for cognitive learning analytics that emphasizes the granularity of analysis to examine learners’ performance in subsequent stages of the courses. In order to address this objective, a cognitive learning analytics framework is proposed to serve as a platform for systematically analyzing the cognitive propagation of learners on various concepts. The framework provides structure to the concepts data and links the related concepts taught at various stages of the course using the technique of concept mapping. It then applies the assessment data, generated by using Bloom’s taxonomy, to the concept map. The resulting structure is used to examine the cognitive propagation of learners on the related concepts. The framework is evaluated, in relation to two instances of OOP course taught at two different institutes, by predicting the cognitive performance of learners on the subsequent higher-level programming concepts. The identified prediction accuracy ranges were better than those presented in most of the related work, which has led to the inference that the study can be replicated for other instances of the programming courses.
The application of framework will be explored by examining more analysis dimensions, which could support instructors, learners, and course evaluators to perform their respective roles in educational systems. The framework could potentially assist instructors to find the commonality of cognitive learning patterns to find different performance classes. This could help instructors in devising the optimized interventions for each performance class of students. The learners might have been interested to find individual cognitive learning gaps that could provide them basis to deal with their personalized learning needs. The course evaluators could be interested to know the extent of cognitive learning that will support in achieving the course and program objectives to specific levels.
This work will further be extended to examine the effectiveness of proposed framework by devising metrics that will cover a larger spectrum of analysis. Based on the proposed framework, an automated solution for cognitive learning analytics will also be developed. A personalized learning and feedback system will be modeled to address the individual learning gaps identified by applying the cognitive analysis techniques. Furthermore, the framework applicability could also be explored in the similar domains.


