Article

Educational Sustainability through Big Data Assimilation to Quantify Academic Procrastination Using Ensemble Classifiers

1
School of Computer Engineering and Science, Shanghai University, Shanghai 200444, China
2
Shanghai Institute of Applied Mathematics and Mechanics, Shanghai University, Shanghai 200444, China
3
School of Communications and Information Engineering, Shanghai University, Shanghai 200444, China
4
Raptor Interactive (Pty) Ltd., Eco Boulevard, Witch Hazel Ave, Centurion 0157, South Africa
5
Department of CS IT, University of Azad Jammu and Kashmir, Muzaffarabad 13100, Pakistan
6
Department of Computer Engineering, Kangwon National University, Samcheok 25806, Korea
*
Author to whom correspondence should be addressed.
Sustainability 2020, 12(15), 6074; https://doi.org/10.3390/su12156074
Submission received: 27 June 2020 / Revised: 20 July 2020 / Accepted: 24 July 2020 / Published: 28 July 2020
(This article belongs to the Special Issue Innovating Learning Analytics for Sustainable Higher Education)

Abstract

:
Ubiquitous online learning is continuing to expand, and the factors affecting success and educational sustainability need to be quantified. Procrastination is one of the compelling characteristics that students observe as a failure to achieve the weaker outcomes. Past studies have mainly assessed the behaviors of procrastination by describing explanatory work. Throughout this research, we concentrate on predictive measures to identify and forecast procrastinator students by using ensemble machine learning models (i.e., Logistic Regression, Decision Tree, Gradient Boosting, and Forest). Our results indicate that the Gradient Boosting autotuned is a predictive champion model of high precision compared to the other default and hyper-parameterized tuned models in the pipeline. The accuracy we enumerated for the VALIDATION partition dataset is 91.77 percent, based on the Kolmogorov–Smirnov statistics. Additionally, our model allows teachers to monitor each procrastinator student who interacts with the web-based e-learning platform and take corrective action on the next day of the class. The earlier prediction of such procrastination behaviors would assist teachers in classifying students before completing the task, homework, or mastery of a skill, which is useful and a path to developing a sustainable atmosphere for education or education for sustainable development.

1. Introduction

Education for Sustainable Development (ESD) aims at promoting and improving the quality of lifelong learning aimed at acquiring sustainability knowledge, skills and values and reorienting academic curricula (rethinking, integrating, reforming, and greening education towards sustainability), thus raising public awareness through a better understanding of the concept of Sustainable Development (SD) [1,2,3,4]. ESD has the potential to develop individuals’ potential by improving their awareness, skills, and ability to act more sustainably [5,6,7]. Educational institutions deliver massive online courses as a recent trend in online education, and it seems a successful learning experience for students. Ubiquitous learning, unlike any location, is easily accessible to the students anywhere [8].
The demand for online courses is speedily growing and becoming a viable feature of the educational system. It is revealed that almost every third student takes the course online while attending their college or university, and this figure has surprisingly increased over the past decades [9].
Notably, the online learning environment needs a higher gradation of self-regulation than the physical classroom environment [10]. It is different from face-to-face learning, where students and teachers collaborate and interact [11]. A time- and place-independent e-learning system [12,13], a self-regulated learning process [14], and an inter-disciplinary approach to teaching and learning are vital factors in ESD [15]. In a virtual learning environment, e-learning depends on the synchronous and asynchronous correspondence and teamwork [16].
While taking an online course, students must track and manage the learning time effectively and keep an eye on progress and learning skills to meet critical deadlines. However, it appears somehow that students can lack mastery of the abilities. For example, when using the Learning Management System (LMS), students use it from home or elsewhere through their laptops, desktop PCs, tablets, or mobile phones [17]. They do all of the things on LMS, including assignments, quizzes, and graded discussion boards (GDBs). LMS can cause students to deviate and disconnect more from the course than they would in a face-to-face setting, or grasp the ability. All this uncertainty can result in procrastination as students refrain from fulfilling their responsibilities on time and wait until the last moment before the given deadline. Identifying students’ learning habits related to time management, and in particular, procrastination, is one of the critical factors for enhancing online learning [18].
Higher education institutions should emphasize the promotion of interdisciplinary thinking and analysis, which is the basis of SD, by teaching the more multifaceted interrelationships between economic, social, and environmental concepts. It is done at the tertiary or university level in many countries, in terms of the principle of SD (development of course curricula within different academic disciplines), but also in terms of the daily routine operations of the institutions (as in the whole school approach) [19]. Curricular development should also be achieved by research on pedagogical methods and their effectiveness in delivering sustainability education and training programs for educators [20].
Procrastination is the propensity to delay the initiation or completion of duties, tasks, or works. To assure the fulfillment of assignments, the learners must resolve that weakness. Therefore, it is most important to identify or predict which learners are at risk of procrastination and the processes by which online learning will affect performance [21].
Schraw and colleagues explain that academic procrastination is the intentional nature of the learner to defer or postpone work that must be completed before time [22]. In the study of Michinov and colleagues, they used the e-learning framework, Modular Object-Oriented Dynamic Learning Environment (Moodle), to calculate the rate of procrastination at the beginning and end of the course. They implemented a web-based questionnaire for all participants, who were asked to fill in the questionnaire after the final evaluation, which explores learners’ changing behaviors. The questionnaire also documented the different details, such as times (when learners had to start or resume working), feeling like giving up or leaving, and feeling motivated or excited about completing their course. This research further found that learners who perform poorly or have less than average results are more likely to procrastinate [21].
In the online course or education, procrastination may also be assessed by evaluating students or learners’ acts or behaviors, such as clicking on lecture videos, attempting GDBs, submitting assignments and quizzes on time, visiting and reading web pages, and constructively looking for and answering questions in discussion forums. A standard method of calculating procrastination is to measure the total time a student is engaging with or communicating with the LMS before a course term. Additionally, studies that take these kinds of measures as a sign of procrastination show that the symbols have a negative association with course results [23,24,25].
The research of Kazerouni and colleagues explains that the assessment of learner habits, such as additional growth and procrastination, has a direct relationship with the accuracy of solutions, the completion time of the given work, or the overall amount of time spent working on a solution. They also found that procrastination contributes to lower scores [24].
The author You discussed that the learners who fail to study consistently and in time are characterized by poor academic results, procrastination, and abandonment. These triggers have proven to be persistent problems in online learning, and some approaches need to be developed and explored to keep learners motivated, enthusiastic, supervised, and active in their courses to fulfill the task [25].
LMS mechanically records all the learning activities when the student logs in and traces the self-regulated learning as well. The usage of LMS in institutions is widespread, as it is considered to be the best source for identifying the learners’ presence and academic performance [26]. Moreover, LMS also assists teachers in determining essential insights [27]. It provides instant feedback for the students who are at risk of failure, procrastination, and withdrawal from the course and allows regulating the instructional policies and procedures [28].
Self-supervision deficiency is one of the causes to provoke procrastination in education, and indeed has a higher negative impact on success, usually resulting in backing off or abandonment [29]. Many studies also elaborate on the importance of formal and appropriate learning behaviors in online education [30].
Using two found behaviors linked to academic procrastination in LMS data, the author You examined the damaging impact of procrastination on academic achievement. The study identified the students who failed to stick to the weekly scheduled assignment submission or their delays in the timely submission of the assignment, which are considered the vital signs of academic procrastination. The results of this study showed that chronic and repetitive learning behaviors related to time management and preparation must be taken into account in order to prevent erroneously expected success and achievement of the course [26].
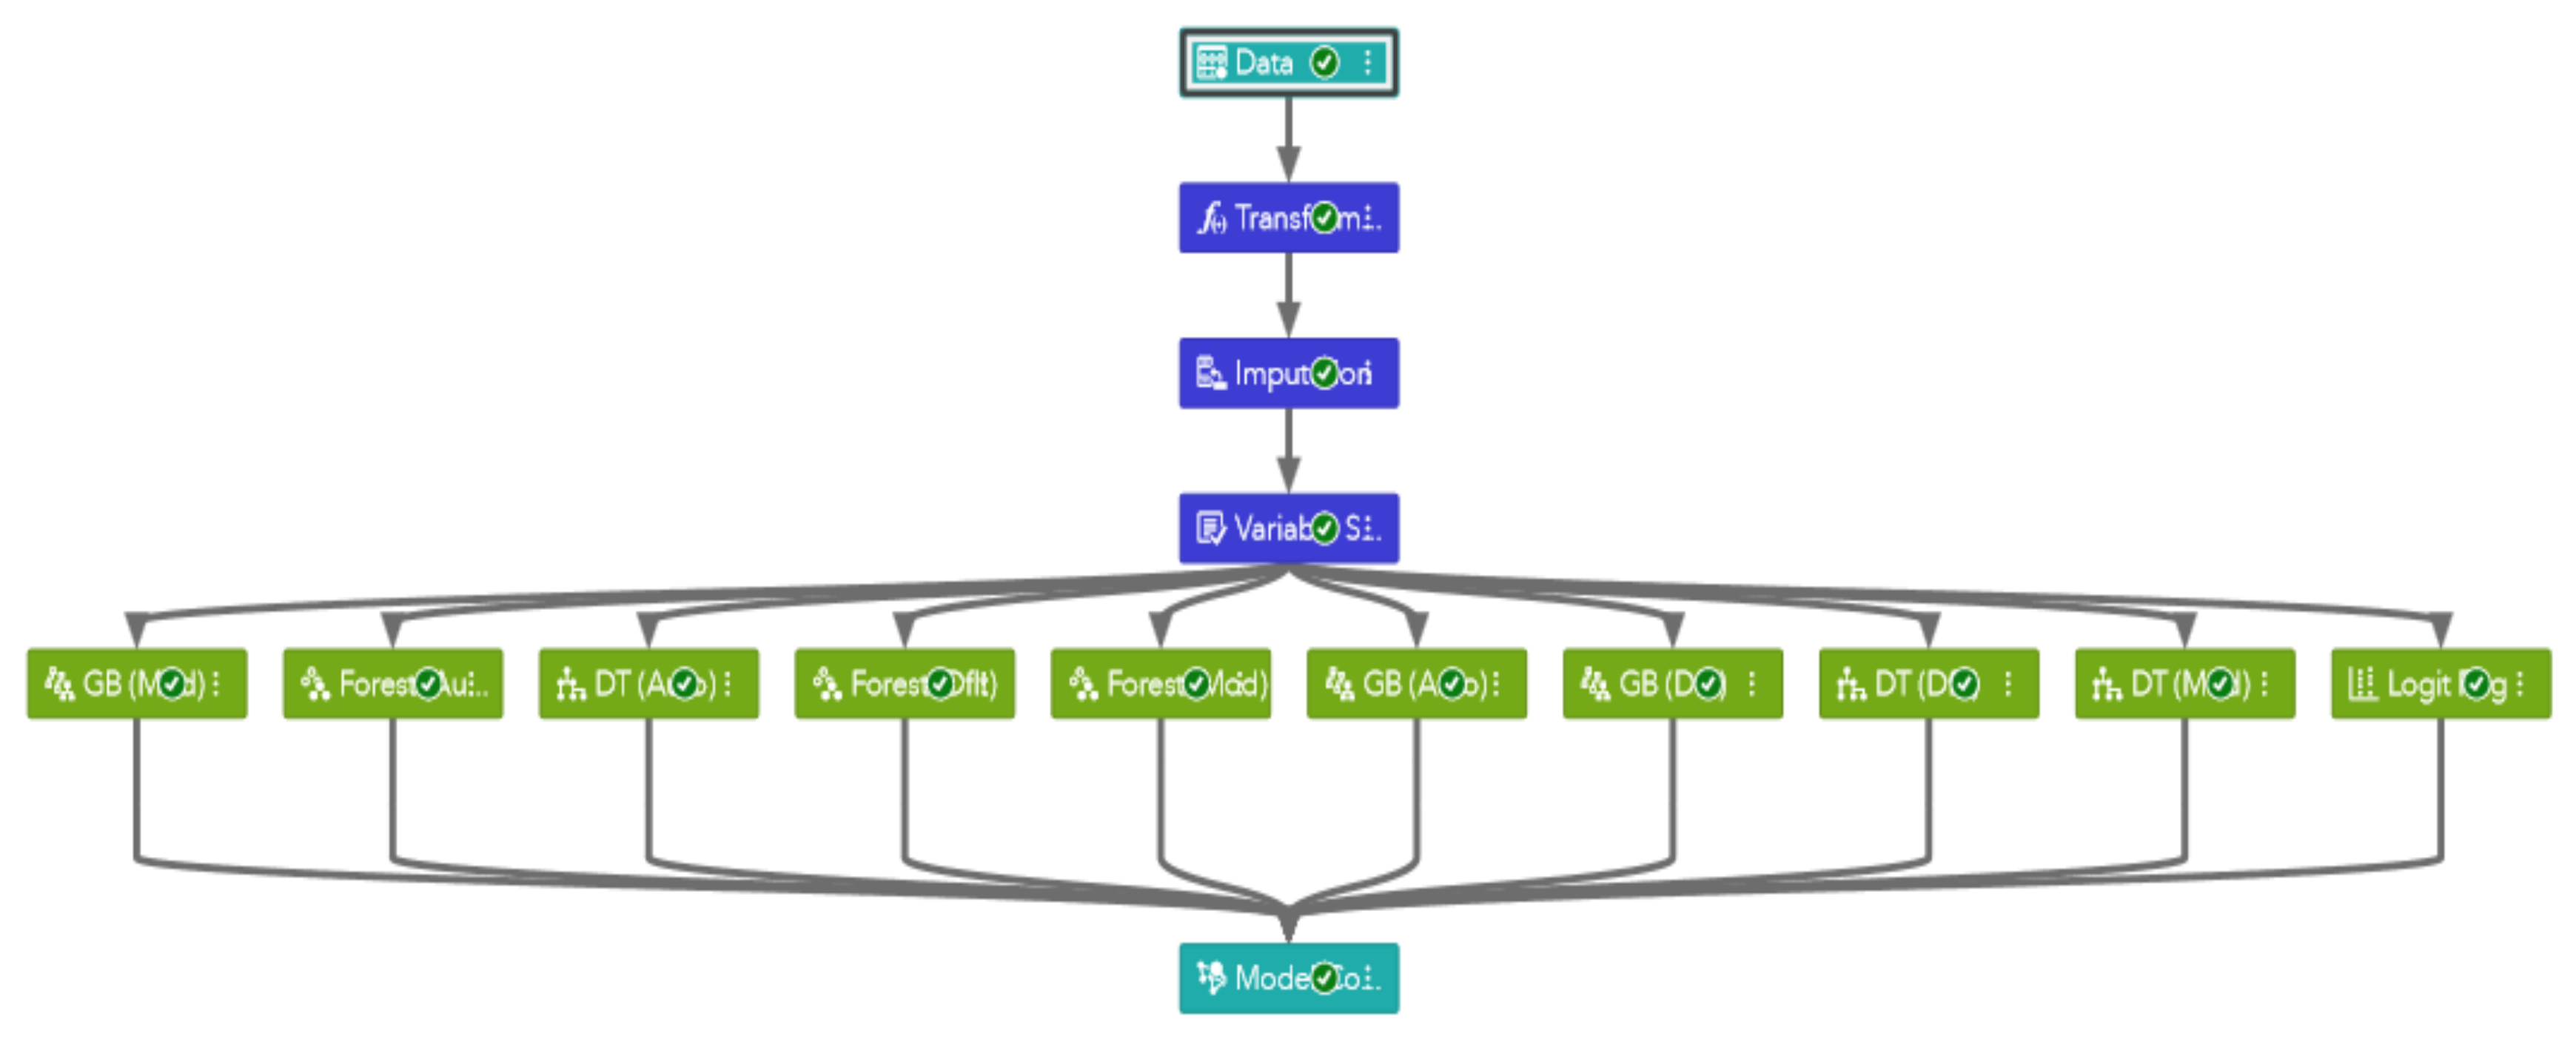
Motivated by the previous studies, we used a data-driven approach and an intelligent tutoring system (ITS), i.e., ASSISTments, to recognize academic procrastination using skill-building data from the highest number of responses to 111 skills from students. In this paper, we discuss the use of machine learning ensemble models for evaluating and predicting students who are procrastinating. To the best of our knowledge, a limited amount of research was performed on a quantitative approach to demystifying procrastinate behavior. Our ensemble models describe the hidden patterns of learning activity in the results, where the trends among the learners are recognized as matching academic procrastinating and non-procrastinating behaviors. Additionally, we detect that students who regularly procrastinate may often show a mixture of mind planning and procrastinating actions during learning. We devise a composite score addressing these subtleties, which incorporates the overall estimate of being considered a procrastinate learner. The approach we build through machine learning allows for a fine-grained study of procrastination and its connection with learning outcomes that can help understand more successful rearrangements of online learning and sustainable reforms in education.
The rest of this article is arranged as follows: Section 2 explains the evaluation of past studies on identifying procrastination among students. In Section 3, relationship explorations and procedures used in this paper are presented. In Section 4, we introduce the experiment and results, along with the proposed methods and modeling to evaluate and analyze the predictive performance through prediction models built. In Section 5, limitations of the study are discussed, and then finally, we leave the reader with discussion, concluding thoughts, and future perspectives in Section 6.

2. Related Works

The research of [25,31] apprises the significant indicators of course success in online learning, such as scheduled planning and management of time. These behaviors exhibit the learners’ interests and attitudes toward online learning. On the other hand, learners who are weak in managing the time and postpone finishing the work until the final deadline reveal substantial evidence of procrastination behaviors, which can indeed lead to poor performance and success [18].
Artino and Jones explored the relationship between emotions and self-regulated learning behavior in the undergraduate online learning course. In this study, the authors highlighted features, such as boredom, dissatisfaction, and enjoyment related to achievement emotions, and considered elaboration and metacognition as self-regulated behavior [11].
Many past studies have focused on identifying the behavior of procrastination, which hampers students from mastering online courses [18,26,31]. The study of Dvorak and Jia compared two groups of students using online analytics data and observed their respective working habits. They found that the group which completed their assignments on time had earned better grades as compared to those who do not complete the work before deadlines [32].
Further, other studies have found similar outcomes; when learners defer their assigned coursework, they are probably performing poorly [25,26]. These findings verify the unsatisfactory description of procrastination as well as highlight the ordinary learning behaviors [18].
Another comprehensive work of Chen and colleagues has shown that students from depreciated backgrounds, such as those who come from below-average income households, or who are attending college or universities for the first time, are most likely to leave or surrender Science, Technology, Engineering, and Mathematics (STEM) degrees or majors [33].
Styck highlighted the problems which are intensifying in online learning. Many essential aspects that describe the matters related to students who are coming from diminished environments or cultures hinder the students’ achievement and success. Such negative factors include monetary matters, shortage of counseling, and a sense of segregation [34]. Prior work has also shown the rapidly increasing trend that underrepresented groups are more likely to engage in procrastination than their counterparts. They determined the characteristics of habitual procrastinators from a global sample based on various demographic variables [35].
Park and colleagues in their study measured the procrastination by using interviews and questionnaires. Their ultimate aim was to explore the association and connection of students’ cultural upbringing and different states of procrastination on an individual basis. They looked at time management attitudes, particularly for those students who enroll in online learning courses [18].
In an online learning environment, measuring the procrastination is very candid and identical. Most commonly, researchers calculate the finishing time of a task and determine the differences between the free time [36] and the deadline of the particular task [23,24].
Table 1 represents the past research in chronological order and highlights the methods used to demystify self-regulating learning behavior and procrastination among the learners in online courses.

3. Relationship Exploration and Procedures

3.1. Participants and Context

The data used in this study collected from ASSISTments, an ITS (https://new.assistments.org/), developed by Worcester Polytechnic Institute (WPI), USA. It provides an e-learning platform and free feedback assistance to students and assessment data to educators. Students use it for completing their homework and classwork more effectively, and teachers have precise reports about the progress of students attempting their homework assignments with them before their class on the following day [40].
The number of registered students who use ASSISTments for their schoolwork and master the skill by using the instant feedback facility provided exceed 50,000. Students use it for various subjects such as Mathematics, Science, English, and Statistics. We focused on students from the Mathematics subject and classified the procrastinating students from the features extracted from the ASSISTments.

3.2. Data Collection and Measurement of Predictors

The data we have focused on in the current study were collected from 2009–2010 ASSISTments skill-builder data [41]. Initially, the dataset comprised of the total record of 401,756 Users, five answer types such as algebra, choose_1, choose_n, fill_in_1, and open_response, and 75 School IDs. Table 2 demonstrates the related predictor variables. Name of predictor shows the short name of the predictor with a self-explanatory description in the Description column, the number of instances means that how many times a student interacts with ITS, and values shows the minimum and maximum values each predictor has, which we selected in assisting and classifying the procrastinator among the students attempting algebra mathematics homework.

3.3. Data Preprocessing and Selection of Predictors

In machine learning, data standardization, cleansing, proper structuring, and removing missingness are collectively called preprocessing. It should be well performed to become the backbone for machine learning analysis [42]. We used MS Excel 2016 and SAS Viya for Learners analytics software (https://www.sas.com/en_us/software/viya-for-learners.html). We availed the cutting-edge hi-tech SAS Visual Data Mining and Machine Learning (DMML) environment via Model Studio to prepare and transform the desired data for the experiment.
Finally, after removing the noise such as duplication, missingness, skewness, and replacing incorrect values from the study sample data, we are left with a total of 4094 unique records of students, selected answer type is algebra, and retrieved the data of 71 school’s students.
Afterward, in order to assure the parsimony of the machine learning models, we used the SAS Visual DMML variable selection node to select the best features based on Statistical techniques to achieve high accuracy of learning models. Table 3 shows the most preferred predictors used in our study.

3.4. Feature Extraction and Label (Response or Target Variable) Collection

For selecting the predicted variable (Label), we used feature extraction by selecting variables from the initial predictors shown in Table 2. We combined them to form a new predicted variable, “Procrastination Rating,” which discloses and predicts the procrastinator students. The Label variable has two levels “0” and “1”, where “0” reveals non-procrastination, and “1” shows procrastination, respectively. Following logic fulfills the condition for categorizing the procrastinator student.
If (OR (FSTRSPTME Total average (FSTRSPTME) AND (HNTCNTASKHLPPROB) Total average (HNTCNTASKHLPPROB) AND (FSTACTSCAF) Total average (FSTACTSCAF)) then (Procrastination) else (Non-procrastination).

3.5. Investigation of Predictors’ Selection for Machine Learning Models

There are various statistical techniques and criteria available for feature selection, such as Backward Elimination, Forward Selection, Akaike Information Criterion (AIC), Bayesian Information Criterion (BIC), Deviance Information Criterion (DIC), Bayes Factor, and Mallow’s CP [40,43]. In this research, we have used the SAS Visual DMML built-in variable selection node, which has plenty of statistical and machine learning criteria available for the robust selection. Varying combinations of existing criteria such as (Unsupervised Selection, Fast Supervised Selection, Linear Regression Selection, Decision Tree Selection, Forest Selection, and Gradient Boosting Selection) are accessible [42]. We kept the combination criteria at “Selected by at least 1,” which assures that any input selected by at least one of the selection criteria chosen is passed on to subsequent nodes as inputs. Table 3 delineates the predictors verified by two criteria (Fast Supervised, and Linear Regression Selection), which has two values (i.e., Rejected and Input), if both criteria have rejected the predictor then the output will be rejected, if both have input value then the output role will be accepted, and if either of the value is rejected or input then the final output will be accepted due to the “Selected by at least 1” property in SAS Visual DMML.
Whereas, in Appendix A, Table A1, Table A2 and Table A3 precisely explain the proportion of variance using the “VARREDUCE” procedure in SAS Visual DMML on SAS Viya. It performs both supervised and unsupervised feature selection using criteria, such as AIC, AICC (the version of AIC), and BIC. In unsupervised learning, the procedure performs feature selection by classifying a set of features that mutually explain the maximum amount of variability in the data—opposed to Principal Component Analysis (PCA), which uses feature extraction (generates new features by reducing the dimensionality). The VARREDUCE reduces dimensionality by the forward selection of the features that explain the overall data variance the best and use the subset of the original features. This technique is valuable where retaining the original features is essential, and for model interpretation and exploration [44].
On the other hand, supervised feature selection also identifies a set of features that jointly describe the maximum amount of variance contained in the response (predicted) variable. The procedure supports feature selection in both the regression setting and the classification (categorization) setting. It also reduces the dimensionality by the forward selection, and the outcome lists the features in order of their contribution to explaining the response or target variance. This output can be used directly to build models utilizing these features. Moreover, it analyses the variance in the same way as Linear Discriminant Analysis (LDA) does. For selecting the features from linear regression selection, SAS Viya used the REGSELECT procedure to highlight the best features for becoming the ingredient of machine learning models. It has numerous features, such as supporting multiple parameterizations for classification variables, care hierarchy among variables, assistance to the partition of a data into training, validation, and testing. Testing provides multiple selection methods, delivers variable selection based on a variety of selection criterion, and provides stopping rules based on model evaluation criteria. Finally, it produces output that contains predicted values, residuals, and confidence limits [44].
Table 4 and Table 5 show the regression output and parameter estimates of selected effects (variables) through the linear regression selection criterion. Stepwise selection stops when adding or removing an effect does not improve the Schwarz Bayesian Criterion (SBC). The model at step 6 is selected where SBC is −5713.15351.

3.6. Relationship Prediction

Adequately determining the predictors and label (response variable), we articulate the relationship prediction task as a logistic regression analysis as a base model. We use the collected label to experiment on the effects of using ensemble models. In the end, we choose the champion predictive model to classify procrastinator students.

4. Experiment and Results

4.1. Building Ensemble Machine Learning Models

Machine learning algorithms operate on statistical principles, but before applying machine learning methods to data, it is better to perform statistical tests and models. In this study, we have used Logistic Regression (Logit Reg) as a base model and then employed ensemble machine learning models, i.e., Decision Tree (DT), Gradient Boosting (GB), and Forest and its variants, i.e., regularization, and tuning of hyper-parameters settings. We then performed models’ comparisons with the base model as well as within the ensemble models to build and identify an ideal model for predicting the procrastination among the students using the ITS e-learning platform. Our study focuses on supervised learning techniques as a response or predicted variable output is known. SAS Viya is the latest high-tech software for the comprehensive set of built-in environments, modules, and functionalities for computational, data mining, and machine learning. So, we used SAS Visual DMML to execute the described machine learning models and tested them.
The following are the reasons for choosing the tree ensemble models [42]:
  • Supervised learning classifiers;
  • best for Mid-size to large datasets;
  • provides moderate interpretability;
  • allows autotuning of parameters;
  • handles the interval, binary, and nominal target;
  • useful in modeling nonlinear and nonlinear separable phenomena in large datasets;
  • interactions considered automatically but implicitly;
  • capable of handling the missing values and outliers in input variables automatically;
  • tree ensembles can increase prediction accuracy and decrease overfitting, but also decrease scalability and interpretability.

4.2. Training and Evaluation of Ensemble Machine Learning Models

After building a project in the SAS Viya model studio, we set the data partitioning ratio with a stratified method into (70:30) and then trained the learning classifiers. We effectively taught machine learning algorithms to curtail the disparity between real and expected values before predicting the procrastinator students attempting and acquiring mastery skills communicating with ITS. The flow chart of the methods we used in our research to predict procrastination among the students is also shown in Figure 1.
An integral aspect of applying machine learning strategies is model evaluation or assessment. When a machine is trained on known data, then we evaluate the model on the unseen data to verify that the model is sufficiently good, learned, and correctly classified. We also selected the best and champion model based on validation data using the Kolmogorov–Smirnov (KS) statistic as selection criteria class and Averaged Squared Error (ASE) as selection criteria interval properties.

4.3. Results and Analysis

4.3.1. Logistic Regression (Logit Reg) Model

As our predicted variable is dichotomous, thus we started with Logit Reg as a base model, as it is commonly used for nominal and binary targets. It also deals with multicollinearity and overfitting issues through regularization term and suitable for small to large datasets with high interpretability. Table 6 is the output of the Logit Reg model, which shows the selection of predictors stops when it reaches the optimal level, i.e., the local minimum, which is 798.6346 in this case. Thus, the first six variables in Table 6 has selected by this model, and Table 7 shows the parameter estimates of these selected six variables. Finally, Table 8 shows the Fit statistics summary of the logit model, which shows the details of the train and validate data set, as we have split the data into the train (70%) and validate (30%), also shown in Figure 1. Hence, based on KS value, Logit Reg is considered to be a good model.

4.3.2. Tree Ensembles (DT Model and its Variants)

DTs were typically developed to make decisions for a categorical target and provide estimates such as probabilities for categorical targets and numeric predictions for interval targets [42]. We have applied five variants of DT in our study using default settings, modified, recursive partitioning, pruning parameters, and autotuned, shown in Table 9. In the default settings, we kept all properties at their default and ran the SAS DT node. Then we modified the tree structure parameters, recursive partitioning parameters, and pruning parameters, and also built a DT model using Autotuned and compared the performance with trees already in the pipeline. Table 10 discloses that the DT Autotuned tree model is considered a robust model among all variants of DT based on ASE decreased (0.0628), and KS value (0.8158) increased on the validation data. The validation data set is referred to as a separate portion of the same data set from which the training set is derived. Validation data accuracy assures and endorses that the model is robust and useful for making predictions on the unseen data.

4.3.3. Tree Ensembles (GB Model and Its Variants)

Further, we tested our experiment by using GB and its variants, such as default settings, modified the parameters, autotuned settings shown in Table 11, and observed the performance by noticing ASE and KS value comparing within the variants of GB. Thus, GB Autotuned is considered as being the best model shown in Table 12. GB is an improvement in boosting that can be applied to any target. This algorithm is related to boosting, apart from that at each iteration; the target is the residual from the previous DT model [45]. The base of GB is DT in SAS Visual DMML. SAS Visual DMML creates a series of trees, which form a single model. A tree in the series fits the residuals of the prediction from the previous trees in the series. Each time that the data are used to grow a tree, the correctness of the tree is computed, and the following samples adjust prior inaccuracies. Each succeeding sample is weighted per the accuracy of the previous models [42].

4.3.4. Tree Ensembles (Forest Model and Its Variants)

A Forest is an ensemble of DTs, and each one can predict its response to a set of input variables. The results from the individual trees are combined to provide the final prediction. For a categorical target, the Forest model’s prediction is either the most popular class (as determined by a vote) or the average of the posterior probabilities of the individual trees [42]. Table 13 precisely explains the modified hyper-parameterized list. Moreover, in this experiment, we have observed that there is a slight decrease in the Forest autotuned model, and the modified Forest model has a higher value of KS (0.8781) compared to other Forest models in the pipeline shown in Table 14. Although tuning the hyperparameter gives a significant influence on the accuracy of the predictive model. However, there is no guarantee that the tuned hyperparameter or SAS autotuned option will arrive at the best model.

4.3.5. Models’ Comparison

Finally, we performed ensemble machine learning and compared learning models within the tree-based pipeline through model comparison node in SAS Visual DMML, the pictorial view shown in Figure 2, and used the property settings shown in Table 15. We also included the autotuned models in our comparison.
Furthermore, Figure 3 and Figure 4 cumulatively display train and validate data of each learning classifier, which shows the trend of how the validate data outperforms over the trained model. Thus, Table 16 and Table 17 present only the output according to the validation data because model validation is carried out after model training, which authenticates the robustness of the model and determines that the models are not overfitting the data. Thus, we presented the validation data in our tables to select the best predictive model. The Lift reports plot based on Cumulative % Response, % Captured Response, Cumulative % Captured Response, Cumulative Lift, Gain, and Lift is shown in Table 16. Moreover, the cumulative lift plot based on the % Response shown in Figure 3, the Receiver Operating Characteristic (ROC) plot is based on accuracy shown in Figure 4 of all the ensemble models, and Table 17 shows the ROC Reports plot based on the F1 Score and ROC.
Table 18 succinctly explains how each model in the pipeline performs on the data partitions defined in the settings (TRAIN, VALIDATE, and TEST) for a series of fit statistics used in this study, and highlight the champion model based on increased KS value and decreased ASE on the VALIDATION data. The autotuned model is the proprietary of SAS Visual DMML; it offers an automated option for hyperparameter optimization. This elegant feature prevents time-wasting of selecting hyperparameters manually (for example, based on experience, hit, trial and error, and heuristics). Generally speaking, autotuning searches for the best combination of hyperparameters specific to each modeling algorithm. Thus, autotuning in SAS saves lots of time and provides a base and starting place to explore more and improve the learning models. We also tested our experiment without using the autotuning model, and the results are shown in Table 19.

5. Limitations of the Study

Like many studies, the present research has some deficiencies related to theory and methodology, which may reduce its scope. The first shortcoming is that we have focused on the limited number of features, as there are so many attributes available (such as postponement of a task, level of interaction and participation, and time spent viewing practice videos), which could be taken into consideration. The second limitation is that by taking the autotuned model, which involves building models based on the selected hyperparameter values. Nevertheless, there is no surety that the autotuned model will arrive at the best model. However, it provides the right starting place to use further domain knowledge and expertise in improving the model.
Furthermore, in this research, we did not track the mental and physical health problems among the students that may be one of the reasons for procrastination of the assigned work. Nevertheless, it is a complete study, since in case of learning and attempting to solve the assigned task through a web-based tutoring system, the past medical record can also be considered as one of the predictors to evaluate and quantify the procrastinator students. Accumulation of these features in the data may enhance the correctness and accuracy of the prediction.

6. Discussion, Conclusions, and Perspectives

As far as the ESD perspective is concerned, the method used in this study assists teachers to pinpoint which student has procrastination behavior or has a risk of being a procrastinator. Teachers can provide attention to particular skills and counseling to those students in class the next day to avoid procrastination. Thus, the early prediction of procrastinating behavior could aid in preserving educational sustainability, as sustainable green education prioritizes the present needs rather than future needs. Online education using Massive Open Online Courses (MOOCs), and Intelligent Tutoring System (ITS) all devote to sustainable educational development. Advancement is based on the fulfillment of present-day prerequisites without negotiating future desires. Moreover, the prime objective of ESD is to balance the environmental, economic, and societal demands [40,46].
The evolution of ESD in higher education could be seen in numerous dimensions: (1) Sustainability in policy, planning, administration, and control, (2) courses and curricula, (3) research, (4) campus operation, (5) evaluation and reporting [15,47]. Several universities are already actively motivated to incorporate ESD into their educational activities. Such programs are directed towards: (i) Positive student learning outcomes; (ii) curricula and evaluation methods; (iii) elimination of barriers; (iv) changing teaching paradigms; (v) improvement of social skills; (vi) communication skills and community relations; and (viii) expansion of their participation in local and national projects (see this section for several examples of such projects) [48]. “One reason behind the latest initiatives is the UN Decade on Sustainable Development Education (DESD, 2005e2014),” undertaken by UNESCO, which aims to combine concepts, values, and practices for sustainability [49].
Sustainability competencies are, therefore, linked to the acquisition of knowledge, skills, and attitudes that allow excellent task performance and problem-solving concerning real-world sustainability issues, challenges, and opportunities [50,51,52]. ESD must, therefore, translate these competencies into an educational perspective, so that they can contribute fully to SD and sustainability [52,53,54,55].
According to the ‘The Brundtland Commission Report’, sustainable development (SD) in education is an integrative approach that covers the connected environmental, societal, and economic facet of the formal and informal educational curriculum. Thus, this educational approach can help students to grow their tendency, knowledge, know-how, and practical understanding to show a compelling role in eco-friendly SD for education and become a liable representative of society. Further, sharing teaching and learning approaches are also required to boost and strengthen learners to revamp their performances and take remedial actions for a sustainable educational environment. Analytical and lateral thinking, visualizing the future, and the respective decision making are the capabilities that ESD promotes [56].
Although limited in scope, the present research can lead to many meaningful educational, methodological, and practical inferences. Firstly, to the best of our knowledge and information, our research, amongst the previous studies for investigating procrastination and its behavior by using machine learning techniques for educational sustainability or ESD, is one of the rare studies that has focused on these perspectives.

6.1. Conclusions

This study introduces a data-driven methodology for predicting student procrastination in web-based online homework using an Intelligent Tutoring System (i.e., ASSISTments). The study identifies some unique patterns inside the big data, as well as makes some essential findings for academia. We suggest that (1) by attempting homework activity on ITS, students undertake various actions that could be further employed to measure procrastination. (2) Early prediction of student procrastination can help the development of an environmentally friendly and sustainable educational context while fulfilling social responsibility. By using machine learning models, we have quantified the procrastinator students. We have used the Kolmogorov–Smirnov (KS) statistic property as our selection criteria class and recorded the KS value.
Additionally, we considered the other measurement metric, such as Average Squared Error (ASE), along with KS statistics. The result suggests that based on the KS and ASE values (i.e., 91.77%, and 2.79%), respectively, GB autotuned model is considered to be the best and most ideal model for deployment that significantly outperformed as compared to the other classifiers in the pipeline due to the increasing KS and decreasing ASE values; the higher value of KS is considered excellent. We have also tested the ensemble classifiers without using the autotuned model, and we found that the GB default model is considered best to classify procrastinator students. It gives KS value 90.74% and ASE of 3.66%, which is slightly higher than the GB modified classifier.

6.2. Future Perspectives

We will focus future research on comprehensive health problems such as (smoking addiction, Influenza, congenital cataract, emotions (frustration and boredom), and behavior) and determining the well-being of students who engage in the online tutoring system to complete their homework or assignments. Poor health in teenagers and adolescents may be one of the reasons for procrastinating the assigned job. In Vietnam [57], a cross-sectional study gathering the participants from ten groups from high schools and universities also revealed the potential adverse impacts of risky online interactions and the harmful effects of Shisha smoking.

Author Contributions

Conceptualization, S.M.R.A. and S.A.H.; methodology, S.M.R.A.; software, S.M.R.A. and S.A.H.; validation, S.M.R.A., S.A.H., R.R., S.S.R. and S.J.K.; formal analysis, S.M.R.A.; investigation, S.S.R.; resources, S.S.R., S.J.K. and W.Z.; writing—Original draft preparation, S.M.R.A. and S.A.H.; writing—Review and editing, R.R., S.S.R. and S.J.K.; visualization, S.M.R.A. and S.A.H.; supervision, W.Z., S.S.R. and S.J.K.; funding acquisition, S.S.R., S.J.K., H.D. and W.Z. All authors have read and agreed to the published version of the manuscript.

Funding

The effort of this research supported by the “Basic Science Research through the National Research Foundation of Republic of Korea (NRF) funded by the Ministry of Education under grant NRF-2017R1D1A3B04031440,” “National Natural Science Foundation of China, grant number 61873156,” “The National Key RD Program of China, grant number 2017YFB0701501,” and “Program of Shanghai Municipal Education Commission (No. 2019-01-07-00-09-E00018).”

Conflicts of Interest

The authors declare no conflicts of interest.

Appendix A

Table A1. Unsupervised feature selection summary (The VARREDUCE Procedure).
Number of Observations Read: 2867 (70% Training Data)
Number of Observations Used: 2867 (70% Training Data)
ParameterProportion of Variance ExplainedSSEMSEAICAICCBIC
Asscount0.4656418.5497500.0029832.24007717.2406392.148679
Fstacthnt0.5890136.5757980.0022951.97617615.9767291.888950
optntyorgmain0.6720035.2479540.0018321.74852514.7490661.666169
orgmainscf0.7515863.9746310.0013881.46782913.4683531.391039
overlaptime0.8168632.9301950.0010241.15947812.1599811.088953
Hnttotl0.8749992.0000180.000699060.77338010.7738580.709817
corrfstatmpt0.9193911.2897360.000450960.3297789.3302270.273875
Nobtmhnt0.9470370.8474060.00029640−0.0958167.904600−0.143361
Optntyorgscaf0.9669520.5287630.00018501−0.5737356.426644−0.612225
Btmhnt0.9773050.3631210.00012710−0.9565135.043824−0.985250
totskilltkn0.9861260.2219830.00007773−1.4563233.543968−1.474610
atmptcntsum0.9914330.1370750.00004801−1.9467652.053476−1.953904
noansgvn0.9956330.0698640.00002448−2.6298090.370378−2.625102
fstactatmpt0.9983280.0267469.374797 × 10−6−3.599734−1.599605−3.582484
btmhntscaf0.9993780.0099523.489423 × 10−6−4.598837−3.598770−4.568347
Optnty1.00000000−lnfty−lnfty−lnfty
SSE: Sum of Squared Error, MSE: Mean Squared Error.
Table A2. Fast supervised feature selection summary (The VARREDUCE Procedure).
Number of Observations Read: 2867 (70% Training Data)
Number of Observations Used: 2866 (70% Training Data)
ParameterProportion of Variance ExplainedSSEMSEAICAICCBIC
Noansgvn0.4742180.5257820.00018352−0.6393791.360625−0.640091
Fstacthnt0.6278160.3721840.00012995−0.9834831.016525−0.982813
optntyorgscaf0.6479970.3520030.00012295−1.0378350.962178−1.035782
btmhntscaf0.6507900.3492100.00012202−1.0444060.955612−1.040972
Asscount0.6581070.3418930.00011950−1.0641840.935841−1.059368
Btmhnt0.6599820.3400180.00011889−1.0682890.931744−1.062091
overlaptime0.6614720.3385280.00011841−1.0712850.928757−1.063705
Hnttotl0.6621020.3378980.00011823−1.0717530.928298−1.062791
SSE: Sum of Squared Error, MSE: Mean Squared Error.
Table A3. Linear regression feature selection detail (The REGSELECT Procedure).
Selection Criteria:SBCNo. of Observations Read:2867
Selection Method:StepwiseNo. of Observations Used:2866
Number of Effects:17No. of Observations Used for Training:2029
Number of Parameters:17No. of Observations Used for Validation:837
StepVariable EnteredNumber Variables InSBC
0Intercept1−3485.5671
1noansgvn2−4824.7821
2Fstacthnt3−5589.5762
3optntyorgscaf4−5703.2245
4corrfstatmpt5−5706.3205
5overlaptime6−5712.0423
6Hnttotl7−5713.1535 *
*: Optimal value of the criterion, SBC: Schwarz Bayesian criterion.

References

  1. Lozano, R. Incorporation and institutionalization of SD into universities: Breaking through barriers to change. J. Clean. Prod. 2006, 14, 787–796. [Google Scholar] [CrossRef]
  2. Læssøe, J.; Schnack, K.; Breiting, S.; Rolls, S. Climate change and sustainable development: The response from education. Int. Alliance Lead. Educ. Inst. 2009, 33, 257–258. [Google Scholar] [CrossRef]
  3. Wals, A.E.J. Review of Contexts and Structures forEducation for Sustainable Development 2009. Unesco 2009. [Google Scholar] [CrossRef]
  4. Azeiteiro, U.M.; Bacelar-Nicolau, P.; Caetano, F.J.P.; Caeiro, S. Education for sustainable development through e-learning in higher education: Experiences from Portugal. J. Clean. Prod. 2015, 106, 308–319. [Google Scholar] [CrossRef]
  5. Nousheen, A.; Yousuf Zai, S.A.; Waseem, M.; Khan, S.A. Education for sustainable development (ESD): Effects of sustainability education on pre-service teachers’ attitude towards sustainable development (SD). J. Clean. Prod. 2020, 250, 119537. [Google Scholar] [CrossRef]
  6. Longhurst, J.; Bellingham, L.; Cotton, D.; Isaac, V.; Kemp, S.; Martin, S.; Peters, C.; Robertson, A.; Ryan, A.; Taylor, C.; et al. Education for Sustainable Development: Guidance for UK Higher Education Providers; Centre for Environmental Science: New Delhi, India, 2014. [Google Scholar]
  7. Merritt, E.; Hale, A.; Archambault, L. Changes in Pre-Service Teachers’ Values, Sense of Agency, Motivation and Consumption Practices: A Case Study of an Education for Sustainability Course. Sustainability 2019, 11, 155. [Google Scholar] [CrossRef] [Green Version]
  8. Bettinger, E.P.; Fox, L.; Loeb, S.; Taylor, E.S. Virtual classrooms: How online college courses affect student success. Am. Econ. Rev. 2017, 107, 2855–2875. [Google Scholar] [CrossRef] [Green Version]
  9. Allen, I.E.; Seaman, J. Changing Course: Ten Years of Tracking Online Education in the United States; ERIC: Kern County, CA, USA, 2013; Volume 26, ISBN 978-0-9840-2883-2.
  10. Broadbent, J.; Poon, W.L. Self-regulated learning strategies and academic achievement in online higher education learning environments: A systematic review. Internet High. Educ. 2015, 27, 1–13. [Google Scholar] [CrossRef]
  11. Artino, A.R.; Jones, K.D. Exploring the complex relations between achievement emotions and self-regulated learning behaviors in online learning. Internet High. Educ. 2012, 15, 170–175. [Google Scholar] [CrossRef]
  12. Lee, J.K.; Lee, W.K. The relationship of e-Learner’s self-regulatory efficacy and perception of e-Learning environmental quality. Comput. Hum. Behav. 2008, 24, 32–47. [Google Scholar] [CrossRef]
  13. Garrison, R. Theoretical challenges for distance education in the 21st century: A shift from structural to transactional issues. Int. Rev. Res. Open Distance Learn. 2000, 1, 6–21. [Google Scholar] [CrossRef]
  14. Narciss, S.; Proske, A.; Koerndle, H. Promoting self-regulated learning in web-based learning environments. Comput. Hum. Behav. 2007, 23, 1126–1144. [Google Scholar] [CrossRef]
  15. Lozano, R.; Lukman, R.; Lozano, F.J.; Huisingh, D.; Lambrechts, W. Declarations for sustainability in higher education: Becoming better leaders, through addressing the university system. J. Clean. Prod. 2013, 48, 10–19. [Google Scholar] [CrossRef]
  16. Ku, D.T.; Chang, C.S. The effect of academic discipline and gender difference on Taiwanese college students’ learning styles and strategies in web-based learning environments. Turk. Online J. Educ. Technol. 2011, 10, 265–272. [Google Scholar]
  17. Zimmerman, B.J. Self-Regulated Learning and Academic Achievement: An Overview. Educ. Psychol. 1990, 25, 3–17. [Google Scholar] [CrossRef]
  18. Park, J.; Yu, R.; Rodriguez, F.; Baker, R.; Smyth, P.; Warschauer, M. Understanding Student Procrastination via Mixture Models. In Proceedings of the 11th International Conference on Educational Data Mining, Buffalo, NY, USA, 15–18 July 2018; pp. 187–197. [Google Scholar]
  19. Zervakis, P.; Wahlers, M. “Education for Sustainable Development” and the Bologna Process: The Implementation of the Bologna Process in Germany. BNE J. 2007, 5, 1–5. [Google Scholar]
  20. Lozano, R.; Young, W. Assessing sustainability in university curricula: Exploring the influence of student numbers and course credits. J. Clean. Prod. 2013, 49, 134–141. [Google Scholar] [CrossRef]
  21. Michinov, N.; Brunot, S.; Le Bohec, O.; Juhel, J.; Delaval, M. Procrastination, participation, and performance in online learning environments. Comput. Educ. 2011, 56, 243–252. [Google Scholar] [CrossRef]
  22. Schraw, G.; Wadkins, T.; Olafson, L. Doing the things we do: A grounded theory of academic procrastination. J. Educ. Psychol. 2007, 99, 12–25. [Google Scholar] [CrossRef]
  23. Hotle, S.L. Applications of Clickstream Information in Estimating Online User Behavior. Ph.D. Thesis, Georgia Institute of Technology, Atlanta, GA, USA, May 2015. [Google Scholar]
  24. Kazerouni, A.M.; Edwards, S.H.; Shaffer, C.O.A. Quantifying incremental development practices and their relationship to procrastination. In Proceedings of the 2017 ACM Conference on International Computing Education Research, Tacoma, WA, USA, 18–20 August 2017; pp. 191–199. [Google Scholar] [CrossRef]
  25. You, J.W. Identifying significant indicators using LMS data to predict course achievement in online learning. Internet High. Educ. 2016, 29, 23–30. [Google Scholar] [CrossRef]
  26. You, J.W. Examining the effect of academic procrastination on achievement using LMS data in e-Learning. Educ. Technol. Soc. 2015, 18, 64–74. [Google Scholar]
  27. Gašević, D.; Dawson, S.; Siemens, G. Let’s not forget: Learning analytics are about learning. Technol. Trends 2015, 59, 64–71. [Google Scholar] [CrossRef]
  28. Dietz-Uhler, B.; Hurn, J.E. Using learning analytics to predict (and improve) student success: A faculty perspective. J. Interact. Online Learn. 2013, 12, 17–26. [Google Scholar]
  29. Klingsieck, K.B.; Fries, S.; Horz, C.; Hofer, M. Procrastination in a distance university setting. Distance Educ. 2012, 33, 295–310. [Google Scholar] [CrossRef]
  30. Jo, I.-H.; Kim, Y. Impact of Learner’s Time Management Strategies on Achievement in an e-learning Environment: A Learning Analytics Approach. J. Educ. Inf. Media 2013, 19, 83–107. [Google Scholar]
  31. Elvers, G.C.; Polzella, D.J.; Graetz, K. Procrastination in Online Courses: Performance and Attitudinal Differences. Teach. Psychol. 2003, 30, 159–162. [Google Scholar] [CrossRef]
  32. Dvorak, T.; Jia, M. Online Work Habits and Academic Performance. J. Learn. Anal. 2016, 3, 318–330. [Google Scholar] [CrossRef] [Green Version]
  33. Chen, X.; Carroll, C.D. First-Generation Students in Postsecondary Education: A Look at Their College Transcripts: Postsecondary Education Descriptive Analysis Report. Natl. Cent. Educ. Stat. 2005, 1–103. [Google Scholar]
  34. Styck, K.M. Best practices for supporting upward economic and social mobility for first-generation college students. Sch. Psychol. 2018, 72, 50–57. [Google Scholar]
  35. Steel, P.; Ferrari, J. Sex, Education and Procrastination: An Epidemiological Study of Procrastinators’ Characteristics from a Global Sample. Eur. J. Pers. 2013, 27, 51–58. [Google Scholar] [CrossRef]
  36. Boroujeni, M.S.; Sharma, K.; Kidziński, Ł.; Lucignano, L.; Dillenbourg, P. How to quantify student’s regularity? Lect. Notes Comput. Sci. (Subser. Lect. Notes Artif. Intell. Lect. Notes Bioinform.) 2016, 9891 LNCS, 277–291. [Google Scholar] [CrossRef] [Green Version]
  37. Tóth, K.; Greiff, S.; Kalergi, C.; Wüstenberg, S. Discovering Students’ Complex Problem Solving Strategies in Educational Assessment. In Proceedings of the 7th International Conference on Educational Data Mining, London, UK, 4–7 July 2014; pp. 225–228. [Google Scholar]
  38. Ng, B.L.L.; Liu, W.C.; Wang, J.C.K. Student Motivation and Learning in Mathematics and Science: A Cluster Analysis. Int. J. Sci. Math. Educ. 2016, 14, 1359–1376. [Google Scholar] [CrossRef]
  39. Cerezo, R.; Esteban, M.; Sánchez-Santillán, M.; Núñez, J.C. Procrastinating behavior in computer-based learning environments to predict performance: A case study in Moodle. Front. Psychol. 2017, 8, 1–11. [Google Scholar] [CrossRef] [PubMed] [Green Version]
  40. Abidi, S.M.R.; Hussain, M.; Xu, Y.; Zhang, W. Prediction of Confusion Attempting Algebra Homework in an Intelligent Tutoring System through Machine Learning Techniques for Educational Sustainable Development. Sustainability 2018. [Google Scholar] [CrossRef] [Green Version]
  41. Heffernan, N. ASSIST Ments Data. Available online: https://sites.google.com/site/assistmentsdata/home/assistment-2009-2010-data/skill-builder-data-2009-2010 (accessed on 2 February 2018).
  42. Jeff, T.; Truxillo, C. Machine Learning Using SAS Viya. Available online: https://www.coursera.org/learn/machine-learning-sas? (accessed on 2 July 2019).
  43. Rundel, M.C. Linear Regression and Modeling. Available online: https://www.coursera.org/learn/linear-regression-model (accessed on 18 June 2018).
  44. SAS Institute. SAS Documentation. Available online: https://documentation.sas.com/?docsetId=procdocsetTarget=n0n5mm9l2pmpevn1lsjqccmgp8tx.htmdocsetVersion=9.4locale=en (accessed on 1 August 2019).
  45. Friedman, J.H. Greedy function approximation: A gradient boosting machine. Ann. Stat. 2001, 29, 1189–1232. [Google Scholar] [CrossRef]
  46. Higher Education Academy. Education for Sustainable Development. Available online: https://www.heacademy.ac.uk/knowledge-hub/education-sustainable-development-0 (accessed on 16 November 2018).
  47. Saadatian, O.; Salleh, E.I.; Tahir, O.M.; Dola, K. Observations of sustainability practices in Malaysian research universities: Highlighting particular strengths. Pertanika J. Soc. Sci. Humanit. 2012, 17, 293–312. [Google Scholar]
  48. Karatzoglou, B. An in-depth literature review of the evolving roles and contributions of universities to Education for Sustainable Development. J. Clean. Prod. 2013, 49, 44–53. [Google Scholar] [CrossRef]
  49. Segalàs, J.; Ferrer-Balas, D.; Svanström, M.; Lundqvist, U.; Mulder, K.F. What has to be learnt for sustainability? A comparison of bachelor engineering education competences at three European universities. Sustain. Sci. 2009, 4, 17–27. [Google Scholar] [CrossRef] [Green Version]
  50. Dale, A.; Newman, L. Sustainable development, education and literacy. Int. J. Sustain. High. Educ. 2005, 6, 351–362. [Google Scholar] [CrossRef]
  51. Rowe, D. Education for a Sustainable Future. Science 2007, 317, 323–324. [Google Scholar] [CrossRef] [PubMed]
  52. Barth, M.; Godemann, J.; Rieckmann, M.; Stoltenberg, U.; Barth, M.; Godemann, J.; Rieckmann, M. Developing key competencies for sustainable development in higher education. Int. J. Sustain. High. Educ. 2007, 8, 416–430. [Google Scholar] [CrossRef] [Green Version]
  53. Mochizuki, Y.; Fadeeva, Z. Competences for sustainable development and sustainability: Significance and challenges for ESD. Int. J. Sustain. High. Educ. 2010, 11, 391–403. [Google Scholar] [CrossRef]
  54. Parker, J. Competencies for interdisciplinarity in higher education. Int. J. Sustain. High. Educ. 2010, 11, 325–338. [Google Scholar] [CrossRef]
  55. Wals, A.E.J. Mirroring, Gestaltswitching and transformative social learning Stepping stones for developing sustainability competence. Int. J. Sustain. High. Educ. 2010, 11, 389–390. [Google Scholar] [CrossRef]
  56. Ortolano, L. The Brundtland Commission Report. Available online: https://www.sustainabledevelopment2015.org/AdvocacyToolkit/index.php/earth-summit-history/past-earth-summits/58-the-brundtland-commission (accessed on 7 June 2019).
  57. Tran, B.X.; Nguyen, L.H.; Vu, G.T.; Le, H.T.; Nguyen, H.D.; Hoang, V.Q.; La, P.V.; Hoang, D.A.; Van Dam, N.; Vuong, T.T.; et al. Online peer influences are associated with receptiveness of youths: The case of Shisha in Vietnam. Child. Youth Serv. Rev. 2019, 99, 18–22. [Google Scholar] [CrossRef]
Figure 1. Flow chart of the proposed methodology.
Sustainability 12 06074 g001
Figure 2. SAS Viya flow chart of machine learning models with a model comparison.
Sustainability 12 06074 g002
Figure 3. Visual understanding of cumulative lift and response percentage.
Sustainability 12 06074 g003
Figure 4. Pictorial view of Accuracy, F1 score, and ROC.
Sustainability 12 06074 g004aSustainability 12 06074 g004b
Table 1. Summary of previous research.
Research TypeAuthorsFeatures FocusedMethods Used
Explanatory[31]Web questionnaire, and exam scoreDescriptive Statistics, Pearson correlations
[21]Discussion forums, and web-based questionnaireDescriptive Statistics, Pearson correlations
[11]Emotions (boredom, frustration, and enjoyment), and self-regulated learning behaviorDescriptive Statistics, Pearson correlations, and Regression analysis
[35]Demographic variables (sex, age, marital status, family size, education, community location, and national origin)Descriptive Statistics, ANOVA, and Multiple regression
[26]Absence of submission, and late submission, Multiple regression analysis
[23]Clickstream data (video views, academic records, grades, and surveys)Descriptive Statistics
[25]Year of study, regular study, login sessions, proof of reading, Late submission, and midterm exam scoreDescriptive Statistics, Pearson correlations, and Hierarchical regression analysis
[32]Work habits (timelines, regularity, and intensity)Probit or Logistic regression
[36]Regularity features (studying hours of day/week, delay in lecture view), and time managementLinear regression modeling
[24]The behavior of students (time of completion of work, and total time spent working on a solution)Descriptive Statistics, Mixed model ANCOVA
[18]Clickstream data and time management scoreProbabilistic mixture model
Predictive[37]Problem-solving behavior, and level of problem-solving proficiencyX-means (Variation of K-means) clustering algorithm
[38]Survey scores of learning questionnaireHierarchical clustering with Ward’s method
[39]Features related to effort and time spent working, such as time theory, time task, time forum, and relevant actionsClass Association Rule (CAR), a data mining technique
Table 2. Self-regulatory proposed features.
Name of PredictorDescriptionNo. of InstancesValues
STD_IDStudent ID40945-digit number
ASSCOUNTAssignment Count4061–1085
ORGMAINSCFOriginal Main/Scaffolding5780.33–1.00
CORRFSTATMPTCorrect 1st Attempt12200.00–1.00
ATMPTCNTSUMAttempt Count Sum5320.00–4011
FSTRSPTMEFirst Response Time40451.18–2514.98
TOTSKILLTKNTotal Skill Taken681–76
HNTCNTASKHLPPROBHint Count (Ask Help During Problem)2680–894
HNTTOTLHint Total (No. of Possible Hints)17360.00–6.00
OVERLAPTIMEOverlap Time40453.14–2523.42
NOANSGVNNo Answer Given1120–315
FSTACTSUMFirst Action Sum1360–434
FSTACTATMPTFirst Action Attempt3730–956
FSTACTHNTFirst Action Hint970–260
FSTACTSCAFFirst Action Scaffolding560–119
NOBTMHNTNo Bottom Hint580–137
BTMHNTBottom Hint1120–274
BTMHNTSCAFBottom Hint Scaffolding3630–933
OPTNTYOpportunity21661.00–1316.80
OPTNTYORGMAINOpportunity Original Main Problem20651.00–1377.63
OPTNTYORGSCAFOpportunity Original Scaffolding830–278
Table 3. Summary of the final selected predictors according to the combination criterion.
Name of Input VariableFast Supervised SelectionLinear Regression SelectionInputRejectedOutput Role
CORRFSTATMPTRejectedInput11Input
HNTTOTLInputInput20Input
ASSCOUNTInputRejected11Input
ATMTCNTSUMRejectedRejected02Rejected
BTMHNTInputRejected11Input
BTMHNTSCAFInputRejected11Input
FSTACTATMPTRejectedRejected02Rejected
FSTACTHNTInputInput20Input
NOANSGVNInputInput20Input
NOBTMHNTRejectedRejected02Rejected
OPTNTYRejectedRejected02Rejected
OPTNTYORGMAINRejectedRejected02Rejected
OPTNTYORGSCAFInputInput20Input
ORGMAINSCFRejectedRejected02Rejected
OVERLAPTIMEInputInput20Input
TOTSKILLTKNRejectedRejected02Rejected
Table 4. Linear regression selection summary (The REGSELECT Procedure).
Root MSE:0.24189AICC:−3721.38932
R-square:0.67385SBC:−5713.15351
Adj R-square:0.67288ASE (Train):0.05831
AIC:−3721.46060ASE (Validate):0.07253
Analysis of Variance (ANOVA)
SourceDFSum of SquaresMean SquareF ValuePr F
Model6244.4280140.73800696.260.0001
Error2022118.306340.05851
Corrected Total2028362.73435
MSE: Mean Squared Error, AIC: Akaike Information Criterion, AICC (Version of AIC), SBC: Schwarz Bayesian Criterion, ASE: Average Squared Error, DF: Degrees of Freedom.
Table 5. Linear regression selection parameter estimates of variables (The REGSELECT Procedure).
ParameterDFEstimateStandard Errort ValuePr ltlVariance Inflation
Intercept1−0.1894390.037716−5.020.00010
fstacthnt1−0.4932230.017289−28.530.000113.70908
noansgvn10.6559970.01647339.820.000114.65309
optntyorgscaf10.0555060.0059139.390.00011.44312
overlaptime10.0291930.0073443.970.00011.04713
corrfstatmpt10.0917330.0233073.940.00011.38060
Hnttotl1−0.0159500.005403−2.950.00321.16500
DF: Degrees of Freedom.
Table 6. Logit Reg model summary.
Selection Criteria:SBCNo. of Observations Read:4095
Selection Method:ForwardNo. of Observations Used:4094
Distribution:BinaryNo. of Observations Used for Training:2866
Link Function:LogitNo. of Observations Used for Validation:1228
StepVariable EnteredNumber Variables InSBC
0Intercept13134.4765
1Noansgvn21783.3284
2Fstacthnt31175.9832
3Overlaptime4827.7871
4Btmnhtscaf5801.5044
5Optntyorgscaf6798.6346 *
6Btmhnt7802.4826
7Asscount8807.5466
8Hnttotl9814.7302
*: Optimal value of criterion (Selection stopped at a local minimum of the Schwarz Bayesian Criterion (SBC)).
Table 7. Parameter estimates of the Logit Reg model.
ParameterDFEstimateStandard ErrorChi-SquarePr ChiSq
Intercept1−13.0660890.956536186.59020.0001
Btmhntscaf10.2742130.08489910.43210.0012
Fstacthnt1−7.9854330.492071263.35530.0001
Noansgvn110.3682090.598322300.28780.0001
Optntyorgscaf10.2890690.0947109.31560.0023
Overlaptime11.1590520.16742047.92810.0001
Table 8. Fit statistics summary of the Logit Reg model.
Data RoleMisclassification RateAverage Squared ErrorKS (Youden)KS Cut-OffArea Under ROC
Train0.04990.03820.86780.250.9795
Validate0.05290.04000.86420.400.9790
ROC: Receiver Operating Characteristic
Table 9. List of tuning hyperparameters settings of the Decision Tree (DT) model.
PropertyDT Model
Default SettingsStructure ParametersRecursive PartitioningPruning ParametersAutotuned
Default ValueModified ValueModified ValueModified ValueModified
Value
Grow Criterion (Class target criterion)Information gain
Ratio
Information gain
ratio
GiniGiniEntropy, CHAID, Information gain ratio, Gini, Chi-square
Interval target criterionVarianceVarianceVarianceVarianceVariance, F test, CHAID
Maximum no. of branches22222
Maximum depth101414141–19
Minimum leaf size51515155
Number of interval bins2010010010020–200
Interval bin methodQuantileQuantileQuantileQuantileQuantile
Subtree methodCost complexityCost complexityCost complexityReduced ErrorCost Complexity
Table 10. Fit statistics of the DT model and its variants.
Data RoleModel NameMisclassification RateAverage Squared ErrorKS (Youden)KS- CutoffArea Under ROC
ValidateDT (Default)0.07740.06580.81180.200.9278
DT (Structure Parameters)0.08630.07010.78940.100.9306
DT (Recursive Partitioning)0.07570.06590.80220.250.9356
DT (Pruning Parameters)0.07330.06520.79880.350.9358
DT (Autotuned)0.07000.06280.81580.100.9394
ROC: Receiver Operating Characteristic.
Table 11. Regularizing and hyperparameters settings of the Gradient Boosting (GB) model.
PropertyGB Model
Default SettingsModified ParametersAutotuned
Default ValueModified ValueModified Value
Number of trees1005020–150
Learning rate0.10.10.01–1
Subsample rate0.50.50.1–1
L1 regularization000–10
L2 regularization110–10
Tree-splitting Options
(Max Depth)
484
Minimum leaf size5155
Number of interval bins5010050
Interval bin methodQuantileQuantileQuantile
Table 12. Fit statistics of the GB model and its variants.
Data RoleModel NameMisclassification RateAverage Squared ErrorKS (Youden)KS- CutoffArea Under ROC
ValidateGB (Default)0.04640.03360.90740.200.9873
GB (Modified Parameters)0.04800.03440.90100.300.9900
GB (Autotuned)0.03830.02790.91770.150.9854
ROC: Receiver Operating Characteristic.
Table 13. Hyperparameter values of Forest model.
PropertyForest Model
Default SettingsModified ParametersAutotuned
Default ValueModified ValueModified Value
Number of trees1005020–150
Class target voting methodProbabilityProbabilityProbability
Tree-splitting Options (Class target criterion)Information gain ratioEntropyInformation gain ratio
Interval target criterionVarianceVarianceVariance
Maximum Depth20121–29
Minimum leaf size5155
Number of interval bins2010020
In-bag sample proportion0.60.60.1–0.9
Number of inputs to consider per split10071–100
Interval bin methodQuantileQuantileQuantile
Table 14. Fit statistics of Forest model and its variants.
Data RoleModel NameMisclassification RateAverage Squared ErrorKS (Youden)KS- CutoffArea Under ROC
ValidateForest (Default)0.06110.04900.84320.300.9803
Forest (Modified Parameters)0.06190.04500.87810.300.9829
Forest (Autotuned)0.06190.04260.87330.200.9834
ROC: Receiver Operating Characteristic.
Table 15. SAS Visual DMML default assessment measures.
Property NameProperty Value
selectionCriteriaClassKolmogorov-Smirnov statistic (KS)
selectionCriteriaIntervalAverage squared error
selectionTableValidate
selectionDepth10
Cutoff0.5
Table 16. Lift reports plot summary.
Data RoleModel Name% Captured ResponseCumulative % Captured ResponseCumulative LiftGainLift
ValidateGB (Auto)21.453342.90664.29073.29074.2907
GB (Dflt)21.453342.90664.29073.29074.2907
GB (Mod)21.453342.90664.29073.29074.2907
Forest (Mod)21.453342.90664.29073.29074.2907
Forest (Auto)21.453342.90664.29073.29074.2907
Logit Reg21.453342.90664.29073.29074.2907
Forest (Dflt)21.107342.56064.25613.25614.2215
DT (Auto)18.565437.00463.70052.70053.7131
DT (Dflt)18.995437.98683.79872.79873.7991
DT (Mod)20.324236.69643.66962.66964.0648
Auto: Autotuned, Dflt: Default, Mod: Modified.
Table 17. ROC reports plot summary.
Data RoleModel NameAccuracyF1 ScoreROC SeparationArea Under ROC
ValidateGB (Auto)0.96170.91800.88770.9854
GB (Dflt)0.95360.89950.85790.9873
GB (Mod)0.95200.89520.84850.9900
Forest (Mod)0.93810.86280.79930.9829
Forest (Auto)0.93810.86180.79450.9834
Logit Reg0.94710.88700.84930.9790
Forest (Dflt)0.93890.86730.81470.9803
DT (Auto)0.93000.84810.79100.9394
DT (Dflt)0.92260.83360.77670.9278
DT (Mod)0.92670.84480.79880.9358
Auto: Autotuned, Dflt: Default, Mod: Modified, ROC: Receiver Operating Characteristic.
Table 18. Fit statistics of ensemble machine learning models with Autotuned.
Data RoleModel NameSum of FrequenciesMisclassification at CutoffRoot Average Squared ErrorGini CoefficientFalse Positive RateMisclassification RateFalse Discovery RateAverage Squared ErrorKS (Youden)
ValidateGB (Auto) *12280.03830.16720.97090.02240.03830.07390.02790.9177
GB (Dflt)12280.04640.18320.97450.02450.04640.08270.03360.9074
GB (Mod)12280.04800.18540.98010.2340.04800.08030.03440.9010
Forest (Mod)12280.06190.21200.96590.02770.06190.09810.04500.8781
Forest (Auto)12280.06190.20630.96680.02560.06190.09200.04260.8733
Logit Reg12280.05290.20000.95800.03300.05290.10840.04000.8642
Forest (Dflt)12280.06110.22140.96070.03300.06110.11230.04900.8432
DT (Auto)12280.07000.25060.87880.03940.07000.13360.06280.8158
DT (Dflt)12280.07740.25640.85560.04690.07740.15600.06580.8118
DT (Mod)12280.07330.25540.87170.04900.07330.15810.06520.7988
*: Champion Model, Auto: Autotuned, Dflt: Default, Mod: Modified.
Table 19. Fit statistics of ensemble machine learning models without Autotuned.
Data RoleModel NameSum of FrequenciesMisclassification at CutoffRoot Average Squared ErrorGini CoefficientFalse Positive RateMisclassification RateFalse Discovery RateAverage Squared ErrorKS (Youden)
ValidateGB (Dflt) *12280.04640.18320.97450.02450.04640.08270.03360.9074
GB (Mod)12280.04800.18540.98010.02340.04800.08030.03440.9010
Forest (Mod)12280.06190.21200.96590.02770.06190.09810.04500.8781
Logit Reg12280.05290.20000.95800.03300.05290.10840.04000.8642
Forest (Dflt)12280.06110.22140.96070.3300.06110.11230.04900.8432
DT (Dflt)12280.07740.25640.85560.04690.07740.15600.06580.8118
DT (Mod)12280.07330.25540.87170.04900.07330.15810.06520.7988
*: Champion Model, Dflt: Default, Mod: Modified.

